How Cable News Reshaped Local Government$ - American ...
←
→
Page content transcription
If your browser does not render page correctly, please read the page content below
How Cable News Reshaped Local GovernmentI
                                  Sergio Galletta† , Elliott Ash†
                                             †
                                                 ETH Zürich

Abstract

Partisan cable news broadcasts have a causal effect on the size and composition of bud-
gets in U.S. localities. Utilizing channel positioning as an instrument for viewership,
we show that exposure to the conservative Fox News Channel shrinks local government
budgets, while liberal MSNBC enlarges them. Revenue changes are driven by shifts in
property taxes, a key tool for local redistributive policy. Expenditure changes are driven
by public hospital expenditures, an important discretionary public good provided by lo-
cal governments. We also find evidence that Fox exposure increased privatization (while
MSNBC decreased it). An analysis of mechanisms suggests that the results are driven by
changes in voter preferences, but not by changes in partisan control of city governments.

  I
     We are grateful to Stefano DellaVigna, Mirko Draca, Ruben Durante, Tore Ellingsen, Benny Geys,
Massimo Morelli, Suresh Naidu, Giovanni Pica, Carlo Schwarz, Alex Stremitzer, and Alois Stutzer
for helpful suggestions. We have also benefited from comments by participants at the "Causes and
Consequences of Populism workshop" in Bocconi (Milan), "Workshop on Political Economy" at the
IEB (Barcelona), "Swiss Workshop on Local Public Finance" (Lugano), "Petralia workshop" (Petralia),
EEA-ESEM conference (Manchester) and seminars at the University of Lugano, ETH Zürich and IAE-
CSIC (Barcelona). We are grateful to Christian Dippel for sharing his data on city elections and to Greg
Martin for sharing data on Nielsen ratings. David Cai, Romina Jafarian, Selina Lorusso, and Matteo
Pinna provided excellent research assistance. This version: September 2019 (First version: April 2019)
   ∗
     Corresponding author: Sergio Galletta.
     Email addresses: galletta@kof.ethz.ch (Sergio Galletta), ashe@ethz.ch (Elliott Ash)

                                                     1
1. Introduction

   An extensive empirical literature has documented that greater exposure to partisan
television news can influence voting. This effect has been observed when looking at
U.S. presidential elections (DellaVigna and Kaplan, 2007; Martin and Yurukoglu, 2017),
as well as elections in Italy (Barone et al., 2015) and Russia (Enikolopov et al., 2011).
But little evidence is available on whether these voting shifts are also associated with
concrete shifts in enacted public policies (see Clinton and Enamorado, 2014; Arceneaux
et al., 2016). The main studies highlighting effects of media on policies look at changes
in messaging technology, rather than the political bias of messaging to which citizens
are exposed (Besley and Burgess, 2002; Strömberg, 2004; Gavazza et al., 2018; Ellingsen
and Hernæs, 2018).
   The goal of this paper is to provide some new insights on how exposure to partisan
media influences policy outcomes, in the context of local fiscal policies in the United
States. The analysis uses detailed information on county and city government finances,
paired with data on cable news viewership at the county level. We concentrate our
attention on two national news channels which are commonly perceived to be biased
towards opposing sides: the conservative Fox News Channel and the liberal MSNBC.
   Our hypothesis is that in areas where there is a relatively higher viewership for Fox
News Channel compared to MSNBC, local governments will pursue more conservative
policies. Conversely: in areas where there is a relatively higher viewership for MSNBC
compared to Fox News Channel, local governments will pursue more liberal policies.
Since these channels pay attention to national rather than local politics, the null hy-
pothesis would be that they have no effect.
   In the empirical analysis, the use of an OLS model where fiscal outcomes are re-
gressed on news channels’ viewership would provide biased estimates. There would be
endogeneity issues due to both omitted variable bias and reverse causation – namely, in
localities that are historically more conservative, fiscal policies will be more conservative
and Fox News will be more popular (and vice versa for MSNBC). To confront this prob-
lem, we follow Martin and Yurukoglu’s (2017) and exploit the quasi-random variation in
channel positioning across counties. Due to historical channel placement, there are wide
differences in channel ordering across media markets. For instance, Fox News is located
in different positions, sometimes in the low 20s, and sometimes closer to 100. This is
also true for MSNBC. Therefore, because channel surfers generally start at channel 1

                                              2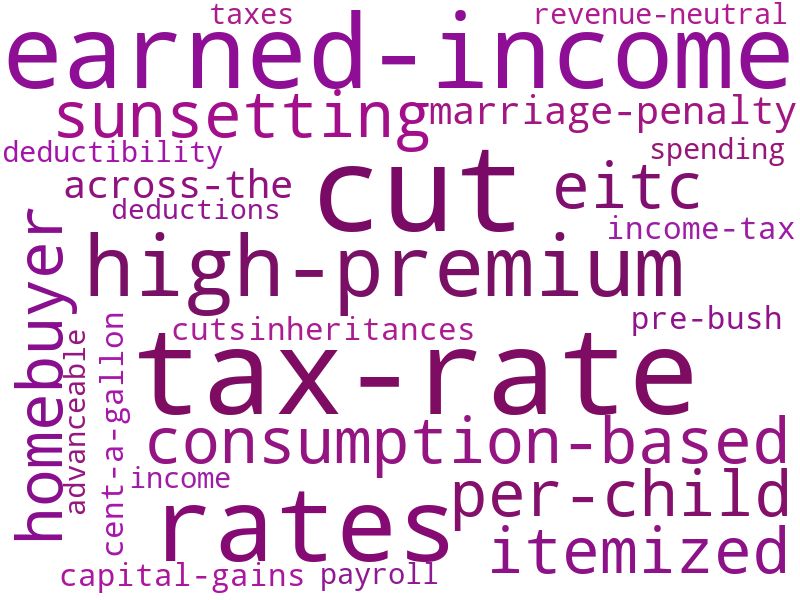
and click upward until they find something they like, the position of a news channel can
have a big influence on whether people watch it. We confirm this argument by showing
a strong correlation between the average news channel lineup position and its ratings at
the county level.
       To isolate exposure to conservative vs. liberal slant, we focus on the difference in
ratings between Fox News and MSNBC. In our first stage, the ratings difference is sig-
nificantly correlated with the difference in positions in the lineup. Importantly for our
identification, we document that our instrument is not related to pre-existing markers
for conservative/liberal politics, such as past fiscal policies (in trends or levels) or histor-
ical Republican vote shares. Further, the instrument is uncorrelated with pre-existing
demographic characteristics that are predictive of fiscal policy.
       We use the prediction from the first stage to estimate local average treatment effects
(LATEs) of exposure to biased news channels on local government financing in a two-
stage least squares framework. We find that an exogenous increase in Fox News exposure
is associated with more conservative fiscal policies – specifically, a decrease in both
revenues and expenditures per capita. Conversely, an exogenous increase in MSNBC
exposure expands revenues and expenditures.1
       The effect is economically significant. A hypothetical one standard deviation (S.D.)
increase in the channel differential between Fox News and MSNBC would reduce revenue
by 1.4% and expenditure by 0.7%. To put it differently, if 10% of Fox viewers changed to
MSNBC, revenues would increase by 2.7%. On a back-of-the-envelope calculation, this
would imply a $103 per capita increase in annual taxes.
       The reduction in revenues is mainly driven by a significant decrease in real property
taxation, the main component of local tax revenues. We also see significant decreases
in charges (fees for government services), which may reflect lower government service
provision or privatization. The decline in expenditures is driven by a decrease in public
goods expenditures, especially spending on local public hospitals. These results are
robust to the inclusion of controls for demographics, for other aspects of fiscal policy, and
for the positioning/ratings of CNN (the other important cable news network). Additional
evidence of privatization is that we see an increase in the number of private security firms

   1
    We find qualitatively similar results in a fixed-effects specification based on DellaVigna and Kaplan
(2007) that compares changes in fiscal policy to changes in the population share exposed to partisan
news channels (Appendix Tables A.11 and A.12).

                                                   3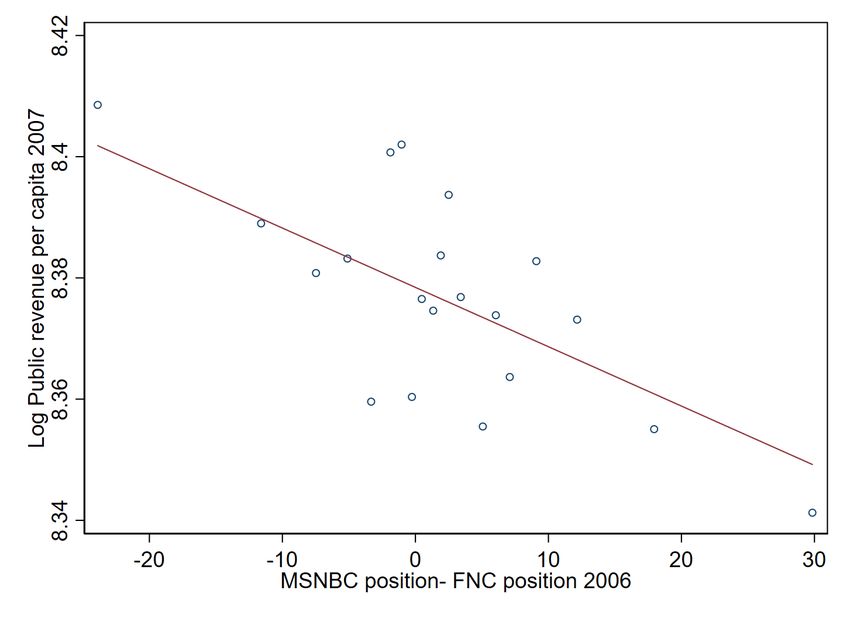
and private schools in response to higher Fox News exposure.
   There are two basic mechanisms that can explain our findings. First, biased news
might change vote shares in local partisan elections and select for more Republican or
Democrat officials. This would in turn lead to changes in local policies. We use a
sample of local mayoral elections and show that national news channels do not affect
the probability of a party running candidates, nor of winning these elections. Therefore
we can rule out candidate selection due to local partisan politics as a mechanism for our
findings.
   The second basic mechanism is that national news might work not through party
politics, but through shifting local preferences and changing policies regardless of the
party in power. Using data on ballot referendums in Texas we show that higher Fox
News exposure relative to MSNBC increases the shares of voters in favor of fiscally
conservative positions. This evidence supports the voter-preferences channel.
   Further support of this mechanism is that our main effects are larger in municipalities
than counties or special districts. Municipalities tend to be run by relatively more demo-
cratic institutions that are more responsive to changes in voters preferences. Counties
and special districts tend to be less democratic and more bureaucratic, insulated from
voter preference shifts. That we see no effect under more bureaucratic institutions tends
to rule out the possibility that our results are due to a direct effect of cable news on
policymakers’ preferences.
   To summarize: we can establish that political ideology in media is an important
causal factor in driving choices on local redistributive policies. This is some of the best
evidence, relative to existing literature, for a causal effect of partisan media on policy
outputs. While the previous literature has shown effects on voters (DellaVigna and
Kaplan, 2007; Martin and Yurukoglu, 2017) and on legislators (Clinton and Enamorado,
2014; Arceneaux et al., 2016), there isn’t much evidence on the resulting policies, and
none on a local level. In addition, ours is the first paper on partisan media to show an
effect for the liberal network (MSNBC) as well as the conservative network (Fox News).
   What potentially makes these results more surprising is that the national news chan-
nels are focusing on national politics, rather than local politics. The viewers in these
localities are learning about (and hearing opinions about) the actions of the federal gov-
ernment, yet that information and those opinions are applied to local policies and causally
shift them in the intended ideological direction. Therefore we have better evidence of a
durable change in political attitudes, compared to the previous papers showing changes

                                            4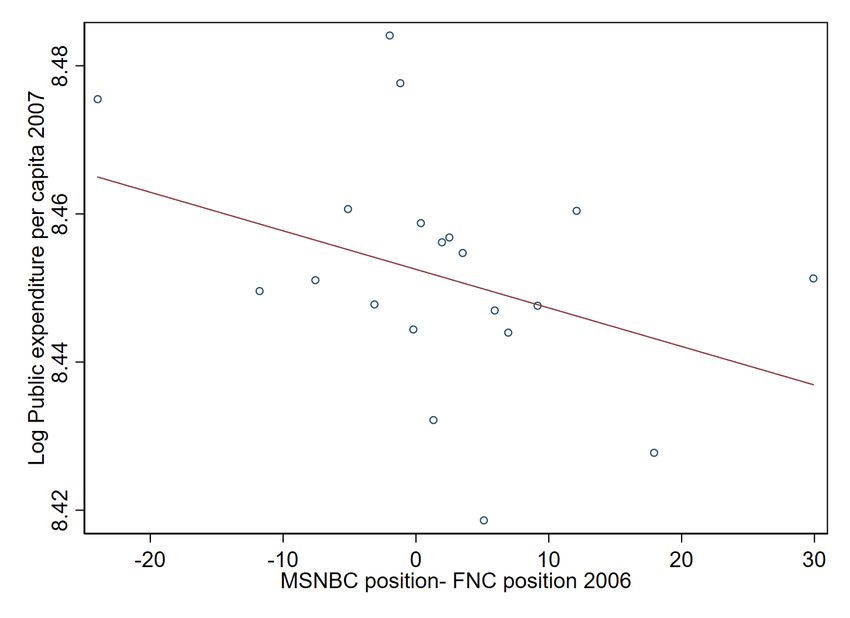
along the margins explicitly recommended by media messaging. In particular, the fact
that we don’t see changes in local party influence suggests a change in policy preferences,
rather than partisan loyalty. These media outlets are having a more deep-seated impact
than what the previous literature had suggested.
       More generally, this paper builds a bridge between the literatures on media politics
and public finance. To begin, a number of studies have looked at political impacts of
the quantity of newspaper coverage. Studying U.S. newspapers, Gentzkow et al. (2011)
show that higher media coverage due to random variation in overlap between newspaper
markets and congressional districts positively influence voters’ turnout in presidential
and congressional elections. Snyder Jr and Strömberg (2010) show that this variation
affects the behavior of congressmen while in office. At the local level, Gao et al. (2019)
show in the cross section that municipal borrowing costs are higher in areas where local
newspapers have closed down. In the case of India, Besley and Burgess (2002) show
that local governments are more responsive to disaster relief in areas with a higher
newspaper circulation. Drago et al. (2014) provide evidence from Italy suggesting that
entry of newspapers positively affects turnout in municipal elections and the efficiency
of the municipal government.
       Another strand of papers has analyzed the history of radio, television, and internet.
Strömberg (2004) finds that New Deal programs were substantially larger in U.S. counties
with a higher share of population with access to radio. Gentzkow (2006) shows a decrease
in voter turnout after the introduction of television in the 1950s, while Campante and
Hojman (2013) find an associated reduction in the polarization of congressional votes as
measured by DW-NOMINATE. Durante et al. (2019) suggests that differential exposure
to entertainment programs in Italy made some people more amenable to the political
messaging of populist parties. Moving to cable TV, Ellingsen and Hernæs (2018) show
that higher cable penetration in Norway significantly reduced turnout in municipal elec-
tions and also reduced public spending (while increasing the share spent on education).
Most recently, Gavazza et al. (2018) suggest that local-government expenditures (and
taxes) are lower in areas with greater internet penetration.2
       A closer set of papers have established effects of partisan media on voters’ behavior,
with a focus on Fox News Channel in the United States. Using a diff-in-diff strategy,

   2
   An emerging literature has begun to analyze how social media contributes to political polarization
(Boxell et al., 2017; Allcott and Gentzkow, 2017).

                                                 5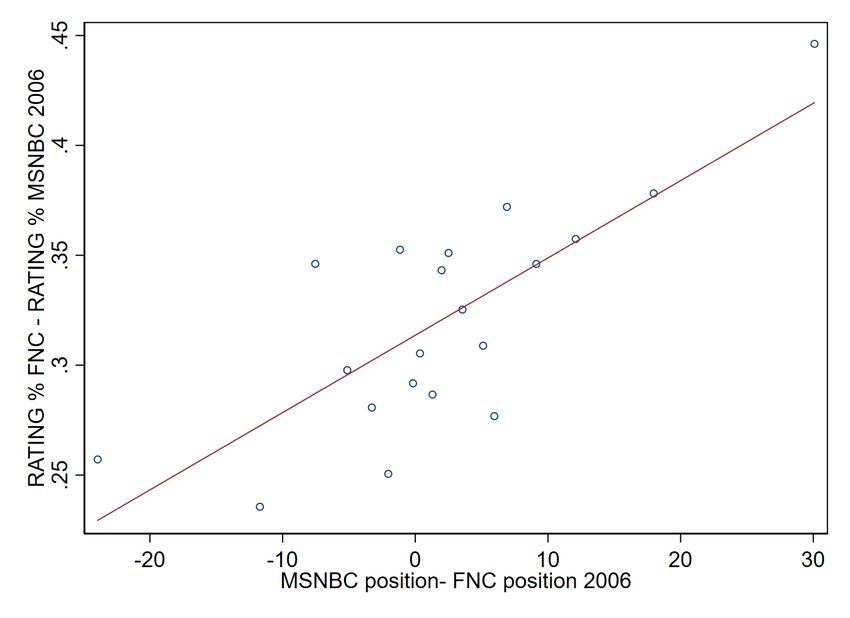
DellaVigna and Kaplan (2007) show that the introduction of Fox News in the U.S. cable
market had a positive effect on both turnout and vote share for Republicans in the
2000 Presidential election.3 This result has been replicated in an instrumental variables
framework and extended to later elections by Martin and Yurukoglu (2017). Schroeder
and Stone (2015) show that exposure to Fox News is associated with greater knowledge
about political issues that tend to favor Republicans.
      The closest papers to this one have compared changes in Fox availability across con-
gressional districts and changes in congressman position-taking as expressed in roll call
votes. Using data from 35 states, Clinton and Enamorado (2014) show that congressmen
from districts that adopted Fox News early tended to vote against the position favored
by President Clinton in the 1999-2000 session (but not the 1997-1998 session). Arce-
neaux et al. (2016) re-analyze this dataset and find that Fox’s diff-in-diff effect occurs
only for congressmen whose districts have substantial Republican vote share, and only
for roll calls in close proximity to an election. The research design in these papers does
not permit confident conclusions about whether these shifts were pivotal for policy, in
the sense that Fox caused some bills to be enacted or not.
      Beyond the literature on media, our paper contributes to the work on the determi-
nants of local fiscal policies. Pettersson-Lidbom (2008) shows that mayor partisanship
influences local expenditures and revenues in the Swedish context, while Ferreira and
Gyourko (2009) find no effect for U.S. localities (see also Dippel, 2019). Looking to
institutional factors, Coate and Knight (2011) find that spending is lower when mayor
and city council are both elected by voters, compared to when an elected city council
selects a manager. Hinnerich and Pettersson-Lidbom (2014) provides further evidence
on how institutions shape fiscal polices as they find that Swedish municipalities with
town meetings spend 40–60 percent less on public welfare than municipalities with city
councils (see also Galletta, 2018).
      The stage has now been set for the following sections. Section 2 provides background
information and describes the data. Section 3 presents the empirical strategy. Section 4
reports the main results, while Section 5 provides checks on the mechanisms. Section 6
concludes.

  3
      Hopkins et al. (2014) obtain similar findings in surveys asking about vote intentions.

                                                     6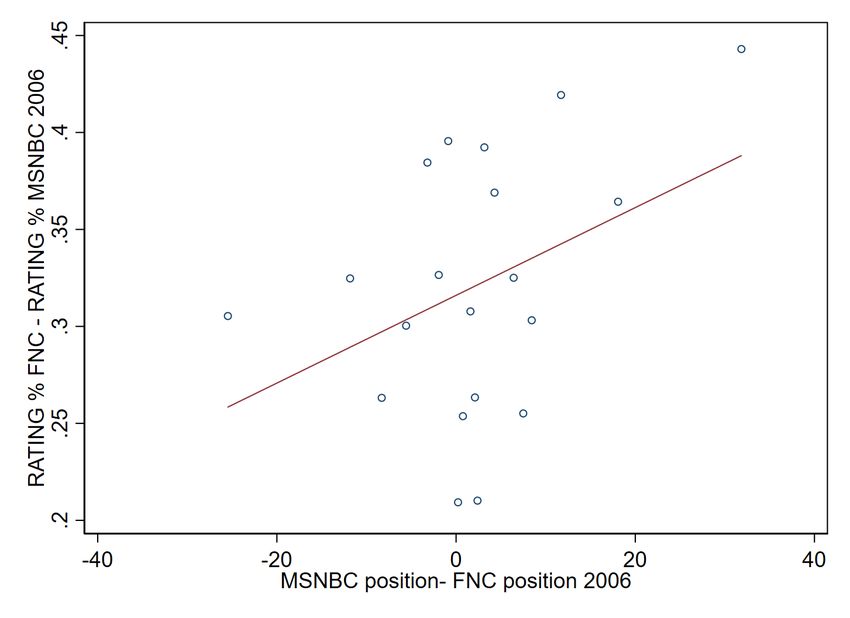
2. Background and Data

2.1. Cable news in the U.S.
       There are three main competitors in the U.S. cable news market: CNN, introduced in
1980, Fox News Channel (FNC), and MSNBC (both introduced in 1996). Each channel
provides program schedules and content that are the same nationwide, but their avail-
ability has varied across localities. This is due to the geographically fragmented market
of cable providers.4 Most of the time, national media producers have to reach separate
agreements with local cable companies in order to make their channel available to the
final users. As these procedures might start, and also end, at different times depend-
ing on the area of interest, it occurred that channel accessibility varied significantly by
localities and time (DellaVigna and Kaplan, 2007).5
       Similarly, the lineup positions assigned to each channel crucially depended on the
time in which it joined the system, as new channels were most of the time positioned
sequentially. It was also common for local cable providers to put channel with a similar
genre into adjacent or very close positions.6 Moreover, channel positions are generally
stable over time with the rationale that changes might confuse customers. Therefore,
the numerical order of the channels varies depending on the cable system considered.
Martin and Yurukoglu (2017) provide detailed evidence that confirm the overall process
by which channel positions are assigned.
       The conventional wisdom that FNC is a politically conservative force has been borne
out by empirical research in economics. DellaVigna and Kaplan (2007) show that in
towns where FNC was introduced in the late 1990s, Republicans received more votes in
the 2000 presidential election compared to towns where FNC had not been introduced.
Martin and Yurukoglu (2017) replicated and extended this finding to later years, showing
that higher FNC viewership increased the presidential vote share for republicans in 2004
and 2008. The authors provide also some limited evidence on the negative effect of

   4
     In the United States, both cable and local broadcast stations are privately owned, and in general
there may be just one publicly owned channel in a market.
   5
     For instance, FNC had its first big agreement with TCI (https://www.nytimes.com/1996/06/25/
business/the-media-business-tci-reaches-deal-with-fox-to-carry-all-news-channel.
html).           Differently,    MSNBC        started   by   replacing    a    former   NBC      chan-
nel,           America’s          Talking          (https://www.nytimes.com/1996/06/03/business/
bitterness-and-posturing-as-rivalries-resurface-in-fight-for-cablenews.html).
   6
     Other variation to the channel lineup could occur if channel capacity expanded or some channel
went out of business.

                                                  7
MSNBC viewership on Republican votes.
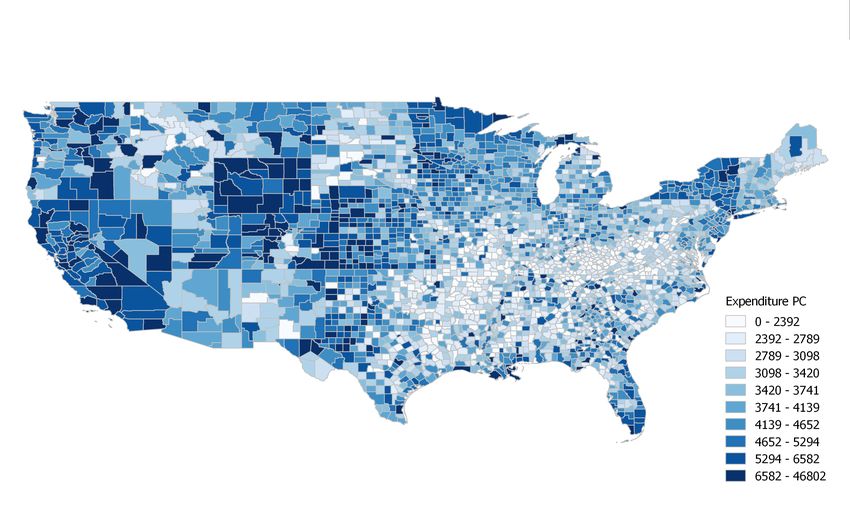
To understand better the potential language differences when addressing issues re-
lated with the public budget, we trained word embeddings on the transcripts for each
of the three major cable networks, obtained from Lexis.7 Using the trained model, we
computed the most similar words to "tax" for each network. We then scored each term
by the similarity for each network, relative to the similarities in the other two networks.
Word clouds illustrating these weights are reported in Figure 1 Panels (a) and (b). We
can see that on MSNBC (Panel a), there are issues related to progressive taxation: "pro-
gressivity", "wealthy", and "high-income". There are complaints about "give-aways"
(presumably to rent-seeking corporations) and "budget-busting" austerity policies. On
the other hand, Fox speakers complained about the redistributive earned income tax
credit (EITC),8 and about tax rights.
In addition, Figure 1 Panel (c) displays how frequently the phrase "public service"
is mentioned compared to "tax" in the two networks from 1999 through 2007. Overall
it seems that MSNBC is generally more likely to talk about public services than FNC,
and interestingly this dynamic has strengthened over time.
There is already some cross-sectional evidence that this messaging might have an
impact on the fiscal policy views of Fox News viewers. An October 2018 survey, in par-
ticular, compared Fox-viewing Republicans to non-Fox-viewing Republicans on a range
of attitudes.9 They found that the policy where Fox Republicans diverged the most was
in their strong opposition to a wealth tax on assets greater than $100 million. This
speaks to conservative (anti-redistribution) views among this group (although it would
at least partly be driven by selection).
To measure FNC and MSNBC channels’ position and ratings, we use the same data
as Martin and Yurukoglu (2017). Information about the channel positions are based on
the Nielsen FOCUS database which provides the channel lineup for all the U.S. broad-
cast systems and the served locations at the zip code level. Our measure of television
viewership is also provided by Nielsen and includes the share of individuals tuned in to
each channel by zip code, for the years 2005 through 2008. Because fiscal data are not
7
We used the Word2Vec implementation in the Python package gensim, with 300 dimensions and
window size 5.
8
For example, "IRS paid more than $110 billion in improper tax credits" (May 24, 2016).
9
John Ray, "The Fox New Bubble," available at www.dataforprogress.org/blog/2019/3/23/
the-fox-news-bubble.
8zip-code-specific, we aggregate ratings and channel position values at the county level.
Specifically, we create county average channel positions weighting the observations by the
number of TV-watching households in the zip code as estimated by Nielsen. Similarly, we
weight ratings by the number of survey individuals in the zip code according to Nielsen.
Note that our sample consists of 2334 counties in which both FNC and MSNBC are
accessible by at least one zip code in the year 2006. Table A.1 in the Appendix reports
the summary statistics of the just described variables for the year 2006.
2.2. Local fiscal policy
In the United States, levels of revenue and expenditure vary across local governments
(see Figure A.1 in the Appendix). Each locality has its own mix of sources of revenue and
categories of spending, which depend on the specific structure of taxes and expenditure
programs. There are five types of local government: counties, municipalities, townships,
special districts (e.g., water supply and electric power), and school districts. These
entities generate revenue mainly through taxes on property and fiscal transfers from
upper levels of government, while expenditure is for the main part devoted to education
and health, as well as transportation and public safety (i.e., police and correctional
facilities).
We use information that comes from the local government finances census. This
is a survey of all local governments administered every five years starting from 1972.
Overall, local governments account for 30% of total government spending and 10.5%
of GDP. Table A.2 in the Appendix provides insights on the composition of both the
revenue and spending side of the local budget. These measures represent the sum of
the amounts reported in the annual budget by each local government located in a given
county. By using these aggregate measures, we abstract from two levels of heterogeneity
(and potential sources of measurement error) that apply when studying state and local
governments in the United States. First, there is heterogeneity in the assignment of
public tasks. For instance, it could be that in certain areas specific public services are
provided by the county governments, while in others the same public services are assigned
to township governments. Second, in each local government the institutional structure
of decision-making process can be different. For instance, there are cities where the
mayor is elected directly by voters, while in others there is a city council that selects a
professional administrator.
Given that the information on cable news exposure is available for the period 2005-
92008, we use as outcome variables budget components for the year 2007, and include the
1997 values as control.
2.3. Additional data sources
To supplement data on media exposure and fiscal policy, we collected demographic
controls from the 2000 U.S. decennial census. They include the general demographic
and economic composition of each county such as: race, gender, age, income, income
inequality, education, urban/rural and sector of occupation (summary statistics in Table
A.1 in the Appendix). We also have the Republican presidential share of the county in
1996. Moreover, we collect data for statewide ballot measures in Texas from the Secretary
of State website.10 Data on the number of firms by county are from the County Business
Patterns (CBP) dataset. Finally, data on mayoral elections comes from Ferreira and
Gyourko (2009) and Dippel (2019) (summary statistics in Appendix Table A.3).
3. Estimation Strategy
This section describes our empirical strategy. We are interested in the relationship
between biased cable news viewership and local budgets. Given the data at our disposal,
we conduct a cross-sectional analysis that focuses on the 2007 local budget and 2006
ratings for FNC and MSNBC. We account for a one-year lag between these two measures
because fiscal decisions are usually approved during the previous year.11
The standard approach to our research question would be to estimate the following
linear regression for county i in state s:
Yis = α + γs + ρVi + βXi + is (1)
where Yis is a 2007 local fiscal policy variable, notably log revenue collections per capita
or log expenditures per capita.12 Vi is the main regressor, which is operationalized as the
difference between FNC and MSNBC viewership (ratings) in 2006. Importantly, using
the difference in TV consumption (rather than one or the other network individually)
10
https://elections.sos.state.tx.us/index.htm
11
In unreported estimates we consider the average ratings of the years 2005, 2006 and 2007 as a main
regressor. The results using this approach are similar to that used here.
12
To allow for zeros when looking at specific categories of expenditure and revenue, our outcomes are
transformed as Y = log(1 + F/P ) where F is the nominal dollar value (revenues or expenditures) and
P is population. Results were not sensitive to alternative transformations.
10captures better the relative exposure to conservative vs. liberal slant in a given area.
For completeness, we report in the Appendix Tables A.4 and A.5 the effect of FNC and
MSNBC separately using a specification that is closer to the one proposed by Martin
and Yurukoglu (2017) (i.e., we instrument viewership of one channel controlling for the
other channel position and viewership).
Xi includes covariates, namely, demographic controls, pre-treatment fiscal policy
choices (i.e., Yis from 1997), and pre-treatment political preferences, while γs are state
fixed effects. The error term εis includes unobservable factors and randomness, while ρ
gives the effect of interest. The same equation can be applied to all components of the
budget.
Inferring causality from OLS estimates requires strong assumptions about the ab-
sence of omitted confounders. In particular, historically more conservative (liberal) areas
might have more conservative (liberal) policies as well as higher popularity of Fox News
(MSNBC). Thus, to provide causal estimates we follow Martin and Yurukoglu (2017)
and instrument the endogenous regressor using channels’ position in the system lineup.
We define the first-stage equation as:
Vis = α + γs + γZi + βXi + ηis (2)
where in addition to the previously defined elements we now also have Zi , which is
the 2006 difference between MSNBC and FNC channel position in the system lineup in
county i. Finally, the second-stage equation is:
Yis = α + γs + δ V̂i + βXi + ηi (3)
where V̂i are the fitted values from equation (2).
The key identifying assumption of our strategy is that the distance between channel
position of MSNBC and FNC is orthogonal with respect to counties’ preferences for
fiscal policies. Martin and Yurukoglu (2017) provide a lengthy discussion and set of
checks along these lines. In particular, they emphasize that channel positions have an
important arbitrary/historical component, with significant inertia and path dependence.
This implies that television companies have a limited role in affecting the channel position
and adapting it to local conditions.
In Section 4.3 we provide a number of checks to test the identification assumption.
11We show that in our data the instrument is not related to pre-treatment (before 1996)
local fiscal policies nor to demographic characteristics predicting fiscal policies and news
channel viewership. In addition, the instrument is not correlated with past Republican
vote shares.
We provide initial evidence of instrumental relevance in Figure 2 Panel A which shows
graphically the first stage relationship. There is a clear uptrend, with higher ratings for
FNC compared to MSNBC when there is a higher difference between channel numbers
(i.e., FNC is in a lower position compared to MSNBC). Regression Table 1 in Section 4
gives the F-statistics of the excluded instruments for each regression; the relationship is
strong and stable with and without the inclusion of controls.
Under exogeneity, two-stage least squares procures consistent estimates for ρ if the
instrument satisfies an exclusion restriction and monotonicity. That is, the channel
position affects budget decisions only through its effect on cable news viewership, and
the channel never has a reverse effect. We feel these assumptions are reasonable in this
context.
Standard errors are adjusted for clustering at the state level to account for correlation
in the error terms of counties belonging to the same state. Regression estimates are
weighted by county population in light of large heterogeneity in population and our
interest in per capita impacts. To facilitate the interpretation of the coefficients, we
standardized the instrument and the endogenous variable by dividing the original values
by the respective standard deviations.
For completeness we also estimated a fixed-effects model based on DellaVigna and
Kaplan (2007). Details on the specification, and associated results, are reported in
Appendix A.2. The model compares changes in county fiscal policy to changes in the
population share exposed to partisan news through channel availability, conditional on
county fixed effects and state-year fixed effects. The identification assumption for these
regressions is the absence of time-varying confounders (parallel trends). The fixed-effects
analysis produces similar results to the instrumental-variables analysis.
4. Results
In this section, we begin our presentation of the results by reporting evidence about
the effect of partisan news on local public revenues and expenditures. Next we provide
identification checks.
124.1. Effects on revenues
First we look at local governments’ revenues. Panel A of Table 1 reports the base-
line results. There is zero effect of cable news on local fiscal policies in OLS (Column
1-2). The first stage (Columns 3-4) confirms that the instrument is sufficiently strong
both with and without the inclusion of demographic controls. The size of the coeffi-
cient increases from 0.056 to 0.088 once controls are included. As seen in Column 6,
there is a negative and significant effect in the reduced form of channel position, sug-
gesting that relatively lower (higher) channel position for conservative (liberal) media
reduces (increases) revenues.13 In the reduced form, the coefficient remains substantially
unchanged after the introduction of demographics as control.
Table 2 reports the results of the 2SLS estimates, for a variety of specifications.
We confirm a negative and significant effect on revenues for all the specifications when
looking at total revenue (columns 1 to 3). The inclusion of additional controls, which
are likely to be correlated with fiscal policy, reduces the size of the coefficient. Once the
full set of controls is included, the coefficient of interest is equal to -0.160 (s.e.=0.056)
and statistically significant at the 0.1% level.14 On this estimate, one S.D. increase in
the difference between FNC and MSNBC ratings would decrease revenue by 16%. This
seems like a large effect, but this variation in ratings is unlikely to occur in practice. For
example, we know from the first-stage that a one S.D. increase in the instrument (i.e.,
around 14 positions) would increase viewership by about 10% of its standard deviation.
Therefore, one can look at the reduced form effect as a more conservative interpretation
of the results: a one S.D. increase in the instrument would decrease revenue by 1.4%.
Another way of interpreting the magnitudes is to say that, if 10% of Fox viewers changed
to MSNBC in the average county, revenues would increase by 2.7%. A back-of-the-
envelope calculation implies a $103 per capita increase in annual taxes.
This is a local average treatment effect and therefore identified by those counties
13
In unreported analysis, we estimate the reduced form coefficients for each of the fifty top-rated
channels in the data separately. Fox News had the second-largest negative effect on revenue among
all channels after Nickelodeon, followed by A&E, ABC Family, Disney Channel, and Cartoon Network.
MSNBC had the third-largest positive effect on revenue among all channels after ESPN and Food
Network, followed by Discovery, Lifetime, and the Outdoor Channel. Our results hold when including
five principal components from the matrix of channel positions for all other cable networks.
14
In unreported analysis we find that including as a control variable the difference in the number of
years since FNC and MSNBC have been introduced in a county does not affect our results. This is true
for different definition of years of exposure. We use three different definitions considering the number of
years since, alternatively, at least 25%, 50% and 75% of the population had access to FNC and MSNBC.
13where ratings are particularly influenced by the difference in channel position (i.e., com-
pliers). Such counties are likely composed of individuals with relatively weak prede-
termined political preferences. This possibly explains the difference between the 2SLS
results and the OLS estimate of zero reported in Column 2 of Panel A of Table 1. OLS
equally weights observations.
What revenue components are driving this effect? We can see that the main result
is mostly driven by a significant negative effect on property taxes (Column 4), which is
the largest source of local revenues. The property tax is also an important local wealth
tax, so a decrease in property taxes can be understood as a regressive policy favoring
those with relatively high real property wealth.15
Additional effects are present when focusing on license taxes (Column 5) and charges
(Column 7). The effect on charges is interesting because these are generally fees for
government services.16 A decrease in charges is consistent with lower government service
provision, which is a key policy interest for small-government conservatives. Decreased
charges could mean that these services are no longer provided, or that they have been
privatized. We provide evidence coherent with this argument in section 5.4.
Column 6 shows that there is no effect on sales tax. This is intuitive because sales tax
rates are set primarily at the state level with little discretion for localities to change it.
In addition, it means cable news messaging is not significantly affecting the local retail
market. In Column 8 we show that there is no effect on intergovernmental revenues from
state government. Therefore these reductions in expenditures are not being compensated
by revenues from state government, and do not seem to be correlated with some change
in intergovernmental political processes.
Finally, Appendix Table A.4 reports the results by looking at FNC and MSNBC
separately. Overall, the sign of the coefficients are consistent with the results of the
main regressions. FNC has a negative and significant effect on total revenue, while
MSNBC has a positive and also significant effect on total revenue. The effect of FNC
seems to be driven by a reduction in charges, while MSNBC by an increase on taxes.
15
It is worth noting that our time period (2006-2007) is in the run-up to the housing bubble and hous-
ing crisis of 20008-2009. So the external validity of the effects on property taxes should be interpreted
in that light. We can show that our results are not driven by housing prices, for example by including
median housing value as a covariate.
16
We also perform regressions that use as dependent variable the share of local revenue devoted to
each component and we do not identify any significant effect (Appendix table A.6).
144.2. Effects on expenditures
Next we look at effects on expenditures. Panel B of Table 1 confirms the overall
results about the OLS, first-stage, and reduced form effects that we already mentioned
when focusing on revenues. Table 3 reports the 2SLS results. We see similar results to the
effect for revenue, although the magnitude is lower and the coefficients are significant at
the 10% rather than 0.1% level. In the preferred specification (Column 3), the coefficient
of interest suggests that more viewership for FNC, adjusted by MSNBC ratings, has a
causally negative effect on expenditures. To interpret the size of the effect: a one S.D.
increase in a viewership differential between FNC and MSNBC would decrease general
local expenditures by 8.5%, about half of the effect on revenues. Therefore, a one S.D.
increase in the instrument would decrease expenditure by nearly 0.7% (=0.085*0.087).17
Again we look at the components of the change. We have negative coefficients across
all categories. These effects are consistent with smaller government in response to con-
servative ideology. The effect is significant for spending in police and hospital. Hospital
and Police are important public goods provided by local governments.18 Interestingly,
we confirm an effect on hospitals when using as dependent variable the share of local
expenditure devoted to this category (of the total local budget, Appendix Table A.7).
When looking at results of FNC and MSNBC separately (Appendix Table A.5), the
sign of the coefficients for aggregate expenditure are consistent with the main results
(i.e., FNC has a negative and MSNBC a positive effect) but not statistically significant.
Yet, there are significant effects when looking at the dis-aggregated components of the
local budget. MSNBC has a positive and significant effect on education, hospital and
corrections, while FNC has a negative and significant effect on expenditure in policing.
17
In Appendix Table A.8 we report results on further relevant outcomes. First, we use as alternative
dependent variables the number of public employees and their total amount of salary both in per capita
term. In both cases we do not find any significant effects. We also do not find a significant effect if we
use as a dependent variable either local public debt per capita or a proxy for county-level GDP (total
wages paid by local establishments).
18
Is worth mentioning that only 743 counties have expenditure on hospital. If we estimate the model
using only this sample of counties the effect is smaller and not statistically significant at a conventional
level. However, we find a strong and significant effect if we replace the outcome variable and use instead
a dummy identifying the presence of spending in hospital (coeff=-0.915, st. err=0.344). This evidence
suggests that the results about hospital expenditure are mainly explained by an extensive margin effect.
154.3. Identification checks
In this section we provide a set of tests to support the validity of our estimation
approach. Specifically, we want to rule out the possibility that cable channel positions
are systematically correlated with contemporaneous or past local conditions which could
be related with local fiscal policies. We report these checks in Table 4.
First, we would like to assess whether the channel position is selected to demographics
in a way that would predict changes in ratings or outcomes. We produce the predicted
values – using as covariates demographics and state fixed effects – for ratings, expendi-
tures, and revenues, using OLS. We then regress this predicted value on channel position:
Columns 1 through 3 of panel A show that there is zero statistical relation. This ex-
cludes the possibility that the difference in channel position between MSNBC and FNC
is systematically related to relevant demographic characteristics.
Next, Columns 4 and 5 show that the difference in channel position is not correlated
with local fiscal conditions immediately prior to the start of treatment, such as expendi-
ture and revenue in 1992. Column 6 confirms that the instrument is not correlated with
previous political preferences in presidential elections.
Finally, to synthesize the evidence on confounding pre-trends, we ran the reduced-
form regressions using 2006 channel positions for difference in budget outcomes and
population at a ten-year interval from 1977 to 2007. These regression results are reported
in panel B of Table 4. It is reassuring that our instrument is not correlated with trends in
local fiscal policies before the entry of FNC and MSNBC in 1996.19 Interestingly, columns
3 and 6 confirm our main results using an alternative specification of the dependent
variable (i.e., using the 1997-to-2007 differences as outcomes, instead of 2007 level and
include 1997 as a control).
5. Mechanisms
In this section we seek to understand the mechanisms underlying our findings.
5.1. Effect on elections
One possibility is that partisan news influences local election results – that is, FNC
exposure makes electing a Republican mayor more likely, while MSNBC exposure will
19
We also find no correlation between the instrument and population changes both before and after
1996.
16make a Democrat mayor more likely. This change in partisan power would then affect
local policies. One reason to be skeptical of this hypothesis is the evidence in Ferreira and
Gyourko (2009), who find that fiscal policy in U.S. local governments is not influenced
by partisan affiliation of the mayor. Yet, Dippel (2019) presents results suggesting that
Democratic mayors might favor larger pension benefit for public employees. Here we ask
the complementary question of whether cable news affects partisan affiliation of elected
mayors.
To investigate this channel, we perform the analysis at the city level and merge the
data from Ferreira and Gyourko (2009) and Dippel (2019) with our data on cable news.
We end up with a sample of 680 city elections during the years 2005-2008 in which at
least one candidate is either Republican or Democrat.20
We estimate reduced-form regressions of candidates’ party and electoral results on
our instrument measured at the city level. Table 5 reports the results. In Column 1 we
use as a dependent variable a dummy on whether there is a Republican candidate, in
Column 2 a Democrat candidate, and in column 3 the electoral results identified by a
Republican candidate winning the election. Across specifications, we see that cable news
does not affect partisan outcomes in local elections.
5.2. Effect on preferences
A second mechanism besides party affiliation of city government is that cable news
exposure could influence citizen’s preferences for fiscal policies. These preferences would
then affect local budget policies regardless of which political party holds office. To
analyze this channel we look at a clean signal of voter preferences: voting on ballot
for fiscal policies.21 Specifically, we are considering legislatively referred constitutional
amendments.
For this analysis, we collect results on state-wide ballots for the 254 counties in the
state of Texas. Texas is the second largest state in the U.S. by both area and population
and also the one with the largest number of counties.22 We select those ballots taking
place in 2007 and 1997 that have clear fiscal consequences. Specifically, we consider three
20
Some cities had elections more than once in the period in analysis. The total number of cities
considered is 551.
21
Galletta (2018) uses a similar approach to study the effect of direct democratic institutions on fiscal
preferences in Switzerland.
22
We have executed a similar analysis for California, the most populated US state. Unfortunately,
given the reduced number of counties (52), the instrument was performing poorly.
17votes from 2007: Appraisal Values for Taxes – Proposition 3, Limitations on Municipal
Taxes – Proposition 5, and Tax Exemptions for Motor Vehicles – Proposition 6 ; and
three votes from 1997: Tax Valuations of Residence Homesteads – Proposition 2, Tax
Exemptions for Water Conservation – Proposition 3, Property Tax for Fire Prevention
– Proposition 9.
We use as an outcome the vote share for the fiscally conservative position (that is,
reducing taxes) on each of these ballots. This is the "yes" position on all ballots except
1997 Prop. 9. We estimate county-level two-stage least squares regressions including
all controls, so this is the same specification as Column 4 from Tables 2 and 3. Given
the sample is composed of counties belonging to the same state, we use robust standard
errors rather than clustering by state.23
Table 6 provides these results, where each column refers to a separate ballot vote.
For all three propositions from 2007, the results indicate that higher viewership of FNC
compared to MSNBC due to channel positioning is associated with higher vote share
for the conservative option (although the F-stat is somewhat low). However, when
looking at the 1997 ballots, the coefficients are either not significant, or if anything
show the opposite effect (Column 8). This is supportive of the view that cable news is
having a prospective causal effect on fiscal policy referendum votes, rather than channel
numbers being selected into areas with different pre-existing political views on fiscal
policy. Column (4) and (8) report results where we consider jointly ballots from the
same year. Not surprisingly, we have a positive effect for 2007 ballots, and no effect in
1997. Specifically, the coefficient from column (4), significant at the 1% level, implies
that a one S.D. increase in the difference in ratings would increase the share of voters in
favor of a reduction in taxes by 8 percentage points.24 Overall, this evidence supports
the idea that cable news affects fiscal policy through influencing voter preferences.
5.3. Results by type of government
To further validate the proposed mechanism, we study the presence of heterogeneous
effects depending on the level of influence that citizens can have on politicians’ behavior.
One should expect that changes in preferences will pass to fiscal policies when citizens
23
Because not all counties avail both FNC and MSNBC, and for some other counties covariates are
missing, the regressions are restricted to a sample of 130 counties.
24
In the reduced form we have that coeff=.0178 and st.err=0.006. Therefore, a one S.D. increase
in the instrument would increase the share of voters in favor of a reduction in taxes of 1.7 percentage
points.)
18have more control over policymakers, and that the effect will be marginal if budget
decisions are not sensitive to citizens’ requests.
While our main results are estimated using the aggregate fiscal decisions of multi-
ple types of government belonging to the same geographical area, here we conduct our
analysis by considering each type of government separately. We look at three types of
government: municipalities (including townships), counties, and school/special districts.
We would expect that if our effect goes through voter preferences, and the consequent
reaction of local officials, then there may be a larger effect for municipalities than coun-
ties and special districts. Municipalities are “closer to citizens” compared to counties and
this has been suggested to allow a better matching between enacted policies and resi-
dent preferences, as well as higher political accountability (Lockwood, 2002; Besley and
Coate, 2003; Persson and Tabellini, 2002). In addition, municipalities tend to be run by
relatively democratic institutions: city councils and mayors. Counties and school/special
districts tend to have less direct forms of governance, such as county commissions, and
are more administrative.25
Appendix Table A.9 reports results on revenue and Appendix Table A.10 on expen-
diture. For municipality revenues, we see quite similar effects to the aggregated results
reported previously. For county revenues, though, we see only insignificant estimates
and for school/special district we find a significant effect only for license taxes. The
story is similar for expenditures. Overall, the effects of cable news are mostly driven by
changes in budget decisions taken by municipalities, rather than counties. One inter-
esting additional result for this analysis is that there is a statistically negative effect on
education spending when looking at municipalities. Education is an important public
service provided by municipality governments, and conservative news tends to decrease
provision.
These heterogeneous effects by type of government are inconsistent with an alterna-
tive interpretation of our findings: that cable news is having a direct effect on policymak-
ers through their own news consumption. If there were this direct effect, we would see
the same effects in the less democratic forms of local government. Whether cable news
has a direct effect on the attitudes and policy decisions of policymakers is an interesting
25
The 2007 “Form of Government Survey” of the International City/County Management Associa-
tion (ICMA) find that more than 30% of counties are governed by a commission, while only 1% of
municipalities are. This varies somewhat across states.
19area for future research.
5.4. Evidence on privatization
As discussed in the previous sections, we have evidence of a decrease in charges (fees
for government services). In terms of expenditures, we saw a decrease in police, hospital
services, and education spending (in municipalities). These decreases in public service
provisions might be compensated by increases in private provision. In this section we
seek evidence on privatization.
We test this hypothesis using data from the 1998 and 2007 editions of the County
Business Patterns (CBP) dataset. This census dataset contains information on the
number of establishments by county and year, separately by NAICS industry code. Given
our main results, we focus on the sectors identifying Educational Services (NAICS 61),
Healthcare and Social Assistance (NAICS 62) and Security Guards and Patrol Services
(NAICS 561612).26
We take the log of the number of establishments by sector as our outcome. This
implies that we have in sample only counties that have at least one firm of a specific
sector. That is, we are looking at intensive-margin effects.
Table 7 reports the results. We replicate our previous estimation strategy, including
now the 1998 value of the dependent variable as control.27 The estimates suggest that
the reduced provision of public goods is potentially compensated by the private sector
through opening of new establishments. Education services increase (Column 1), consis-
tent with a move toward private schools from public schools. Health care establishments
increase in number (Column 2), consistent with the opening of private hospitals. Finally,
and largest in magnitude, there is an increase in the number of establishments in private
security, consistent with privatization of publish police forces. Meanwhile, Column 4
shows that the numbers of firms belonging to other sectors is not affected, meaning that
there is no effect of cable news on the economy at large.
26
NAICS 62 includes also public owned hospitals. Therefore, in light of our previous results (i.e., a
negative effect of our treatment on hospital expenditure), the estimate reported about Healthcare and
Social Assistance are to be considered downward-biased.
27
1998 is the earliest year of CBP with NAICS (rather than SIC) codes.
206. Conclusion
Political media affects polices. The evidence is consistent with a causal effect of
exposure to politicized news on local fiscal policies. In our context, Fox News served
to make local governments more fiscally conservative, while MSNBC served to make
them more fiscally liberal. This has resulted in substantial changes to revenues and
expenditures in these localities.
Regarding the potential mechanisms, our evidence suggests that the effect is more
likely to be driven by changes in individuals preferences for fiscal policies rather than
the consequence of an effect on political selection. Further, we show that there is a
substitution effect in service provision between the public and the private sector. In
future work, we will analyze whether these television effects are mitigated or amplified
by internet access or by local print media.
We cannot make strong claims about the welfare impacts of how media affects policy.
While we find that revenues and expenditures on public goods decrease (increase) in
response to conservative (liberal) news, they might have been inefficiently high (low) in
the first place. More work could be done to understand the incidence of these effects
across the income and wealth distributions. In addition, future work might attempt to
distinguish the short-term from longer-term effects of partisan media.
Still, this is some of the best evidence so far in the literature on whether media affects
policies. The previous work has shown effects on voters, and some less robust effects on
the actions of legislators. But this is the first paper to show that partisan media has
substantial effects on local policy outputs. We now have evidence for a concrete link
between political media and political action. That evidence could be useful for future
research and policy-making in this area.
21Figure 1: Language differences
(a) Words Associated with “Tax”, MSNBC (b) Words Associated with “Tax”, Fox News
(c) Relative Frequency "public service" Vs. "tax"
Notes:: Illustrations for cable news language. The word-clouds at the top show the words most associated with “tax”,
compute from a word2vec model, on MSNBC transcripts (a) and FNC transcripts (b). The graph at the bottom (c) reports
the relative frequency of the phrase "public service" compared to "tax" for MSNBC and FNC in the period 1999-2007.
22Figure 2: First Stage and Reduced Form
Panel A. First stage
(a) No controls (b) With controls
Panel B. Reduced Form
(a) Effect on 2007 Revenues (b) Effect on 2007 Expenditures
Notes: Binscatter diagrams for the first stage and the reduced form effect. Panel A displays first stage binscatters without
controls (a) and with controls (b). Panel B displays reduced form effect, when the full set of controls is included, of
Channel position (MSNBC - FNC) in 2006 on 2007 log revenues per capita (a) and on 2007 log expenditures per capita
(b).
23Table 1: Cable News and Fiscal Policy
OLS First stage Reduced Form
(1) (2) (3) (4) (5) (6)
Panel A. Impact on Revenue
Ratings (FNC - MSNBC) -0.007 -0.006
(0.006) (0.006)
Channel position (MSNBC - FNC) 0.056*** 0.088*** -0.013*** -0.014***
(0.015) (0.015) (0.003) (0.004)
F-stat 13.639 33.320
N observations 2334 2334 2334 2334 2334 2334
OLS First stage Reduced Form
(1) (2) (3) (4) (5) (6)
Panel B. Impact on Expenditure
Ratings (FNC - MSNBC) -0.008 -0.004
(0.006) (0.006)
Channel position (MSNBC - FNC) 0.059*** 0.087*** -0.009* -0.007+
(0.015) (0.015) (0.004) (0.004)
F-stat 16.034 33.074
N observations 2334 2334 2334 2334 2334 2334
State FE Yes Yes Yes Yes Yes Yes
Cable system controls Yes Yes Yes Yes Yes Yes
Dep. variable in 1997 Yes Yes Yes Yes Yes Yes
Additional controls No Yes No Yes No Yes
Notes: The dependent variable is the Log(Total revenue per capita) in 2007 in columns (1-2) and (5-6) of panel A and the Log(Total
expenditure per capita) in 2007 in columns (1-2) and (5-6) of panel B. In columns (3-4), the dependent variable is Ratings (FNC - MSNBC)
in 2006 in both panels. All estimates include as cable system controls: CNN position (2006), Ratings % CNN (2006), proportion of people
with access to CNN (2006), proportion of people with access to FNC (2006), proportion of people with access to MSNBC (2006). Further
controls include racial, gender, age, income, educational, occupational, urban/rural composition of the county and the share of vote for the
republican candidate in the 1996 presidential election. The observations are weighted by county population. Standard errors clustered at the
state level in parenthesis. + p < 0.1, * p < 0.05, ** p < 0.01 and *** p < 0.001.
24Table 2: Effects on Revenues
2SLS
Taxes Total State
Total Property License Sales Charges Transfers
(1) (2) (3) (4) (5) (6) (7) (8)
Ratings (FNC - MSNBC) -0.234*** -0.156*** -0.160*** -0.173* -0.606* -0.115 -0.342* -0.054
(0.089) (0.054) (0.056) (0.078) (0.235) (0.296) (0.166) (0.050)
F-test 13.639 28.504 33.320 32.880 32.086 33.684 33.027 32.712
25
N observations 2334 2334 2334 2334 2334 2334 2334 2334
State FE Yes Yes Yes Yes Yes Yes Yes Yes
Cable system controls Yes Yes Yes Yes Yes Yes Yes Yes
Dep. variable in 1997 Yes Yes Yes Yes Yes Yes Yes Yes
Demographic controls No Yes Yes Yes Yes Yes Yes Yes
Republican vote shares in 1996 No No Yes Yes Yes Yes Yes Yes
Notes: The dependent variable is the Log(Total revenue per capita) in 2007 in columns (1) to (3), and the Log(revenue per capita) in 2007 for each of the sources listed
in the column head in columns from (4) to (8). Ratings (FNC - MSNBC) is instrumented by Channel position (MSNBC - FNC). All estimates include as cable system
controls: CNN position (2006), Ratings % CNN (2006), proportion of people with access to CNN (2006), proportion of people with access to FNC (2006), proportion of
people with access to MSNBC (2006). Demographic controls include racial, gender, age, income, educational, occupational and urban/rural composition of the county.
The observations are weighted by county population. Standard errors clustered at the state level in parenthesis. + p < 0.1, * p < 0.05, ** p < 0.01. and *** p < 0.001.You can also read