Orographic and convective gravity waves above the Alps and Andes Mountains during GPS radio occultation events - a case study - Atmos. Meas. Tech
←
→
Page content transcription
If your browser does not render page correctly, please read the page content below
Atmos. Meas. Tech., 11, 3523–3539, 2018
https://doi.org/10.5194/amt-11-3523-2018
© Author(s) 2018. This work is distributed under
the Creative Commons Attribution 4.0 License.

Orographic and convective gravity waves above the Alps and Andes
Mountains during GPS radio occultation events – a case study
Rodrigo Hierro1 , Andrea K. Steiner2,3 , Alejandro de la Torre1 , Peter Alexander4 , Pablo Llamedo1 , and
Pablo Cremades5
1 Facultad  de Ingeniería, Universidad Austral and CONICET, Pilar, Provincia de Buenos Aires B1629ODT, Argentina
2 Wegener    Center for Climate and Global Change (WEGC), University of Graz, Graz, Austria
3 Institute for Geophysics, Astrophysics, and Meteorology/Institute of Physics, University of Graz, Graz, Austria
4 IFIBA, CONICET, Ciudad Universitaria, Buenos Aires, Argentina
5 Facultad de Ciencias Exactas y Naturales, Universidad Nacional de Cuyo, Mendoza, Argentina

Correspondence: Rodrigo Hierro (rhierro@austral.edu.ar)

Received: 15 July 2017 – Discussion started: 24 October 2017
Revised: 25 May 2018 – Accepted: 4 June 2018 – Published: 19 June 2018

Abstract. Gravity waves (GWs) and convective systems play         spheric vertical wavelengths by one of the RO events is dis-
a fundamental role in atmospheric circulation, weather, and       cussed as an illustration. In the analysis, both the elevation
climate. Two usual main sources of GWs are orographic ef-         angle of the sounding path (line of tangent points) and the
fects triggering mountain waves and convective activity. In       gravity wave aspect ratio estimated from the simulations and
addition, GW generation by fronts and geostrophic adjust-         the line of sight are taken into account. In both case studies,
ment must also be considered. The utility of Global Position-     a considerable distortion, over- and underestimation of the
ing System (GPS) radio occultation (RO) observations for          vertical wavelengths measured by RO, may be expected.
the detection of convective systems is tested. A collocation
database between RO events and convective systems over
subtropical to midlatitude mountain regions close to the Alps
and Andes is built. From the observation of large-amplitude       1   Introduction
GW structures in the absence of jets and fronts, subsets of
RO profiles are sampled. A representative case study among        The Global Positioning System (GPS) radio occultation (RO)
those considered at each region is selected and analyzed.         technique has proven to be a powerful tool with which to
The case studies are investigated using mesoscale Weather         analyze meteorological tropospheric features with a moder-
Research and Forecasting (WRF) simulations, ERA-Interim           ate/high spatial and temporal resolution in essentially any
reanalysis data, and measured RO temperature profiles. The        meteorological condition. Its ability to penetrate clouds al-
absence of fronts or jets during both case studies reveals sim-   lows retrieval of temperature (T ) and water vapor pressure
ilar relevant GW features (main parameters, generation, and       (e), amongst several other atmospheric variables with high
propagation). Orographic and convective activity generates        vertical resolution near the surface. Vertical profiles of T are
the observed GWs. Mountain waves above the Alps reach             provided with an accuracy better than than 1 K (e.g., Kursin-
higher altitudes than close to the Andes. In the Andes case,      ski et al., 1997; Steiner and Kirchengast, 2005; Scherllin-
a critical layer prevents the propagation of GW packets up to     Pirscher et al., 2011, 2017; Kursinski and Gebhardt, 2014)
stratospheric heights. The case studies are selected also be-     in the troposphere to lower stratosphere and specific hu-
cause they illustrate how the observational window for GW         midity with an accuracy of about 0.1 to 0.3 g kg−1 in the
observations through RO profiles admits a misleading inter-       lower to middle troposphere. Although measurements are
pretation of structures at different altitude ranges. From re-    taken irregularly in time and space, they provide global cov-
cent results, the distortion introduced in the measured atmo-     erage. Data are available from several missions – such as
                                                                  the CHAllenging Minisatellite Payload (CHAMP); Satélite

Published by Copernicus Publications on behalf of the European Geosciences Union.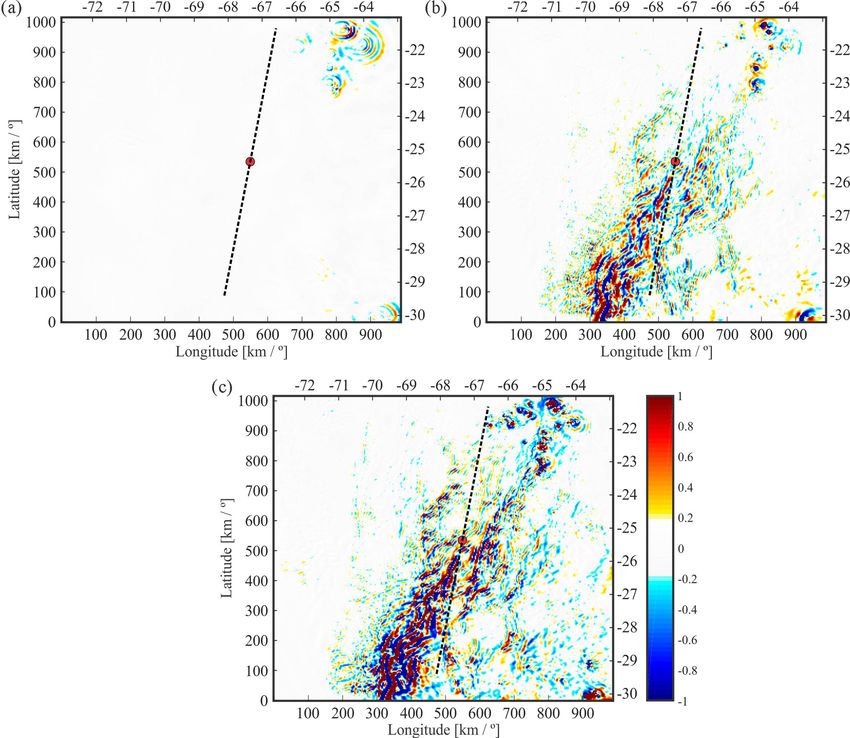
3524                     R. Hierro et al.: Orographic and convective gravity waves above the Alps and Andes Mountains

de Aplicaciones Científicas-C (SAC-C); Gravity Recovery            waves which propagate upstream are generated (Beres et al.,
and Climate Experiment (GRACE); or the Formosa Satel-              2002, and references therein). Convective instability, in turn,
lite mission-3/Constellation Observing System for Meteorol-        yields oscillatory movements, which give place to GWs that
ogy, Ionosphere, and Climate mission (hereafter referred to        propagate vertically as a harmonic oscillator (e.g., Fritts and
as COSMIC) – and have been found to be of high quality and         Alexander, 2003). Several authors have analyzed the main
consistency in the troposphere and lower stratosphere (e.g.,       mechanisms which describe the possible sources of gravity
Steiner et al., 2011, 2013; Angerer et al., 2017; this special     waves generated by convection. In the “obstacle effect”, the
issue).                                                            background finds a barrier provided by the convective flow
   Biondi et al. (2011) recognized double tropopause events        (Clark et al., 1986). Fovell et al. (1992) proposed a mech-
using bending angle (BA) anomalies derived from GPS                anism where updrafts and downdrafts reach the tropopause,
RO measurements from different missions. Later, Biondi et          generating high-frequency GWs. Röttger (1980) studied pen-
al. (2015) found that the GPS RO technique is useful for           etrating cumulus convection, which generates GWs by trans-
understanding the thermal structure of tropical cyclones and       ferring kinetic energy from the troposphere to the lower
possible overshootings into the stratosphere. The complexity       stratosphere.
of the relationship between deep convection and flow con-             Evan et al. (2012) showed that the Weather Research
vergence over mountains has been widely studied. Demko             and Forecasting (WRF) mesoscale model (Skamarock et al.,
et al. (2009) showed that, during days with deep convection,       2008) is able to simulate stratospheric GWs when it is run
the convergence over mountains is weaker than on days when         under actual boundary conditions. It was also possible to re-
deep convection does not occur.                                    solve GWs generated by convection in the tropics. Stephan
   Over the Alps – considering the kinematic and dynamic           and Alexander (2014), in turn, showed that WRF physics pa-
features of divergence, flow splitting, or mesoscale vortices      rameterizations are not decisive to obtain good results from
– it is possible to find regions which initiate or intensify the   GW simulations. From WRF simulations above the Southern
storms (Bica et al., 2007). Thermally driven flows over the        Andes, de la Torre et al. (2012) detected systematic large-
Alps are associated with convergence caused by large-scale         amplitude, stationary, nonhydrostatic GW structures, forced
topographic heat flows (Langhans et al., 2013). These flows        by the mountains up to the lower stratosphere and persisting
supply moisture from source regions close to the surface,          for several hours. Their dominant modes were characterized
which in turn stimulates the initiation of deep convection         by horizontal wavelengths (λH ) of around 50 km. The vertical
(e.g., Barthlott et al., 2006). Southward-oriented reliefs re-     wavelengths (λZ ) were estimated to be between 2 and 11 km.
ceive more solar radiation, resulting in a warmer atmosphere,      Over the Andes region, de la Torre et al. (2011) detected
in comparison with flat terrain. Also, the orography presents      two main modes of mountain waves with large amplitude
a negative energetic balance as compared to flat regions.          and high intrinsic frequency. Over the same region, Hierro
   Extratropical regions in the Southern Hemisphere show           et al. (2013) found stationary modes with λH between 40 and
strong wave activity close to the Andes and to the Antarctic       160 km and λZ of around 7 km. De la Torre et al. (2015), ana-
Peninsula (e.g., Eckermann and Preusse, 1999; de la Torre          lyzing storms in the presence of MWs, distinguished two dif-
et al., 2012; Hierro et al., 2013). The eastern side of the        ferent structures in vertical wind simulations. Both of them
Andes at midlatitudes, between the subtropical and polar           seem to be fixed to the mountains, defining systematic up-
jets (Houze, 2012), is a natural laboratory for gravity waves      draft and downdraft sectors. GW parameters were analyzed
(GWs), in particular mountain waves (MWs). The dynamic             from band-pass and wavelet analysis, indicating for the cases
processes involved in convection over this region have been        analyzed the presence of short λH and long λZ , as expected
analyzed, e.g., by de la Torre et al. (2004), who found that       for high-intrinsic-frequency GWs.
anabatic winds act as a triggering mechanism in the presence          The motivation of the present work is twofold: first, to find
of moist enthalpy under unstable conditions. A relationship        a set of collocations among GPS RO BA and T profiles and
between MWs and the development of deep convection was             mesoscale midlatitude convective systems under reasonable
found by de la Torre et al. (2011). Through the design of sev-     conditions of proximity in space and time over orographic re-
eral non-dimensional numbers related to storms development         gions (Alps and Andes). We use this data set to test the util-
and MW energy, Hierro et al. (2013) found that MWs are able        ity of GPS RO observations for the detection of convective
to provide the necessary energy to overcome a surface sta-         systems. To detect the cloud top altitude from the RO pro-
ble layer. Vertically propagating short-period GWs strongly        files, we apply a technique based on the anomaly in the BA.
affect the general circulation as well as the structure of the     Secondly, the GW structures are analyzed and discussed for
middle atmosphere (e.g., Dutta et al., 2009).                      two selected case studies detected in the absence of jets and
   Convective activity is one of the most important sources        fronts, from high-resolution mesoscale model simulations
of GWs through the release of latent heat, contributing to         and reanalysis data. The possible determination or mislead-
the interaction between waves and mean flow in the mid-            ing interpretation of GW parameters from GPS RO is dis-
dle atmosphere (e.g., Alexander, 1995; Pandya and Alexan-          cussed in detail for these case studies. Section 2 outlines the
der, 1999). When a convective cloud reaches the mean flow,         RO data used and the methodology applied and describes the

Atmos. Meas. Tech., 11, 3523–3539, 2018                                              www.atmos-meas-tech.net/11/3523/2018/
R. Hierro et al.: Orographic and convective gravity waves above the Alps and Andes Mountains 3525
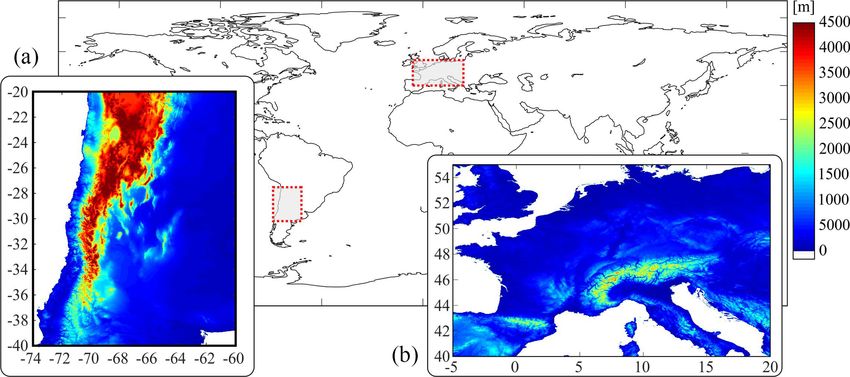
Figure 1. The Alps (b) and Andes (a) regions in Europe and South America, selected to build a collocation database between RO data and
cloud data over subtropical to midlatitude mountain regions. The elevation map for each region is included.
two subsets of RO events retrieved during convective activity Convective systems are located in time and space using the
close to the Alps and Andes mountain ranges. In Sect. 3, one global deep convective tracking database of the International
case study at each region is selected, and relevant GW fea- Satellite Cloud Climatology Project (ISCCP) (Rossow et al.,
tures are analyzed from the simulation, the reanalysis data, 1996), from January 2006 to July 2008. This period was cho-
and the measurement of both RO events. In Sect. 4, conclu- sen due to the constraints and limitations imposed by the IS-
sions are given. CCP database and the COSMIC data. The first source, avail-
able between 1983 and 2008, is currently incomplete and be-
ing re-processed. The global ISCCP data set, with a horizon-
2 Data and methodology tal grid resolution of 30 km and a nominal time resolution of
3 h, is based on brightness temperatures from geostationary
The utility of RO observations for the investigation of con-
satellite measurements. It provides information on the loca-
vective systems (Biondi et al., 2012, 2015) and GWs over
tion and extent of mesoscale deep convective cloud systems
orographic regions in Europe and South America (Alps and
and their properties. The parameters extracted from ISCCP
Andes Mountains) is tested. It is known that a sharp spike in
data are time of occurrence, center (mass center), and radius
RO BA is highly correlated with the top of the cloud, corre-
of the storm. The COSMIC mission started in June 2006.
sponding to anomalously cold temperatures within the cloud.
The selection criterion applied in the present work con-
Above the cloud, the temperature returns to background con-
siders the position of the RO observation with respect to the
ditions, and a strong inversion appears above the cloud top.
center of the storm, thus providing 294 and 50 collocations in
For usual tropospheric cloud tops, the T lapse rate within the
the Alps and Andes regions, respectively. According to this
cloud often approaches a moist adiabat, consistent with rapid
criterion, it is observed whether the latitude and longitude
undiluted ascent within the convective systems.
corresponding to the mean tangent point (TP) belonging to
We built a collocation database between RO observations
each RO profile are located within a radius of 100 km with
and mesoscale convective systems over subtropical to midlat-
respect to the center of the storm, as provided by ISCCP. A
itude mountain regions. The selected regions for the Alps and
maximum time difference of 3 h was allowed between each
Andes are 40–55◦ N, 0–20◦ E and 20–40◦ S, 60–74◦ W, re-
RO event and the data from ISCCP. The collocated events
spectively (Fig. 1). We use RO data processed at the Wegener
were selected using cloud data from geostationary satellites
Center for Climate and Global Change (WEGC) with the
METEOSAT (Europe) and GOES (South America) (Fig. 2).
Occultation Processing System (OPS) version 5.6 (Schwärz
The collocated RO BA and T profiles were also used to de-
et al., 2016), based on excess phase and orbit data version
termine the vertical structures of subtropical convective sys-
2010.2640 from the University Corporation for Atmospheric
tems over orographic regions. In order to detect the cloud
Research (UCAR) from the CHAMP, SAC-C, GRACE, and
top altitude with RO, we applied the anomaly technique de-
COSMIC missions. We analyze BA and T profiles which
veloped by Biondi et al. (2013) atmospheric BA profiles for
are available from near the surface up to 40 km altitude with
cloud top detection of convective systems. Each BA and
100 m vertical sampling.
T profile collocated with a storm was referenced against a
RO background reference climatology profile, which was ex-
tracted for the same location and the same month from the
www.atmos-meas-tech.net/11/3523/2018/ Atmos. Meas. Tech., 11, 3523–3539, 2018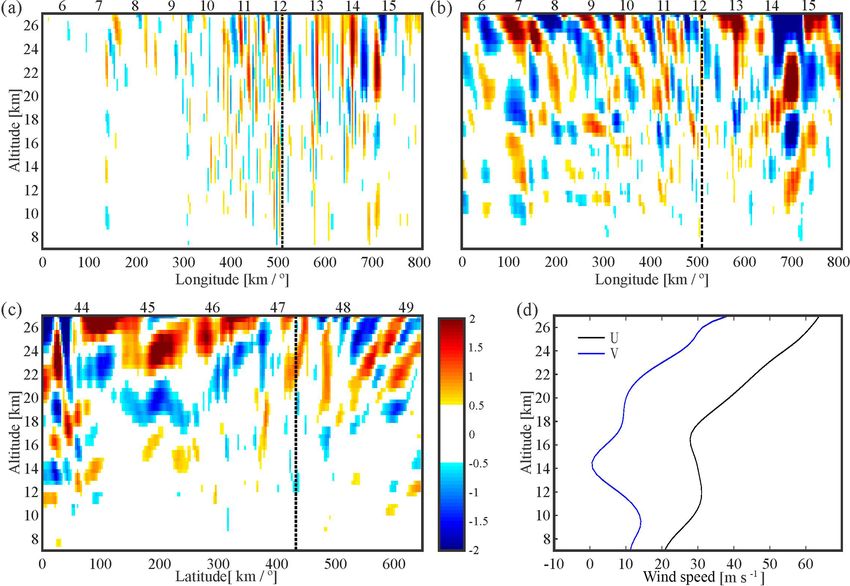
3526                      R. Hierro et al.: Orographic and convective gravity waves above the Alps and Andes Mountains

Figure 2. Collocated events between GPS RO profiles and convective systems in (a) the Alps region and (b) the Andes region. The latitude
and longitude corresponding to the mean tangent point belonging to each RO are located within a radius of 100 km with respect to the center
of the storm and in a time interval less than 3 h. Events considered in this study are indicated in red.

global RO BA and T reference climatology, respectively (for                In the present study, a GW climatology from the limited
details see Biondi et al., 2017). We then subtracted the col-           number of available collocated cases is not intended. Instead,
located RO reference climatology profile from the individual            by focusing on selected large-amplitude RO T profiles, wave
RO profile. BA was normalized with respect to the reference             features in both mountain subtropical regions are compared.
climatology profile in order to obtain a fractional anomaly             In doing so, five collocations were pre-selected in each re-
profile. The cloud top altitude is represented as a pronounced          gion (Fig. 3a–b). All of the pre-selected collocations show
spike in the vertical BA anomaly structure and, correspond-             some spikes in the BA profile, from which one is correlated
ingly, in the T anomaly profile.                                        with the cloud top of the corresponding convective struc-
   Taking into account the wave signatures observed in                  ture. Large-amplitude oscillations possibly associated with
the RO T profiles (see below), GWs were analyzed from                   hydrostatic and/or nonhydrostatic GW structures are evident.
two different data sources: mesoscale model simulations                 The analysis is further conducted in two peculiar case stud-
and European Centre for Medium-Range Weather Fore-                      ies (central panels in Fig. 3a–b), defined by the simultaneous
casts (ECMWF) Reanalysis Interim (ERA-Interim) data. The                absence of jets and fronts.
WRF simulations (Skamarock et al., 2008) were performed                    To confirm this scenario, we analyzed a possible imbal-
using 1◦ × 1◦ National Center of Environmental Prediction               ance in the flow between mass and momentum, able to gen-
(NCEP) Global Final Analysis (FNL) as boundary condi-                   erate inertia-gravity waves through geostrophic adjustment,
tions. They are conducted in four nested domains (27, 9, 3,             as the atmosphere tries to restore the equilibrium (see, e.g.,
and 1 km) with 60 vertical levels. A sponge layer was applied           Zhang et al., 2000; Zhang, 2004; Plougonven and Zhang,
in the upper 3 km. The size of the inner domain in the Alps re-         2014). In doing so, we considered different available meth-
gion is about 300 km × 200 km, and that of the Andes region             ods. Each of them involves the calculation of a specific pa-
is about 300 km × 300 km. For each domain, the microphys-               rameter, with its advantages and disadvantages (cross-stream
ical schemes used were the following: WRF single-moment                 component of the Lagrangian Rossby number (Ro− ), Psi
6-class microphysics (WSM6; Hong et al., 2004); Yonsei                  vector, generalized omega equation, nonlinear balance equa-
University (YSU; Hong et al., 2006) to represent the plane-             tion). Following de la Torre at al. (2006), we analyzed the
tary boundary layer (PBL) physics; Rapid Radiative Transfer             Ro− distribution from reanalysis and from the simulated
Model Longwave (RRTM; Mlawer et al., 1997) and MM5                      geopotential and velocity data. When a geostrophic imbal-
Dudhia Shortwave (Dudhia scheme; Dudhia, 1989) for radi-                ance (e.g., Fritts and Alexander, 2003) coexists with other
ation processes; and the Noah Land Surface Model (devel-                sources, Ro− , defined by the ratio of the component of the
oped jointly by NCAR and NCEP; Skamarock et al., 2008)                  ageostrophic wind normal to the flow to the observed wind
and Monin–Obukhov scheme (Monin and Obukhov, 1954)                      speed, is expected to be greater than 0.5, and the analysis
for surface physics and thermal diffusion processes, respec-            should be more intricate. In the present case studies, Ro− re-
tively. The cumulus parameterization used was the new Grell             mains < 0.5 (not shown) at jet pressure levels, and the GW
scheme (Grell3; Grell and Devenyi, 2002) for the first two              structures are conceivably limited to orographic and/or con-
domains, while non-cumulus parameterization was selected                vective sources. The RO case studies exhibit attractive oscil-
for the two inner ones.                                                 latory features and correspond, in the Alps region, to 2 Febru-

Atmos. Meas. Tech., 11, 3523–3539, 2018                                                    www.atmos-meas-tech.net/11/3523/2018/
R. Hierro et al.: Orographic and convective gravity waves above the Alps and Andes Mountains 3527
Figure 3.
ary 2008 at 17:24 UTC (47.29◦ N, 12.02◦ W) and in the An- The mesoscale outputs were obtained every 60 min.
des region to 19 December 2006 at 16:56 UTC (25.35◦ S, It is generally accepted that δw adequately highlights
67.37◦ W). the main GW amplitudes and wavelengths characteristic
of MWs. These usually belong to high- and medium-
intrinsic-frequency regimes. In Fig. 4, coherent, mostly bi-
dimensional GW structures with constant phase surfaces
3 WRF model simulations, ERA-Interim reanalysis
are seen. They are mainly oriented in a S–N direction and
data, and GPS RO observations
slightly tilted to the NE with increasing latitude. The mean
horizontal wind is directed from NW to SE at 700 hPa, caus-
The GWs in the two selected study cases in the Alps and An-
ing the apparent forcing of MWs. It is equal to [U , V ] = [3;
des are investigated from WRF numerical simulations, ERA-
−3] m s−1 at 18:00 UTC. Prevailing amplitudes and λH –
Interim reanalysis data, and collocated GPS RO observation
ranging from 1 to 2 m s−1 and 20 to 60 km, respectively –
profiles.
are distinguished. Two main features may be remarked at
both levels. GW amplitudes are weaker below than above
3.1 Case study over the Alps region the cloud tops, and two different structures are visible. One
structure is stationary and the other is not stationary. The last
3.1.1 Numerical simulations of GW structures one is zonally and meridionally displaced when observed at
1 h intervals during the evolution of convection (not shown).
In the Alps region, the dynamic and thermodynamic param- The GW sources seem to be orographic forcing and as-
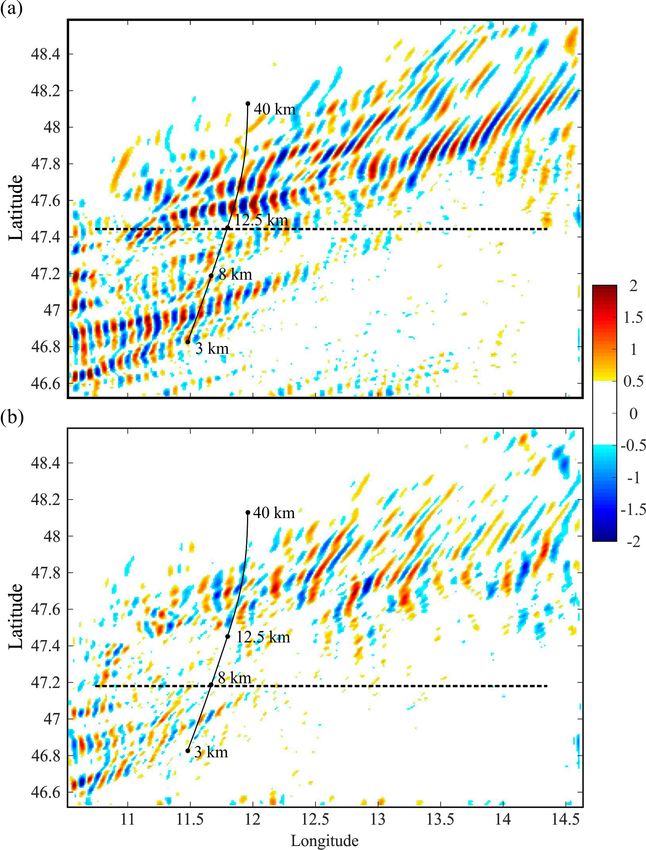
eters are simulated. In Fig. 4, the vertical air velocity (δw) sociated with cloud development. δw amplitude values up
in the considered area is shown. Two altitude levels (8 and to 2 m s−1 correspond to MWs with short horizontal wave-
12.5 km) are chosen, above and below the cloud tops (situ- length. These δw perturbations exhibit, as expected, the pres-
ated at 9.8 km height) at 17:00 UTC. The δw field is repre- ence of MWs more clearly than δT (Fig. 5a). By contrast,
sented a few minutes before the RO event (17:24 UTC).
www.atmos-meas-tech.net/11/3523/2018/ Atmos. Meas. Tech., 11, 3523–3539, 2018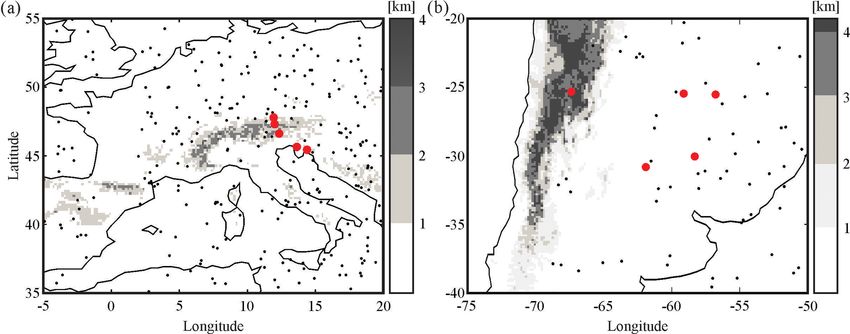
3528                       R. Hierro et al.: Orographic and convective gravity waves above the Alps and Andes Mountains

Figure 3. Pre-selected collocations between GPS RO profiles and convective developments in (a) the Alps region and (b) the Andes region.
The figure shows absolute profiles and anomaly profiles for bending angle (green) and temperature (red) and the respective climatology
profile (dotted). The cloud top height is indicated by a blue star. The pre-selected collocations for case studies are based on large-amplitude
wave features in observed the RO T profiles. The two selected case studies (central panels) are based on the simultaneous absence of GW
sources given by jets and fronts.

the non-stationary GWs with longer λH and amplitude values                3.1.2   Analysis of gravity waves in the RO observation
above 2 K are more evident in δT than in δw, as a function
of longitude and latitude (Fig. 5b and c). Systematic λZ val-             The wavelike structure of the RO T profile retrieved in the
ues ∼ 8 km, associated with these longer λH , are observed.               Alps region is analyzed. This profile is shown in the central
In these figures, the vertical line indicates the position of the         panels of Fig. 3a. Its horizontally projected line of tangent
RO mean TP. The orographic amplitudes are more signifi-                   points (LTP) is seen in Fig. 4. By doing so, the perturbation
cant early in the morning, exhibiting a general decrease with             component of this profile is removed (Fig. 6a). If a simple
increasing local time (not shown). They reach large ampli-                band-pass filter is applied (e.g., de la Torre et al., 2006), the
tudes at stratospheric heights beyond the tropopause, located             “tropopause problem” must be dealt with, as far as RO T
at 11 km. No critical levels for MWs or reflection effects are            profiles are available as a function of altitude. As pointed out
observed (Fig. 5d). The strongest orographic structures are               by Alexander et al. (2011), even if filters with ideal cutoffs
observed until the early afternoon. On the other hand, the                existed, part of the problem would still be there because the
non-stationary GW packets are generated between 12 and                    tropopause kink usually departs from a sinusoid or any other
17 km height, during the convection development after mid-                function that may be used as a basis. Real filters do not yield
afternoon, and radiated above the cloud tops. The longer λH               ideal spectral component isolations (one side effect is am-
values are not well defined, suggesting the coexistence of two            plitude reduction, for example) and may need some manual
or more non-stationary modes.                                             fine-tuning procedures to optimize their performance. After
                                                                          a “perfect” band pass is used (able to completely filter out the
                                                                          undesired wave modes), there should be no remaining com-
                                                                          ponents at wavelengths outside the considered range. The

Atmos. Meas. Tech., 11, 3523–3539, 2018                                                       www.atmos-meas-tech.net/11/3523/2018/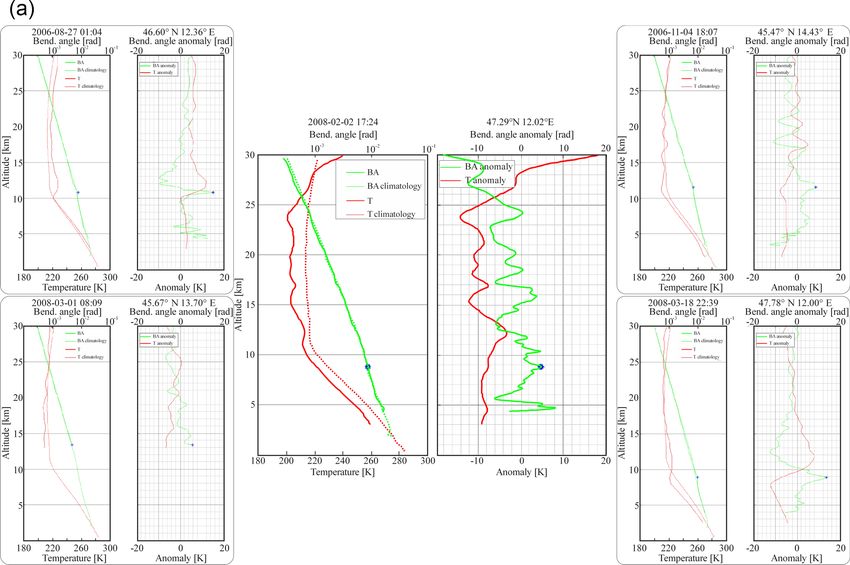
R. Hierro et al.: Orographic and convective gravity waves above the Alps and Andes Mountains                                         3529

                                                                         against a set of synthetic signals, called mother wavelets,
                                                                         obtaining correlation coefficients. The comparison between
                                                                         signals is carried out through a process of translation and
                                                                         contraction or dilation of the mother wavelet in each sig-
                                                                         nal portion. This process is repeated for all scales of mother
                                                                         wavelets, allowing the location of short-life, high-frequency
                                                                         signals like sharp changes, thus obtaining detailed informa-
                                                                         tion. In this work, the mother wavelet selected is the Morlet
                                                                         wavelet (Morlet, 1983), which consists of a flat wave mod-
                                                                         ified by a Gaussian envelope. Figure 6c shows a clear GW
                                                                         signal throughout the tropo–stratospheric region, with pre-
                                                                         vailing λZ = 4 km. A second, considerably weaker mode is
                                                                         also present in the troposphere, with λZ close to 7 km.
                                                                            To search for a possible correspondence among these two
                                                                         modes and the structures observed in Figs. 4 and 5, the
                                                                         expected amplitude attenuation effects must be considered
                                                                         (Alexander et al., 2008). For this RO event in particular, the
                                                                         line of sight (LOS) stands at each TP almost exactly per-
                                                                         pendicular to the GW phase surfaces observed in Fig. 3, at
                                                                         88◦ from the north (dotted lines in Fig. 4). This should pre-
                                                                         vent the observation of vertical oscillations corresponding to
                                                                         short λH structures, as seen in Fig. 4. In this figure, the quasi-
                                                                         perpendicular orientation of the constant GW phases relative
                                                                         to the LOS is observed. This clearly does not benefit the GW
                                                                         detection during the RO event. The horizontal averaging of
                                                                         RO retrievals produces an amplitude attenuation and phase
                                                                         shift in any plane GWs, which may lead to significant dis-
                                                                         crepancies with respect to the original values (Alexander et
Figure 4. Simulated high-resolution (inner WRF domain) δw struc-
tures in the Alps region (defined in Fig. 1). Two altitude levels,
                                                                         al., 2008). The lower and upper altitudes of LTP are 3 and
(a) above and (b) below the clouds top, are shown. The line of           40 km, respectively. The observation of GW structures with
tangent points (LTP) corresponding to the collocated RO event is         short λH observed in Fig. 4 is expected to suffer amplitude
indicated in both panels from lower (3 km) to upper (40 km) points       attenuation and should not be visible during GPS RO events
(solid black line). The line of sight (LOS, dotted black line) at both   (Preusse et al., 2002; Alexander et al., 2008).
levels is also indicated.                                                   An estimation of the expected attenuation in the station-
                                                                         ary and non-stationary structures during the RO sounding is
                                                                         thus performed. The amplitude attenuation factor defined as
method applied in this case comprises two steps: (i) band-               the ratio between derived and original amplitudes is deduced.
pass filtering is used to isolate the wavelength range of in-            This factor is a function of the ratio of GW vertical and hor-
terest in order to separate the background and to eliminate              izontal wavelengths and the angle (on the horizontal plane)
the noise. Then (ii) a cutoff larger than or equal to the band-          between the wave fronts and the LOS. Ideal conditions that
pass upper limit is applied. This allows large wavelengths to            lead to no attenuation are, respectively, a null ratio between
be removed representing background behavior or trends still              vertical and horizontal wavelengths and a null angle between
present and a zero mean to be forced. The tropopause kink                LOS and the fronts. For the analyzed case study, Table 1
in T can be viewed as the surrounding of a long sinusoidal               shows the corresponding values of both parameters and the
peak. In the first step, a band pass between 1 and 10 km is ap-          attenuation factor (range of 0 to 1 covers null to full output).
plied, and in the second step a cutoff of 10 km is applied. The          According to these results, in the Alps case study a consid-
resulting filtered δT profile is marked by the solid black line          erable attenuation of mountain waves below the tropopause
in Fig. 6b. A continuous wavelet transform (CWT) is finally              and above it is expected.
applied to the remaining δT wave structure (Fig. 6c).
   The CWT is a useful method to detect the main oscillation             3.1.3   Analysis of GW structures from
modes present in a signal analysis. As is known, it is a power-                  ERA-Interim data
ful tool for studying multiscale and non-stationary processes
occurring over finite spatial and temporal domains (Lau and              The resulting estimation of a negligible attenuation factor at
Weng, 1995). It allows detecting short-period as well as long-           both height levels shown in Fig. 4 confirms that the GWs
period oscillations. The CWT compares the original signal                cannot be captured there during the RO event. It is clear that

www.atmos-meas-tech.net/11/3523/2018/                                                      Atmos. Meas. Tech., 11, 3523–3539, 2018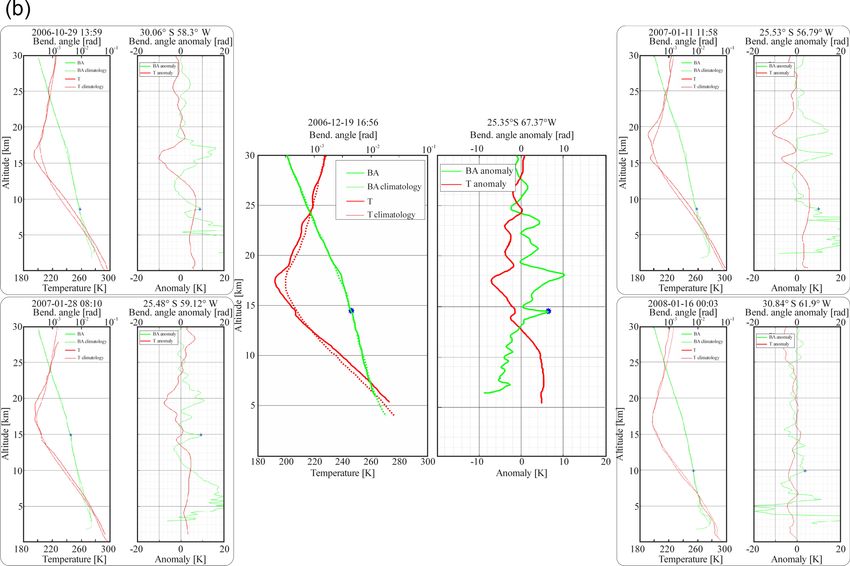
3530 R. Hierro et al.: Orographic and convective gravity waves above the Alps and Andes Mountains
Table 1. Attenuation factor as a function of the ratio of GW vertical and horizontal wavelengths and the angle (on the horizontal plane)
between the wave fronts and the LOS for the Alps and Andes case studies above and below the tropopause level (TP). Considerable (partial)
attenuation below the tropopause in the Alps (Andes) region is expected. Line 1 in the table refers to the wave seen in ERA-Interim (Fig. 7),
while lines 2 to 4 in this table refer to the WRF simulations.
Vertical/horizontal wavelength ratio Angle between wave fronts and LOS Attenuation factor
Alps above TP 0.02 48 0.90
Alps below TP 0.51 78 1 × 10−49
Andes above TP 0.01 32 0.99
Andes below TP 0.35 7 0.44
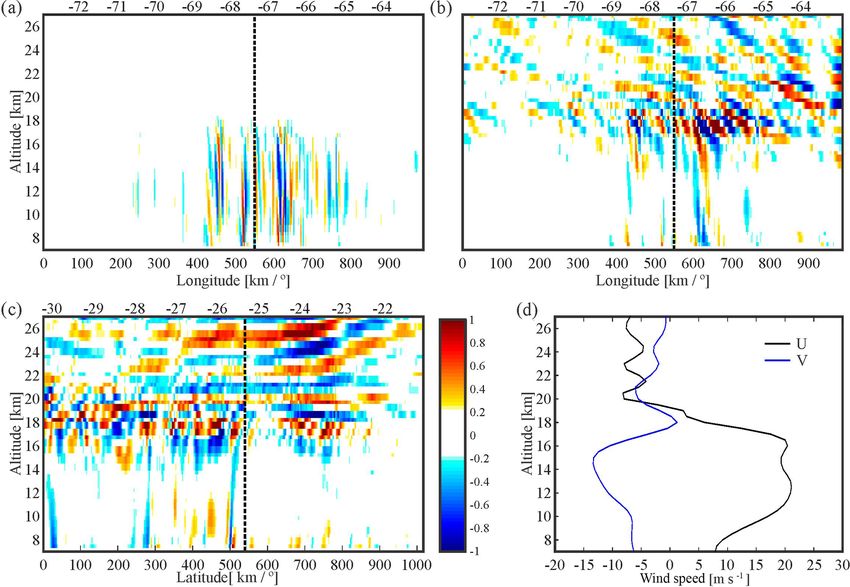
Figure 5. Simulated high-resolution GW structures in the Alps region, showing (a) δw and (b–c) δT signatures as a function of longitude
and latitude, respectively. Non-stationary (stationary) GWs with longer (shorter) horizontal wavelength are more clearly seen in δT / δw. The
dotted line indicates the position of the TP. (d) Zonal and meridional mean wind.
the mesoscale simulations are not enough to explain the ob- tude. The attenuation factor derived from these values is es-
served GW structure. To understand the origin of the oscil- timated as 0.90 (first line in Table 1). This value is consistent
lation observed in the RO δT profile, the possibility is an- with a clear oscillation observed at stratospheric heights in
alyzed that the presence of large-scale GWs cannot be cap- the RO profile, with λZ equal to 4 km (Fig. 6c and Table 1).
tured by mesoscale WRF simulations. According to this, the Regardless of the expected attenuation, an additional dis-
corresponding ERA-Interim reanalysis data are analyzed. In tortion must be considered due to the slanted nature of the
Fig. 7, δT resulting from these data at 22 km height reveals a sounding. This is introduced in the measured GW λH and λZ
well-defined non-stationary oscillation propagating in a NW– by atmospheric soundings performed in any direction other
SE direction, with λX and λY equal to 530 and 650 km, re- than vertical and horizontal. This is the case during GPS
spectively. ERA-Interim provides information about these RO events and during radiosoundings (e.g., de la Torre and
horizontal-wavelength GWs but has a relatively coarse res- Alexander, 1995; Alexander et al., 2008). In the case of RO
olution, strongly underestimating wave amplitudes. Accord- events, a visibility condition imposed on the LOS described
ingly, amplitudes in Fig. 7 are quite low. If this wave were in Alexander et al. (2008) must be satisfied. The distortion
seen in RO soundings, it would have a much larger ampli- is more or less significant, depending on the elevation angle
Atmos. Meas. Tech., 11, 3523–3539, 2018 www.atmos-meas-tech.net/11/3523/2018/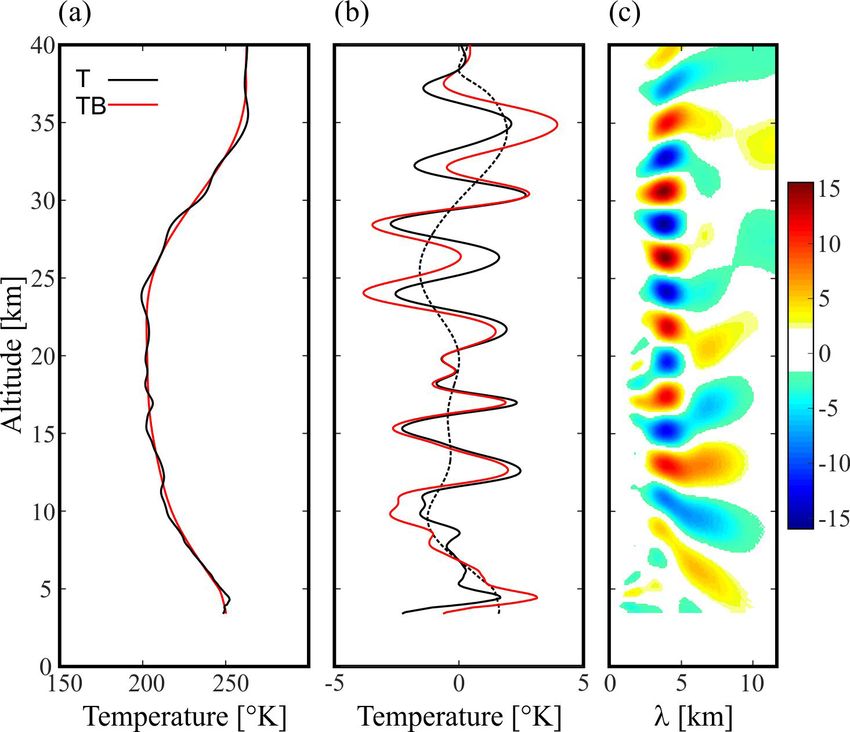
R. Hierro et al.: Orographic and convective gravity waves above the Alps and Andes Mountains                                      3531

                                                                        Figure 7. ERA-Interim δT data corresponding to the case study in
                                                                        the Alps region. The red dot indicates the mean TP location.
Figure 6. (a) Retrieved RO T vertical profile (black line) and its
corresponding low-pass background component TB (red line) in
the Alps region. (b) Remaining oscillation (black), isolated after         Coherent bi-dimensional GW structures with constant
applying a band-pass filter (red) and a double-filtering process to     phase surfaces oriented from SW to NE are seen (Fig. 8a
the background (black dotted) profile. (c) Continuous wavelet trans-    and b). The mean horizontal wind vector at 700 hPa directed
form (CWT) applied to the perturbation δT structure, as a function      from NW to SE is [U , V ] = [7; −3] m s−1 at 18:00 UTC.
of the vertical wavelength. The RO event took place at 17:24 UTC.       De la Torre et al. (2015) have shown that immediately to
The values to the right of the color bar represent the degree of cor-   the south of the Central Andes, close to the mountain tops,
relation between the wavelet selected (Morlet) and the signal to be     two clearly different orographic GW structures are system-
analyzed (δT ).
                                                                        atically observed at constant pressure levels. One structure
                                                                        type shows highly elongated alternating positive and nega-
                                                                        tive parallel δw bands, aligned almost in a N–S direction.
of the sounding path and the GW aspect ratio (de la Torre
                                                                        The second type presents a bi-dimensional distribution, too,
et al., 2018, hereafter referred to as T18). For example, dur-
                                                                        but exhibits alternating fringes of much shorter longitude,
ing vertically directed measurements with a single lidar, λH
                                                                        mostly in a SW–NE direction. The mean wind that forces
cannot be detected, but λZ is not distorted. A clear advantage
                                                                        mountain waves exhibiting the 1-D structures of the first type
of numerical simulations or reanalyses data is that they are
                                                                        presents an intense zonal gradient of zonal wind, veering
not affected by this systematic error inherent to any slanted
                                                                        to an increasing westerly mean wind with increasing lati-
atmospheric measurement. According to this, we must distin-
                                                                        tude. The meridional wind component is usually negligible.
guish between “apparent” (i.e., RO observations) and “real”
                                                                        In the 2-D structures of the second type, at and below moun-
λH and λZ values. For this reason, the apparent 4 km oscil-
                                                                        tain top levels, a prevailing intense negative meridional wind
lation observed in Fig. 6c must be carefully observed as a
                                                                        with less zonal wind contribution is observed. In the case
distorted signature, which in fact corresponds to a different
                                                                        study shown in Fig. 8, the mean wind at 700 hPa with con-
real λZ value (T18). Considerable under- or overestimations
                                                                        siderable negative meridional component is associated with
are generally expected, depending on the aspect ratio of GWs
                                                                        the second type. In Fig. 8a to c, additional non-orographic
and inclination of the LTP (T18 and Appendix A).
                                                                        GW structures situated in the NE and SE of the domain are
3.2     Case study over the Andes region                                observed. They propagate from low altitudes up to at least
                                                                        the upper limit of the simulations. These structures, proba-
3.2.1    Numerical simulations of GW structures                         bly of convective origin, exhibit stationary circularly shaped
                                                                        wave fronts. They penetrate beyond the critical layer for oro-
From the simulated dynamic and thermodynamic parame-                    graphic GWs, situated at an almost zero wind level, near to
ters, we show δw at constant height levels for the Andes area           18 km height (Figs. 8a to c and 9d).
in Fig. 8. Constant altitudes of 10 and 16 km, below (Fig. 8a)             In Fig. 9a to c, as in the Alps case, δw perturbations
and above (Fig. 8b) the cloud top (situated at 14 km height),           (Fig. 9a) exhibit the presence of mountain waves more
respectively, and at 26 km (Fig. 8c), at 17:00 UTC, are se-             clearly than δT . Nevertheless, in Fig. 9b and c, the presence
lected. The δw field is represented a few minutes before the            of two different GW structures, separated by a critical layer
RO event (16:56 UTC).                                                   at 18 km as a function of longitude and latitude, is identi-

www.atmos-meas-tech.net/11/3523/2018/                                                     Atmos. Meas. Tech., 11, 3523–3539, 2018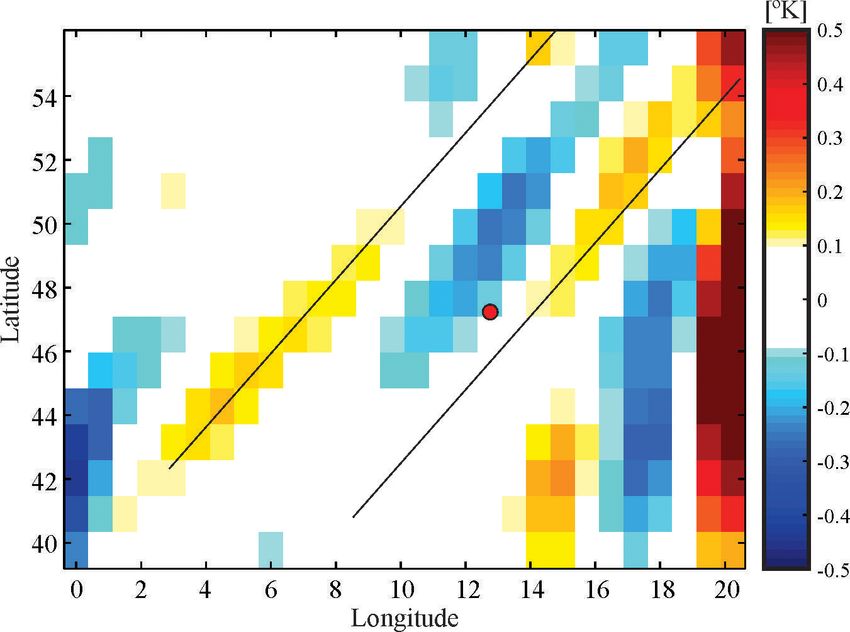
3532                       R. Hierro et al.: Orographic and convective gravity waves above the Alps and Andes Mountains

Figure 8. Simulated high-resolution GW structures in the Andes region defined in Fig. 1. Three constant altitudes are selected: (a) 26 km,
(b) 16 km, and (c) 10 km (respectively above, above, and below the cloud tops, situated at 14 km). In this case, the mean LTP (black line) is
located around 25.5◦ S, 67.1◦ W. The red point indicates the mean TP. The dotted line indicates the LOS crossing the TP corresponding to
each selected altitude.

fied. The MWs propagate upwards, and just below the crit-                3.2.2   Analysis of gravity waves in the RO observation
ical layer they increase their amplitude, with decreasing λZ
in agreement with linear GW theory. Inversely to the Alps
case study, the orographic amplitudes in the Andes region                The procedure is identical to the one applied in case study
are more significant in the afternoon. They exhibit a general            1. The utility of the double filter applied is more obvious
increase from sunrise with increasing local time. Above the              here than in the Alps case study. Also, the tropopause kink
critical layer, non-stationary GW packets are generated dur-             is sharper (Fig. 10b). For this RO event, inversely to the sit-
ing the convection development after mid-afternoon and are               uation described in the Alps case study, the LOS stands at
radiated above the cloud tops. These longer λH values are                each TP almost aligned to the GW phase surfaces observed
well resolved by WRF and shorter from the simulations than               in Fig. 8, at 190◦ from the north (dotted lines in Fig. 8). This
in the Alps case study. In the Andes case, there is almost               allows us to detect vertical oscillations in the RO profile cor-
no spatial coexistence between GWs from both GW sources.                 responding to the short λH MW structures seen below the
A clear separation between orographic structures below the               critical layer in Figs. 8 and 9.
critical layer and the convective GWs above is quite evident.               In Fig. 10c, a clear GW signal appears also in the An-
   Next, the wavelike structure of the RO T profile retrieved            des case, propagating throughout the tropo–stratospheric re-
in the Andes region is analyzed. This profile is shown in the            gion with a prevailing λZ = 4.5 km. Here again, attenuation
central panels of Fig. 3b, and its horizontally projected LTP            and distortion effects must be considered. The computa-
is seen in Fig. 8.                                                       tion of a partial attenuation factor (0.44, Table 1) below the
                                                                         tropopause confirms that the mountain waves at these levels

Atmos. Meas. Tech., 11, 3523–3539, 2018                                                     www.atmos-meas-tech.net/11/3523/2018/
R. Hierro et al.: Orographic and convective gravity waves above the Alps and Andes Mountains 3533
Figure 9. Simulated high-resolution GW structures in the Andes region, showing (a) δw and (b, c) δT signatures as a function of longi-
tude and latitude, respectively. Non-stationary (stationary) GWs with longer (longer) horizontal wavelength and shorter (longer) vertical
wavelength, above (below) the critical layer are observed. (d) Zonal and meridional mean wind.
can be captured during the RO event. In this estimation, λX ,
λY , and λZ values equal to 30, 100, and 10 km, respectively,
are considered. In this case study, the mesoscale simulations
are sufficient to explain the observed GW structure above the
critical layer, too. Clear signatures of λX , λY , and λZ equal to
350, 400, and 3 km, respectively, may be seen. These values
yield a very high attenuation factor (0.99). Note that attenu-
ation factors close to 1 have to be taken with some caution
because “ideal” wave patterns are assumed for this calcula-
tion. To understand the origin of the oscillation observed in
the RO δT profile, we conclude that the oscillation is com-
pletely due to orographic waves below the tropopause and
due to convective GWs above it. In both cases, mesoscale
simulations were able to capture the GW structures. In this
case study, like in the Alps case, an expected distortion in the
measured λZ value, due to the slanted nature of the sound-
ings, must also be expected.
4 Summary and conclusions
Figure 10. Similar to Fig. 6 but for the RO case study over the From an initial set of collocations between convective sys-
Andes region. tems and GPS RO observations, the applicability of these
data sets for the detection and investigation of convective
systems and GWs over orographic regions was analyzed. In
doing so, mountain regions of Europe and South America,
www.atmos-meas-tech.net/11/3523/2018/ Atmos. Meas. Tech., 11, 3523–3539, 20183534 R. Hierro et al.: Orographic and convective gravity waves above the Alps and Andes Mountains
over subtropical to midlatitude regions, the Alps and Andes investigated, considering the expected amplitude attenuation
mountain ranges, were selected. A collocation database was effects in the RO sounding.
built up. We used RO bending angle and T profiles retrieved It is concluded that the LOS and the wavelength ratio
at the Wegener Center with processing version OPSv5.6. The should prevent the observation of vertical oscillations cor-
storm systems were located in time and space according to responding to short λH structures. This clearly does not ben-
the global deep convective tracking database ISCCP. From efit GW detection during the RO event. The horizontal av-
an initial set of 294 and 50 collocations at Alps and Andes eraging of RO retrievals produces an amplitude attenuation
regions, respectively, a subset of 10 collocations was pre- and phase shift in any plane GWs, which may lead to sig-
selected. This pre-selection was based on the observation of nificant discrepancies with respect to the original values. An
large amplitudes, presumably GWs, in the retrieved T RO estimation of the expected attenuation in the stationary and
profiles. Two case studies were finally studied in detail, one non-stationary structures during the RO sounding was per-
in the Alps region and one in the Andes region. The case formed. The amplitude attenuation factor defined as the ra-
studies were investigated using mesoscale WRF simulations, tio between derived and original amplitudes was deduced.
ERA-Interim reanalysis data, and measured RO T profiles. Ideal conditions that lead to no attenuation are a null ratio
The case studies considered were selected based on the ab- between vertical and horizontal wavelengths and a null angle
sence of jets and fronts, in order to be able to filter out two between LOS and the fronts. The case study analyzed shows
relevant possible sources of GWs. Similar GW regimes and the corresponding values of both parameters and the attenu-
dominant vertical and horizontal wavelengths, from convec- ation factor. In this Alps case study, considerable attenuation
tive and orographic origin, were found at both regions. MWs of mountain waves below and above the tropopause is ex-
reach higher altitudes above the Alps than close to the Andes. pected. The resulting estimation of a negligible attenuation
The background mean wind above the latter region imposes a factor confirmed that these GWs cannot be captured during
critical level for mountain wave propagation, preventing the the RO event. As the mesoscale simulations are not enough to
propagation of GW packets up to stratospheric heights. capture and explain the observed GW structure, correspond-
In the Alps, mostly bi-dimensional GW structures with ing ERA-Interim reanalyses data were investigated. From
constant phase surfaces are seen. The mean horizontal wind these data, a defined non-stationary oscillation propagating
causes the apparent forcing of MWs. Prevailing amplitudes in a NW–SE direction was observed, explaining the oscilla-
and λH ranging from 1 to 2 m s−1 and 20 to 60 km, respec- tion seen in the RO δT profile.
tively, are distinguished. GW amplitudes are weaker below At the Andes region, coherent bi-dimensional GW struc-
than above the cloud tops, and two different structures are tures with constant phase surfaces oriented from SW to NE,
visible. One structure is stationary and the other is not sta- of a type already reported in a previous work, are seen. Ad-
tionary. The GW sources seem to be orographically forced ditional non-orographic GW structures situated in the NE
or associated with cloud development. δw amplitude val- and SE of the domain are observed. They propagate from
ues up to 2 m s−1 correspond to MWs with short horizon- lower altitudes until at least the upper limit of the simula-
tal wavelengths. These δw perturbations exhibit, as expected, tions. These structures exhibit stationary circular wave fronts
the presence of MWs more clearly than δT . By contrast, the and penetrate beyond the critical layer for orographic GWs,
non-stationary GWs with longer λH and amplitude values situated at an almost zero wind level, near the tropopause
above 2 K are more evident in δT than in δw. Systematic λZ at about 18 km height. As in the Alps case, δw perturbations
values close to 8 km, associated with these longer λH , are ob- exhibit the presence of MWs more clearly than δT . The pres-
served. The orographic amplitudes are more significant early ence of two different GW structures, separated by a critical
in the morning, exhibiting a general decrease with increas- layer at 18 km, is identified. The MWs propagate upwards,
ing local time. They reach large amplitudes at stratospheric and just below the critical layer their amplitude increases;
heights beyond the tropopause, located at 11 km in the Alps at the same time λZ decreases. Inversely to the Alps case
case. No critical levels or reflection effects are observed. The study, the orographic amplitudes in the Andes region are, as
strongest orographic structures are observed until the early usual, more significant in the afternoon, exhibiting a general
afternoon. The non-stationary GW packets are generated dur- increase with increasing local time. Above the critical layer,
ing the convection development after mid-afternoon and are non-stationary GW packets are generated during the convec-
radiated above the cloud tops. The longer λH values are not tion development after mid-afternoon and are radiated above
well defined, suggesting the coexistence of two or more non- the cloud tops. In this case, there is almost no spatial coexis-
stationary modes. tence between GWs from both GW sources.
The observed RO T profile was first filtered, and then a In the retrieved RO δT profile a signal appears also propa-
CWT was applied to the remaining δT . A clear GW signal gating throughout the tropo–stratospheric region with a pre-
throughout the tropo–stratospheric region, with prevailing vailing λZ = 4.5 km. An evaluation of the partial attenuation
λZ = 4 km, was found. The correspondence between these coefficient reveals that, in the troposphere, MWs can be cap-
two modes and the structures observed in the simulations was tured during the RO event. In this estimation, λX , λY , and λZ
values equal to 30, 100, and 10 km, respectively, are consid-
Atmos. Meas. Tech., 11, 3523–3539, 2018 www.atmos-meas-tech.net/11/3523/2018/R. Hierro et al.: Orographic and convective gravity waves above the Alps and Andes Mountains 3535
ered. For the Andes case study, the mesoscale simulations ex- ing database of the International Satellite Cloud Climatology
plain the observed GW structure above the critical layer also. Project (ISCCP) (from World Climate Research Program) via
Clear signatures of λX , λY , and λZ equal to 350, 400, and https://isccp.giss.nasa.gov/CT/ (last access: 14 June 2018). Cloud
3 km, respectively, may be seen. These values yield a very data from METEOSAT satellites (METEOSAT 8, 9, 10 and
high attenuation factor (0.99). It is concluded that the oscilla- 11) are available from the European Organisation for the Ex-
ploitation of Meteorological Satellites (EUMETSAT) processing
tion is entirely due to orographic waves below the tropopause
center via https://eoportal.eumetsat.int/userMgmt/login.faces
and due to convective GWs above it. In both cases, mesoscale (last access: 14 June 2018), and data from the Geostationary
simulations were able to capture the GW structures. In this Operational Environmental Satellite (GOES) are available from
case study, as in the Alps case, additionally, an expected dis- the National Oceanic and Atmospheric Administration (NOAA)
tortion in the measured λZ value must be foreseen. This is via https://www.class.ncdc.noaa.gov/saa/products/search?sub_
due to the slanted nature of the sounding and also depends id=0&datatype_family=GVAR_IMG&submit.x=32&submit.y=11
on the GW aspect ratio. (last access: 14 June 2018). ERA-Interim data are publicly
available from the European Centre for Medium-Range Weather
Forecasts (ECMWF) (Reading, UK) and can be accessed via
Data availability. The Wegener Center multi-satellite GPS http://apps.ecmwf.int/datasets/data/interim-full-daily/levtype=sfc/
radio occultation record OPSv5.6 data set is available on re- (last access: 14 June 2018).
quest from teh Wegener Center and will be made publicly
available in 2018. Data on convective systems used in this
study are available from the global deep convective track-
www.atmos-meas-tech.net/11/3523/2018/ Atmos. Meas. Tech., 11, 3523–3539, 20183536 R. Hierro et al.: Orographic and convective gravity waves above the Alps and Andes Mountains
Appendix A
The discrepancy between measured and simulated λZ (an
analogous discussion could also be given regarding λH – see
T18) may be quantitatively explained as follows. It may be
assumed that RO soundings yield T profiles almost instanta-
neously in such a way that GWs are “frozen” in space during
the entire LTP retrieval. The vertical “real” and “apparent”
ap
(or measured) wavelengths (λZ and λZ , respectively) are re-
lated according to the following expression (T18):
ap λZ
λZ = , (A1)
abs(1 + cot(α)cot(ψ))
where α is the elevation angle, defined by a straight sounding
path direction and the horizontal plane, and cot(ψ) is the ratio
between the horizontal wave number vector (kH ) projected on Figure A1. Example of distortion expected between measured and
the vertical plane containing the LTP and the vertical wave simulated λZ , in relation to the GW parameters derived from the
GPS RO event above the Andes, as detailed in Figs. 8, 9, and 10.
number kZ . The ratio kH /kZ = λZ /λH is also known as the
Both green circles illustrate, for a given α value, possible D–ψ
GW aspect ratio = tg(ψ). We define the distortion as the ratio
combinations of the parameters that would correspond to under-
ap (left green circle) and overestimation (right circle) of λZ .
λZ
D= (A2)
λZ
and plot this parameter, following Eq. (A1), as a function
of α and ψ (red line in Fig. A1). For the LTP shown in
Fig. 8, considering that both the horizontal and vertical ex-
cursion of LTP, as well as the upper and lower altitudes (40
and 3 km), are known, we infer an average α = 0.68 rad. A
different curve is obviously expected for different α values,
albeit fitting a similar shape. The divergence at high D val-
ues is only suggested by plotting its variability up to D = 5.
The left green circle qualitatively indicates the D–ψ GPS RO
sector encompassing the functional relation among the three
parameters. The right green circle is included, because an un-
certainty between α and π − α for our estimated aspect ratio
still remains from our previous estimation. The white, light
gray, and gray backgrounds indicate, for reference purposes,
the nonhydrostatic, hydrostatic non-rotating, and hydrostatic
rotating GW regimes, respectively. Both quadrants are sepa-
rated by a vertical dashed curve. The horizontal dashed line
ap
represents the non-distortion limit, where λZ and λZ should
coincide. According to both possibilities (the internal regions
defined by any of the green circles), in the case considered
(Fig. 10c), there are two possibilities, respectively indicating
an under- and an overestimation of λZ . This uncertainty can
be removed by inspection of Fig. 10 (T18).
Atmos. Meas. Tech., 11, 3523–3539, 2018 www.atmos-meas-tech.net/11/3523/2018/R. Hierro et al.: Orographic and convective gravity waves above the Alps and Andes Mountains 3537
Author contributions. RH, AdlT, AKS, PA, and PL designed the pects of the Wegener Center multi-satellite GPS radio occul-
study, performed computational implementation and analysis, per- tation record OPSv5.6, Atmos. Meas. Tech., 10, 4845–4863,
formed the numerical modeling, created the figures, and wrote the https://doi.org/10.5194/amt-10-4845-2017, 2017.
first draft of the paper. Barthlott, C., Corsmeier, U., Meißner, C., Braun, F., and Kottmeier,
AKS provided guidance on RO data and analysis aspects and C.: The influence of mesoscale circulation systems on triggering
contributed to finalizing the manuscript. convective cells over complex terrain, Atmos. Res., 81, 150–175,
PC provided recommendations and assistance in the WRF simu- 2006.
lations. Beres, J. H., Alexander, M. J., and Holton, J. R.: Effects of tro-
pospheric wind shear on the spectrum of convectively generated
gravity waves, J. Atmos. Sci., 59, 1805–1824, 2002.
Competing interests. The authors declare that they have no conflict Bica, B., Knabl, T., Steinacker, R., Ratheiser, M., Dorninger,
of interest. M., Lotteraner, C., Schneider, S., Chimani, B., Gepp,
W., and Tschannett, S.: Thermally and Dynamically In-
duced Pressure Features over Complex Terrain from High-
Special issue statement. This article is part of the special issue Resolution Analyses, J. Appl. Meteor. Clim., 46, 50–65,
“Observing Atmosphere and Climate with Occultation Techniques https://doi.org/10.1175/JAM2418.1, 2007.
– Results from the OPAC-IROWG 2016 Workshop”. It is a result Biondi, R., Neubert, T., Syndergaard, S., and Nielsen, J. K.: Radio
of the International Workshop on Occultations for Probing Atmo- occultation bending angle anomalies during tropical cyclones,
sphere and Climate, Leibnitz, Austria, 8–14 September 2016. Atmos. Meas. Tech., 4, 1053–1060, https://doi.org/10.5194/amt-
4-1053-2011, 2011.
Biondi, R., Randel, W. J., Ho, S.-P., Neubert, T., and Syndergaard,
S.: Thermal structure of intense convective clouds derived from
Acknowledgements. We are grateful to Riccardo Biondi (ISAC-
GPS radio occultations, Atmos. Chem. Phys., 12, 5309–5318,
CNR, Rome, Italy) for advice on cloud data and provision of the
https://doi.org/10.5194/acp-12-5309-2012, 2012.
cloud detection algorithm and the reference climatology. We thank
Biondi, R., Ho, S.-P., Randel, W., Syndergaard, S., and Neu-
Heimo Truhetz (WEGC, Graz, Austria) for help on WRF model
bert, T.: Tropical cyclone cloud-top height and vertical tem-
aspects. We acknowledge UCAR/CDAAC (Boulder, CO, USA)
perature structure detection using GPS radio occultation
for the provision of level 1a RO data and ECMWF (Reading,
measurements, J. Geophys. Res.-Atmos., 118, 5247–5259,
UK) for access to its analysis and short-term forecast data. We
https://doi.org/10.1002/jgrd.50448, 2013.
thank the Wegener Center processing team members, especially
Biondi, R., Steiner, A. K., Kirchengast, G., and Rieckh, T.:
Marc Schwärz (Wegener Center, Austria), for OPSv5.6 RO data
Characterization of thermal structure and conditions for over-
and his special support. This study was initiated by the Programme
shooting of tropical and extratropical cyclones with GPS
of Exchange and Cooperation for International Studies between
radio occultation, Atmos. Chem. Phys., 15, 5181–5193,
Europe and South America (PRECIOSA) through funding of a
https://doi.org/10.5194/acp-15-5181-2015, 2015.
research visit of Rodrigo Hierro to the Wegener Center (University
Biondi, R., Steiner, A. K., Kirchengast, G., Brenot, H., and Rieckh,
of Graz, Graz, Austria). This paper has been funded by the
T.: Supporting the detection and monitoring of volcanic clouds:
Austrian Science Fund (FWF) under research grant P27724-NBL
a promising new application of Global Navigation Satellite
(VERTICLIM). The study has been supported by the CONICET
System radio occultation, Adv. Space Res., 60, 2707–2722,
under grants CONICET PIP11220120100034 and ANPCYT PICT
https://doi.org/10.1016/j.asr.2017.06.039, 2017.
2013-1097.
Clark, T. L., Hauf, T., and Kuettner, J. P.: Convectively forced
internal gravity waves: Results from two-dimensional numer-
Edited by: Jens Wickert
ical experiments, Q. J. Roy. Meteor. Soc., 112, 899–925,
Reviewed by: two anonymous referees
https://doi.org/10.1002/qj.49711247402, 1986.
de la Torre, A. and Alexander, P.: The interpretation of wavelengths
nd periods as measured from atmospheric balloons, J. Appl. Me-
References teorol., 34, 2747–2754, 1995.
de la Torre, A., Daniel, V., Tailleux, R., and Teitelbaum,
Alexander, M. J.: The gravity wave response above deep convection H.: A Deep Convection Event above the Tunuyán
in a squall line simulation, J. Atmos. Sci., 52, 2212–2226, 1995. Valley near the Andes Mountains, Mon. Weather
Alexander, P., de la Torre, A., and Llamedo, P.: The in- Rev., 132, 2259–2268, https://doi.org/10.1175/1520-
terpretation of gravity waves signatures extracted from 0493(2004)1322.0.CO;2, 2004.
GPS radio occultations, J. Geophys. Res., 113, D16117, de la Torre A., Alexander, P., Llamedo, P., Menéndez, C.,
https://doi.org/10.1029/2007JD009390, 2008. Schmidt, T., and Wickert, J.: Gravity waves above an-
Alexander, P., de la Torre, A., Llamedo, P., Hierro, R., Schmidt, des detected from GPS radio occultation temperature pro-
T., Haser, A., and Wickert, J.: A method to improve the files. II: jet mechanism?, Geophys. Res. Lett., 33, L24810,
determination of wave perturbations close to the tropopause https://doi.org/10.1029/2006GL027343, 2006.
by using a digital filter, Atmos. Meas. Tech., 4, 1777–1784, de la Torre, A., Hierro, R., Llamedo, P., Rolla, A., and
https://doi.org/10.5194/amt-4-1777-2011, 2011. Alexander, P.: Severe hail storms near southern andes in the
Angerer, B., Ladstädter, F., Scherllin-Pirscher, B., Schwärz, M.,
Steiner, A. K., Foelsche, U., and Kirchengast, G.: Quality as-
www.atmos-meas-tech.net/11/3523/2018/ Atmos. Meas. Tech., 11, 3523–3539, 2018You can also read