Rock glacier characteristics serve as an indirect record of multiple alpine glacier advances in Taylor Valley, Antarctica
←
→
Page content transcription
If your browser does not render page correctly, please read the page content below
The Cryosphere, 14, 1–16, 2020
https://doi.org/10.5194/tc-14-1-2020
© Author(s) 2020. This work is distributed under
the Creative Commons Attribution 4.0 License.

Rock glacier characteristics serve as an indirect record of multiple
alpine glacier advances in Taylor Valley, Antarctica
Kelsey Winsor1,a , Kate M. Swanger1 , Esther Babcock2 , Rachel D. Valletta3,b , and James L. Dickson4,c
1 Department  of Environmental, Earth and Atmospheric Sciences, University of Massachusetts Lowell,
Lowell, MA 01854, USA
2 Logic Geophysics & Analytics LLC, Anchorage, AK 99508, USA
3 Department of Earth and Environmental Sciences, University of Pennsylvania, Philadelphia, PA 19104, USA
4 Department of Earth, Environmental and Planetary Sciences, Brown University, Providence, RI 02912, USA
a now at: School of Earth and Sustainability, Northern Arizona University, Flagstaff, AZ 86005, USA
b now at: Franklin Institute, Philadelphia, PA 19103, USA
c now at: Division of Geological and Planetary Sciences, California Institute of Technology, Pasadena, CA 91125, USA

Correspondence: Kate M. Swanger (kate_swanger@uml.edu)

Received: 3 June 2019 – Discussion started: 18 June 2019
Revised: 2 November 2019 – Accepted: 4 November 2019 – Published: 2 January 2020

Abstract. The geomorphic record indicates that alpine              1   Introduction
glaciers in the McMurdo Dry Valleys of southern Victoria
Land, Antarctica, appear to advance during interglacial peri-
ods in response to ice-free conditions in the Ross Sea. Few        Alpine glaciers in East Antarctica’s McMurdo Dry Valleys
records of these advances are preserved and/or subaerially         (Fig. 1) are important components of the regional hydrologic
exposed, complicating the interpretations of regional glacier      cycle (Lyons et al., 1998). In some areas, recent warming has
response to climate changes. Here, we present geophysical          caused melting of both alpine glaciers and ground ice, sug-
and geochemical analyses of a rock glacier that originates         gesting that modern ice behavior in the Dry Valleys might
from icefalls fed by alpine Doran Glacier in central Tay-          reflect global temperature changes (Fountain et al., 2006;
lor Valley. The rock glacier exhibits a trend of increased         Hoffman et al., 2016). Partnered with an increase in both
weathering of granitic clasts via ventifaction and grussifica-     stream incision rates and lake levels throughout Taylor and
tion down-flow. Meltwater ponds on the rock glacier exhibit        surrounding valleys, this activity has suggested an invigora-
variable salinity that ranges from freshwater to higher than       tion of modern Dry Valley hydrology (Fountain et al., 2014;
seawater, with the highest salinity pond near the rock glacier     Guglielmin and Cannone, 2012; Levy et al., 2013; Macdonell
toe. Ground-penetrating radar analyses reveal the feature to       et al., 2013). However, the geologic record of Dry Valley
possess a primarily clean ice interior, with layers of englacial   alpine glacier behavior previous to the Holocene is gener-
debris. Stable isotopic data from three ice cores support a        ally limited to isolated moraines and proglacial lake deposits
glacial origin for the ice within the rock glacier. These data     that indicate prior glacial advances (e.g., Higgins et al., 2000;
suggest that the current morphology of the rock glacier is the     Swanger et al., 2017).
result of multiple events of increased ice contribution caused        Here, we examine a Taylor Valley rock glacier that extends
by advances of Doran Glacier, which is the main source of          from an icefall fed by alpine Doran Glacier of the Kukri
ice to the rock glacier. We therefore demonstrate the poten-       Hills (Figs. 1 and 2). Rock glaciers (flowing mixtures of
tial of ice-cored rock glaciers to record multiple advances        ice, rock, and sediments) are common throughout the Dry
and retreats of Dry Valley glaciers, permitting the interpreta-    Valleys and other ice-free regions in Antarctica (Fukui et
tion of glacial responses to Pleistocene and Holocene climate      al., 2008; Hassinger and Mayewski, 1983); however their
change even where direct records are not present.                  age, origin, and geomorphic significance remains poorly con-
                                                                   strained in many locations. In general, rock glaciers can form

Published by Copernicus Publications on behalf of the European Geosciences Union.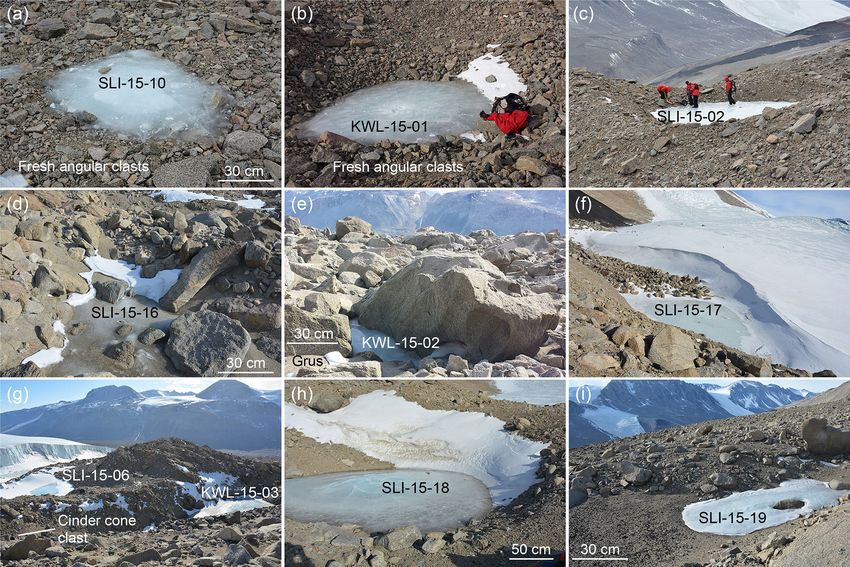
2                                                                                   K. Winsor et al.: Rock glacier characteristics

Figure 1. Satellite image of the McMurdo Dry Valleys (MDV), with inset indicating location in Antarctica. HG: Hughes Glacier; SG: Sollas
Glacier; DG: Doran Glacier; and MG: Marr Glacier. The red rectangle shows the location of rock glacier (Fig. 2). Public domain Landsat 7
imagery acquired on 18 December 1999 courtesy of NASA Goddard Space Flight Center.

through periglacial processes (permafrost and ice-rich talus)         Glacier from the smaller Doran Glacier, which flows north,
and through glacial processes (burial of glacier ice by talus         is ∼ 3 km long, and terminates at ∼ 840 m a.s.l. (Figs. 1 and
and alluvium) (Anderson et al., 2018; Clark et al., 1998;             2).
Hamilton and Whalley, 1995; Knight et al., 2019). There-                 Along its lower eastern margin, the Sollas Glacier termi-
fore, rock glaciers might provide information on past glacial         nates against a small, ice-cored moraine that includes strati-
fluctuations, permafrost development and degradation, and             fied, dipping sediments (Fig. 2). Adjacent to the eastern mar-
erosion rates.                                                        gin of Sollas Glacier lies a narrow gulley with unconsoli-
   At the study location in Taylor Valley, because ice is fed         dated debris and isolated large boulders. The east side of
to the rock glacier from the lateral margin of Doran Glacier,         the gulley is diamict-covered bedrock, which forms a steep
intervals of rock glacier growth and advance are limited by           slope that rises above the Sollas Glacier surface (Higgins
the extent of Doran Glacier and its ability to advance to the         et al., 2000). At the top of this slope is the rock glacier.
top of a bedrock cliff (Fig. 3). To identify discrete episodes of     Because the ice-cored debris and exposed icefalls are geo-
Doran Glacier advance, we examine the internal structure us-          morphically connected, both are included in the mapped ex-
ing ground-penetrating radar (GPR), stable isotopic and ma-           tent for the rock glacier (Fig. 2). The rock glacier extends
jor ion chemistry of buried ice and meltwater ponds, and sur-         ∼ 1.2 km from ∼ 1000 to 550 m a.s.l., beginning at the Do-
face weathering characteristics of the associated rock glacier.       ran Glacier icefalls. The surface of the uppermost ∼ 600 m
This rock glacier provides a unique chronological marker be-          of the rock glacier is currently exposed ice. Blocks of ice,
cause it records multiple generations of rock glacier advance,        both with and without bubbles, and cobble- to boulder-sized
which in turn record multiple advances and retreats of its            clasts are present in this upper section of the rock glacier.
source glacier.                                                       The lowermost ∼ 600 m of the rock glacier is debris covered
                                                                      (Fig. 2). The debris-covered section has a concentric lobate
                                                                      form with hummocks and multiple steps and risers, indica-
2   Geologic setting                                                  tive of active flow. Surface debris cover is generally thin,
                                                                      ranging from several centimeters in the upper portion of the
Taylor Valley is the most well-studied area of the Dry Val-           rock glacier to > 30 cm near the toe (sediment cover thickens
leys, an arid region predominantly free of surface ice (Fig. 1).      down-flow). Contraction cracks occur throughout the feature,
At the western end of the valley, Taylor Glacier flows from           and in at least one location clean ice is exposed within a ver-
the Taylor Dome of the East Antarctic Ice Sheet, and to the           tical crack, showing the sharp contact between the buried ice
east the valley is bounded by the Ross Sea. Taylor Glacier            and the overlying sediments. Along the eastern margin of
terminates ∼ 35 km from the Ross Sea coast, into the west             the upper rock glacier, a steep-walled ice-cored ridge (sim-
lobe of Lake Bonney, a 40 m deep, stratified lake with a high         ilar in morphology to an ice-cored moraine) extends up-flow
salinity gradient (Poreda et al., 2004; Wagner et al., 2010).         for ∼ 300 m, buttressing the eastern margin of the modern
South of this lake, a 15–20◦ slope rises ∼ 200 m to a bedrock         exposed ice (Figs. 2 and 3b). The height of the rock glacier
platform. Here, Sollas Glacier flows north for ∼ 8 km from            could be estimated along the western margin where it termi-
the Kukri Hills and spreads onto a low-angle bench, reaching          nates on an exposed bedrock surface. At this location, the
a width of ∼ 1400 m and terminating at ∼ 440 m a.s.l. (above          rock glacier margin is 10–12 m in height.
sea level). To the east, a steep-walled arête separates Sollas

The Cryosphere, 14, 1–16, 2020                                                                 www.the-cryosphere.net/14/1/2020/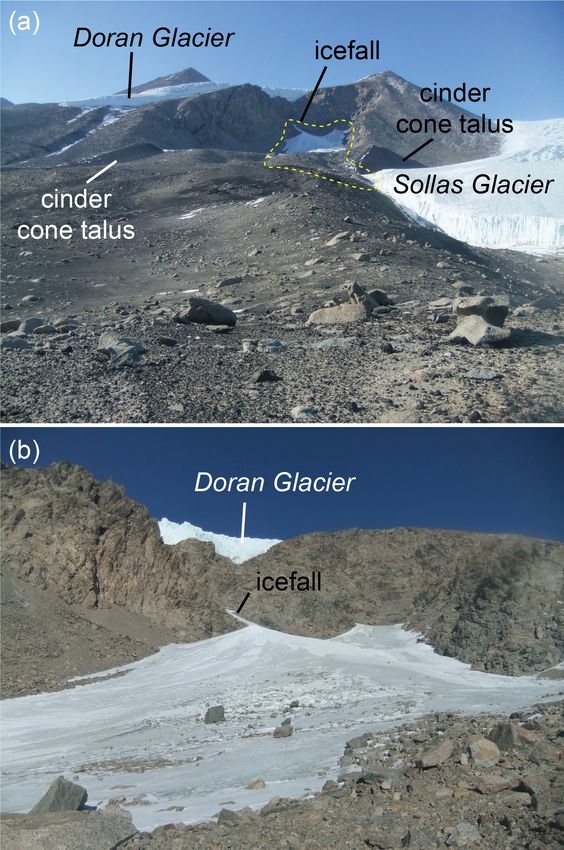
K. Winsor et al.: Rock glacier characteristics                                                                                           3

                                                                       Figure 3. Icefall originating from Doran Glacier and accumulating
                                                                       to form the rock glacier. (a) View from base of Sollas Glacier, with
                                                                       rock glacier visible within yellow dashed line. Note presence of
Figure 2. Geomorphic map of the modern rock glacier (outlined          cinder cone talus slopes. (b) View from boundary between debris-
in the large black dashed line) and surrounding terrain. Contour in-   covered ice and the modern exposed icefalls.
terval: 50 m. Ice cores SLI-15-01, SLI-15-04, and SLI-15-05 are
from buried ice (labeled 1, 4, and 5). SLI-15-02 and SLI-15-03,
and SLI-15-06 and SLI-15-07 are duplicate cores taken from two
large frozen ponds (only 2 and 6 labeled). Ground-penetrating radar    der cones, several mafic dikes visibly cross-cut the granitic
(GPR) lines are shown in green; one line transverse to rock glacier    bedrock of the arête east of Doran Glacier (Fig. 3a). Just to
flow (Fig. 10) and two lines longitudinal to flow (Fig. 11).           the northeast of the rock glacier is a grussified granitic boul-
                                                                       der field with significant ventifaction, and the landscape is
                                                                       incised by a network of contraction cracks.
   Nearly vertical bedrock cliffs (∼ 100 m in height) divide
Doran Glacier from the rock glacier and are the main source            2.1   Glacial history of Taylor Valley
of rockfall material to the landform. This region of Tay-
lor Valley is dotted with extinct Pliocene–Pleistocene cinder          Geomorphic evidence for Taylor Glacier advances occurs on
cones 40 Ar / 39 Ar dated by Wilch et al. (1993). These cin-           the Taylor Valley walls and floor. Recent advances of Dry
der cones also serve as source material for talus near Sollas          Valley outlet and alpine glaciers are correlated with the pres-
and Doran glaciers. To the southwest of the rock glacier is a          ence of open water in the Ross Sea, which occurs during
very steep cinder cone talus slope dated to 2.19 ± 0.04 Ma             interglacial periods when the Ross Ice Shelf retreats (Naish
(Fig. 3a), which, while topographically isolated from the              et al., 2009). Thus, the outlet Taylor Glacier, in addition to
rock glacier at present, may have sourced mafic cobbles to             the smaller alpine glaciers, appear to reach relative max-
the rock glacier area in the past. A second cinder cone, dated         ima during warm intervals due to higher precipitation and/or
to 3.57±0.14 Ma, is located east of the rock glacier (Fig. 3a).        lower ablation rates (Higgins et al., 2000; Hoffman et al.,
North of the rock glacier, where the ground surface flattens           2016; Marchant et al., 1994; Swanger et al., 2017). Algal
to nearly horizontal, the ground cover is dominated by mafic           carbonates originating in proglacial lakes suggest that Tay-
cobbles. These cobbles are commonly polished, sculpted,                lor Glacier advanced during Marine Isotope Stages (MIS)
and/or pitted and are often underlain by salt efflorescences           5, 7, 9, and possibly 11 (Higgins et al., 2000). The silt-
that can reach over 5 mm in thickness. In addition to the cin-         and clay-rich Bonney drift marks the Taylor Glacier mar-

www.the-cryosphere.net/14/1/2020/                                                                    The Cryosphere, 14, 1–16, 2020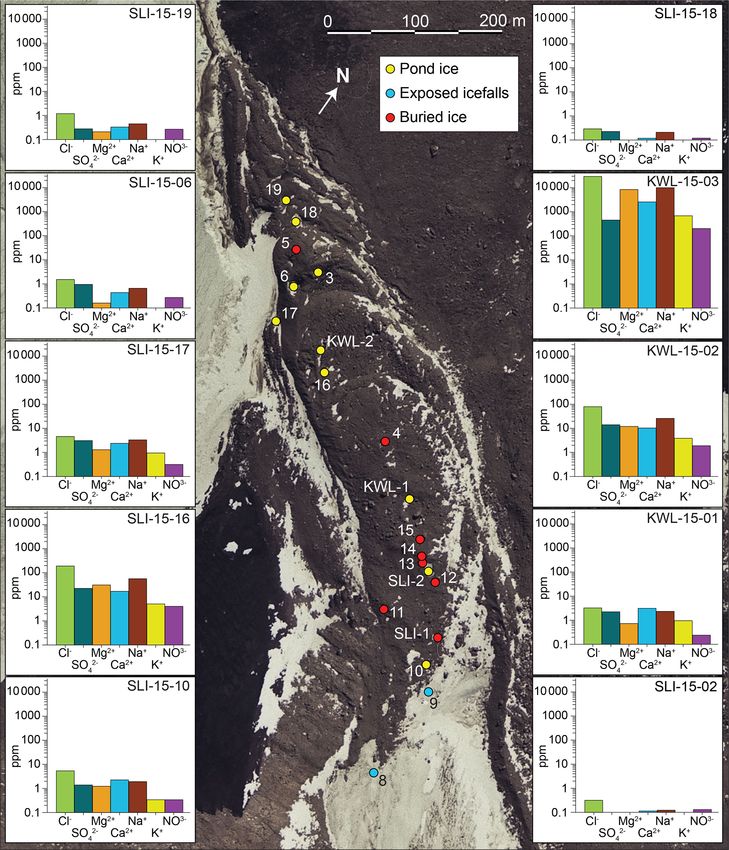
4                                                                              K. Winsor et al.: Rock glacier characteristics

gin maximum during the last interglacial and is found up to      3.2     Major ion analyses
∼ 300 m a.s.l. in central Taylor Valley (∼ 140 m below the
Sollas Glacier toe) (Higgins et al., 2000). Using cosmogenic     Samples were stored frozen in HDPE bottles in the field, dur-
3 He exposure dating, Swanger et al. (2017) correlated the       ing transit, and in the laboratory. When ready for processing,
outermost moraine associated with Stocking Glacier (17 km        samples were thawed and two aliquots were removed – one
west of Sollas Glacier) to an advance during MIS 11 (Fig. 1).    for cation and one for anion analyses. The aliquot allocated
High-elevation deposits of Taylor and Ferrar outlet glaciers     for cation analyses was acidified with ∼ 0.5 % trace-metal-
have also been dated to approximately 3–4 Ma (Staiger et al.,    grade HCl. Major ion analyses were performed at the Univer-
2006; Swanger et al., 2011). Many other geologic records         sity of Colorado Boulder, using ion chromatography for an-
of local ice advance and retreat are restricted to the last      ion samples and an inductively coupled plasma optical emis-
20 000 years and show Holocene advances, which in many           sion spectrometer (ICP-OES) for cation samples. Species an-
cases surpass glacial extents in MIS 2 (Christ and Bierman,      alyzed were Br− , Ca2+ , Cl− , F− , Fe, K+ , Mg2+ , Mn, Na+ ,
                                                                                   3−             2−
2019; Hall et al., 2000).                                        NO−        −
                                                                     2 , NO3 , PO4 , Si, and SO4 .

                                                                 3.3     Stable isotope analyses
3     Methods
                                                                 All ice samples were kept frozen until melted in airtight con-
3.1    Ice coring and sampling                                   tainers and then stored in 4 mL HDPE bottles. All bottles
                                                                 were pre-rinsed in a 10 % ACS-grade nitric acid bath and
We extracted seven shallow ice cores of buried ice and frozen    triple rinsed with deionized water before packing, when the
meltwater ponds along a 500 m long transect down the cen-        samples were sealed and refrozen until analyzed. Stable iso-
terline of the rock glacier in early November 2015. Three of     topic analyses (n = 78) were conducted using an isotope ra-
the cores (SLI-15-01, SLI-15-04, and SLI-15-05) were from        tio mass spectrometer at the Boston University Stable Iso-
buried ice and measured 1.5–2.3 m in length (Figs. 2 and 4       tope Laboratory. Analyses for δ 18 O were performed via CO2
and Table 1). The remaining four cores (SLI-15-02, SLI-15-       equilibration, and deuterium analyses were performed via
03, SLI-15-06, and SLI-15-07) were taken from two frozen         pyrolysis using a GVI ChromeHD™system. Analytical pre-
ponds on the surface of the rock glacier, and each measured      cision for both measurements is typically ±0.1. Isotope val-
< 1.5 m. Core SLI-15-03 was a duplicate of SLI-15-06, and        ues are presented as per mil (‰) relative to Vienna Standard
core SLI-15-07 was a duplicate of -06. The depth of coring       Mean Ocean Water (VSMOW).
was limited by debris and equipment. Ice cores were taken
with a 7.6 cm diameter SIPRE hand auger. In addition to the      3.4     Ground-penetrating radar
seven ice cores, 15 hand samples were gathered from the
upper 15 cm of the buried ice, the surface ponds, and the        3.4.1    Data collection
exposed icefalls of the modern glaciers, Doran and Sollas.
(Tables 1 and 2). Frozen hand samples were collected us-         We used a Geophysical Survey Systems, Inc. (GSSI) ground-
ing a clean, stainless-steel ice pick or a trowel covered in a   penetrating radar (GPR) system with a SIR-3000 controller
clean Whirl-Pak bag. Buried ice hand samples were gathered       to image the subsurface at the field site. We surveyed one lon-
from 5 to 15 cm depth after removing the upper 5 cm. All         gitudinal transect (500 m), composed of multiple lines, down
surface pond samples were taken from 3 to 5 cm depth in the      the rock glacier from the highest ice core site to the lowest
center of the pond ice, after manually removing the upper        (Fig. 2). We also collected one west–east transverse GPR line
3 cm of ice. All ponds, except L3, were frozen at the time       (120 m) at the boundary between debris-covered ice and ex-
of sampling. Pond L3 was beginning to thaw and a ∼ 10 cm         posed ice. The line extends across ∼ 20 m of debris-covered
layer of slush-ice topped solid ice below. Despite this early    ice and then onto the modern icefalls, stopping at the base
thaw, the ice was solid enough to walk on and we sampled         of the east-lateral ice-cored ridge (Fig. 2). We collected data
slush-ice from the pond center at 3–5 cm depth. All sam-         with 200 MHz and 400 Mz shielded antenna units, which are
ples were packed frozen in sterile Whirl-Pak bags. From Mc-      both configured in a single housing unit. For 200 MHz an-
Murdo Station, samples were shipped frozen to the Univer-        tenna, we took 2048 samples per trace, with a time window
sity of Massachusetts Lowell (if sediment-rich) or the Na-       of 350–700 ns and trace spacing of 0.05 m. The same sample
tional Ice Core Laboratory (NICL) in Lakewood, Colorado          parameters for the 400 MHz antenna were 4096 samples per
(if relatively clean). Subsamples for isotopic and elemental     trace, 150–500 ns window, and 0.1 m trace spacing. For both
analyses were collected using the facilities at NICL, where      antennae, stacking was four and trace gain was −20 dB.
laboratory storage freezers maintained sample temperatures          Typical surface roughness of rock glaciers prevents effec-
below −20 ◦ C.                                                   tive ground coupling of the radar system. This reduced cou-
                                                                 pling degrades the depth of the signal penetration and the
                                                                 quality of the radargram. To combat these problems, before
                                                                 each line collection we removed surface clasts > 0.1 from the

The Cryosphere, 14, 1–16, 2020                                                           www.the-cryosphere.net/14/1/2020/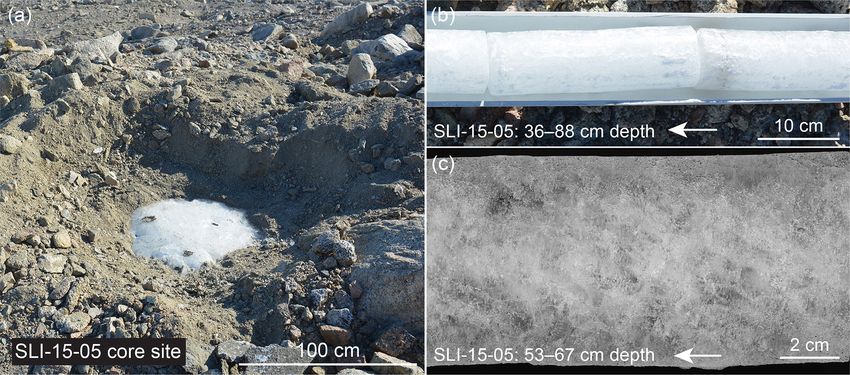
K. Winsor et al.: Rock glacier characteristics 5
Figure 4. Buried ice core SLI-15-05. (a) Excavation of ∼ 30 cm of sand- and boulder-rich sediments above buried ice, exposing sharp contact
between sediments and ice surface. (b) Buried ice core pictured in the field, 36–88 cm depth below ice surface; up-core is to the left (shown
with arrow). (c) Buried ice core (53–67 cm depth) after being cut vertically at NICL. At this depth, buried ice contained many gas inclusions
and no sediments.
GPR travel path and smoothed the surface sediment where 4 Results
possible. However, in places where clasts were frozen to the
surface or too large to move, data quality was unavoidably 4.1 Rock weathering trends
degraded. We surveyed the start and end points of each GPR
line with a handheld GPS receiver. We also marked the lo- The most abundant lithology on the rock glacier surface is
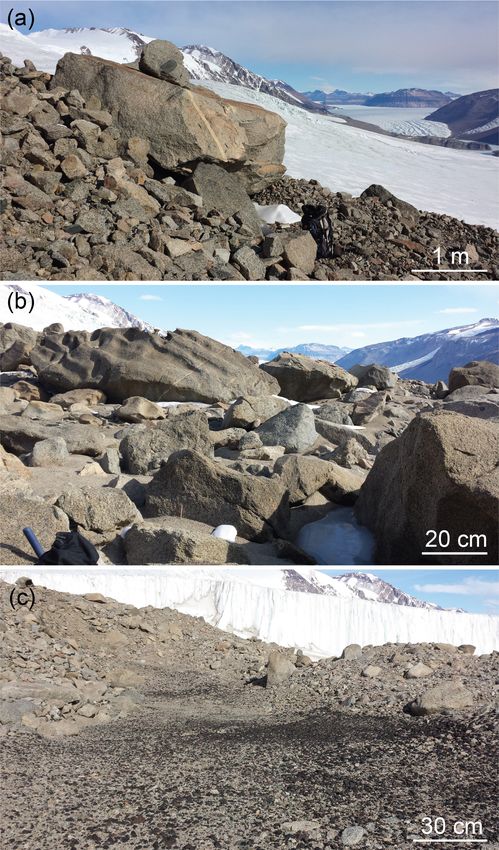
cations in the data files that corresponded to coring sites. Fi- granite (Figs. 5 and 6). In the upper half of the rock glacier,
nally, after each line collection, we surveyed the slope along granitic clasts are primarily cobble- to boulder-size, suban-
the line with a Brunton pocket transit and replaced all boul- gular to very angular, and generally lacking in evidence of
ders. ventifaction (Figs. 5a, b and 6a). Occasional large boulders
exhibit ventifact pitting, although these may be relict fea-
3.4.2 Data processing tures inherited from in situ weathering while exposed along
the cliff below Doran Glacier (e.g., Fig. 3b). In some ar-
Initial data processing steps were (i) dewow to remove very- eas, packed, angular pebbles are present between larger clasts
low-frequency components from the recorded data (Annan, (Fig. 5b). On the distal sector of the rock glacier, the charac-
2005), (ii) distance normalization to correct for odometer er- ter of surface clasts changes markedly. Granitic boulders are
rors (Shean and Marchant, 2010), and (iii) time-zero correc- rounded and in some cases ventifaction and/or salt weather-
tion to the first peak of the direct arrival (Yelf and Yelf, 2007). ing has caused the development of surface pitting (Fig. 6b).
We then filtered the data with a bandpass frequency fil- The ground cover is grus, dominated by gravels and coarse
ter (200 MHz: 50–100–400–800 MHz; 400 MHz: 100–200– sands (Figs. 5d, h and 6c). Where snowdrifts are protected
1000–2000 MHz), which was followed by background sub- by boulders, salt efflorescences and crusts can be found. Al-
traction to enhance signal-to-noise ratio. Finally, we gained though cinder cone clasts are rare on the upper rock glacier,
the data to enhance deeper reflections and cut the data to the the lower rock glacier hosts patches of this material (Figs. 5i
useful time window. After these steps, analysis of diffraction and 6c), particularly in depressions that hold small ponds or
hyperbolas provided radar-wave velocity estimates (Shean appear to have held them in the past (evidenced by salt de-
and Marchant, 2010). We used this velocity to apply topo- posits). Pebble- to cobble-sized cinder cone clasts cover these
graphic migration and topographic corrections to each line depressions in a loose, poorly developed desert pavement.
using surface profiles from the Brunton measurements. All Occasional boulders of cinder cone material are also present
data processing occurred with Reflex-2D processing soft- on the lower rock glacier (Fig. 5g).
ware (Sandmeier, 2008).
4.2 Major ion concentrations
Based on repeat aerial photography from 1956 to the present,
all of the surface ponds on the rock glacier vary in size, gen-
erally reaching minima in the 1970s and 1980s. Five of the
www.the-cryosphere.net/14/1/2020/ The Cryosphere, 14, 1–16, 2020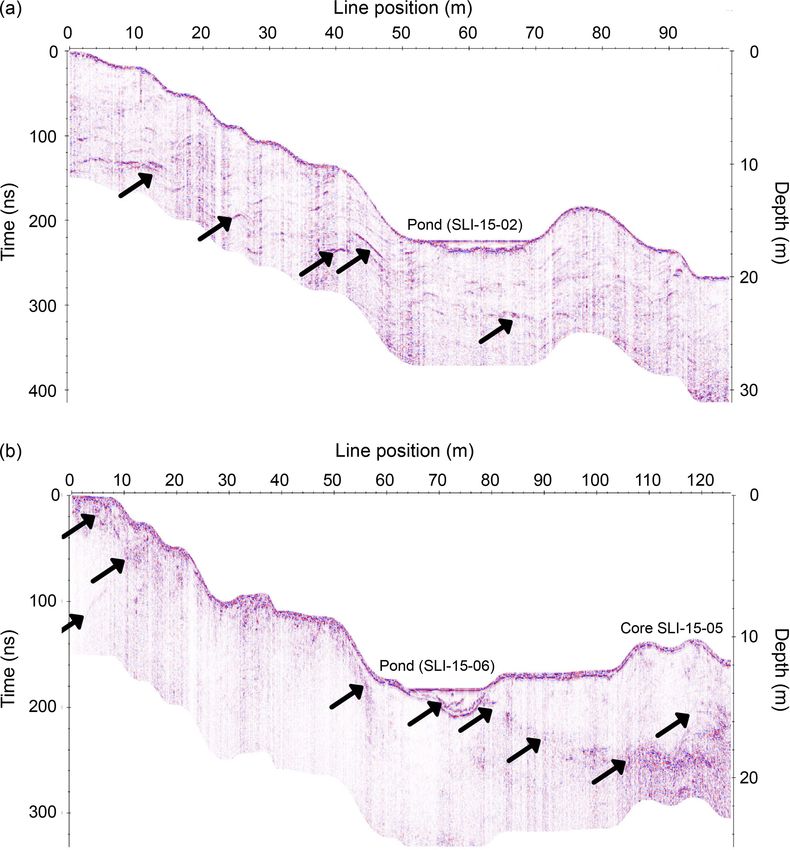
6                                                                                                                 K. Winsor et al.: Rock glacier characteristics

Table 1. Alpine glacier and rock glacier ice sample descriptions.

      Sample                  Latitude       Longitude         Elevation        Site description2                                 Ice core/sample description3
                                   (S)             (E)         (m a.s.l.)1
      SLI-15-01             77.71722         162.63182                 740      Debris ∼ 10 cm thick, fresh granitic              Ice core. 151 cm long.
                                                                                clasts, angular, few to no fines.                 Clean ice, gas inclusions.
      SLI-15-04             77.71628         162.62518                 670      Debris ∼ 20 cm thick, fresh and                   Ice core. 156 cm long.
                                                                                weathered granite, angular and                    Clean ice, gas inclusions. Debris
                                                                                rounded clasts, sand-rich matrix.                 band at 130–135 cm depth.
      SLI-15-05             77.71537         162.61561                 610      Debris ∼ 30 cm thick, fresh and                   Ice core. 228 cm long.
                                                                                weathered granite, rounded clasts,                Clean ice, gas inclusions. Debris
                                                                                sand-rich matrix.                                 bands at 12, 70, 170, 190 cm depth.
      SLI-15-08             77.71836         162.63216                 780      Exposed ice at the boundary                       Hand sample. 5 cm depth
                                                                                between icefalls and buried ice.                  A: clean ice, gas inclusions.
                                                                                                                                  B and C: clean ice, no gas inclusions.
      SLI-15-09             77.71760         162.63239                 760      Exposed ice at the boundary                       Hand sample.
                                                                                between icefalls and buried ice.                  A: clean ice, gas inclusions.
                                                                                                                                  B: clean ice, no gas inclusions.
      SLI-15-11             77.71759         162.62913                 730      Debris ∼ 20 cm thick, fresh and                   Hand sample from an exposed con-
                                                                                weathered granitic clasts, sand                   traction crack. Clean ice. 15 cm
                                                                                matrix.                                           depth below ice–sediment boundary.
      SLI-15-12             77.71699         162.62979                 720      Debris ∼ 10 cm thick, fresh                       Hand sample from buried ice
                                                                                angular granitic clasts, sands.                   ∼ 60 cm up-flow from pond SLI-15-
                                                                                                                                  02. Clean ice. 5 cm depth.
      SLI-15-13             77.71694         162.62891                 720      Debris ∼ 5 cm thick, fresh angular                Hand sample from buried ice ∼ 2 m
                                                                                granitic clasts, sands.                           down-flow from pond SLI-15-02.
                                                                                                                                  Clean ice. 5 cm depth.
      SLI-15-14             77.71689         162.62882                 720      Debris ∼ 10 cm thick, fresh angular               Hand sample from buried ice ∼ 10 m
                                                                                granitic clasts, sands.                           down-flow from pond SLI-15-02.
                                                                                                                                  Clean ice. 5 cm depth.
      SLI-15-15             77.71676         162.62831                 700      Debris ∼ 5 cm thick, fresh and                    Hand sample from buried ice. Clean
                                                                                weathered angular granitic clasts,                ice. 5 cm depth.
                                                                                sands.
      Doran Glacier         77.71481         162.65637                 880      Left lateral terminus.                            Hand sample from glacier terminus.
                                                                                                                                  Clean ice.
      Sollas Glacier        77.71402         162.60377                 530      Right lateral terminus.                           Hand sample from glacier terminus.
                                                                                                                                  Clean ice.
    1 Meters above sea level is denoted m a.s.l. 2 Thickness and sedimentology of overlying debris. 3 Length of ice core. Presence of gas inclusions and debris bands in buried ice.
    Depth of sampling.

ponds (KWL-15-03, SLI-15-02, SLI-15-06, SLI-15-17, and                                          15-02, KWL-15-03, and SLI-15-16 ponds, whereas the low-
SLI-15-18) are persistent features in the aerial photographs,                                   est concentrations are present in SLI-15-02, SLI-15-18,
probably due to their relatively large sizes (Fig. 5c, f, g,                                    and SLI-15-19 (Fig. 8, Table S1 in the Supplement). Ra-
and h). The remaining sampled ponds are more ephemeral                                          tios of Ca2+ : Mg2+ , Ca2+ : (K+ + Na+ ), Ca2+ : Cl− , and
(KWL-15-01, KWL-15-02, SLI-15-10, SLI-15-16, and SLI-                                           SO2−       −
                                                                                                    4 : Cl decrease with increasing major ion concentra-
15-19). Meltwater pond major ion concentrations range from                                      tions (Fig. 7). The three ponds with the highest concentra-
those of freshwater to higher than those of seawater (Fig. 7                                    tions of Cl− also exhibit low ratios of (K+ + Na+ ) : Cl− rel-
and Table 3). These results are compared to the average ion                                     ative to the other ponds. The concentrations of Cl− and Na+
concentrations of seawater as described in Holland (1984).                                      in the most saline pond, KWL-15-03, are similar to that of
The highest major ion concentrations are found in the KWL-                                      seawater (Fig. 7a). Major ion concentrations are not corre-

The Cryosphere, 14, 1–16, 2020                                                                                                   www.the-cryosphere.net/14/1/2020/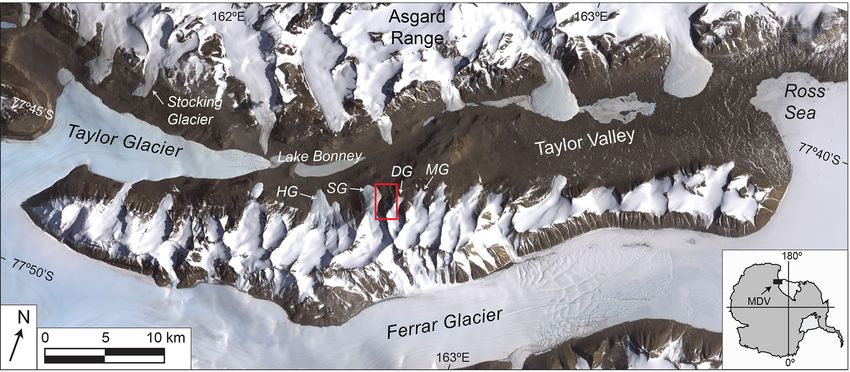
K. Winsor et al.: Rock glacier characteristics                                                                                                         7

Table 2. Location and description of sampled meltwater ponds.

          Lake ID1            Maximum lake              Latitude       Longitude         Elevation       Ground surface character
                              dimension (m)                  (S)             (E)         (m a.s.l.)2
          SLI-15-10                             2     77.71750         162.63167                 720     Fresh sands to boulders
          SLI-15-02                            16     77.71697         162.62921                 715     Fresh and weathered boulders
          KWL-15-01                             4     77.71660         162.62654                 650     Weathered boulders
          SLI-15-16                             1     77.71623         162.62037                 610     Weathered boulders and grus
          KWL-15-02                             2     77.71606         162.61954                 595     Weathered boulders and grus
          SLI-15-17                            25     77.71611         162.61694                 590     Fresh boulders and grus
          SLI-15-06                            13     77.71512         162.61662                 610     Weathered boulders and grus
          KWL-15-03                             8     77.71559         162.61745                 585     Weathered boulders and grus
          SLI-15-18                             7     77.71514         162.61486                 565     Weathered boulders and grus
          SLI-15-19                             3     77.71510         162.61375                 560     Weathered boulders, grus and basalt cobbles
        1 Lakes listed from south to north (upper rock glacier to terminus). 2 Meters above sea level.

Figure 5. Field images of the 10 sampled meltwater ponds along a longitudinal transect down the rock glacier. (a) SLI-15-10 (b) KWL-15-
01, (c) SLI-15-02, (d) SLI-15-16, (e) KWL-15-02, (f) SLI-15-17, and (g) SLI-15-06 (on left) and KWL-15-03 (on right), (h) SLI-15-18, and
(i) SLI-15-19. Pond SLI-15-17 occurs between the rock glacier margin and Sollas Glacier. Note the fresh appearance of granites surrounding
KWL-15-01 and SLI-15-10 and the grussified ground surface surrounding KWL-15-02 and SLI-15-16 and SLI-15-18.

www.the-cryosphere.net/14/1/2020/                                                                                         The Cryosphere, 14, 1–16, 2020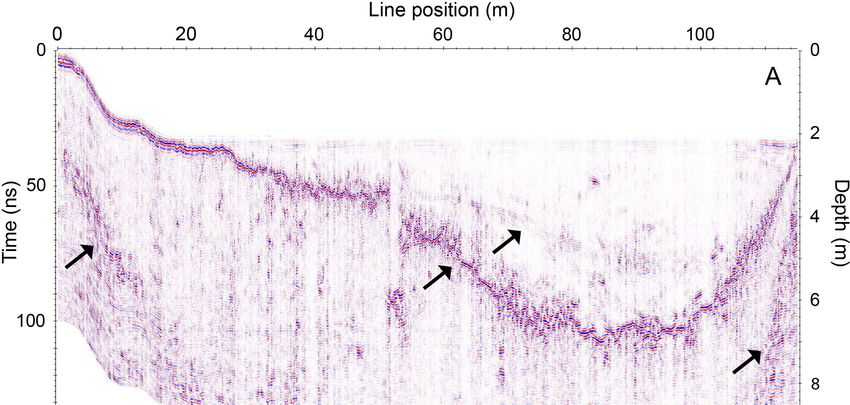
8                                                                                    K. Winsor et al.: Rock glacier characteristics

Figure 6. Surface lithology and weathering trend going down the
rock glacier. (a) Upper rock glacier, showing fresh, angular granitic
boulders and cobbles. (b) Central rock glacier, showing rounded
and ventifacted granitic boulders and a granitic grus ground cover.
(c) Lower rock glacier, showing smaller clast sizes and poorly de-
veloped desert pavement in a small depression with mixed granitic
and basalt ground cover.

lated with pond size. The three most saline ponds are located           Figure 7. (a) Scatter plot of Na+ vs. Cl− in 10 meltwater ponds.
in the lower rock glacier region; however, low-salinity ponds           Ternary diagrams of (b) Mg2+ , Ca2+ , and K+ + Na+ and (c) Cl− ,
also occur in the lower rock glacier. Major ions from sam-              SO2−
                                                                           4 , and Ca
                                                                                      2+ in meltwater ponds shown as percent by equiva-

ples collected from the lower margins of Doran Glacier and              lent.
Sollas Glacier show low total ion concentrations (Table 3).

4.3   Stable isotopes                                                   glaciers (Doran and Sollas) yield δ 18 O values from −30 ‰
                                                                        and −31 ‰, falling near the LMWL. Stable isotopic results
Stable isotopic analyses were conducted on 54 samples from              from the three buried ice cores vary compared to the four
the buried ice (49 from the ice cores and five from the hand            glacier ice samples, but they are within the values observed
samples), 15 samples from surface ponds, five samples from              from alpine glaciers in Taylor Valley (Gooseff et al., 2006).
the exposed icefalls, and four samples from Sollas and Do-              When plotted on a graph of δ 18 O vs. δD, all 49 samples from
ran glaciers (Table S2). Most of the ice samples fall near or           the three buried ice cores (SLI-15-01, SLI-15-04, and SLI-
slightly below the local meteoric water line (LMWL) de-                 15-05) fall on a slope of 7.7 with an R 2 value of 0.99. Sam-
fined by Gooseff et al. (2006) (Fig. 9). The local alpine               ples from meltwater ponds display a large isotopic variance,

The Cryosphere, 14, 1–16, 2020                                                                  www.the-cryosphere.net/14/1/2020/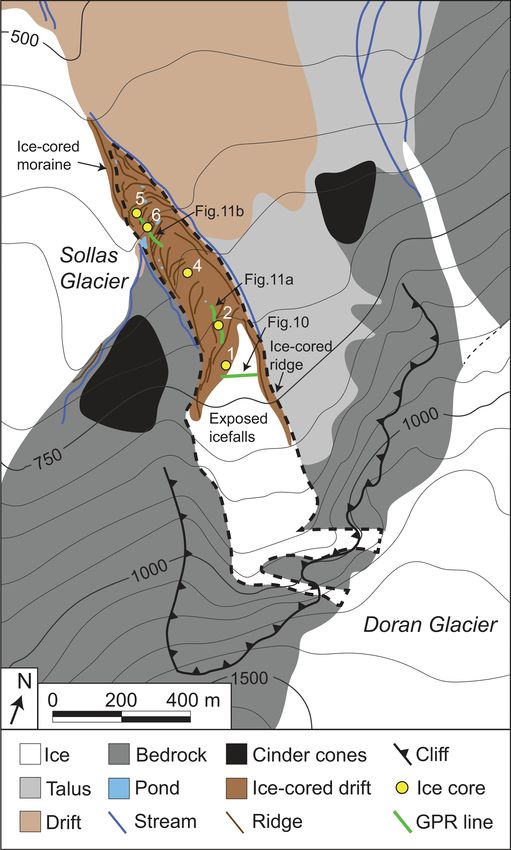
K. Winsor et al.: Rock glacier characteristics                                                                                                                       9

Table 3. Major ion results.

            Sample ID1                 Ca                Cl             K              Mg                 Na           NO3            SO4        Total major
                                    (ppm)             (ppm)          (ppm)           (ppm)             (ppm)          (ppm)         (ppm)        ions (ppm)
            Buried ice
            SLI-15-01
            0 cm                     3.232           15.883          0.461            1.581            6.324          0.567          3.918             32.921
            75 cm                    3.665           30.808          0.429            2.908            7.897          1.074          4.894             52.346
            114 cm                   2.357           30.654          1.643            3.725            8.427          1.156          1.607             50.586
            143 cm                   7.285           47.558          1.471            7.140           11.066          1.994          5.903             84.277
            SLI-15-04
            15 cm                    4.151            7.673          0.624            0.609             4.187         0.229         7.271              26.068
            65 cm                    5.044           11.027          0.427            1.123             5.595         0.284        13.205              37.216
            149 cm                   8.043           21.213          1.068            3.050             6.856         0.979        17.487              61.489
            SLI-15-05
            15 cm                    0.651            9.592                           0.140             5.810         0.499          1.044             18.150
            137 cm                   0.874           12.582          0.430            0.170             7.395         0.483          1.251             23.691
            210 cm                   0.907           14.379                           0.219             8.109         0.459          1.514             25.951
            SLI-15-08A               0.608            3.183          0.564            0.479             2.012         0.206          0.503              9.727
            SLI-15-08B               0.622            1.876                           0.439             1.067         0.227          0.373              6.293
            SLI-15-08C               0.284            1.951                           0.200             1.205         0.163          0.230              4.754
            SLI-15-09A               2.145           13.737          0.390            1.321             5.475         0.407          2.181             26.255
            SLI-15-09B               0.452            5.756          0.326            1.229             1.451         0.628          0.378             10.842
            SLI-15-11                6.109            9.607          0.650            1.067             5.764         0.481          5.772             33.950
            SLI-15-12                5.074            9.656          1.029            2.505             5.363         0.866          3.222             29.463
            SLI-15-13                4.701           17.819          0.435            2.406             5.499         1.078          5.607             38.311
            SLI-15-14                2.627            5.147          0.444            0.743             3.391         0.333          1.756             17.221
            SLI-15-15                2.659           17.882          0.751            2.426             3.843         1.494          3.383             34.652
            Ponds
            SLI-15-02
            0 cm                     0.100             0.320                          0.023             0.121         0.136          0.085              1.043
            21 cm                    0.166             0.105                          0.020             0.066         0.350          0.057              1.071
            53 cm                    0.081             0.061                          0.011             0.068         0.051          0.039              0.530
            74 cm                    0.105             0.375                          0.021             0.109         0.154          0.117              1.110
            SLI-15-06
            0 cm                   0.431            1.569                           0.153            0.687           0.285          0.973             4.335
            10 cm                  0.270            0.806                           0.083            0.391           0.248          0.491             2.618
            KWL-15-01              3.139            3.260           0.943           0.721            2.334           0.238          2.186            14.387
            KWL-15-02             10.226           80.281           3.960          11.920           26.572           1.903         14.030           150.938
            KWL-15-03           2675.000        31378.090         704.412        8826.545        10673.190         209.167        465.176         54979.690
            SLI-15-10              2.354            5.571           0.352           1.291            2.005           0.350          1.426            13.769
            SLI-15-16             17.600          193.816           5.295          32.458           57.004           4.166         23.134           334.064
            SLI-15-17              2.459            4.833           0.977           1.345            3.449           0.329          3.236            17.198
            SLI-15-18              0.122            0.301                           0.071            0.219           0.123          0.235             1.546
            SLI-15-19              0.338            1.217                           0.213            0.456           0.272          0.281             3.791
            Glaciers
            Doran Gl.                0.422              2.09                          0.590             0.762         0.348           0.48              5.898
            Sollas Gl.               1.564              1.93         0.525            0.913             1.138         0.340          8.747             18.059
          1 Depth below ice surface is listed in centimeters for ice cores (only SLI-15-01, SLI-15-02, SLI-15-04, SLI-15-05, and SLI-15-06). All other samples
          were gathered from 0 to 10 cm depth in buried ice or pond. Glacier samples are from margins. Where concentrations fall below detection limits, cells are
          left blank. Reported detection limits (ppm) were Ca (0.027), Cl (0.02), K (0.134), Mg (0.042), Na (0.027), NO3 (0.05), and SO4 (0.02). Total major ions
          are calculated as the sum of all 14 measured species (see Supplement).

www.the-cryosphere.net/14/1/2020/                                                                                               The Cryosphere, 14, 1–16, 2020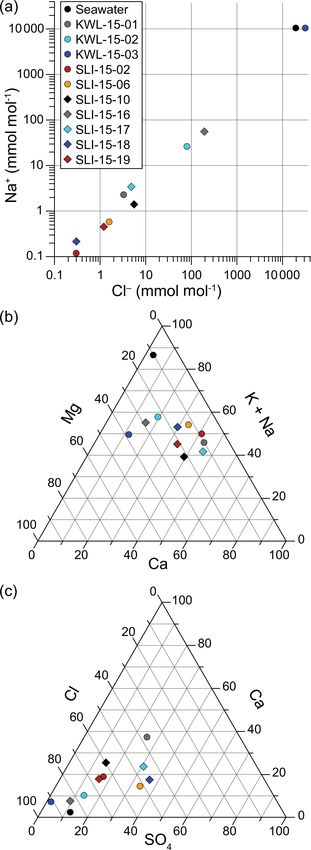
10                                                                              K. Winsor et al.: Rock glacier characteristics

with δ 18 O values ranging from −31 ‰ to −22 ‰. The pond           5.2   Rock glacier subsurface structure
samples fall below the LMWL on a slope of 6.0, with an R 2
value of 0.94.                                                     Ground-penetrating radar along the rock glacier (Fig. 2)
                                                                   shows clear subsurface structure and clean ice (selected
4.4    GPR                                                         radargrams shown in Figs. 10 and 11). As verified via field
                                                                   excavations, a contact between clean buried ice and overlying
Mean radar-wave velocity derived from analyses of diffrac-         sediments is commonly encountered at < 30 cm depth. This
tion hyperbolas throughout the data sets was approximately         interface between overlying unconsolidated sediments and
0.15–0.16 m ns−1 . Migrations using this velocity success-         the underlying clean ice containing scattered debris corre-
fully collapsed diffractions without introducing data artifacts    sponds with the shallowest reflection event in the radar data.
(Figs. 10 and 11). However, the overlying debris layer of          Where the longitudinal GPR transect crossed ice-coring lo-
typically less than 0.2 m thickness likely has a lower ve-         cations, we were able to correlate low GPR signal, or radar
locity. This layered velocity structure is a source of error       transparent regions (Brown et al., 2009), in the radargrams to
in our processing and subsequent analysis. In spite of the         the clean ice observed in the cores (Fig. 11). In the west–east
problems encountered with ground coupling due to surface           (transverse) line across the boundary between the exposed
roughness, effective depth of penetration after migration was      icefalls and the buried ice (Figs. 2 and 10), we observe the
10–20 m in the 400 MHz data and > 15 m in the 200 MHz              same characteristically low-signal areas in the radargram in-
data. The processed data exhibited coherent reflection events      terrupted by a prominent internal reflection event. This in-
within 0.1–0.2 m of the surface and below (Fig. 10). These         ternal reflection event highlights the signal quality and radar
reflection events generally appear as flat-lying and dipping       transparency of the materials above and below it. Addition-
reflectors separating portions of the radargrams with compar-      ally, the mean radar-wave velocity throughout our data set,
atively low signal content (Fig. 10). Two selected longitudi-      obtained from diffraction pattern analyses, is within 6 %
nal lines are shown in Fig. 11; all five longitudinal 400 MHz      of that of clean, freshwater ice (0.167 m ns−1 ). Finally, the
lines are provided in the Supplement.                              depth of penetration for both frequencies employed is triple
                                                                   or greater than that normally seen when using these frequen-
5     Discussion                                                   cies for rock or soil materials. This increased penetration
                                                                   is likely due to the low attenuation typically exhibited by
5.1    Stable isotopes and buried ice origin                       radar waves traveling through cold ice (Arcone et al., 1995).
                                                                   Combined, these observations support our GPR-derived in-
Stable isotopic data from the buried ice, pond, and alpine         terpretation that the rock glacier is primarily ice-cored. Near
glaciers support a glacial origin for the rock glacier ice, with   the boundary between the exposed icefalls and the debris-
some meltwater infiltration and reworking. Doran and Sollas        covered ice, ice thickness is > 6 m (Fig. 10), and near the toe
glaciers are isotopically similar and follow the general trend     of the rock glacier ice thickness is > 10 m in some locations
of Taylor Valley (more depleted isotopic values for inland         (Fig. 11).
glaciers compared to glaciers near the coast) (Gooseff et al.,        The prominent reflection events in the survey across the
2006). The modern glacier ice also falls around the median         exposed icefalls are interpreted to be internal debris layers.
isotopic values for all samples from the rock glacier region.      On the transverse line (Fig. 10), the primary reflection event
The pond ice is isotopically heavy with respect to oxygen          from the surface debris layer extends into the exposed icefalls
and plots well below the LMWL, indicating that it has ex-          and then dips upward toward the surface of the bounding ice-
perienced greater isotopic fractionation due to evaporation        cored ridge (on the eastern rock glacier margin). The reflec-
compared to the buried ice and glacier ice.                        tor maintains coherency particularly in the first meter of de-
   At the boundary between the icefalls and the debris-            scent away from the debris-covered ice (line positions from
covered ice, the sampled exposed ice (SLI-15-08 and SLI-           20 to 30 m), supporting our interpretation that it represents
15-09) is a mixture of bubble-rich ice clasts in a clear-ice       continuous internal debris. Thereafter, the layer maintains
matrix (Fig. 8). At these locations, the bubble-rich ice sam-      a consistent polarity indicative of the ice-debris–ice inter-
ples fall on the LMWL isotopically, whereas samples from           face, although it becomes less coherent. At the ∼ 50 m posi-
the clear-ice matrices fall below (Fig. 9). The bubble-rich        tion along the line, another internal reflection event separates
samples are likely preserved glacial ice. This interpretation      from the prominent debris layer and follows a similar (though
is supported by the presence of fine spherical gas inclusions      less steep) dip, joining the primary upward-dipping debris
and snow accumulation stratigraphy. Conversely, the clear-         layer at the ∼ 105 m line position. Below these prominent de-
ice matrices appear to be refrozen meltwater that has experi-      bris layers, more interpreted clean ice extends to at least the
enced minor evaporation fractionation.                             depth of signal penetration. Our observations also provide
                                                                   clear supporting evidence for a supraglacial source of en-
                                                                   trained debris that then travels englacially with rock glacier
                                                                   flow. This pattern of repetitive internal and upward-dipping

The Cryosphere, 14, 1–16, 2020                                                             www.the-cryosphere.net/14/1/2020/
K. Winsor et al.: Rock glacier characteristics 11 Figure 8. Aerial photo of the rock glacier with pond samples and buried ice samples. Cinder cone talus and the eastern margin of Sollas Glacier are both visible to the west of the rock glacier. Bar charts show major ion concentrations from 10 meltwater ponds (shown with yellow circles). All samples are labeled with their numbers only, except where the same sample numbers correspond to different samples (SLI-15-01 and SLI-15-02 vs. KWL-15-01 and KWL-15-02), labeled as SLI- and KWL-. Public domain aerial photograph from U.S. Geological Survey, TMA3084-V0132 taken in 1993. reflectors is evocative of previous work on the Dry Valley and Marchant, 2010). We were unable to core below the debris-covered glaciers Mullins and Friedmann (Mackay et ponds’ basal layers. In pond SLI-15-06 (Fig. 11b), two dis- al., 2014). tinct debris layers bounding the pond run parallel to each Throughout the longitudinal transect, we observed similar other, while a third dips upward more abruptly. The lack of internal reflectors and patterns, interpreted to be clean sub- signal in the rest of the radargram near this location indicates surface ice with entrained debris bands (arrows, Fig. 11). the presence of clean ice below the surface debris layer, with Dominant dip of englacial debris layers is toward the a few areas having some entrained debris. Down the rock toe of the rock glacier, corresponding to our interpreta- glacier from the pond, it appears that this basal pond debris tion of passive entrainment and subsequent redistribution of layer becomes further entrained and migrates down-flow. supraglacial debris. Where the longitudinal transect crosses The GPR data support multiple advances and retreats of surface ponds on the rock glacier, internal reflectors extend the source for the rock glacier ice, Doran Glacier. In the from the near surface (∼ 0.1 m) downward to form the base transverse line (Fig. 10), the exposed ice at line positions of the pond and presumably the interface between the melt from 30 to 115 m records the modern advance of Doran ice and underlying bubble-rich glacier-derived ice (Shean Glacier and the associated calving of ice from its lateral mar- www.the-cryosphere.net/14/1/2020/ The Cryosphere, 14, 1–16, 2020
12                                                                                      K. Winsor et al.: Rock glacier characteristics

Figure 9. Plot of δ 18 O vs. δD of 59 samples from the rock glacier. Cores 01, 04, and 05 were gathered from buried ice along a longitudinal
transect down the central flow line of the rock glacier. Buried ice transect refers to additional hand samples KWL-15-11 to KWL-15-15 (see
Fig. 8 for locations). Exposed icefalls were five samples from two locations (SLI-15-08 and SLI-15-09; Fig. 8). Samples were also gathered
from seven ponds along the rock glacier surface (SLI-15-02, SLI-15-06, SLI-15-10, SLI-15-16, SLI-15-17, SLI-15-18, and SLI-15-19; Fig. 8)
and two local alpine glaciers, Sollas and Doran. The local meteoric water line is from Gooseff et al. (2006).

                                                                           5.3   Surface trends in relative age

                                                                           The accumulation of major ions in meltwater ponds should
                                                                           be driven by two primary processes: snowfall and chemical
                                                                           weathering (Sun et al., 2015). Snowfall in the Dry Valleys
                                                                           contains aerosols of marine origin, which are a significant
                                                                           source of Cl− and NO−   3 to the regional soils (Witherow et al.,
                                                                           2006). Although the surface sediments of the rock glacier do
                                                                           experience summer thaw, the thaw season is generally short
                                                                           in this region (∼ 34 degree days yr−1 along Lake Bonney in
                                                                           the valley floor (Doran et al., 2002). Compared to the coastal
Figure 10. Processed 400 MHz ground-penetrating radar data for
                                                                           Dry Valleys, weathering is therefore less of a contributor to
the transverse line (west to east) from the debris-covered rock
glacier across the icefalls fed by Doran Glacier and ending at the
                                                                           soil and meltwater major ions (Bao et al., 2008).
east-lateral ice-cored ridge. Image after migration and topographic           Based on the shape and position of meltwater pond KWL-
correction using a constant velocity of 0.16 m ns−1 . The prominent        15-02, it evolved from a snowbank (Fig. 5e), which supports
internal reflection event starts as a near-surface reflection event at     the interpretation that snowfall is a dominant contributor to
the beginning of the profile. Interpreted as an interface between sur-     the ponds. Some authors have reported increasing concentra-
face debris and internal ice, the debris layer dips below the exposed      tions of the more soluble binary ions in downslope meltwater
ice at the ∼ 20 m line position before emerging at the ice-cored           ponds due to the freeze–thaw-driven migration of those ions
ridge (right side of profile). Arrows point to reflection events inter-    from upslope ponds (Healy et al., 2006; Lyons et al., 2012).
preted to be internal debris layers, likely recording periods of retreat   However, we see a relative increase in the less soluble Mg2+
of the source glacier.                                                     in the lower meltwater ponds (Figs. 7b and 8), suggesting
                                                                           that the freeze–thaw process does not control the major ion
                                                                           concentration trend. Additionally, the hummocky, irregular
gin. The prominent subsurface debris layers below the mod-
                                                                           surface topography of the rock glacier likely restricts con-
ern ice likely record previous period(s) of Doran Glacier re-
                                                                           nectivity between the upper and lower rock glacier (Figs. 2
treat. During glacier retreat the rock glacier loses its source
                                                                           and 8).
for ice, allowing a debris layer to accumulate at the rock
                                                                              Our major ion concentrations and cation ratios are dissim-
glacier surface via ablation and rockfall. Below the promi-
                                                                           ilar to those reported in meltwater ponds surrounding Marr
nent debris layer, the low-signal zone (interpreted to be more
                                                                           Glacier, ∼ 3 km northeast of the rock glacier (Fig. 1) (Lyons
ice) likely records older advance(s) of Doran Glacier. Based
                                                                           et al., 2012). This is likely due to the direct input of glacial
on this interpretation, the transverse radargram records at
                                                                           meltwater to the Marr ponds, which possesses low concen-
least two recent advances of Doran Glacier (Fig. 10).
                                                                           trations of major ions as well as ratios driven strongly by
                                                                           snowfall. The rock glacier ponds are more isolated and sub-
                                                                           ject to evaporative concentration of ions. We suggest that the
                                                                           ponds in the upper rock glacier (SLI-15-02, SLI-15-10 and

The Cryosphere, 14, 1–16, 2020                                                                     www.the-cryosphere.net/14/1/2020/
K. Winsor et al.: Rock glacier characteristics 13
(Fig. 11b), but sediment cover over the buried ice is > 30 cm
thick (Fig. 4a), allowing for little to no melting of the buried
ice as a source for pond water.
High salinity of surface ponds, such as KWL-15-03, im-
plies a long surface exposure history for the lower rock
glacier. Concentrations of Cl− are likely controlled by
aerosol inputs from snow and ice melt, as well as dissolu-
tion and subsequent aeolian and near-surface groundwater
transport from nearby sediments, with a small contribution
from weathering of cinder cone clasts (Keys and Williams,
1981; Witherow et al., 2006; Toner et al., 2013). If the
measured Cl− concentration of KWL-15-03 is representa-
tive of the pond in general and the Cl− was sourced solely
from aerosol deposition across the entire ∼ 600 m2 depres-
sion that surrounds the ∼ 12 m2 pond, then the accumula-
tion of Cl− to the pond would take longer than the Holocene
(∼ 40 kyr). This estimate is based on the modern Cl− flux
of ∼ 150 µmol m−2 yr−1 to four snow pits on Sollas Glacier
(Witherow et al., 2006) and the measured Cl− concentration
of ∼ 31 400 ppm applied to the entire volume (∼ 4000 L) of
the pond (Table S1). This calculated age would be an over-
estimation if (a) the surface ice has a higher salinity than the
lower pond ice, (b) there is a significant in situ weathering
Figure 11. Processed 400 MHz ground-penetrating radar data from source of Cl− , and/or (c) wind-blown snow and wind-blown
the transect down the rock glacier. (a) Mid-rock glacier line show-
ions preferentially accumulate in the depression. Conversely,
ing interpreted internal debris and a mid-rock glacier pond (∼ 50–
70 m; site of ice core samples SLI-15-02 and SLI-15-03). (b) Part of
the calculated age would be an underestimation if (a) the sur-
the transect crossing the frozen pond (sample sites SLI-15-06 and face ice has a lower salinity than the bottom ice due to top-
SLI-15-07) near the lowest buried ice core site (at 110 m; SLI-15- down freezing and brine expulsion at the bottom of the pond,
05). Arrows point to reflection events interpreted to correlate with (b) there is aeolian removal of ions from the pond depression
internal debris layers. during desiccation events, and/or (c) some Cl− is retained in
surrounding sediments rather than being transported to the
pond. Additionally, long-term variations in snowfall, the size
KWL-15-01) have low total ion concentrations due to their of the depression, and fluvial/subsurface water flow would
relative youth and potential meltwater contribution from the affect Cl− transport to the pond. Due to all of these factors
Doran Glacier icefalls (Fig. 8). Ponds SLI-15-18 and SLI-15- and uncertainties, an absolute surface age for the lower rock
19 contain some of the lowest ion concentrations we mea- glacier cannot be calculated based simply on the pond salin-
sured but occur near the rock glacier toe where the land- ity. The antiquity of the lower rock glacier is evidenced by the
form is older. However, at this location, the surface mor- grussification of granites, the rounding of surface clasts, the
phology is distinct from the rest of the rock glacier: (1) accumulation of relatively thick (> 30 cm) sediment cover
the hummocks are lower relief and (2) the arcuate trans- over the buried ice, and the GPR record of multiple advances
verse ridges are incised by fluvial channels that are oriented and retreats of the source glacier. When coupled with this rel-
longitudinally to rock glacier flow. We were also unable to ative chronology of surface weathering and buried ice accu-
find clean subsurface ice in this lowest section of the rock mulation and flow, the high Cl− concentrations measured in
glacier (based on five field excavations). Pond SLI-15-19 is a KWL-15-03 might suggest a pre-Holocene age for the lower
small, ephemeral feature (Fig. 5i). Pond SLI-15-18 is larger rock glacier.
and long-lived but in a shallow depression with a northern
bounding bank that was < 50 cm above the modern pond sur- 5.4 Implications for McMurdo Dry Valleys glaciers
face. This configuration, along with the evidence for fluvial
channeling, might allow pond water to flow out during high Meltwater pond salinity and observations of surface weath-
stands, thus limiting long-term concentration of ions in the ering suggest that portions of the rock glacier could have
depressions. Conversely, pond KWL-15-03, which exhibits survived since before the Holocene. Distinct weathering
significantly higher ion concentrations than any of the other regimes along the rock glacier surface support an episodic
analyzed ponds, sits in one of the deepest depressions on nature of rock glacier development, as do the dispersal of
the entire rock glacier, 2–5 m deep on all sides. At this lo- englacial debris and the arcuate surface ridges. If the rock
cation, the rock glacier contains > 10 m of clean buried ice glacier surface near pond KWL-15-03 is pre-Holocene, it is
www.the-cryosphere.net/14/1/2020/ The Cryosphere, 14, 1–16, 202014 K. Winsor et al.: Rock glacier characteristics
possible that the rock glacier preserves evidence of advances Data availability. All geochemical data are provided in the Supple-
from older interglacial intervals. Regardless of the exact age, ment.
the rock glacier preserves, in a single feature, a record of mul-
tiple alpine glacier advances for which the direct geomorphic
evidence (such as moraines beyond the toe of Doran Glacier) Supplement. The supplement related to this article is available on-
is unavailable. line at: https://doi.org/10.5194/tc-14-1-2020-supplement.
Taylor Valley glacial geomorphology shows evidence for
advances of both outlet and alpine glaciers during MIS 5,
7, 9, and 11 (Higgins et al., 2000; Swanger et al., 2017). Author contributions. All authors participated in field observations,
GPR surveying, and ice core collection. KMS organized and led the
Even though Dry Valley glaciers appear to have advanced
field campaign. KW and KMS collected soil and ice hand samples.
during the Holocene relative to the Last Glacial Maximum, EB directed GPR surveying and performed all GPR data process-
the timing and details of Holocene advance dynamics are un- ing. KW processed samples for major ion analyses. KW and KMS
resolved (Hall and Denton, 2000). Therefore, if rock glaciers processed samples for stable isotope analyses. KW, KMS, and EB
can preserve a record of Holocene (or older) glacier advance prepared the paper, created figures, and made tables.
and retreat, these landforms can be used to constrain regional
glacial fluctuations, especially where moraines are absent.
In addition to the stated implications for the McMurdo Dry Competing interests. The authors declare that they have no conflict
Valleys, our results have wider significance. Buried ice and of interest.
rock glaciers are common throughout the ice-free regions
of Antarctica (Fukui et al., 2008; Hassinger and Mayewski,
1983; Bibby et al., 2016). Based on our results, it is likely that Acknowledgements. The authors would like to thank the McMurdo
many ice-cored rock glaciers elsewhere in Antarctica record Station support staff, especially those at the Berg Field Center,
past glacial fluctuations, and can therefore be used to study Petroleum Helicopters International, and the Crary Laboratory, for
climatic history during the Holocene and Pleistocene. assistance during the field season. Geoff Hargreaves and crew were
of great assistance in subsampling ice cores at the National Ice
Core Laboratory. Fred Luiszer (University of Colorado-Boulder)
6 Conclusions analyzed samples for major ions and Robert Michener (Boston Uni-
versity) analyzed samples for stable isotopes. Useful discussions
We use a combination of ground-penetrating radar, field ob- were had with Maciej Obryk. We also thank the two anonymous
servations, and stable isotope and major ion analyses to char- reviewers.
acterize a rock glacier fed by the Doran Glacier icefalls in
Taylor Valley. The rock glacier subsurface is primarily clean
Financial support. This research has been supported by the United
ice that is at least 10 m thick, with englacial debris bands that
States National Science Foundation Office of Polar Programs (grant
in places outcrop at the surface. Stable isotope values that no. 1341284).
are consistent with those of glacial ice, along with the pres-
ence of spherical gas inclusions, confirm that the buried ice
within the rock glacier is glacial in origin. Surface weath- Review statement. This paper was edited by Peter Morse and re-
ering trends including the development of ventifacts, grus, viewed by two anonymous referees.
and minor desert pavement on the lower rock glacier suggest
that the rock glacier toe is significantly older than the upper
rock glacier. Major ion concentrations in meltwater ponds
are variable and consistent with aerosol deposition acting as
the primary source for major ions. Our data support episodic References
advances of the rock glacier, which likely record Doran
Anderson, R. S., Anderson, L. S., Armstrong, W. H.,
Glacier margin fluctuations during the late Pleistocene and Rossi, M. W., and Crump, S. E.: Glaciation of alpine
Holocene. This demonstrates the potential utility of Antarc- valleys: The glacier – debris-covered glacier – rock
tic rock glaciers in preserving glacial behavior despite non- glacier continuum, Geomorphology, 311, 127–142,
deposition of moraines and/or the destruction of older glacial https://doi.org/10.1016/j.geomorph.2018.03.015, 2018.
landforms by younger advances. Annan, A. P.: GPR methods for hydrogeological studies, in: Hydro-
geophysics, edited by: Rubin, Y. and Hubbard, S. S., Springer,
Netherlands, 185–213, 2005.
Arcone, S. A., Lawson, D. E., and Delaney, A. J.:
Short-pulse radar wavelet recovery and resolution
of dielectric contrasts within englacial and basal ice
Matanuska Glacier, Alaska, USA, J. Glaciol., 41, 68–86,
https://doi.org/10.3189/S0022143000017779, 1995.
The Cryosphere, 14, 1–16, 2020 www.the-cryosphere.net/14/1/2020/K. Winsor et al.: Rock glacier characteristics 15 Bao, H., Barnes, J. D., Sharp, Z. D., and Marchant, D. tic Alpine Res., 15, 351–368, https://doi.org/10.2307/1550831, R.: Two chloride sources in soils of the McMurdo Dry 1983. Valleys, Antarctica, J. Geophys. Res.-Atmos., 113, 1–10, Healy, M., Webster-Brown, J. G., Brown, K. L., and Lane, V.: https://doi.org/10.1029/2007JD008703, 2008. Chemistry and stratification of Antarctic meltwater ponds II: In- Bibby, T., Putkonen, J., Morgan, D., Balco, G., and Shuster, land ponds in the McMurdo Dry Valleys, Victoria Land, Antarct. D. L.: Million year old ice found under meter thick de- Sci., 18, 525, https://doi.org/10.1017/S0954102006000575, bris layer in Antarctica, Geophys. Res. Lett., 43, 6995–7001, 2006. https://doi.org/10.1002/2016GL069889, 2016. Higgins, S. M., Hendy, C. H., and Denton, G. H.: Geochronology of Brown, J., Harper, J., and Bradford, J.: A radar transpar- Bonney drift, Taylor Valley, Antarctica: evidence for interglacial ent layer in a temperate valley glacier: Bench Glacier, expansions of Taylor Glacier, Geogr. Ann. Ser. A, 82, 391–409, Alaska, Earth Surf. Process. Landforms, 34, 1497–1506, https://doi.org/10.1111/1468-0459.00130, 2000. https://doi.org/10.1002/esp.1835, 2009. Hoffman, M. J., Fountain, A. G., and Liston, G. E.: Distributed Christ, A. J. and Bierman, P. R.: The local Last Glacial Maximum modeling of ablation (1996–2011) and climate sensitivity on the in McMurdo Sound, Antarctica: Implications for ice-sheet be- glaciers of Taylor Valley, Antarctica, J. Glaciol., 65, 215–229, havior in the Ross Sea Embayment, Geol. Soc. Am. Bull., 1–17, https://doi.org/10.1017/jog.2015.2, 2016. https://doi.org/10.1130/B35139.1, 2019. Holland, H. D.: The chemical evolution of the atmosphere and Clark, D. H., Steig, E. J., Potter Jr., N., and Gillespie, A. R.: Ge- oceans, Princeton University Press, 585 pp., 1984. netic variability of rock glaciers, Geogr. Ann. A, 80, 175–182, Keys, J. R. and Williams, K.: Origin of crystalline, cold desert salts https://doi.org/10.1111/j.0435-3676.1998.00035.x, 1998. in the McMurdo region, Antarctica, Geochim. Cosmochim. Ac., Doran, P. T., Mckay, C. P., Clow, G. D., Dana, G. L., Fountain, A. 45, 2299–2309, https://doi.org/10.1016/j.limno.2013.04.005, G., Nylen, T., and Lyons, W. B.: Valley floor climate observations 1981. from the McMurdo dry valleys, Antarctica, 1986–2000, J. Geo- Knight, J., Harrison, S., and Jones, D. B: Rock glaciers phys. Res., 107, 1–12, https://doi.org/10.1029/2001JD002045, and the geomorphological evolution of deglacier- 2002. izing mountains, Geomorphology, 324, 14–24, Fountain, A. G., Nylen, T. H., MacClune, K. L., and Dana, https://doi.org/10.1016/j.geomorph.2018.09.020, 2018. G. L.: Glacier mass balances (1993-2001), Taylor Valley, Levy, J. S., Fountain, A. G., O’Connor, J. E., Welch, K. A., and McMurdo Dry Valleys, Antarctica, J. Glaciol., 52, 451–462, Lyons, W. B.: Garwood valley, Antarctica: a new record of https://doi.org/10.3189/172756506781828511, 2006. last glacial maximum to Holocene glaciofluvial processes in Fountain, A. G., Levy, J. S., Gooseff, M. N., and Van the McMurdo dry valleys, Geol. Soc. Am. Bull., 1, 1484–1502, Horn, D.: The McMurdo Dry Valleys: A landscape on https://doi.org/10.1130/B30783.1, 2013. the threshold of change, Geomorphology, 225, 25–35, Lyons, W. B., Tyler, S. W., Wharton, R. A., McKnight, D. M., https://doi.org/10.1016/j.geomorph.2014.03.044, 2014. and Vaughn, B. H.: A Late Holocene desiccation of Lake Hoare Fukui, K., Sone, T., Strelin, J. A., Torielli, C. A., Mori, J., and Fujii, and Lake Fryxell, McMurdo Dry Valleys, Antarctica, Antarct. Y.: Dynamics and GPR stratigraphy of a polar rock glacier on Sci., 10, 247–256, https://doi.org/10.1017/S0954102098000340, James Ross Island, Antarctic Peninsula, J. Glaciol., 54, 445–451, 1998. https://doi.org/10.3189/002214308785836940, 2008. Lyons, W. B., Welch, K. A., Gardner, C. B., Jaros, C., Moorhead, Gooseff, M. N., Lyons, W. B., McKnight, D. M., Vaughn, D. L., Knoepfle, J. L., and Doran, P. T.: The geochemistry of B. H., Fountain, A. G., and Dowling, C.: A Stable Iso- upland ponds, Taylor Valley, Antarctica, Antarct. Sci., 24, 3–14, topic Investigation of a Polar Desert Hydrologic Sys- https://doi.org/10.1017/S0954102011000617, 2012. tem, McMurdo Dry Valleys, Antarctica, Arctic, Antarct. Macdonell, S. A., Fitzsimons, S. J., and Mölg, T.: Seasonal sedi- Alp. Res., 38, 60–71, https://doi.org/10.1657/1523- ment fluxes forcing supraglacial melting on the Wright Lower 0430(2006)038[0060:ASIIOA]2.0.CO;2, 2006. Glacier, McMurdo Dry Valleys, Antarctica, Hydrol. Proc., 27, Guglielmin, M. and Cannone, N.: A permafrost warming 3192–3207, https://doi.org/10.1002/hyp.9444, 2013. in a cooling Antarctica?, Clim. Change, 111, 177–195, Mackay, S. L., Marchant, D. R., Lamp, J. L., and Head, J. W.: https://doi.org/10.1007/s10584-011-0137-2, 2012. Cold-based debris-covered glaciers: evaluating the potneital as Hall, B. L. and Denton, G. H.: Radiocarbon chronology of Ross climate archives through studies of ground-penetraing radar and Sea drift, eastern Taylor Valley, Antarctica: Evidence for a surface morphology, J. Geophys. Res. Earth, 119, 2505–2540, grounded ice sheet in the Ross Sea at the last glacial maximum, https://doi.org/10.1002/2014JF003178. Received, 2014. Geogr. Ann. A, 82, 305–336, https://doi.org/10.1111/j.0435- Marchant, D., Denton, G., Bockheim, J. G., Wilson, S. C., 3676.2000.00127.x, 2000. and Kerr, A. R.: Quaternary changes in level of the up- Hall, B. L., Denton, G. H., and Hendy, C. H.: Evidence from Tay- per Taylor Glacier, Antarctica: implications for paleoclimate lor Valley for a Grounded Ice Sheet in the Ross Sea, Antarctica, and East Antarctic Ice Sheet dynamics, Boreas, 23, 29–43, Geogr. Ann. A., 82, 275–303, https://doi.org/10.1111/j.0435- https://doi.org/10.1111/j.1502-3885.1994.tb00583.x, 1994. 3676.2000.00126.x, 2000. Naish, T., Powell, R., Levy, R., Wilson, G., Scherer, R., Ta- Hamilton, S. J. and Whalley, W. B.: Rock glacier nomen- larico, F., Krissek, L., Niessen, F., Pompilio, M., Wilson, clature: a re-assessment, Geomorphology, 14, 73–80, T., Carter, L., Deconto, R., Huybers, P., Mckay, R., Pol- https://doi.org/10.1016/0169-555X(95)00036-5, 1995. lard, D., Ross, J., Winter, D., and Barrett, P.: Obliquity-paced Hassinger, J. M. and Mayewski, P. A.: Morphology and dynamics Pliocene West Antarctic ice sheet oscillations, Nature, 458, of the rock glaciers in southern Victoria Land, Antarctica, Arc- https://doi.org/10.1038/nature07867, 322–329, 2009. www.the-cryosphere.net/14/1/2020/ The Cryosphere, 14, 1–16, 2020
You can also read