Direct printing of functional 3D objects using polymerization-induced phase separation - Nature
←
→
Page content transcription
If your browser does not render page correctly, please read the page content below
ARTICLE
                  https://doi.org/10.1038/s41467-020-20256-3                OPEN

                  Direct printing of functional 3D objects using
                  polymerization-induced phase separation
                  Bhavana Deore 1 ✉, Kathleen L. Sampson 1, Thomas Lacelle 1, Nathan Kredentser1, Jacques Lefebvre 1,
                  Luke Steven Young1, Joseph Hyland 2, Rony E. Amaya 2, Jamshid Tanha 3, Patrick R. L. Malenfant 1,
                  Hendrick W. de Haan4 ✉ & Chantal Paquet 1 ✉
1234567890():,;

                  3D printing has enabled materials, geometries and functional properties to be combined in
                  unique ways otherwise unattainable via traditional manufacturing techniques, yet its adoption
                  as a mainstream manufacturing platform for functional objects is hindered by the physical
                  challenges in printing multiple materials. Vat polymerization offers a polymer chemistry-
                  based approach to generating smart objects, in which phase separation is used to control the
                  spatial positioning of materials and thus at once, achieve desirable morphological and
                  functional properties of final 3D printed objects. This study demonstrates how the spatial
                  distribution of different material phases can be modulated by controlling the kinetics of
                  gelation, cross-linking density and material diffusivity through the judicious selection of
                  photoresin components. A continuum of morphologies, ranging from functional coatings,
                  gradients and composites are generated, enabling the fabrication of 3D piezoresistive sen-
                  sors, 5G antennas and antimicrobial objects and thus illustrating a promising way forward in
                  the integration of dissimilar materials in 3D printing of smart or functional parts.

                  1 Security and Disruptive Technologies, National Research Council Canada, 100 Sussex Drive, Ottawa, ON K1A 0R6, Canada. 2 Department of Electronics,

                  Carleton University, 1125 Colonel by Drive, Ottawa, ON K1S 5B6, Canada. 3 Human Health Therapeutics Research Centre, National Research Council Canada,
                  100 Sussex Drive, Ottawa, ON K1A 0R6, Canada. 4 Faculty of Science, University of Ontario Institute of Technology, Oshawa, ON L1H 7K4, Canada.
                  ✉email: Bhavana.Deore@nrc-cnrc.gc.ca; hendrick.dehaan@ontariotechu.net; Chantal.Paquet@nrc-cnrc.gc.ca

                  NATURE COMMUNICATIONS | (2021)12:55 | https://doi.org/10.1038/s41467-020-20256-3 | www.nature.com/naturecommunications                              1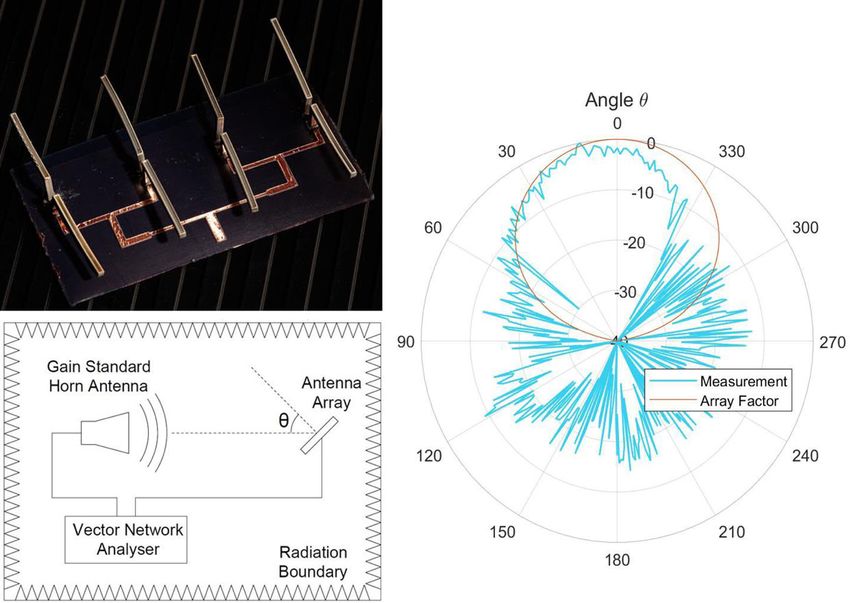
ARTICLE                                                                NATURE COMMUNICATIONS | https://doi.org/10.1038/s41467-020-20256-3

S
      trategies to seamlessly integrate multiple materials into              oxazoline, is ideal for this application as its molecular nature
      objects using 3D printing will enable the generation of new            ensures higher diffusivity than larger functional materials such as
      or improved properties and advance 3D printing as a                    nano-particles or micro-particles. Furthermore, because AgND
mainstream approach to manufacture functional and smart                      does not scatter light as particles do, resins containing high
objects1–14. Using reactive precursors, vat polymerization 3D                concentrations of the complex can be printed. As has previously
printing provides a unique opportunity to spatially control                  been shown with screen printable inks derived from this salt, the
materials from the surface to deep within the object3,4,8,10,15–17.          precursor will decompose into volatile products and conductive
For instance, the spatial, temporal, chromatic and intensity                 metallic silver traces with volume resistivity values as low as
characteristics of light have been used in vat polymerization to             9 μΩ•cm through a simple post printing sintering step using
pattern materials. Elegant examples include 3D printing using                temperatures greater than 150 °C38. The resin systems studied
two wavelengths and orthogonal chemistries to spatially control              herein were comprised of varying concentrations of polyethylene
two distinct polymerizations9, light intensity and oxygen inhibi-            glycol (PEG) diacrylate crosslinkers and a monomer, 2-ethylhexyl
tion to modulate the crosslinking density17 and photochromic                 acrylate (EHA, Supplementary Table 1). The four resin systems,
molecules in combination with two wavelengths resulting in                   distinguished by the length of the PEG spacer of the diacrylates,
bioinspired materials with soft and hard sections18. Moore and               formed the basis of this study (170, 250, 575, and 700 g/mol Mn
Barbera have recently demonstrated the demixing of precursors                PEG-diacrylates are referred to as DA-170, DA-250, DA-575, and
to yield bicontinuous phases of polymer and pre-ceramic com-                 DA-700, respectively; Supplementary Table 2). A concentration
pounds with domain sizes controlled by light intensity8. Light-              of 25 wt. % silver precursor (AgND) was used throughout the
based printing techniques have also been used to photo-reduce                study based on results showing optimal electrical conductance at
in situ silver precursors yielding silver nanoparticles during the           this concentration (Supplementary Table 3). A threshold con-
printing process19–23.                                                       centration of ~19 wt. % AgND was required for electrical con-
   Here, we demonstrate that by using purposely formulated                   duction using the 35 wt. % DA-250 formulation. The resistance of
resins, material phases within objects can be controlled using vat           the surface of the cylinders did not change significantly when the
polymerization. The method utilizes polymerization-induced                   concentration of AgND in the resin was between 25 and 38 wt. %,
phase separation (PIPS), a process previously used to generate               while AgND concentrations greater than 38 wt. % reduced the
2D patterns in holographic polymerization24–29. Exploiting con-              printability of the resin and resulted in brittle objects and less
comitant changes in the thermodynamics of mixing that occur                  uniform silver coatings (Supplementary Fig. 1).
during polymerization, as well as spatio-temporal variations in                 By adjusting the resin composition, it is possible to tune the
monomer to polymer conversion, materials can be spatially                    morphology of the printed part from one where silver is
directed towards the surface of the 3D printed object. The flux of            concentrated at the surface forming a distinct coating to one in
functional material towards the surface of the printed object is             which the silver is dispersed throughout the object. A high
controlled by balancing the kinetics of gelation, crosslinking               concentration of silver at the surface of the printed object
density and rates of diffusion of the resin components. This                 necessitates that the AgND migrates to the surface before
approach has the benefit of generating material domains on the                becoming entrapped in the polymer network; this occurs when
nanoscale and, thus, provides a means to combine macro-scale                 the kinetics of gelation are slow, and when the diffusion of AgND
and micron-scale 3D designs with nanoscale material phases,                  is not inhibited by the formation of a tight polymer network. A
features not easily achieved with nanoscale printing approaches              composite morphology, where the concentration of silver varies
such as two photon polymerization30, localized electroplating31,32,          minimally throughout the 3D printed object occurs when the
or metal ion reduction33–35.                                                 kinetics of gelation are fast and the AgND is impeded from
   This report explores how resin formulation influences PIPS in              migrating as a result of a tight polymer network. By dialing-in
vat polymerization (3D PIPS) and provides the insight needed to              conditions with intermediate rates of gelation and crosslinking
control material placement in printed objects. The use of 3D PIPS            densities, gradients in silver concentration can be achieved as the
to spatially control material phases within printed objects opens            AgND diffuses controllably away from the locus of polymeriza-
up new opportunities to create functional coatings directly from             tion and towards the surface of the object.
printing or to generate composition gradients that are essential to             3D PIPS was first demonstrated by printing cylinders 1.5 mm
reduce stresses that can manifest when integrating dissimilar                in diameter and 2 cm in length and sintered at 210 °C to convert
materials36. We demonstrate the utility of the approach by pro-              AgND into metallic silver. These resins contained 25 wt. % AgND
ducing conductive metallic silver features, enabling the fabrica-            yielding objects with 9.5 wt. % silver post-sintering (see
tion of a dipole antenna array, strain sensors, as well as objects           Supplementary Fig. 2 and Supplementary Table 3). The
with antibacterial surfaces. Using the principles described herein,          morphologies formed by the various resins, both pre-sintering
freedom to design material complexity/functionality directly into            and post-sintering, can be seen in the SEM images taken at the
3D printed objects can be envisioned to generate optimized cat-              edge of the cross-sections of the cylinders (Fig. 2a, b and
alytic supports, improve the wettability of biocompatible resins             Supplementary Fig. 3). The coating of the pre-sintered 25 wt. %
with hydroxyapatite particles, or embed anti-viral agents to                 DA-250 and DA-170 cylinders confirm that PIPS occurs during
minimize the transmission of pathogenic agents and will pave the             printing. The images reveal that silver accumulates towards the
way to new technologies in structural electronics37, shape                   surface of the object with some resins forming a defined silver
responsive parts for soft robotics, as well as smart objects with            layer or coating (e.g., 25 wt. % DA-170, for details see
embedded sensors for the Internet of Things and wearables13.                 Supplementary Table 2) while others produce a graded composi-
                                                                             tion in silver (e.g., 99 wt. % DA-700, for details see
                                                                             Supplementary Table 2). These morphologies were assessed by
Results                                                                      performing 15 μm line scans at the edge of the cross-sections of
Crosslinkers drive the spatial distribution of silver. Here, we              the cylinders using Energy Dispersive X-ray Spectroscopy (EDS,
showcase a range of material morphologies that can be generated              Fig. 2c). With the exception of two of the DA-170 resins (50 wt. %
using photoresins containing a silver precursor as the non-                  and 99 wt. % crosslinker), all cross-sections show that the
polymerizable functional component (Fig. 1). The silver pre-                 concentration of silver increases from the core to the surface of
cursor, a mixture of silver neodecanoate (AgND) with 2-ethyl-2-              the cylinder (Supplementary Fig. 4). All four series have similar

2               NATURE COMMUNICATIONS | (2021)12:55 | https://doi.org/10.1038/s41467-020-20256-3 | www.nature.com/naturecommunications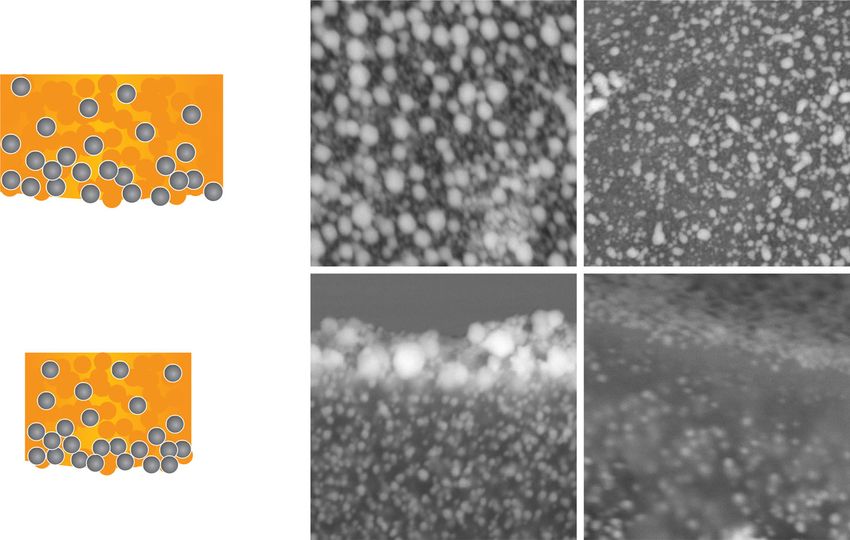
NATURE COMMUNICATIONS | https://doi.org/10.1038/s41467-020-20256-3                                                                    ARTICLE

Fig. 1 3D PIPS printing mechanism of functional objects. a Schematic of the phase separation of AgND induced by PIPS (left) depicting the AgND
functional material phase separating from the polymer object to the interface during 3D printing using an SLA printer (right). b The tuning of phase
separation is controlled with crosslinker molecular weight and percent crosslinker to alter the crosslinking density and polymer gelation rate to yield
different morphologies in 3D objects. Representative SEM images are presented to depict the composite, gradient or coating morphologies. c Photographs
of PIPS induced 3D printed and sintered Ag coated lattice objects with dimensions of 40 × 40 × 40 mm.

NATURE COMMUNICATIONS | (2021)12:55 | https://doi.org/10.1038/s41467-020-20256-3 | www.nature.com/naturecommunications                               3
ARTICLE                                                                   NATURE COMMUNICATIONS | https://doi.org/10.1038/s41467-020-20256-3

Fig. 2 Silver phase separation as a function of crosslinking density. Cylinders 1.5 mm in diameter and 2 cm in length were printed using resins containing
25 wt. % AgND. a SEM cross-sectional images of cylinders printed using resin mixtures (i, ii) 25 wt. % DA-170 and (iii, iv) 25 wt. % DA-250 and taken
prior to thermal sintering, but treated with 5 min of UV curing to convert some of the silver salt to silver metal. These results confirm that the silver
complex diffuses to the surface during printing and the partitioning of material phases does not happen post-printing. The cylinders once sintered at 210 °C
contain 9.5 wt. % Ag. b Cross-sectional SEM images focused approximately
NATURE COMMUNICATIONS | https://doi.org/10.1038/s41467-020-20256-3 ARTICLE
surface silver is below its percolation threshold resulting in no of AgND will change during polymerization as a result of
detectable electrical conductivity. The relative change in the increases in viscosity and constraints imparted by the growing
resistance with increasing crosslinker lengths also agrees with the polymer network41. The extent to which the diffusivity of AgND
trend in surface silver; the resistance of cylinders made with short will change when the resin is transformed into a polymer network
diacrylates increases more dramatically than with the longer will be dependent on the length of the spacer between reactive
diacrylates in concurrence with the more significant decrease in moieties in the crosslinker or, in other words, the crosslinking
surface silver for the short diacrylates. These results demonstrate density. To explore this idea, coarse-grained Langevin dynamics
that 3D PIPS is a simple, single-step method to generate simulations of a simplified system were performed (see
functional coatings on 3D objects and, thus, circumvents the “Methods” section for details). The simulations tracked the
disadvantages of two-step coating methodologies such as poor displacement of a probe molecule, representing silver neode-
film adhesion and uniformity (see Supplementary Fig. 5 for canoate, in systems containing 100 wt. % crosslinkers. The
comparison). The calculated sheet resistance of 340 mΩ/sq is simulations monitored the diffusivity of the probe molecule in
commensurate with values reported by Kell et al. in which screen unreacted resin and in a fully formed polymer network only, and
printed traces using the same silver precursor have sheet therefore, the simulations did not require a consideration of
resistance values of ~200 mΩ/sq. The values are three orders of kinetic effects of the polymerization reaction.
magnitude lower than recently developed 3D printable con- The diffusion coefficient of the probe molecule in crosslinkers
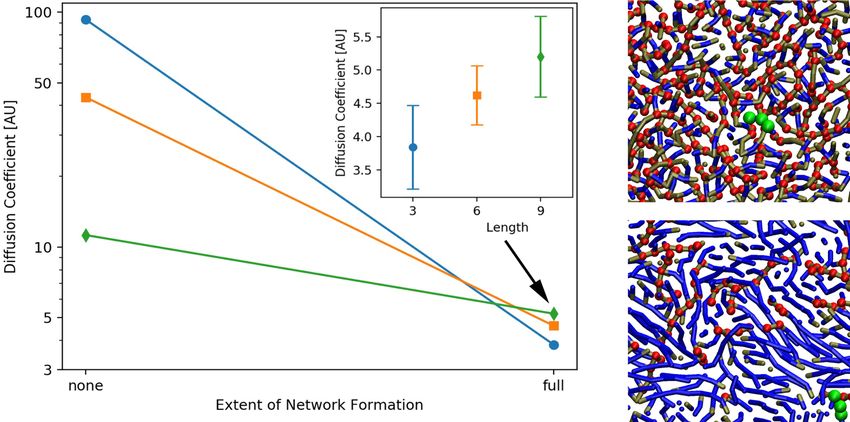
jugated polymers with values of ~6.6 × 10⁵ mΩ/sq39. with different linear bridging segment lengths (L = 3, 6, and 9) is
shown in Fig. 4a. In the absence of any polymerization, the
diffusion coefficient is higher in the short crosslinker. This is to be
Gelation rate, crosslinking density and diffusivity. With the aim expected as the viscosity of the solution increases with increasing
to resolve differences in the behaviors of the various resin systems MW. However, for the case of diffusion in the polymer networks,
and to develop a predictive model for 3D PIPS, we examined how the diffusion coefficient is highest for the longest crosslinker. In
the crosslinker influences the diffusion of the AgND during phase this limit, the networks formed by the shorter crosslinkers have a
separation. Diffusion of phase separating components, such as higher density of crosslinking points and, correspondingly, a
AgND, is influenced by the rate a homogeneous resin mixture is tighter network for the probe molecule to travel through than the
transformed into an insoluble gel. This rate determines whether longer crosslinkers. This can be seen by examining the images for
the AgND becomes trapped by the network or diffuses freely the probe molecule in the L = 3 network (Fig. 4b) and in the L =
towards the unreacted resin where mixing is more favorable due 9 network (Fig. 4c). The length of the linear bridging segments
to entropic gains. We measured the time required for a resin to (blue segments of Fig. 4b, c) and the density of the crosslinking
form a gel, or delay time (td), by detecting changes in the points (red segments) that define the density of the polymer
refractive index when a resin converts from monomer to a network are distinctly different in the L = 3 and L = 9 network.
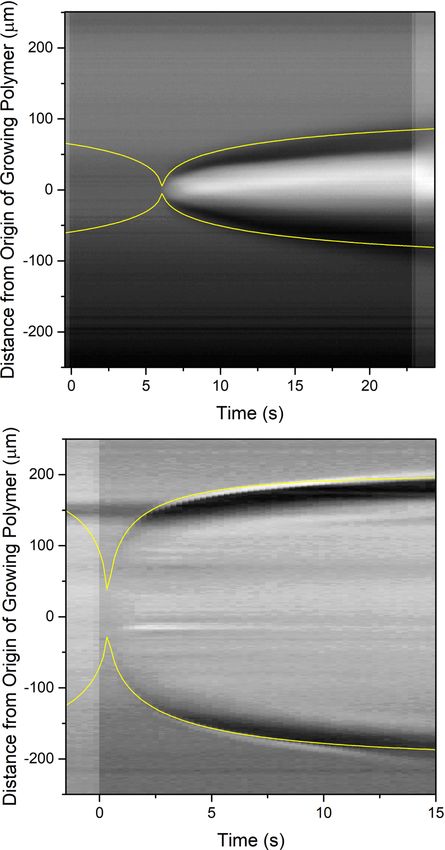
polymer network using phase contrast optical microscopy (Fig. 3a The shorter length between crosslinking points of the L = 3
and see Supplementary Movies 1–3). The td values for the resin network causes the diffusion of the probe molecule to be more
systems containing no AgND (see Supplementary Fig. 6 for resins constrained in comparison to the L = 9 network. Note that the y-
with AgND) are summarized in Fig. 3b and, as expected, td axis in Fig. 4a is logarithmic and, thus, the decrease in diffusivity
decreases with increasing wt. % crosslinker. For instance, a resin for the short crosslinkers is much more dramatic than for the
containing 15 wt. % DA-170 possesses an average td of 5.8 s, while long crosslinkers. The diffusion of the probe molecule is ~24
a resin composed of 99 wt. % DA-170 has an average td of 1.8 s. times greater in the unreacted resin than in the network for L = 3,
Moreover, for a given wt. % crosslinker, the delay times decrease but it is only ~2 times greater for L = 9.
with increasing molecular weight (MW) of the crosslinker. This The inset to Fig. 4a shows the diffusion coefficient of the probe
behavior likely results from the free end of long crosslinkers molecule in the polymer networks as a function of crosslinker
extending further from the polymer backbone, thus, increasing length. Of note, the diffusion coefficient for the probe molecule is
the probability of finding an unreacted acrylate group40. Fig. 3c larger in the L = 9 network than the L = 3 network indicating
shows how the delay times correlate to wt. % surface Ag; the that the diffusivity of AgND is very likely to be lower in the
longer the delay time, the greater the amount of surface silver. polymer network made with a tight crosslinked network. Reduced
Therefore, resins that remain homogeneous mixtures of polymer, diffusivity in the tight network formed by short crosslinkers will
monomer and crosslinker for a longer duration afford more time impede the ability of AgND to migrate to the surface and, thus,
of unimpeded migration for the AgND to reach the surface of the provides a rationale for the lower surface Ag found in the system
object. with shorter crosslinkers at low delay times. These results show
Although Fig. 3c highlights how the delay time affects surface how the interplay between the rate of network formation and the
morphology, the results reveal that the resin systems generate temporal changes in diffusivity of AgND that occur during
different amounts of surface Ag for a given delay time, indicating polymerization affect the extent to which AgND migrates to the
that the amount of Ag that reaches the surface is not solely surface, which ultimately dictate the spatial distribution of silver
dictated by gelation rates. The effect is particularly pronounced at in the object.
low delay times (i.e., high crosslinker concentrations) where
resins made with long diacrylates yield objects with higher
concentrations of surface silver than shorter diacrylates. We 3D PIPS for smart objects. Using purposefully formulated resins
considered the role of miscibility between the AgND and the resin to control the placement of AgND, we demonstrate the value in
by comparing their calculated solubility parameters, δ (see being able to tune the surface morphology of printed objects with
Supplementary Table 1 and Supplementary Fig. 7). However, particular functional properties by considering three applications:
for a given wt. % crosslinker, the differences in solubility strain sensors, antennas and antimicrobial objects. The 3D PIPS
parameters for the different systems is marginal and do not approach provides the ability to generate strain sensors that
explain the behavior highlighted in Fig. 3c. combine complex 3D geometries with piezoresistive properties
The diffusivity of AgND will impact the amount of Ag that and holds promise in wearable electronics and motion sensing42.
accumulates at the surface and may explain the observed Truss structures were 3D printed using a resin formulation that
differences in surface silver for a given delay time. The diffusivity yields graded silver compositions. The silver is sufficiently
NATURE COMMUNICATIONS | (2021)12:55 | https://doi.org/10.1038/s41467-020-20256-3 | www.nature.com/naturecommunications 5ARTICLE NATURE COMMUNICATIONS | https://doi.org/10.1038/s41467-020-20256-3 Fig. 3 Dynamical study of photoresins by optical microscopy. a Constructed images obtained from movies of islands of polymer formed when resin/ crosslinker inside a capillary is exposed to a focused 405 nm laser spot. A slice through the center of the island reveals its two opposite edges and is plotted as function of time. Two examples (i) and (ii) are shown for 15 wt. % DA-170 and 99 wt .% DA-700. b Delay time, td, extracted from a fit to Eq. 1 (See Experimental Section) as a function of wt. % crosslinker. c Weight % of Ag extracted from SEM/EDS analysis at the surface of the cylinder as a function of td for various resin formulations. The delay times are from the same gelation experiments exposed to a 405 nm laser in part a, b for each formulation. concentrated at the surface to form a percolated path for electrical concentrations have silver coatings with a more obstructed con- conduction; however, polymer inclusions within the surface silver duction pathway in comparison to trusses made with less cross- layer introduces barriers to conduction. With the printed objects linker. Therefore, these trusses will create a greater number of being compressible (see Supplementary Fig. 8 for selected elastic new silver-to-silver contacts during compression resulting in a modulus of cylinders), upon applying pressure, the polymer greater change in resistance. As shown in Fig. 5c, the change in matrix deforms creating new contacts between the silver domains, resistance increases with the wt. % crosslinker used to make the increasing the conduction pathways and, thus, decreasing resis- trusses. The benefit of this approach is that as opposed to varying tance (Fig. 5a). By controlling how the silver salt migrates, we can the filler loading to tune the sensor response, here 3D printed modulate the density of silver at the surface and, thus, its elec- piezoresistive sensors can be made to respond with a given trical response to compression. The SEM images of the surfaces electrical response by simply controlling the phase separation of and cross-sections of strain sensors of Fig. 5b, made using 39 and silver through the resin formulation. In addition, segregated silver 58 wt. % crosslinker, demonstrate the differences in the amount at the interface allows one to reach a percolation threshold with a of silver present at the surface. For the truss made with 39 wt. % lower loading of conductive filler in comparison to commonly crosslinker, the surface features a dense film of Ag nanoparticles used conductive composite morphologies43 making more efficient with low electrical resistance whereas the truss made with 58 wt. use of the conductive material, improving the electrical con- % crosslinker has a surface morphology with sparser particles ductance of the silver phase and minimizing impact on the and, correspondingly, higher electrical resistance (Supplementary mechanical properties of the bulk object polymer phase. The Fig. 9). The relative decrease in resistance depends on the extent strain sensors were found to have gauge factors (i.e., ratio of to which the conduction pathway is hindered by the presence of relative change in electrical resistance to the mechanical strain) of polymer at the surface. Thus, trusses made with high crosslinker 2.3, 3.2, 5.1, and 15.7 for the sensors made with 39, 46, 52, and 58 6 NATURE COMMUNICATIONS | (2021)12:55 | https://doi.org/10.1038/s41467-020-20256-3 | www.nature.com/naturecommunications
NATURE COMMUNICATIONS | https://doi.org/10.1038/s41467-020-20256-3                                                                               ARTICLE

                       a)                                                                              b)
                                         L=3

                                         L=6

                                         L=9                                 Crosslinker               c)

Fig. 4 Simulation Result for Diffusion Coefficient. a Diffusion coefficient of a probe molecule in crosslinkers of different spacer lengths (L = 3, 6, and 9)
before and after the formation of a polymer network. The inset shows the diffusion coefficient of the probe molecule (i.e., a molecule 3 beads long),
representing silver neodecanoate as a function of the crosslinker spacer length in the formed network. Snapshots from the simulations of the probe
molecule (green molecule) in a network formed with crosslinker (b) L = 3 and (c) L = 9. The red balls represent crosslinking points while the blue parts are
the bridging segments of the crosslinker. The high density of crosslinking points of the L = 3 system creates a tight polymer network that impedes diffusion
of the probe molecule. In comparison, the L = 9 system allows for less constrained diffusion of the probe molecule due to its lower density of crosslinking
points and longer segments between crosslinking nodes.

wt. % crosslinkers as shown in Fig. 5d, similar to those reported               could provide a means to embed small quantities of antimicrobial
for 2D strain sensors44. This example illustrates how gauge fac-                or antiviral agents at surfaces of printed objects helping to
tors can be dialed-in by simply varying the crosslinker con-                    minimize the transmission of pathogenic bacteria and viruses.
centration enabling one to target a sensitivity regime for 3D                      The concept of 3D PIPS can be applied broadly to fabricate 3D
printed piezoresistive sensors.                                                 objects with different surface properties by using various
   3D printing is ideally suited to fabricate millimeter wave                   functional materials with resins that induce migration of these
antennas for 5G as 5G will function on small networking cells                   materials towards the surface. 3D PIPS was used to generate 3D
that use arrays of antennas in small geographical areas requiring a             objects with various surface composition, as illustrated in the
large number of integrated low loss devices. These requirements                 examples of Supplementary Fig. 13 that use resins loaded with
can be achieved by using 3D printing to make antennas low cost,                 nanoparticles. Our 3D PIPS approach thus represents a powerful
in arrays and embedded in objects. Moreover, by suspending the                  means to make functional coatings and functionally graded
antenna in air using a 3D design, signal loss can be minimized                  materials of various compositions.
with air becoming the effective dielectric. Using the 3D PIPS                      In summary, we have showcased how the temporal and spatial
approach, we fabricated an array of 3D printed dipole antennas                  variation in monomer-to-polymer conversion that takes place in
and demonstrated transmission of 2.4 GHz waves. The dipole                      vat 3D polymerization causes local demixing of functional
antenna array, shown in Fig. 6a, displays the radiation pattern                 materials, triggering diffusion of these materials towards the bulk
found in Fig. 6c as measured using an anechoic chamber (Fig. 6b)                resin. By harnessing the rate at which the functional materials
and its comparison with the theoretical response for a dipole                   become entrapped in the polymer network during 3D PIPS, a
array on a ground plane. Focusing of the radiation pattern into a               wide range of surface morphologies can be accessed. The insight
main lobe is the result of radiation interference between antenna               gained in controlling the material phases allows a rational
elements. The half power beam width of the theoretical pattern is               approach to formulating resins to access a wide range of material
48° compared to 45° for the measured pattern, resulting in a                    morphologies for specific applications. Due to the universality of
remarkably small difference of 3° and, thus, demonstrating the                  this approach, 3D PIPS represents a powerful method to create
suitability of this printing process for antenna applications. The              materials with a continuum of morphologies using a vast material
gain measurement performed in an anechoic chamber using a                       set and will accelerate the adoption of vat polymerization as a
gain standard horn antenna, as shown in Supplementary Fig. 10,                  viable technique to generate functional 3D objects.
are comparable with literature reports45.
   Antibacterial properties of nanoparticle silver have been used               Methods
in many medical and dental applications for the prevention of                   3D printing functional photoresin preparation
infection46–48. To evaluate the antibacterial behaviors of 3D                   Photoresin preparation. Components used to make photoresins are shown in
printed Ag objects, a halo inhibition zone test against E. coli, as             Supplementary Table 1. Acrylate photoresins were prepared by varying the amount
well as bacterial growth kinetics were carried out along with                   of monomer and crosslinker ranging from 15 wt. % to 99 wt. % crosslinker with 1
                                                                                wt. % photoinitiator (ethyl (2,4,6-trimethylbenzoyl) phenylphosphinate, TPO-L)
control objects containing no silver. A concentration of 0.5 or 1.0             and the remaining wt. % monomer as shown in Supplementary Table 2. The
wt. % Ag was used in this study in order to form Ag nanoparticles               combined mixture was vortex mixed for 30 s before use.
rather than a film on the surface (Supplementary Fig. 11). As seen
in Supplementary Fig. 12, the 3D objects containing Ag show a                   Photoresin with AgND. The silver precursor, a mixture of silver neodecanoate with
bacterial inhibition zone on an agar plate and bacterial inhibition             2-ethyl-2-oxazoline silver neodecanoate referred to as AgND, was prepared by
                                                                                mixing 2.5 g of silver neodecanoate in 0.54 g of 2-ethyl-2-oxazoline (1:0.22 weight
in the liquid medium of E. coli while the control samples show                  ratio) using a planetary mixer at 2000 rpm for 4 min followed by 2200 rpm for 30 s
growth of E. coli. These results demonstrate the antibacterial                  resulting in a 82 wt. % of silver neodecanoate in 2-ethyl-2-oxazoline. To make
properties of 3D printed Ag objects and illustrate how 3D PIPS                  resins loaded with silver precursor, 3.0 g of AgND was added to 9.2 g of photoresins

NATURE COMMUNICATIONS | (2021)12:55 | https://doi.org/10.1038/s41467-020-20256-3 | www.nature.com/naturecommunications                                            7
ARTICLE NATURE COMMUNICATIONS | https://doi.org/10.1038/s41467-020-20256-3 Fig. 5 Strain sensor measurements. a Schematic representation of the compression mechanism within a truss. The greater the wt. % of crosslinker used, the more the conduction channel is obstructed by the polymer phase. With an applied pressure, the polymer phase deforms creating new silver-to-silver connections and decreasing the resistance. The trusses that have highly impeded conduction channels due to a high polymer fraction at its surface create a higher number of new silver-to-silver connections upon compression than the truss with less polymer and, thus, respond accordingly with a greater decrease in resistance. b SEM images of the top surface and cross-section of truss structures prepared using different wt. % crosslinker. c Change in resistance upon compression cycling of truss structures prepared with different wt. % crosslinker. Trusses made with 39, 46, and 52 wt. % crosslinker responded to a compression of 250 µm with maximum changes in resistances of 2.5, 6.0, and 12.5%, respectively. d Gauge factors of the trusses as a function of the concentration of crosslinker used in the resin. The gauge factor increases with increasing crosslinker concentration illustrating the strength of this approach in being able to target a given piezoresistive sensor sensitivity through the formulation of the resin. yielding compositions containing 25 wt. % of AgND. These resin formulations are sintering) as shown in Supplementary Fig. 2a, b. A concentration of 25 wt. % comprised of 7.9 wt. % of silver metal or 9.5 wt. % silver metal post-sintering AgND in the resin was found to give optimized resistances (see Supplementary assuming neodecanoate and 2-ethyl-oxazoline become volatile during the process Table 3). (see TGA in Supplementary Fig. 2). The amount of silver in the printed object in comparison to the calculated amount of silver in the formulation was confirmed Resin preparation for strain sensor. Mixed DA-resins were prepared by mixing using TGA of cylinders containing 25 wt. % AgND (or 9.5 wt. % silver post- different volumes of two separately prepared DA-resins such as 75 mL of DA-575 8 NATURE COMMUNICATIONS | (2021)12:55 | https://doi.org/10.1038/s41467-020-20256-3 | www.nature.com/naturecommunications
NATURE COMMUNICATIONS | https://doi.org/10.1038/s41467-020-20256-3 ARTICLE
a)
c)
b)
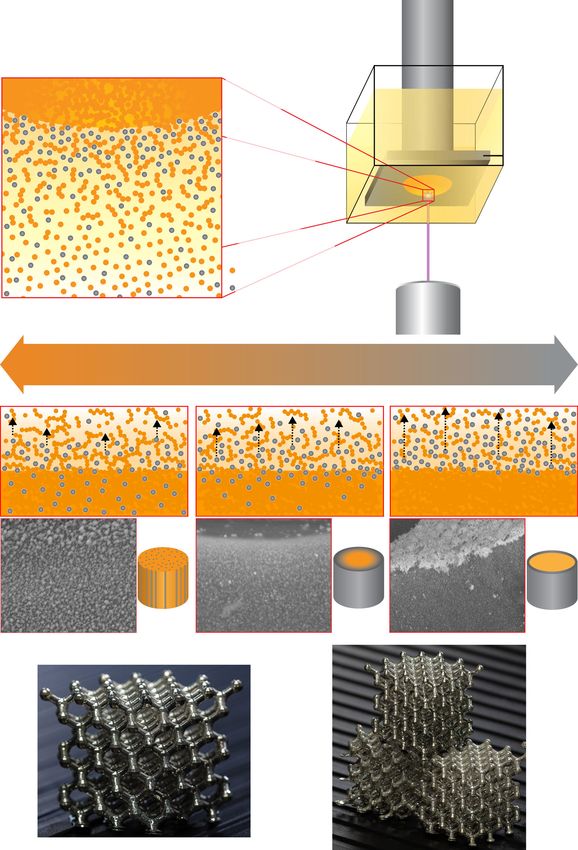
Fig. 6 3D printed dipole antenna array. a Photograph of antenna array (dimensions 10 cm by 10 cm). b Functional anechoic chamber layout showing
transmission between a gain standard horn antenna and antenna array under test. c 3D printed dipole antenna array normalized radiation pattern at 2.4
GHz compared with ideal array factor.
resin (40–65 wt. % DA-575) with 25 mL of a 35 wt. % DA-250 resin to vary the power: 150 mW (measured power output 29.2 mW), Machine size: 330 × 340 × 660
total amount of crosslinker between 39–58 wt. %. To make functional resin, 3.0 g of mm, Layer Height: 10–200 microns). Objects were printed using a fluorinated
Ag precursor was then added to 9.2 g of mixed DA-resin to adjust the amount of ethylene propylene liner-coated vat with laser power rating set to 75 and all other
Ag metal in the resin to 7.9 wt. %. The combined mixture was then vortex mixed settings set to the default. All cylinders were printed using light with an intensity of
and used to print truss structures used as the strain sensors. 760 W/cm2 other than optimization experiments where 350 and 560 W/cm2 were
used to explore the role of light intensity on the phase separation of silver as
Resin preparation for dipole antennas by phase separation. Resin mixtures were described in the Supplementary Information (Supplementary Table 4 and Sup-
prepared by mixing different volumes of two separately prepared DA-resins, plementary Fig. 14).
namely, 75 mL of 50 wt. % DA-575 with 25 mL of 35 wt. % DA-250. 3.0 g of Ag
precursor was then added to 9.2 g of mixed DA-resin to adjust the amount of Ag Sintering of printed 3D objects. 3D objects were thermally sintered on a Kapton
metal in the resin to 7.9 wt. %. The combined mixture was then vortex mixed and sheet at ~210 °C (substrate temperature) for an hour using a reflow oven under
used to print dipole antennas. nitrogen with 500 ppm oxygen to convert silver neodecanoate to metallic silver.
The mass loss of the 3D printed cylinders that contained no silver were analyzed by
Preparation of dipole antenna by electroless silver plating. The mixed DA-resins TGA under isothermal conditions at 210 °C. The mass loss after 1 h is minimal
were prepared by mixing different volumes of two separately prepared DA-resins demonstrating that the polymer does not degrade significantly during the sintering
such as 75 mL of 50 wt. % DA-575 and 25 mL of 35 wt. % DA-250. The dipole step (See Supplementary Fig. 15).
antennas were printed using the silver-free resin and subsequently seeded with
silver particles to yield an adherent and uniform silver coatings on the antenna Characterization of 3D objects. The resistance (R) values were taken by measuring
substrate. For a seeding pre-treatment procedure, antennas were dip coated with on the walls of the cylinders with the probes separated by 1 cm. Lead contact
100× dilute solution of commercial nanoparticle ink (SunTronic™ NANOSILVER) resistance was found to be negligible, and therefore, a two probe measurement
in toluene. The thin layer of seeds did not result in any measurable conductivity; method was used. Average resistances were obtained by measuring 10 different
however, this step was crucial to obtain uniform and adherent silver coating cylinders. Sheet resistances were calculated based on the circumference of the
through electroless plating. Further, electroless plating procedure was optimized by cylinder (W) and the length (L) between electrical probes (1 cm), where the sheet
varying the rate of addition and concentration of the silver plating bath solutions in resistance (Rs) is Rs ¼ R ´ W=L. Scanning electron microscopy (SEM) imaging and
order to obtain coatings with low surface roughness49. The electroless silver plating Electron Dispersive X-ray Spectroscopy (EDS) surface and cross-section analysis
bath was composed of solution A (0.2 g of glucose, 0.02 g of tartaric acid, and 0.5 were performed with a Hitachi SU3500 using an acceleration voltage of 15 kV
mL of ethanol in 20 mL of deionized water) and solution B, a Ag(NH3)2+ solution (SEM) and 30 kV (EDS) and a spot size of 30.
(0.2 g of AgNO3, 0.075 g of NaOH, and 0.5 mL of ammonia in 20 mL of deionized
water). Over a period of 60 mins, under constant stirring, these two solutions were Optical studies of resin (polymerization kinetics). The photopolymerization was
combined by dropwise addition of solution B into solution A in a bath containing studied using an experimental method employing an optical microscope to observe
the dipole antenna at room temperature. The antennas were then collected, rinsed the changes in refractive index which occurs as the resin polymerizes under illu-
with water and dried at 140 °C for 5 min. The adhesion of the silver coatings of the mination by a 405 nm laser as shown in Supplementary Fig. 16. Each resin was
samples prepared with the optimized electroless plating conditions was compared prepared in 2–10 mL quantities (see Supplementary Table 2 for formulations) and
to those obtained through phase separation (Supplementary Fig. 5). The adhesion loaded into a capillary micro glass slide (0.10 × 2.0 mm, 0.10 mm wall thickness;
of the silver coatings was determined by applying Scotch tape to the sample, Electron Microscopy Sciences). The resins were prepared without AgND as its
pressing firmly and removing the tape. presence made it more difficult to clearly determine the interface between the
polymer island and remaining resin in the capillary tube, but a similar gelation time
Functional resin preparation for antibacterial activity. 3D objects for antibacterial trend was found between resins with and without AgND for the DA-575 cross-
activity measurements were prepared using 0.0 to 1.0 wt. % of Ag metal in 35 wt. % linker (Supporting Information Fig. 6). The filled capillary micro glass slide was
DA-575 resin. placed under the optical microscope (Nikon ME600) fitted with a 405 nm laser and
optical filters (405 nm laser line and 405 nm Raman edge filters) to prevent
saturation of the camera with excess laser light. Laser power (10 µW with 1–2 µm
Printing, sintering and characterization of 3D objects diameter spot size and ~566 W/cm2 intensity) was set low enough to reveal
SLA printing of 3D objects. 3D objects using functional material were printed using polymerization in a 10–60 s timescale. Refractive index changes can be best
Peopoly Moai Laser SLA 3D Printer (Technical Specifications: Build Volume: visualized using phase-contrast imaging mode. Movies were acquired by a color
130 × 130 × 180 mm, Laser spot size: 70 microns, Laser wave length: 405 nm, Laser camera (Luminera Infinity2) and include an initial phase without laser
NATURE COMMUNICATIONS | (2021)12:55 | https://doi.org/10.1038/s41467-020-20256-3 | www.nature.com/naturecommunications 9ARTICLE NATURE COMMUNICATIONS | https://doi.org/10.1038/s41467-020-20256-3
illumination, followed by removal of a laser shutter where resin/crosslinker environment and, thus, varies as the probe explores different areas of the network.
exposure is initiated. A small dot is observed after a few seconds which subse- Further, since the simulations are limited in the size of the network that is
quently grows to an island several micrometers in diameter (200–400 µm). The constructed, the results will also vary between different simulations. Even though
shutter is closed and recording stopped once the island stopped growing (see the simulations are identical in procedure, if a different seed is used to initiate the
Supplementary Movies 1–3). Each recorded Movie was subsequently analyzed with dynamics then the network that is formed will be significantly different between
ImageJ. For a polymerized island, a slice through the center was selected to con- simulations and, thus, the calculated diffusion coefficient may also be significantly
struct a plot of the island size as a function of time (Supplementary Movie 3). The different.
start time was accurately determined from the slight change of illumination con- To account for these variations, simulations were performed using three
ditions when the shutter was On or Off. The two opposite edges of an island and different initial seeds to build three independent networks for each crosslinker
their time evolution can be clearly identified and fitted to Eq. (1): length. The final diffusion coefficient given in the main manuscript is the average of
pffiffiffiffiffiffiffiffiffiffiffi the value calculated for each realization. The error bars correspond to the standard
Profile ¼ ± Df Df e jðttd Þj=tc ð1Þ error as calculated across the ensemble of three.
where td is the delay time, tc is a rate dependent parameter, and Df is a size
dependent parameter. The td, which represents the time elapsed between when the Applications
laser is turned on and the first observable sign of polymer network, serves as a Strain sensor measurements. The 3D-printed truss objects (11.24 × 11.24 × 13.40
measure of relative gelation time. This was repeated two more times with newly mm) were affixed to a programmable linear stage (Zaber Technologies; model X-
filled capillary tubes for each formulation measured. LRQ150AP-E01) with aluminum tape and two-component silver epoxy (#8330S-
21G, MG Chemicals) as shown in Supplementary Fig. 18. The stage was controlled
using the LabVIEW software package and changes in electrical resistance were
Coarse-grain modeling of the diffusivity of a probe molecule. The simulations measured using a digital multimeter (Keithley Integra Series 2701 Ethernet Mul-
used standard coarse-grained (CG) polymer methodologies50 to construct a system timeter/Data Acquisition System) with probes connected to the aluminum tape. All
roughly modeled on the experimental setup. A cubic box was filled with CG samples were measured at a compression/elongation rate of 625 µm/s in incre-
polymers that represent the crosslinkers. Each polymer consists of L beads that are ments of 5 μm with a 1 s pause before each resistance measurement. The gauge
linearly joined together via finitely extensible nonlinear elastic (FENE) spring factor was calculated as follows:
bonds51 to prevent bond crossing. Intermolecular and intramolecular interactions h i
ΔR
between beads were implemented using the Weeks–Chandler–Andersen (WCA) R
GF ¼ h i
0
potential52 such that there is no attraction between beads, but instead there is only
ΔL
short ranged repulsion that yields excluded volume. Stiffness is imparted to each L0
polymer via a harmonic angle bond that causes a linear alignment of any three
consecutive monomers to be the energetically favorable conformation. A linear where ΔR is the difference in resistance between zero compression (R0) and a
arrangement of 3 beads, which approximate the size silver neodecanoate, was used compression of 250 μm (R), L0 is the length of the truss (13.4 mm) and ΔL is the
as a probe molecule. Each simulation included a single probe molecule. change in length (250 μm).
A length of L = 3 beads was chosen to roughly correspond to the length of the
DA-170 crosslinker. Silver neodecanoate, which is of similar length to DA-170, was Dipole antenna measurements. Dipole antennas were 3D printed using functional
also modeled as an L = 3 molecule. Simulations were also performed for crosslinker resin with Ag precursor adjusted so that the amount of Ag metal in the resin was
molecules of length L = 6 and L = 9 to study how the dynamics change with 7.9 wt. % and then glued on the substrate with conducting epoxy. A microstrip
crosslinker length. The L = 9 molecule was the longest length that could be studied array was used to feed four dipole antennas, which were metalized after 3D
due to constraints on the simulation setup. Thus, these simulations do not replicate printing via phase separation of Ag and post-printing sintering. The photograph of
the crosslinker ratios studied experimentally and instead explore the dependence the antenna array is shown in Fig. 6a. The dipole antenna measurements were
on crosslinker length in a more general way. performed in an anechoic chamber (Fig. 6b). The antennas were designed to be
The diameter of each bead was set to σ and, thus, σ serves as the length scale for centered at 2.4 GHz with a physical length of 6.25 cm. A gain standard horn
the simulation. The box length was set to 20 σ and each system was filled with antenna was positioned at one end of the chamber and connected to one port of a
enough polymers to achieve a volume fraction of 0.491. Simulations using the same Vector Network Analyser (VNA) through an amplifier. The device under test
particle model have demonstrated that the system will begin to crystallize at a (antenna array) was placed at the opposite end of the chamber on a rotating mount
volume fraction of 0.49239. Setting the volume fraction to 0.491, thus, mimics the and connected to the other port of the VNA. While rotating the antenna array, s-
experimental setup by retaining liquid-like behavior while ensuring that no voids parameter measurements were taken to determine the radiation of the antenna as a
will form during the polymerization process. The systems then consisted of: 2500 L function of angle. Only the positive going half of the radiation pattern was used to
= 3 crosslinkers +1 L = 3 probe molecules, 1250 L = 6 crosslinkers +1 L = 3 probe determine the half power beam width. A signal present at angles between 90 and
molecule, and 833 L = 9 crosslinkers +1 L=3 probe molecules. Images from the L 270 were due to the finite limitation of the ground plane and the noise naturally
= 3 and L = 9 systems are shown in the Supplementary Fig. 17. present in the system.
For each crosslinker length, simulations were performed for two scenarios:
diffusion of the probe molecules in pure resin (no polymerization of crosslinkers) Antibacterial activity: Halo inhibition zone test. Bacterial suspension TG1 (E. coli)
and in the final network (saturated polymerization). For both scenarios, the system at concentration of ~1 × 10⁹ colony-forming units (cfu)/mL was plated on an LB
was evolved in time via Langevin dynamics50 using the HOOMD blue simulation agar plate and incubated for 18 h at 37 °C to detect the existence of the growth
package53,54. inhibition halo around the samples.
The setup of each system consisted of a number of preliminary steps. First, the
box was filled with the specified number of polymers and one probe molecule being Bacterial growth kinetics test. To evaluate the bacterial growth kinetics in the liquid
constructed on a grid. Second, the system was randomized with a short simulation medium of E. coli, samples were placed in the diluted bacterial suspension at the
where there were no intermolecular interactions. This allows all molecules to pass concentration of 105–106 cfu/mL, which were subsequently cultured in a shaker
through each other and, thus, randomizing the system very quickly. Third, the incubator at 37 °C and 220 rpm. After predetermined times, the optical density, a
excluded volume interactions between beads on different molecules was ramped up measure of cell growth, was determined at 600 nm (OD600) using a microplate
until the full potential was applied. This method yielded the initial configurations reader (Varioskan Flash, Thermo Scientific).
shown in the Supplementary Fig. 17.
For the simulations of diffusion in pure resin, these initial states were then
evolved in time and the position of the probe molecule was monitored. The mean Data availability
square displacement (MSD) of the probe molecule was then calculated from these The datasets generated during and/or analyzed during this study are available from the
trajectories by internal averaging. The diffusion coefficient was extracted from a corresponding author on request.
linear fit of the MSD plotted against simulation time.
For the simulations of diffusion in the network, simulations were performed in
two steps. In the first step, a polymer network was formed by setting 10% of the Received: 5 May 2020; Accepted: 19 November 2020;
crosslinkers to be reactive allowing polymerization to take place via diffusion.
These network formation simulations were conducted for a long enough time
period that the rate of adding new crosslinking points became very small. The
resulting networks were then considered fully polymerized. Once the network was
formed, a second simulation was conducted in which the diffusion of the L = 3
probe molecule representing silver neodecanoate was monitored. No further References
polymerization occurred during this step. 1. Zastrow, B. M. The new 3D printing. Nature 578, 20–23 (2020).
Analysis of the MSD and resulting diffusion coefficient was conducted in the 2. Shusteff, M. et al. One-step volumetric additive manufacturing of complex
same manner as the pure resin case. However, there are more sources of variability polymer structures. Sci. Adv. 3, 1–7 (2017).
in the network case since the network is not homogenous (while the pure resin 3. Kelly, B. E. et al. Volumetric additive manufacturing via tomographic
essentially is). This means that the rate of diffusion depends on the local reconstruction. Science 363, 1075–1079 (2019).
10 NATURE COMMUNICATIONS | (2021)12:55 | https://doi.org/10.1038/s41467-020-20256-3 | www.nature.com/naturecommunicationsNATURE COMMUNICATIONS | https://doi.org/10.1038/s41467-020-20256-3 ARTICLE
4. Tumbleston, J. R. et al. Continuous liquid interface production of 3D objects. 33. Tanaka, T., Ishikawa, A. & Kawata, S. Two-photon-induced reduction of
Science 347, 1349–1352 (2015). metal ions for fabricating three-dimensional electrically conductive metallic
5. Wang, Y. M. et al. Additively manufactured hierarchical stainless steels with microstructure. Appl. Phys. Lett. 88, 081107-1–081107–4 (2006).
high strength and ductility. Nat. Mater. 17, 63–71 (2018). 34. Liu, K. & Jiang, L. Bio-inspired design of multiscale structures for. Nano
6. Kuang, X. et al. Advances in 4D printing: materials and applications. Adv. Today 6, 155–175 (2011).
Funct. Mater. 29, 1–23 (2019). 35. Hu, Q. et al. Additive manufacture of complex 3D Au-containing
7. Skylar-scott, M. A., Mueller, J., Visser, C. W. & Lewis, J. A. Voxelated soft nanocomposites by simultaneous two-photon polymerisation and
matter via multimaterial multinozzle 3D printing. Nature 575, 330–353 photoreduction. Sci. Rep. 7, 17150 (2017).
(2019). 36. Giachini, P. A. G. S. et al. Additive manufacturing of cellulose-based materials
8. Moore, D. G., Barbera, L., Masania, K. & Studart, A. R. Three-dimensional with continuous, multidirectional stiffness gradients. Sci. Adv. 6, 1–11 (2020).
printing of multicomponent glasses using phase-separating resins. Nat. Mater. 37. Wu, S.-Y., Yang, C., Hsu, W. & Lin, L. 3D-Printed microelectronics for
19, 212–217 (2020). integrated circuitry and passive wireless sensors. Microsyst. Nanoeng. 1, 15013
9. Schwartz, J. J. & Boydston, A. J. Multimaterial actinic spatial control 3D and (2015).
4D printing. Nat. Commun. 10, 791 (2019). 38. Kell, A. J. et al. Versatile molecular silver ink platform for printed flexible
10. Walker, D. A., Hedrick, J. L. & Mirkin, C. A. Rapid, large-volume, thermally electronics. ACS Appl. Mater. Interfaces 9, 17226–17237 (2017).
controlled 3D printing using a mobile liquid interface. Science 366, 360–364 39. Heo, D. N. et al. Development of 3D printable conductive hydrogel with
(2019). crystallized PEDOT:PSS for neural tissue engineering. Mater. Sci. Eng. C 99,
11. Sydney Gladman, A., Matsumoto, E. A., Nuzzo, R. G., Mahadevan, L. & Lewis, 582–590 (2019).
J. A. Biomimetic 4D printing. Nat. Mater. 15, 413–418 (2016). 40. Peppas, N. A. & Lafayette, W. A kinetic study of diacrylate
12. Prendergast, M. E. & Burdick, J. A. Recent advances in enabling technologies photopolymerizations. Polymer 35, 1004–1011 (1994).
in 3D printing for precision medicine. Adv. Mater. 31, 1–14 (2019). 41. Cai, L., Panyukov, S. & Rubinstein, M. Hopping diffusion of nanoparticles in
13. Hajiesmaili, E. & Clarke, D. R. Reconfigurable shape-morphing dielectric polymer matrices. Macromolecule 48, 847–862 (2015).
elastomers using spatially varying electric fields. Nat. Commun. 10, 183 42. Davoodi, E. et al. 3D-Printed ultra-robust surface-doped porous silicone
(2019). sensors for wearable biomonitoring. ACS Nano 14, 1520–1532 (2020).
14. Yang, Y. et al. Recent progress in biomimetic additive manufacturing 43. Xie, L. & Zhu, Y. Tune the phase morphology to design conductive polymer
technology: from materials to functional structures. Adv. Mater. 30, 1–34 composites: a review. Polym. Compos. 39, 2985–2996 (2018).
(2018). 44. Liu, H. et al. Electrically conductive polymer composites for smart flexible
15. Patel, D. K., Sakhaei, A. H., Layani, M., Zhang, B. & Ge, Q. Highly stretchable strain sensors: a critical review. J. Mater. Chem. C 6, 12121–12141 (2018).
and UV curable elastomers for digital light processing based 3D printing. Adv. 45. Ranjbar Naeini, M., Mirmozafari, M. & Van Der Weide, D. Monolithic 3-D
Mater. 29, 1–7 (2017). Printing of an Integrated Marchand Balun with a Dipole Antenna. IEEE
16. Kotz, F. et al. Three-dimensional printing of transparent fused silica glass. Trans. Components Packag. Manuf. Technol. 10, 654–658 (2020).
Nature 544, 337–339 (2017). 46. Noronha, V. T. et al. Silver nanoparticles in dentistry. Dent. Mater. 33,
17. Yin, H., Ding, Y., Zhai, Y., Tan, W. & Yin, X. Orthogonal programming of 1110–1126 (2017).
heterogeneous micro-mechano-environments and geometries in three- 47. Rizzello, L. & Pompa, P. P. Nanosilver-based antibacterial drugs and devices:
dimensional bio-stereolithography. Nat. Commun. 9, 4096 (2018). mechanisms, methodological drawbacks, and guidelines. Chem. Soc. Rev. 43,
18. Dolinski, N. D. et al. Solution Mask Liquid Lithography (SMaLL) for one-step, 1501–1518 (2014).
multimaterial 3D printing. Adv. Mater. 1800364, 1–6 (2018). 48. Le Ouay, B. & Stellacci, F. Antibacterial activity of silver nanoparticles: a
19. Park, J. J. et al. Pattern formation of silver nanoparticles in 1-, 2-, and 3D surface science insight. Nano Today 10, 339–354 (2015).
microstructures fabricated by a photo- and thermal reduction method. Adv. 49. Tai, Y., Xu, C. & Chen, H. Silver-coated glass fabric composites prepared by
Funct. Mater. 20, 2296–2302 (2010). electroless plating. Mater. Lett. 180, 144–147 (2016).
20. Fantino, E. et al. 3D printing of conductive complex structures with in situ 50. Holm, C. et al. Modeling the separation of macromolecules: a review of
generation of silver nanoparticles. Adv. Mater. 28, 3712–3717 (2016). current computer simulation methods. Electrophoresis 30, 792–818 (2009).
21. Fantino, E. et al. In situ thermal generation of silver nanoparticles in 3D 51. Grest, G. S., Kremer, K. & Carlo, M. Molecular dynamics simulation for
printed polymeric structures. Materials 9, 21–23 (2016). polymers in the presence of a heat bath. Phys. Rev. A 33, 3628–3631 (1986).
22. Wang, X. et al. Blue laser projection printing of conductive complex 2D and 52. Weeks, J. D., Chandler, D. & Andersen, H. C. Role of repulsive forces in
3D metallic structures from photosensitive precursors. ACS Appl. Mater. determining the equilibriums structure of simple liquids. J. Chem. Phys. 54,
Interfaces 11, 21668–21674 (2019). 5237–5247 (1971).
23. Gabriele, T., Sciancalepore, C., Bondioli, F. & Messori, M. Special resins for 53. Anderson, J. A., Lorenz, C. D. & Travesset, A. General purpose molecular
stereolithography: in situ generation of silver nanoparticles. Polymer 10, 1–14 dynamics simulations fully implemented on graphics processing units. J.
(2018). Comput. Phys. 227, 5342–5359 (2008).
24. Tran-Cong-Miyata, Q. & Nakanishi, H. Phase separation of polymer mixtures 54. Glaser, J. et al. Strong scaling of general-purpose molecular dynamics
driven by photochemical reactions: current status and perspectives. Polym. Int. simulations on GPUs. Comput. Phys. Commun. 192, 97–107 (2015).
66, 213–222 (2017).
25. Sutherland, R. L., Tomlin, D. & Bunning, T. J. Holographic formation of
electro-optical polymer-liquid crystal photonic crystals. Adv. Mater. 14,
187–191 (2002). Acknowledgements
26. Biria, S. & Hosein, I. D. Superhydrophobic microporous substrates via We thank Mary Foss for antibacterial studies, Douglas Moffatt for strain sensor
photocuring: coupling optical pattern formation to phase separation for experimental setup and Mary Gallerneault for dipole antenna SEM analysis, TGA, and
process-tunable pore architectures. ACS Appl. Mater. Interfaces 10, 3094–3105 editing.
(2018).
27. Meng, S. et al. Holographic photopolymerization-induced phase separation in
reference to the phase diagram of a mixture of photocurable monomer and
nematic liquid crystal. Macromolecules 38, 4844–4854 (2005). Author contributions
28. Rocco, C. et al. Highly-interpenetrated and phase-separated UV-cured B.D. and C.P. conceived the idea together and designed the experiments. H.W.d.H.
interpenetrating methacrylate – epoxide polymer networks: influence of the devised and performed the simulations, as well as interpreted results. K.L.S. acquired the
composition on properties and microstructure. Mater. Today Commun. 6, gelation rates, T.L. fabricated and measured the response of the strain sensors, and J. L.
17–27 (2016). designed and setup the in-situ measurement of polymer network formation. The antenna
29. Paquet, C. & Kumacheva, E. Patterning semiconductor nanocrystals in measurements were performed by J.H. while the interpretation of the results were done
polymer films. Adv. Funct. Mater. 17, 3105–3110 (2007). by J.H. and R.E.A. J.T. performed the antimicrobial experiment. N.K and L.S.Y. printed,
30. Vyatskikh, A. et al. Additive manufacturing of 3D nano-architected metals. processed, and characterized printed cylinders. Material characterization was performed
Nat. Commun. 9, 593 (2018). by B.D., C.P., K.L.S., and T.L. The manuscript was co-written by B.D., C.P., K.L.S., T.L., J.
31. Seol, S. K. et al. Electrodeposition-based 3D printing of metallic L., J.H., H.W.d.H., J.T., and P.R.L.M.
microarchitectures with controlled internal structures. Small 11, 3896–3902
(2015).
32. Hirt, L. et al. Template-free 3D microprinting of metals using a force-
controlled nanopipette for layer-by-layer electrodeposition. Adv. Mater. 28, Competing interests
The authors declare no competing interests.
2311–2315 (2016).
NATURE COMMUNICATIONS | (2021)12:55 | https://doi.org/10.1038/s41467-020-20256-3 | www.nature.com/naturecommunications 11You can also read