Despite vaccination, China needs non-pharmaceutical interventions to prevent widespread outbreaks of COVID-19 in 2021 - Nature
←
→
Page content transcription
If your browser does not render page correctly, please read the page content below
Articles
                                                                                                        https://doi.org/10.1038/s41562-021-01155-z

Despite vaccination, China needs non-
pharmaceutical interventions to prevent
widespread outbreaks of COVID-19 in 2021
Juan Yang 1,2,8, Valentina Marziano 3,8, Xiaowei Deng1, Giorgio Guzzetta 3, Juanjuan Zhang1,2,
Filippo Trentini 3, Jun Cai 1, Piero Poletti 3, Wen Zheng1, Wei Wang1, Qianhui Wu1, Zeyao Zhao1,
Kaige Dong1, Guangjie Zhong1, Cécile Viboud 4, Stefano Merler3,9, Marco Ajelli 5,6,9 ✉ and
Hongjie Yu 1,2,7,9 ✉

COVID-19 vaccination is being conducted in over 200 countries and regions to control SARS-CoV-2 transmission and return
to a pre-pandemic lifestyle. However, understanding when non-pharmaceutical interventions (NPIs) can be lifted as immunity
builds up remains a key question for policy makers. To address this, we built a data-driven model of SARS-CoV-2 transmission
for China. We estimated that, to prevent the escalation of local outbreaks to widespread epidemics, stringent NPIs need to
remain in place at least one year after the start of vaccination. Should NPIs alone be capable of keeping the reproduction num-
ber (Rt) around 1.3, the synergetic effect of NPIs and vaccination could reduce the COVID-19 burden by up to 99% and bring Rt
below the epidemic threshold in about 9 months. Maintaining strict NPIs throughout 2021 is of paramount importance to reduce
COVID-19 burden while vaccines are distributed to the population, especially in large populations with little natural immunity.

T
       he novel coronavirus disease 2019 (COVID-19) pandemic                      To avoid widespread transmission of SARS-CoV-2, since the
       is far from over, with cases still surging in many countries           end of the first COVID-19 wave in the spring of 2020, China has
       across the globe, particularly with India suffering from a             implemented strict NPIs and has successfully controlled local out-
catastrophic second wave1. In 2020, epidemic suppression and/                 breaks, preventing a second widespread wave of COVID-19. Since
or mitigation have relied on non-pharmaceutical interventions                 December 2020, China has given conditional approval or emergency
(NPIs), including social distancing, school closure, mask use and             use approval for seven COVID-19 vaccines. As of 1 June 2021, 681.9
case isolation. Although effective and widely adopted to limit                million doses (roughly corresponding to 24.3% of the population)
severe acute respiratory syndrome coronavirus 2 (SARS-CoV-2)                  have been administered6. However, such a coverage is still extremely
transmission and reduce COVID-19 burden, these interventions                  low, and thus China remains highly vulnerable to importations of
entail enormous economic costs and negatively affect quality of               SARS-CoV-2 and onward transmission, as proved by several local
life2. Additionally, in many countries, relaxation of NPIs has led            outbreaks that occurred in the first four months of 2021, the largest
to a resurgence of the epidemic as herd immunity has not been                 of which occurring in Heilongjiang Province led to 636 reported
reached thus far3.                                                            cases and spilled over to a neighbouring province (over 300 cases
    Effective vaccines against COVID-19 remain the only fore-                 were reported in Jilin)7. At present, estimating whether and when
seeable means of both suppressing the infection and returning to              NPIs can be lifted, and the extent to which we need to rely on NPIs
pre-pandemic social and economic activity patterns. Globally,                 while vaccines roll out, represents a top priority for policy making.
several vaccines have been licensed, and vaccination programmes                   This question has not been well addressed in China, one of the
have been initiated in more than 200 countries/regions, including             few countries in the world where nearly the entire population is still
China4. However, the projected global production and delivery                 susceptible to SARS-CoV-2 infection and home to almost 1.4 billion
capacities are likely to be inadequate to provide COVID-19 vaccines           individuals (roughly 18% of the world population). To fill this gap, we
to all individuals who are still susceptible to SARS-CoV-2 infec-             built on top of the wide body of work adopting mathematical mod-
tion3. The effectiveness of COVID-19 vaccination campaigns will               els of the infection transmission process to evaluate vaccination pro-
depend on several factors, including pre-existing immunity, vaccine           grammes8–12. In particular, we developed an age-structured stochastic
supply, willingness to receive the vaccine and strategies for vaccine         model to simulate SARS-CoV-2 transmission triggered by cases
allocation and deployment5.                                                   imported in Mainland China, based on a susceptible–infectious–

Shanghai Institute of Infectious Disease and Biosecurity, School of Public Health, Fudan University, Shanghai, China. 2Fudan University, Key Laboratory
1

of Public Health Safety, Ministry of Education, Shanghai, China. 3Center for Health Emergencies, Bruno Kessler Foundation, Trento, Italy. 4Division
of International Epidemiology and Population Studies, Fogarty International Center, National Institutes of Health, Bethesda, MD, USA. 5Department
of Epidemiology and Biostatistics, Indiana University School of Public Health, Bloomington, IN, USA. 6Laboratory for the Modeling of Biological and
Socio-technical Systems, Northeastern University, Boston, MA, USA. 7Department of Infectious Diseases, Huashan Hospital, Fudan University, Shanghai,
China. 8These authors contributed equally: Juan Yang, Valentina Marziano. 9These authors jointly supervised this work: Stefano Merler, Marco Ajelli,
Hongjie Yu. ✉e-mail: marco.ajelli@gmail.com; yhj@fudan.edu.cn

Nature Human Behaviour | www.nature.com/nathumbehav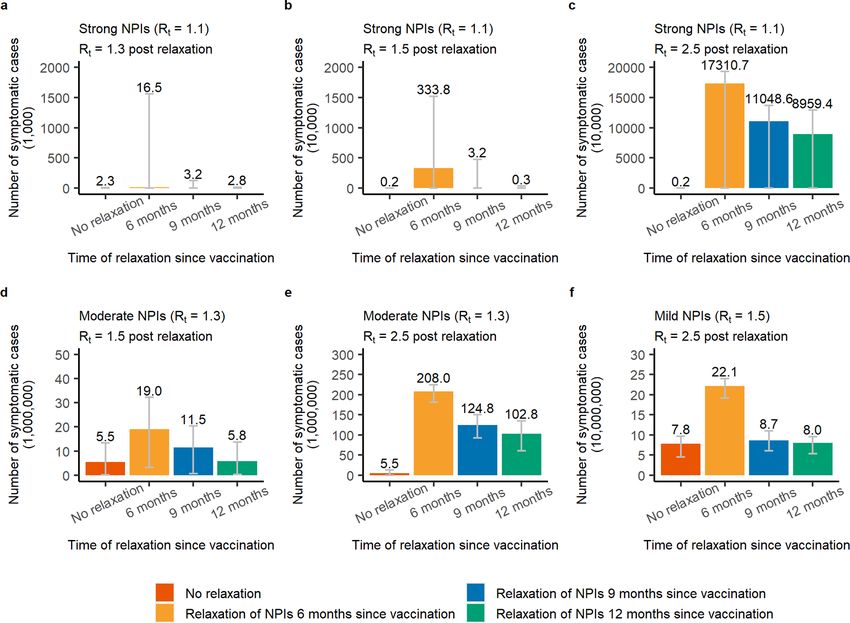
Articles                                                                                          NATuRE HuMAn BEhAVIOuR

removed (SIR) scheme (Supplementary Fig. 1). We consider a situa-        hospitalizations, 7.2 million (95% CI 6.0–7.8 million) ICU admis-
tion with (i) no ongoing widespread SARS-CoV-2 transmission, (ii)        sions and 9.4 million (95% CI 7.7–10.3 million) deaths (Fig. 2).
nearly no immunity in the population and (iii) high risk of importing         Provided that NPIs are in place and can keep Rt at 1.3 in the
SARS-CoV-2-infected individuals, possibly leading to an upsurge of       absence of vaccination (‘moderate NPIs scenario’), the vaccina-
COVID-19 cases. Since COVID-19 vaccines are expected to con-             tion programme could reduce COVID-19 burden by about 99%
tinue rolling out throughout 2021–2022, we consider also alterna-        compared with the ‘reference scenario’, with 5.5 million (95% CI
tive scenarios where SARS-CoV-2 infections leading to an outbreak        2.5–13.4 million) symptomatic cases, 1.8 million (95% CI 0.8–4.4
are imported when 10%, 20% (close to the coverage as of the end of       million) hospitalizations, 73,500 (95% CI 7,300–152,100) ICU
May 2021) and 30% of the Chinese population has already been vac-        admissions and 76,700 (95% CI 8,200–165,700) deaths (Fig. 2). In
cinated (according to the simulated vaccination programme).              this context, vaccination decreases COVID-19 burden by about
    In the model, we account for heterogeneous mixing patterns           40% (Fig. 2) compared with a situation with moderate NPI alone,
by age13 and progressive vaccine deployment among different              and Rt falls below the epidemic threshold about 9 months after the
population segments based on a priority scheme (essential work-          epidemic start (Fig. 1h). At the time that Rt falls below 1, we esti-
ers, older adults, individuals with underlying conditions, etc.)14.      mate that 50.8% of the total population would have been vaccinated,
Further, we overlay a disease burden model on the transmission           while 0.8% would have been naturally infected (Fig. 1i). This high-
model to estimate the number of symptomatic cases, hospitaliza-          lights that a relevant proportion of the population would still be
tions, intensive care unit (ICU) admissions and deaths under dif-        susceptible to SARS-CoV-2 at that time. Although in the long term
ferent vaccination scenarios and based on empirical data15–20. The       vaccination can ultimately lead to the suppression of transmission,
resulting integrated model is informed by data on COVID-19               it is necessary to maintain NPIs for one year after the onset of vacci-
natural history, age-mixing patterns specific to China quantified        nation. Indeed, if NPIs are relaxed from moderate (Rt = 1.3) to mild
during the pre-pandemic period and the size of the different vac-        (Rt = 1.5) 9 months after vaccination start, the cumulative number
cination targets in the Chinese population (for example, individu-       of symptomatic cases could double (Extended Data Figs. 1 and 2),
als with pre-existing conditions). A qualitative model description       and the cumulative death toll could increase from 76,700 to 173,000
is reported in Methods section, a summary of model parameters            (Extended Data Fig. 3). In contrast, a small increase in cumulative
and data sources is reported in Supplementary Table 1 and all other      deaths from 76,700 to 81,700 is expected if this relaxation occurs
details are reported in Supplementary Files 1–5.                         one year after vaccination start (Extended Data Fig. 3), while earlier
    The combined effects of NPIs and vaccination programmes              or more drastic relaxations of NPIs lead to substantial increases in
are evaluated in terms of their ability to reduce the disease burden     deaths (Extended Data Fig. 3).
caused by outbreaks arising from possible importation of cases.               A combination of more stringent NPIs (that is, capable of keeping
    We considered a baseline vaccination scenario where: (1) vacci-      Rt = 1.1) and vaccination (‘vax + strong NPIs’ scenario) could sup-
nation starts 15 days after an outbreak triggered by 40 breakthrough     press the epidemic, with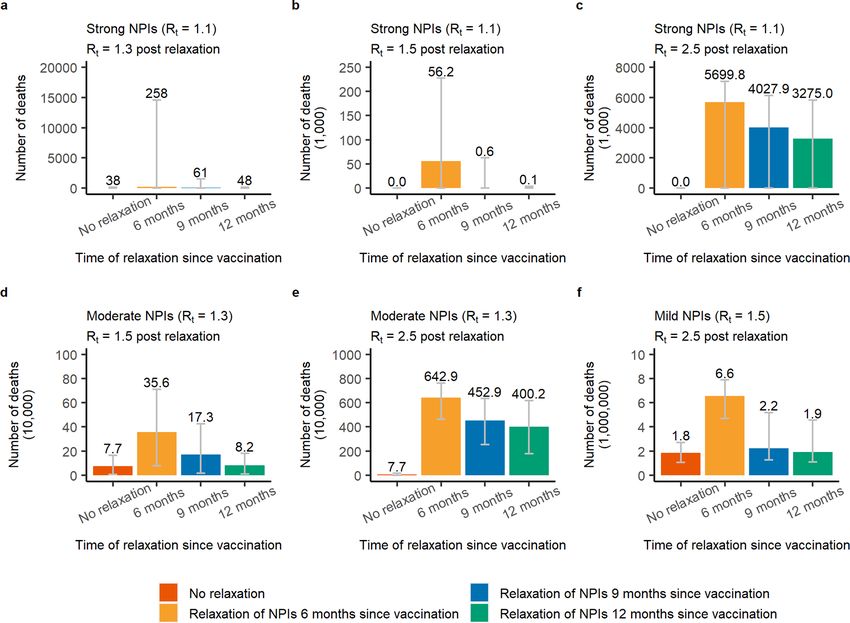
NATuRE HuMAn BEhAVIOuR Articles
a b c
No NPIs (Rt = 2.5) No NPIs (Rt = 2.5) No NPIs (Rt = 2.5)
Number of symptomatic cases
200 3.4 12 80
Proportion among total
Number (100,000,000)
2.8
population (%)
150 9 60
(100,000)
2.2 7.5 (52.2%)
100 6
Rt
1.6 40
69
50 1.0 3 20
1 (6.7%)
0 0 0 0
0
0
0
60
60
60
120
180
240
300
360
420
480
540
600
660
720
120
180
240
300
360
420
480
540
600
660
720
120
180
240
300
360
420
480
540
600
660
720
Time (days) Time (days) Time (days)
d e f
Mild NPIs (Rt = 1.5) Mild NPIs (Rt = 1.5) Mild NPIs (Rt = 1.5)
Number of symptomatic cases
50 3.4 12 80
Proportion among total
Number (100,000,000)
40 2.8
population (%)
9 60
(100,000)
30 2.2
6
Rt
1.6 40
20 4.5 (31.4%)
188
1.0 3
10 20
1.6 (11%)
0 0 0 0
0
0
0
60
60
60
120
180
240
300
360
420
480
540
600
660
720
120
180
240
300
360
420
480
540
600
660
720
120
180
240
300
360
420
480
540
600
660
720
Time (days) Time (days) Time (days)
g h i
Moderate NPIs (Rt = 1.3) Moderate NPIs (Rt = 1.3) Moderate NPIs (Rt = 1.3)
Number of symptomatic cases
25 3.4 12 80
Proportion among total
Number (100,000,000)
20 2.8
population (%)
9 60
(100,000)
15 2.2 7.3 (50.8%)
6
Rt
1.6 40
10
280
1.0 3
5 20
0.1 (0.8%)
0 0 0 0
0
0
0
60
60
60
120
180
240
300
360
420
480
540
600
660
720
120
180
240
300
360
420
480
540
600
660
720
120
180
240
300
360
420
480
540
600
660
720
Time (days) Time (days) Time (days)
j k l
Strong NPIs (Rt = 1.1) Strong NPIs (Rt = 1.1) Strong NPIs (Rt = 1.1)
Number of symptomatic cases
5 3.4 12 80
Proportion among total
Number (100,000,000)
4 2.8
population (%)
9 8.5 (59.4%) 60
(100,000)
3 2.2
6
Rt
1.6 40
2
321
1.0 3
1 20
0 (0%)
0 0 0 0
0
0
0
60
60
60
120
180
240
300
360
420
480
540
600
660
720
120
180
240
300
360
420
480
540
600
660
720
120
180
240
300
360
420
480
540
600
660
720
Time (days) Time (days) Time (days)
No vaccination Vaccination: 80% VE Natural infected Vaccinated
Fig. 1 | Time series of symptomatic cases, effective reproductive number, Rt, and population infected and vaccinated. a, Number of symptomatic cases
over time as estimated in the no-NPIs scenario (initial Rt = 2.5) in the absence or presence of vaccination. b, Net reproduction number Rt over time, as
estimated using a Bayesian framework (Supplementary File 5) from the time series of symptomatic cases in the no-NPIs scenario in the presence of
vaccination. The horizontal line indicates the epidemic threshold Rt = 1, and the vertical line indicates where Rt crosses this threshold. Note that, for the
first few generations of cases, Rt shows an increasing pattern linked to the highly stochastic nature of epidemics in their initial phase when epidemics
with initially larger Rt are more likely to survive69. For the same reason, the adopted methodology tends to overestimate Rt in the epidemic tail69; as such,
Rt is shown in the core part of the epidemic only. c, Absolute numbers and proportion of the Chinese population infected and vaccinated over time in the
no-NPIs scenario in the presence of vaccination. The population of China in 2020 is 1,439,324,000 (ref. 57). d–f, As in a–c but for the mild NPIs scenario
(initial Rt = 1.5). g–i, As in a–c but for the moderate NPIs scenario (initial Rt = 1.3). j–l, As in a–c but for the strong NPIs scenario (initial Rt = 1.1). Line denotes
median, and shadow denotes quantiles 0.025 and 0.975.
estimated with the baseline capacity of 6 million doses). At that (Extended Data Figs. 5 and 6) or 15 million doses (Extended Data
time, over 60% of the population would be vaccinated and ≤0.1% Figs. 7 and 8) would allow a relaxation of NPIs from moderate to
would be naturally infected. An upscale in the daily capacity to 10 mild already 6–9 months after vaccination start, that is, 3–6 months
Nature Human Behaviour | www.nature.com/nathumbehav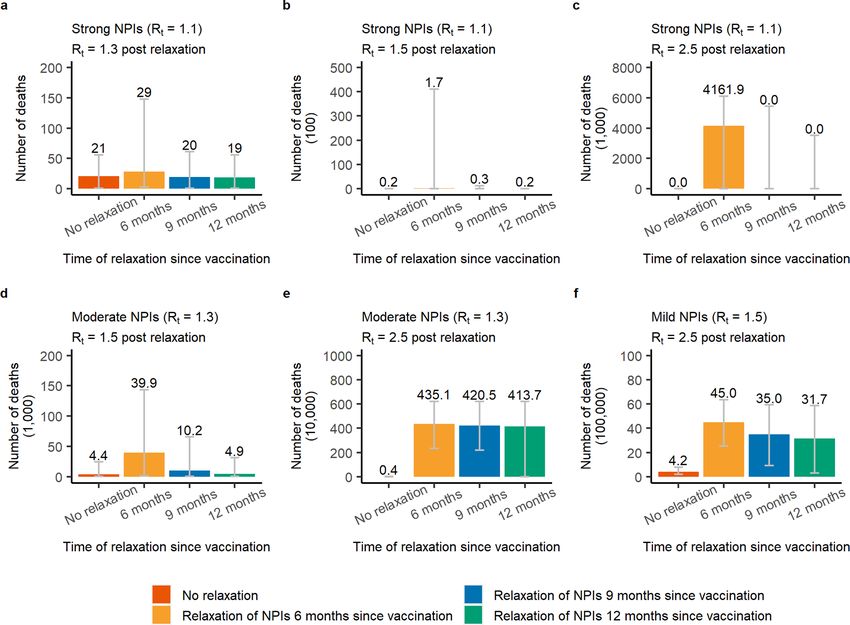
Articles NATuRE HuMAn BEhAVIOuR
a b
98.3 100
400 100 85.0
Reduction in symptomatic cases
Number of symptomatic cases
75.5 15.0
317.1 306.7
300 75 56.8 41.5
(1,000,000)
193.5 36.5
39.0
(%)
200 50
136.9
77.8
100 47.6 25
5.5 3.3
0.0 0
0 0
No vax Vax No vax Vax No vax Vax No vax Vax No vax Vax No vax Vax No vax Vax No vax Vax
No NPIs Mild NPIs Moderate NPIs Strong NPIs No NPIs Mild NPIs Moderate NPIs Strong NPIs
c d 98.3 100
150 100 85.4
Reduction in hospitalizations
76.7 14.6
Number of hospitalizations
120 103.5 99.3 41.0
75 57.3
(1,000,000)
90 37.4
(%)
62.8 50 39.3
60 44.2
24.1 25
30 15.1
1.8 4.1
0.0 0
0 0
No vax Vax No vax Vax No vax Vax No vax Vax No vax Vax No vax Vax No vax Vax No vax Vax
No NPIs Mild NPIs Moderate NPIs Strong NPIs No NPIs Mild NPIs Moderate NPIs Strong NPIs
e f 99.0 100
15 100 87.3
Reduction in ICU admissions
80.1 12.7
Number of ICU admissions
12 40.5
75 58.5
(1,000,000)
9 7.6 7.2 39.5
40.5
(%)
50
6 4.5
3.2
25
3 1.5 1.0
5.7
0.1 0.0 0
0 0
No vax Vax No vax Vax No vax Vax No vax Vax No vax Vax No vax Vax No vax Vax No vax Vax
No NPIs Mild NPIs Moderate NPIs Strong NPIs No NPIs Mild NPIs Moderate NPIs Strong NPIs
g h 99.2 100
15 100 87.8
81.7 12.2
12
Reduction in deaths
10.1 39.1
Number of deaths
9.4 75 60.2
(1,000,000)
9 39.8
5.8 41.8
(%)
50
6 4.0
1.8 25
3 1.2
6.7
0.1 0.0 0
0 0
No vax Vax No vax Vax No vax Vax No vax Vax No vax Vax No vax Vax No vax Vax No vax Vax
No NPIs Mild NPIs Moderate NPIs Strong NPIs No NPIs Mild NPIs Moderate NPIs Strong NPIs
Fig. 2 | Burden of COVID-19 in the main analysis. a, Cumulative number of symptomatic cases as estimated under the different scenarios in the absence
or presence of vaccination over the simulated 2-year period. No vaccination + no NPIs with Rt = 2.5 at the beginning of the outbreak is called the ‘reference
scenario’, described using dark orange bars. Light-yellow bars indicate scenarios including vaccination and/or different levels of NPIs. b, Reduction in the
cumulative number of symptomatic cases with respect to the reference scenario. Orange bars and values written in black indicate the contribution of NPIs;
blue bars and values written in black indicate the overall contribution of vaccination and NPIs, while the values written in white indicate net contribution of
vaccination. c,d, As in a,b but for hospitalized cases. e,f, As in a,b but for cases admitted to ICU. g,h, As in a,b but for deaths. Number denotes median, and
error bars denote quantiles 0.025 and 0.975.
earlier with respect to the baseline. On the other hand, more drastic employed in cold chain, etc.) to maintain essential services and then
relaxations of NPIs (for example, from moderate to no NPIs) would explore different prioritization strategies for the rest of the popula-
still lead to substantial increases in symptomatic cases and deaths tion. Our results suggest that the relative timing of the epidemic and
(Extended Data Figs. 5–8). of the vaccination rollout play a key role in determining the most
effective strategy. In particular, if we consider vaccination to start
Vaccination prioritization. We consider alternative vaccination two weeks after 40 cases are detected, there is no clear prioritiza-
scenarios that prioritize essential workers (staff working in health- tion strategy that minimizes deaths, as the outcome of the vaccina-
care, law enforcement, security and community services, individuals tion campaign depends heavily on the timing at which the epidemic
Nature Human Behaviour | www.nature.com/nathumbehav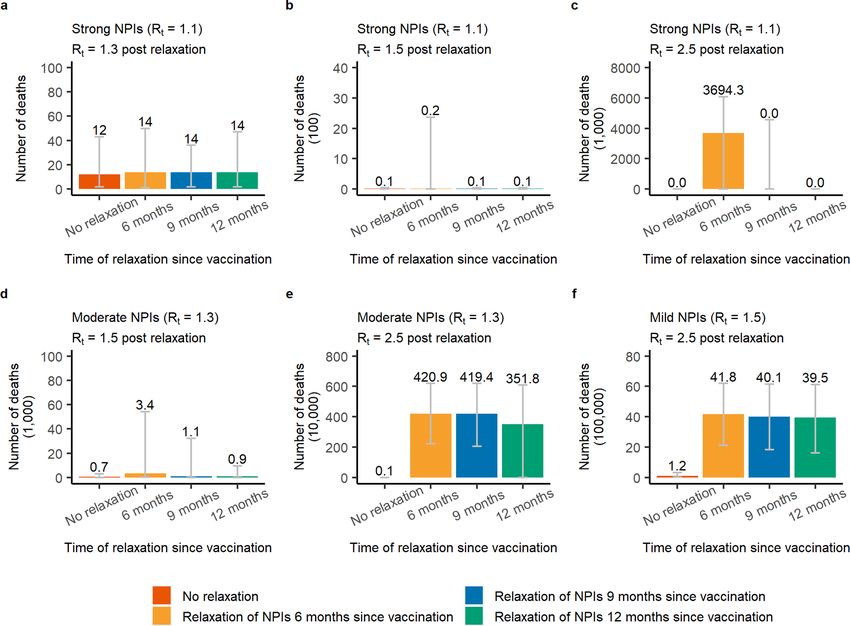
NATuRE HuMAn BEhAVIOuR Articles
a
Unit: 10,000 Unit: 10
12 20 20
7.7 3.8
10.1 10.0
9.4
9.0 8.6
2.1 1.2
Number of deaths (1,000,000)
9 7.7 0.4 0.8
0.1 0
0 0
5.8 Moderate NPIs (Rt = 1.3) Strong NPIs (Rt = 1.1)
4.8
6 4.0
2.4
3 1.8
1.2
0.4
0.1 0 0.1 0
0 0 0 0 0 0 0
0
No NPIs (Rt = 2.5) Mild NPIs (Rt = 1.5) Moderate NPIs (Rt = 1.3) Strong NPIs (Rt = 1.1)
b
95.8 98.8 99.8 99.2 100 100 100 87.8
99.9 100 100 100 100
100
81.7
75.7
75
Reduction in deaths (%)
60.2
52.2
41.8
50
23.9
25
14.7
10.5
6.7
0 0.8
0
No NPIs (Rt = 2.5) Mild NPIs (Rt = 1.5) Moderate NPIs (Rt = 1.3) Strong NPIs (Rt = 1.1)
Daily doses administered No vaccination 1,300,000 6,000,000 10,000,000 15,000,000 30,000,000
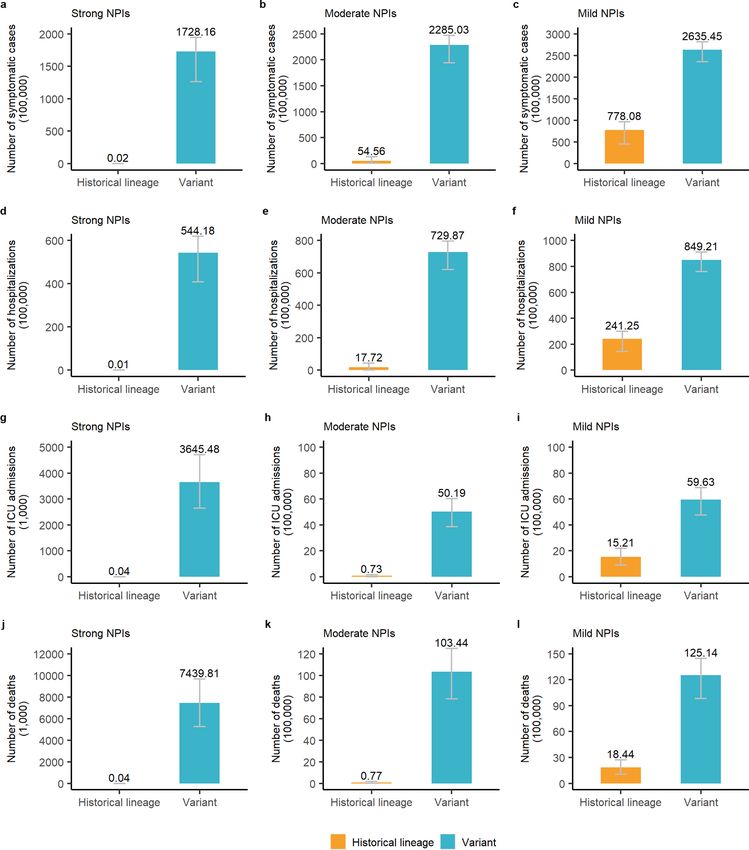
Fig. 3 | Impact of daily vaccine administration capacity on COVID-19 deaths. a, Cumulative number of COVID-19 deaths (millions) as estimated in the different
scenarios under progressively increasing values of the daily vaccination capacity. b, Proportion of deaths averted compared with the reference scenario, that is,
no vaccination + no NPIs with Rt = 2.5 at the beginning of the outbreak. Number denotes median, and error bars denote quantiles 0.025 and 0.975.
unfolds (Fig. 4 and Supplementary Figs. 4 and 5). Instead, if the epi- of NPIs in the absence of immunity, increasing proportions of vac-
demic is already underway when the vaccination campaign starts cinated individuals will decrease the effective reproduction number
(>5,000 cases), prioritizing working-age groups minimizes the (for example, Rt = 1.1 in the absence of immunity corresponds to Rt
number of deaths when Rt ≤ 1.3. In contrast, prioritizing older adults below the epidemic threshold if 10% or more of the population has
and individuals with underlying conditions is more effective when been vaccinated).
Rt ≥ 1.5 (direct benefits are higher; Fig. 4 and Supplementary Figs. Should 30% of the population already have been vaccinated
4 and 5). Two results are independent of the adopted prioritization before the start of a new wave, continuing the vaccination pro-
strategy: (i) if Rt ≥ 1.5, then an epidemic cannot be avoided, and (ii) gramme while adopting mild NPIs would reduce the death toll by
when Rt = 1.1, over 99% of deaths can be averted (Supplementary 98% (42,400 deaths as compared with 1.8 million if no one was vac-
Figs. 4 and 5). cinated). However, in the absence of NPIs, even if 30% of popula-
tion were already vaccinated before the start of a new wave, carrying
Population immunity at the onset of an outbreak. In December on with the vaccination programme alone would not be enough to
2020, vaccination started in China, while measures to detect imported prevent a widespread epidemic leading to 6 (95% CI 4–7) million
cases and case surveillance are in place. The number of doses dis- deaths (Fig. 5).
tributed per day has changed over time, following an increasing
trend and with a daily average of about 6 million doses over the Vaccination coverage. No significant difference in willingness
period between late March and mid May 2021 (Supplementary File to vaccinate between age groups has been reported in China36–38.
7). As of 1 June 2021, the vaccination coverage is about 24.3%6. The Accordingly, we use a homogeneous vaccine coverage of 70%
effectiveness of the vaccination programme and NPIs in preventing among all age groups in the main analysis. Here, we present the
new COVID-19 outbreaks and limiting COVID-19 burden will thus results of a set of sensitivity analyses assuming vaccination coverage
depend on the level of vaccine-induced immunity in the population of 50% (SA4) and 90% (SA5) among all age groups, and considering
should an outbreak of locally transmitted cases start to unfold. heterogeneous coverage by age: (1) 70% for adults ≥20 years and
To simulate this situation, we initialize the model by considering 50% for younger individuals (SA6), (2) 90% for adults ≥20 years
different fractions of vaccinated population (SA1: 10%; SA2: 20%; and 70% for younger individuals (SA7) and (3) 70% for adults ≥20
SA3: 30%) at the time the infection is seeded. Given a certain level years and no vaccination for younger individuals (SA8).
Nature Human Behaviour | www.nature.com/nathumbehav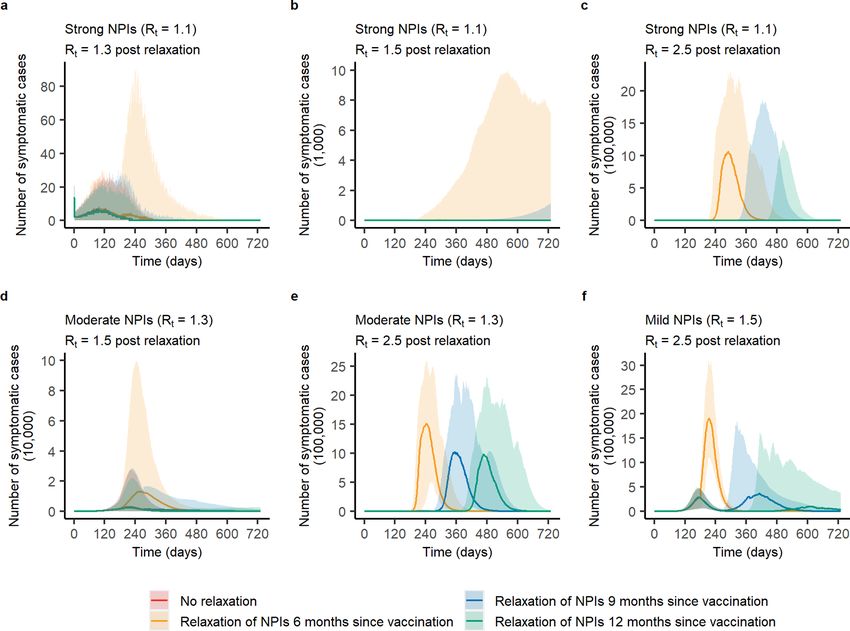
Articles NATuRE HuMAn BEhAVIOuR
Minimum No difference compared with minimum Higher than minimum
Uncertainty in contact pattern and relative susceptibility
Yes No
38 54 42 38 42 56 38 52 Strong NPIs (Rt = 1.1)
Initial seed 40
7.7 × 10⁴ 9.1 × 10⁴ 6.0 × 10⁴ 1.6 × 10⁴ 7.6 × 10⁴ 9.6 × 10⁴ 4.2 × 10⁴ 2.7 × 10⁴ Moderate NPIs (Rt = 1.3)
1.8 × 10⁶ 1.9 × 10⁶ 1.5 × 10⁶ 2.9 × 10⁶ 2.1 × 10⁶ 2.2 × 10⁶ 2.0 × 10⁶ 3.5 × 10⁶ Mild NPIs (Rt = 1.5)
9.4 × 10⁶ 9.5 × 10⁶ 9.8 × 10⁶ 10.0 × 10⁶ 9.7 × 10⁶ 9.8 × 10⁶ 1.0 × 10⁷ 1.0 × 10⁷ No NPIs (Rt = 2.5)
6.5 × 10³ 7.8 × 10³ 5.6 × 10³ 6.0 × 10³ 6.5 × 10³ 7.5 × 10³ 5.5 × 10³ 7.2 × 10³ Strong NPIs (Rt = 1.1)
Initial seed 5,000
7.0 × 10⁵ 7.3 × 10⁵ 5.2 × 10⁵ 1.0 × 10⁶ 8.1 × 10⁵ 8.6 × 10⁵ 6.6 × 10⁵ 1.3 × 10⁶ Moderate NPIs (Rt = 1.3)
3.4 × 10⁶ 3.5 × 10⁶ 3.7 × 10⁶ 4.9 × 10⁶ 3.8 × 10⁶ 3.9 × 10⁶ 4.1 × 10⁶ 5.4 × 10⁶ Mild NPIs (Rt = 1.5)
9.7 × 10⁶ 9.8 × 10⁶ 9.9 × 10⁶ 10.0 × 10⁶ 1.0 × 10⁷ 1.0 × 10⁷ 1.0 × 10⁷ 1.0 × 10⁷ No NPIs (Rt = 2.5)
Yes No
e
e
du to
ou to
ou to
du to
ou to
ou to
lin
lin
lts
ps
lts
ps
ps
ps
r a ion
gr ion
gr ion
r a ion
gr ion
gr ion
se
se
de at
ge at
ge at
de at
ge at
ge at
Ba
Ba
ol ritiz
-a itiz
-a tiz
ol ritiz
-a tiz
-a tiz
ol ori
i
ol ori
ng or
ng or
rio
rio
ki ri
ho ri
ki ri
ho ri
tp
or p
sc st p
tp
or p
sc rst p
w rst
w rst
rs
rs
r
Fi
Fi
Fi
Fi
Fi
Fi
Fig. 4 | Best prioritization strategy to achieve the minimal COVID-19 deaths. Initial cases denote breakthrough COVID-19 cases, which initiate the
epidemic. We consider the impact of uncertainty (‘Yes’, which means 200 stochastic model realizations are performed to account for the ranges) in
contact patterns and relative susceptibility on prioritization, and use their mean values as well (‘No’). Baseline denotes first prioritizing older adults and
individuals with underlying conditions. Number in the box denotes the death toll (median). Minimum denotes the lowest deaths in each scenario on the
basis of median value. We compare other strategies with the one with minimum deaths using a rank-sum test. For example, in the context of 5,000 initial
cases, Rt = 1.5 and using mean values of contact patterns and relative susceptibility, the baseline is the optimal strategy to minimize deaths.
By considering moderate NPIs (Rt = 1.3) and vaccination cover- start of vaccination of the young population, which is characterized
age of 50% in all age groups, the number of symptomatic individuals by higher contact rates13. Nonetheless, it is important to remark that
is estimated to decrease by 33% with an 8% decrease of the death this result depends on the timing of the introduction of the initial
toll with respect to the baseline vaccination scenario (70% coverage) seeds (see Population immunity at the onset of an outbreak section).
(Supplementary Figs. 6 and 7). In fact, the lower coverage in older age
groups would lead to an earlier vaccination in younger age groups Vaccine efficacy. Three types of COVID-19 vaccine are currently
who are characterized by the highest contact rates13. Conversely, in use in China, including inactivated, recombinant protein sub-
increasing the coverage to 90% would decrease the death toll but unit and adenovirus-vectored vaccines. VE for these vaccines
lead to an increase of symptomatic cases (Supplementary Figs. 6 and ranges from 65% to 90%, with the exception of the one tested in
7). It is important to remark that these results consider that moder- Brazil where P1 variant is prevalent (VE 50%)39–43. With respect to
ate NPIs remain in place over the entire duration of the epidemic, an 80% VE adopted in the baseline scenario, by considering VE of
and they do not provide indications of the coverage needed to sup- 60% (SA9), we estimate a 1.64-fold increase of the death toll and
press any further resurgences of cases. 1.02-fold increase of symptomatic cases, whereas a 37% and 29%
As compared with the baseline vaccination scenario (70% vac- decrease of deaths and symptomatic cases, respectively, is estimated
cination coverage in all age groups), if the vaccine is not distributed for VE of 90% (SA10). (Supplementary Figs. 6 and 7)
among individuals aged less than 20 years, we estimate an increase
of the death toll of 55% and of symptomatic infections of 69% SARS-CoV-2 variants. Multiple SARS-CoV-2 variants have been
(Supplementary Figs. 6 and 7). The scenario assuming 90% vacci- documented globally, three of which are of particular concern: lin-
nation coverage for adults ≥20 years and 70% for younger individu- eage B.1.1.7 identified in the United Kingdom, B.1.351 in South
als leads to a lower reduction of COVID-19 burden as compared Africa and P.1 in Brazil44. These variants are estimated to have higher
with the baseline vaccination scenario (Supplementary Figs. 6 and transmissibility45,46 and possibly increased mortality47,48. To assess
7). The higher coverage in the adult population results in a delayed the effect of vaccination in this context, we consider higher values of
Nature Human Behaviour | www.nature.com/nathumbehav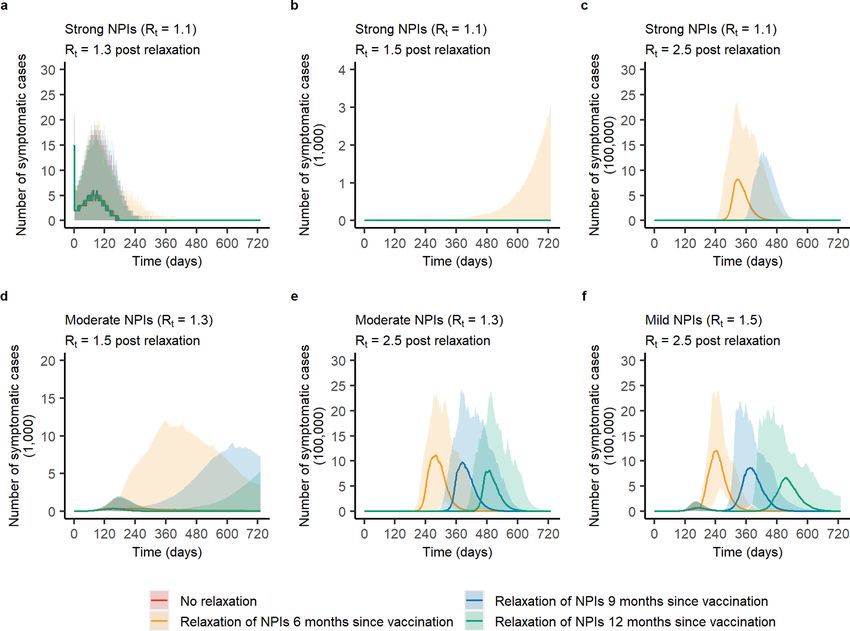
NATuRE HuMAn BEhAVIOuR                                                                                                                                           Articles
                      a
                                                    400

                      Number of symptomatic cases
                                                          306.7
                                                    300            275.9
                                                                           239.3

                              (1,000,000)
                                                                                    186.8
                                                    200

                                                                                                  77.8
                                                    100
                                                                                                           21.1    10.4        2.2   5.5    0.5      0      0
                                                      0

                                                                 No NPIs (Rt = 2.5)                     Mild NPIs (Rt = 1.5)          Moderate NPIs (Rt = 1.3)

                      b
                                                    150
                      Number of hospitalizations

                                                          99.3
                                                    100            88.0
                           (1,000,000)

                                                                            75.6
                                                                                      59.9

                                                     50
                                                                                                  24.1
                                                                                                            6.8     3.5        0.7   1.8    0.2      0      0
                                                      0

                                                                 No NPIs (Rt = 2.5)                     Mild NPIs (Rt = 1.5)          Moderate NPIs (Rt = 1.3)

                      c
                                                    100
                      Number of ICU admissions

                                                     80    7.2
                                                                    6.3
                                                                             5.5
                            (1,000,000)

                                                     60                               4.6

                                                     40
                                                                                                  1.5
                                                     20
                                                                                                            0.4     0.1        0     0.1     0       0      0
                                                      0

                                                                 No NPIs (Rt = 2.5)                     Mild NPIs (Rt = 1.5)          Moderate NPIs (Rt = 1.3)

                      d                                    9.4
                                                     10
                                                                    8.0
                                                                             7.1
                                                      8                               6.0
                      Number of deaths
                        (1,000,000)

                                                      6

                                                      4
                                                                                                  1.8
                                                      2
                                                                                                            0.4     0.2        0     0.1     0       0      0
                                                      0

                                                                 No NPIs (Rt = 2.5)                     Mild NPIs (Rt = 1.5)          Moderate NPIs (Rt = 1.3)

                                                                           Initial immunity (%)            0       10          20    30

Fig. 5 | Cumulative burden of COVID-19, provided a percentage of population is immune before epidemic starts. In this additional analysis, the epidemic
starts when 10%, 20% or 30% of population has been vaccinated. a–d, Cumulative number of symptomatic cases (a), hospitalizations (b), cases admitted
to ICU (c) and deaths (d) as estimated over the simulated 2-year period. Number denotes median, and error bars denote quantiles 0.025 and 0.975.

Rt (that is, 1.7, 1.9 and 2.1, about 30–60% increased transmissibility                                         increase from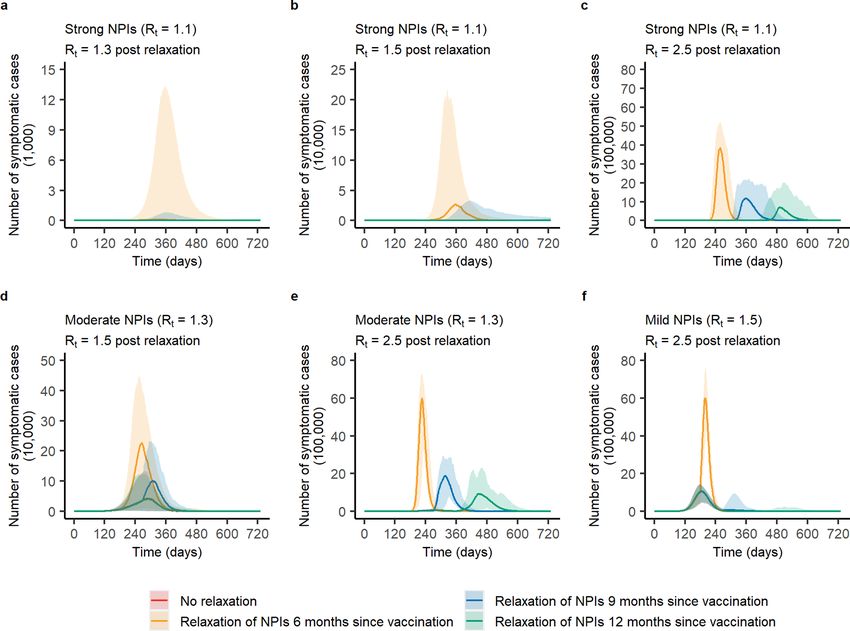
Articles                                                                                             NATuRE HuMAn BEhAVIOuR

but not SARS-CoV-2 infections, COVID-19-related deaths increase                 As highlighted in vaccination studies in Italy52, in the race
by 33-fold with respect to the baseline: from 76,700 to 2.66 million        between the vaccination campaign to build population herd
(Supplementary Fig. 6). In this case, maintaining stringent NPIs            immunity and the progress of the epidemic, the speed of vaccine
measures in place for a prolonged time horizon would be neces-              deployment is critical. Considering the average vaccine distribution
sary as such vaccine would not be effective to suppress transmis-           capacity of the current COVID-19 vaccination campaign in China6,
sion (as reported previously49). Assuming a shorter duration of             we use 6 million doses administered per day in the baseline analy-
vaccine-induced protection of 6 months (SA12) instead of lifelong           sis. Several manufacturers state that a total of 3.9 billion doses of
protection (that is, longer than the 2-year time horizon considered;        COVID-19 vaccine could be produced in 2021, equivalent to about
Supplementary Fig. 6) has a similarly large effect on projections.          10 million doses per day22–26. China committed to provide COVID-
    In our main analysis, we use the contact matrix estimated from          19 vaccines to >100 countries, which could reduce the number
a contact survey conducted in Shanghai before the COVID-19 pan-             of doses to be distributed locally. Even if these candidate vaccines
demic13. Should a new COVID-19 wave start to unfold in China, it is         could be licensed and manufactured smoothly, it would take about
unclear to what extent pre-pandemic contact patterns could be rep-          one year to vaccinate 70% of the population.
resentative of such a situation. Therefore, we add a sensitivity analy-         Six months after initiating vaccination programme, roughly
sis in which we assume the mixing patterns estimated in Shanghai            24.3% of Chinese population has been vaccinated6. Limited vac-
in March 202050, when schools were still closed as a response to the        cine production capacity, particularly at the initial stage, could slow
COVID-19 pandemic (SA13). For Rt = 1.3 and the baseline param-              the speed of vaccine rollout. Slower rates of vaccine production
eters for the vaccination, the estimated number of deaths would be          and administration may result in a longer period of SARS-CoV-2
16,000 as compared with 76,700 estimated using the pre-pandemic             transmission. It is thus crucial to keep monitoring local outbreaks
mixing patterns (79% decrease; Supplementary Fig. 6). In fact, the          and invest resources in outbreak management (as currently done
relative contribution of the adult population (which is the main tar-       in China) to keep Rt close to the epidemic threshold at least for the
get of the vaccination campaign) to the overall transmission as com-        next 1–2 years. In the very unique context of China, a value of Rt
pared with children is higher than when considering pre-pandemic            of 1.3 would result in about 76,700 cumulative deaths, comparable
mixing patterns (when schools were open and school-age individu-            to the annual influenza-related death toll in China35. The develop-
als had the highest number of contacts).                                    ment of detailed logistical plans and tools to support an increased
    Other factors such as excluding detected symptomatic cases              vaccination capacity as well as effective logistic (vaccine transport,
from vaccination (SA14 and SA15), the time interval between two             storage and continuous cold-chain monitoring) are key factors for a
doses (SA16 and SA17) and assuming an all-or-nothing vaccine                successful mass vaccination campaign.
(SA18) do not substantially affect estimates of deaths and symp-                In the early phase of COVID-19 spread in Wuhan in 2019,
tomatic infections (Supplementary Figs. 6 and 7). A similar trend is        before interventions were put in place, R0 was estimated to be in the
observed for hospitalized cases and ICU admissions.                         range 2.0–3.5 (refs. 27–32). Given the knowledge of mechanisms of
                                                                            SARS-CoV-2 transmission, and the devastating consequences of an
Discussion                                                                  uncontrolled COVID-19 epidemic, the Chinese population would
Using a stochastic dynamic model of SARS-CoV-2 transmission                 maintain cautious behaviour (such as cleaning hands often, cough-
and COVID-19 burden tailored to the epidemiological situation in            ing or sneezing in bent elbow, avoiding close contact with someone
China, we find that, in the absence of NPIs and independently of            who is sick, etc.) even without the need to impose NPIs. As such, in
the vaccine prioritization strategy and capacity of the vaccination         our analysis simulating an epidemic triggered by imported cases, we
campaign, timely rollout of an effective vaccine (VE 80%) would             decided to consider an initial reproduction number of 2.5, which is
not be enough to prevent a local outbreak from escalating to a major        at the lower end of the estimated spectrum.
widespread epidemic. Provided that NPIs are in place and capable                SARS-CoV-2 variants are circulating globally and quickly
of bringing Rt to 1.3, a daily vaccine rollout of 4 doses per 1,000 indi-   became dominant in countries such as the United Kingdom and
viduals could reduce COVID-19 burden by around 99%, and bring               Italy (lineage B.1.1.7) and South Africa (lineage B.1.351). Recently,
Rt below the epidemic threshold about 9 months after the start of the       variant B.1.617 identified in India has raised global concern.
vaccination campaign. A relaxation of NPIs that brings the value of         Mainland China border control screenings have already identified
Rt to 1.5 could not prevent sustained epidemic growth, which would          imported cases with SARS-CoV-2 lineage B.1.1.7 and B.1.617. Our
cause 1.8 million deaths. A net reproduction number of 1.5 could            study shows that the spread of new more transmissible and/or more
only be sustained when accompanied by an improvement of the                 lethal variants could substantially decrease the net benefit of vac-
vaccine administration capacity up to 10 doses per 1,000 individuals        cination. Strict border quarantine and isolation as well as genomic
per day. Relaxation of NPIs in the first 6–9 months of vaccine roll-        surveillance will be key while vaccines roll out in China.
out could lead to substantial increases of COVID-19 burden if daily             Our analysis on the VE shows that, if we consider VE of 60%,
vaccination capacity could not be enhanced to 10–15 million doses.          both the number of symptomatic cases and deaths are estimated to
    Bubar et al. evaluated COVID-19 vaccine prioritization strate-          double as compared with the baseline vaccination coverage of 80%.
gies and found that prioritizing older adults is a robust strategy to       Given that the final composition of a nationwide rollout will likely
minimize deaths across countries when Rt = 1.5, while prioritiza-           include a combination of vaccines with varying efficacy, monitoring
tion shifted to the 20–49-year-old group when Rt = 1.15 (ref. 51). The      VE on the ground will remain a priority.
broad scope of that multi-country analysis does not account for fea-            Here, we propose a general framework to evaluate the impact
tures of COVID-19 epidemiology and vaccination programme that               of COVID-19 vaccination programmes in the absence/presence
are unique to China. In particular, differently from most countries         of NPIs and to explore priority target populations to minimize
where natural immunity is building up after widespread epidemics,           multiple disease outcomes. The proposed modelling framework is
China has been able to suppress SARS-CoV-2 transmission for most            adaptable to other country-specific contexts. However, this requires
of 2020. As a result, prior immunity is very low, thus calling for spe-     the collection of country-specific data about the epidemiological
cifically tailored analysis. Nonetheless, our findings confirm that, if     situation (for example, landscape immunity of the local population,
NPIs can maintain transmission rates at low levels during the vac-          prevalence of infections), vaccination parameters (for example,
cination campaign, strategies that target indirect benefits perform         vaccine supply and capacity of immunization services, efficacy of
better, while if transmission rates remain high, strategies maximiz-        different vaccines, target age groups), socio-demographic char-
ing direct benefits may save more lives51.                                  acteristics of the population (for example, size of the priority

                                                                                              Nature Human Behaviour | www.nature.com/nathumbehav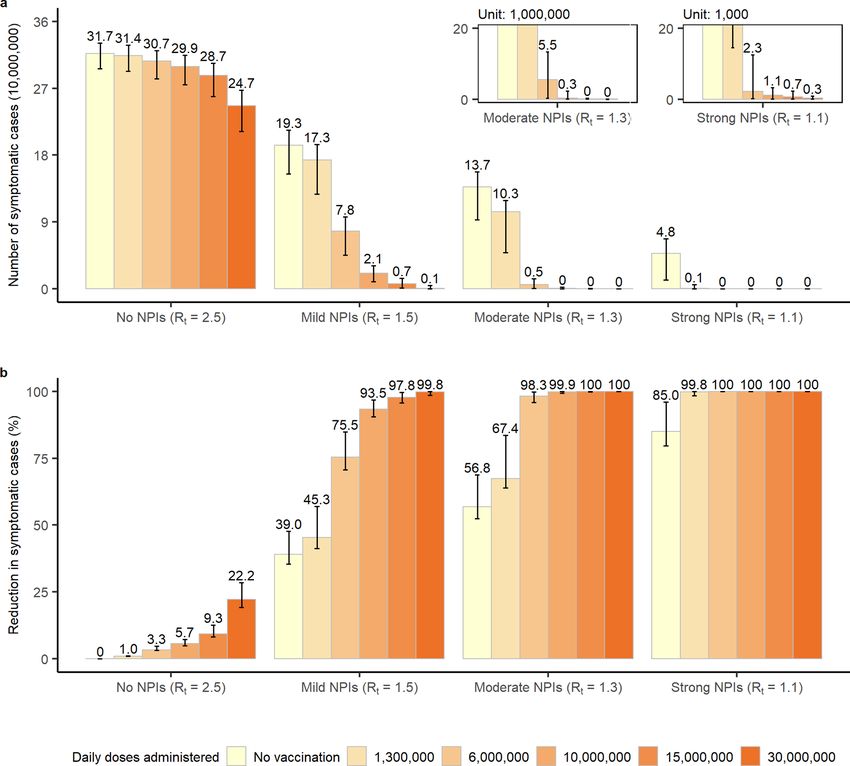
NATuRE HuMAn BEhAVIOuR                                                                                                                  Articles
population by age group, age-mixing patterns) and the priorities of         (particularly at the initial stage of the vaccination), as well as the
the pandemic responses (for example, limiting the death toll or pre-        capacity of vaccination system. This is especially relevant in contexts
venting infections).                                                        where most of the population is still susceptible to SARS-CoV-2
    Our study has a number of limitations. First, we integrate the          infection, as is the case in most of China. Maintaining NPIs (such as
impact of NPIs through a simple reduction in the value of Rt at             social distancing, testing, case isolation and contact tracing, wearing
the beginning of the outbreak, homogeneously across age groups.             masks and limitation on large gatherings) throughout 2021 is nec-
However, our analysis does not suggest which combination of NPIs            essary to prevent resurgence of COVID-19 epidemics until a suf-
should be adopted to lower Rt to a certain level or how this would          ficiently high level of immunity is reached, which depends on the
affect transmission rates in different age groups. Li et al. estimated      transmissibility of the variants circulating at that time.
that individual NPIs, including school closure, workplace closure
and public events bans, were associated with reductions in Rt of            Methods
13–24% on day 28 after their introduction53. Further studies are            SARS-CoV-2 transmission and vaccination models. We developed a model of
needed to pinpoint the specific NPIs to be adopted in parallel with         SARS-CoV-2 transmission and vaccination, based on an age-structured stochastic
the vaccination campaign and their impact on the quality of life of         SIR scheme, accounting for heterogeneous mixing patterns by age as estimated
                                                                            in Shanghai13. The Chinese population was distributed into 18 age groups (17 age
the population.                                                             groups of 5 years from 0 to 84 years and one age group for individuals aged 85
    Second, in China, vaccines have not been licensed for children,         years or older)57. Each age group was further split into two subgroups: individuals
so we assume a 50% lower or equivalent VE for them compared with            with or without underlying conditions, where the former was considered to be
other adults. Although we show that variations in these rates do not        associated with an increased risk of severe outcome of COVID-19 (ref. 14).
substantially affect the overall effect of the vaccination campaign,             In the main analysis, susceptibility to SARS-CoV-2 infection was assumed to
                                                                            be heterogeneous across ages. Children under 15 years of age were considered less
further data on age-specific VE could help refine priority groups.          susceptible to infection compared with adults aged 15–64 years, while the older
Our sensitivity analyses on vaccine coverage reveal the importance          adults more susceptible33,34. Homogeneous susceptibility across age groups was
of extending the vaccination to the young population once the use           explored in sensitivity analysis SA19. Asymptomatic and symptomatic individuals
of vaccines is authorized for that age segment of the population.           were assumed to be equally infectious33,34, and infectiousness was also assumed to
    Third, we assumed that immunity after natural infections lasts          be the same across age groups33,34.
                                                                                 Vaccine is administered with a two-dose schedule. In the baseline model, we
longer than the time horizon considered (2 years). If this is not the       assumed that: (i) vaccination reduces susceptibility to SARS-CoV-2 infection;
case, waning of immunity would inflate the rate of susceptible indi-        (ii) only susceptible individuals are eligible for vaccination, that is, we excluded
viduals and thus require booster vaccinations. This could become            all individuals that have experienced SARS-CoV-2 infection; (iii) duration of
an issue with the emergence of immune-escape variants, as reported          vaccine-induced protection lasts longer than the time horizon considered (2 years).
in South Africa54. Given limited information at this stage, we did not           The baseline model is shown schematically in Supplementary Fig. 1 and is
                                                                            described by differential systems presented in Supplementary Files 1 and 2.
consider this scenario in our analyses, but this is an important area
of future research.                                                         Model initialization. In China, the first pandemic wave of COVID-19 was
    Fourth, age-mixing patterns are key to assess the impact of vac-        controlled by intense NPIs58,59. Almost the entire population of Mainland China is
cination as individuals of different ages are exposed to different          still susceptible to COVID-19 (ref. 3). As such, the model is initialized with a fully
transmission risks. In the main analysis, we assumed the mixing             susceptible population.
                                                                                 China has been facing mounting pressure from imported COVID-19 cases.
patterns to correspond to those estimated before the COVID-19               Containment of COVID-19 has been possible only through a combination of
pandemic, indicating the goal of a return to pre-pandemic interac-          measures such as complete or partial lockdown, citywide mass screening using
tions. We have also performed a sensitivity analysis based on the           reverse-transcriptase polymerase chain reaction (RT-PCR) testing, tracing of
mixing patterns estimated in China in March 202050, after the lock-         contacts and contacts of contacts of COVID-19 cases, which were promptly applied
                                                                            wherever COVID-19 transmission emerged in Mainland China60. Despite all
down was lifted but schools were still closed. How the population
                                                                            the efforts, containment of COVID-19 appears to be hit and miss, and sporadic
would mix in case of a new wave of COVID-19 starts to unfold in             outbreaks inevitably occur. Simulations are thus initialized with 40 cases, roughly
China remains to be seen.                                                   corresponding to the number of cases with symptoms onset in Beijing before the
    Moreover, our study is performed at a national scale and thus our       detection of a local outbreak on 11 June 2020 (ref. 61).
estimates of the impact of vaccination should be interpreted cau-
                                                                            Vaccination scenarios. To explore the impact of vaccination, we ran a set of
tiously at the local scale. In fact, spatial heterogeneities within China   simulations in which neither NPIs nor vaccination are implemented as a reference
in terms of risk of case importation, socio-demographic character-          scenario (no vax + no NPIs, that is, effective reproductive number Rt = 2.5 at
istics of the population, mixing and mobility patterns, vaccination         the beginning of simulations17,28,58), and compared it with a scenario in which
coverage and capacity may affect our results55.                             vaccination only is implemented (vax + no NPIs). Further, we considered different
    Enhanced vaccination efforts in conjunction with NPIs have              sets of simulations in which NPIs are used to bring Rt respectively down to
                                                                            1.5 (mild NPIs), 1.3 (moderate NPIs) and 1.1 (strong NPIs), with (vax + mild/
been successfully used during the COVID-19 outbreak in Ruili City           moderate/strong NPIs) or without vaccination programme (no vax + mild/
(Yunnan Province, China) in March–April 2021. Our analysis, how-            moderate/strong NPIs). In the main analysis, vaccination is assumed to begin
ever, focuses on the assessment of whether and to what extent we            15 days after the epidemic start. Alternative scenarios about the seeding of the
need to rely on NPIs to prevent a COVID-19 epidemic while vaccines          epidemic were explored as sensitivity analyses. In particular, we considered the
are rolled out. As such, our results cannot be used to guide a reactive     epidemic to start when 10% (SA1), 20% (SA2) and 30% (SA3) of the Chinese
                                                                            population has already been vaccinated.
spatially targeted strategy. To properly capture the peculiarity of that        The model is run considering daily time steps. Gradual delivery of vaccine
context, specific modelling tools mirroring the interventions adopted       doses is implemented by vaccinating a fixed number of individuals each day.
in China as a response to emerging outbreaks are needed.                    Although manufacturers state that a total of 3.9 billion doses of vaccines could be
    Finally, it would be interesting to analyse adaptive vaccination        available by the end of 2021 (refs. 22–26), scale-up and delivery will take months.
prioritizations that change as the epidemiological situation evolves        On the basis of the 2009 H1N1 influenza pandemic vaccination programme
                                                                            implemented in Mainland China62, in the main analysis we assumed that 6 million
over time, but that would require the development of dynamic                doses of COVID-19 vaccines could be administered each day (4 doses per 1,000
optimization algorithms that lie beyond the scope of this work56.           individuals) until uptake reaches 70% for all groups14. Different values of the daily
Nonetheless, our study provides estimates of the effect of relaxing         vaccine administration capacity, that is, 1.3 (SA20), 10 (SA21), 15 (SA22) and 30
NPIs over the course of the epidemic.                                       (SA23) million dose per day, are explored in separate sensitivity analyses. Sensitivity
    In conclusion, vaccination alone could substantially reduce             analyses were also performed on the vaccination coverage, which is assumed to be
                                                                            either homogeneous (SA4 and SA5)14 or heterogeneous by age (SA6, SA7 and SA8).
COVID-19 burden, but in the foreseeable future may not be enough                In the main analysis, vaccination is administered to susceptible individuals
to prevent local outbreaks from escalating to major widespread              only. This represents an ideal scenario where we assume that all infected
epidemics due to limitation in the vaccine production and supply            individuals can be identified (for example, either via RT-PCR while infected or via

Nature Human Behaviour | www.nature.com/nathumbehav
Articles NATuRE HuMAn BEhAVIOuR
serological assays later on) and that SARS-CoV-2 infection confers long-lasting without underlying conditions. On top of that, we developed a model of COVID-
immunity. Since infection ascertainment could be challenging and pose additional 19 disease burden to estimate the number of symptomatic cases, hospitalization,
strain on the health system, we also consider two sensitivity analyses in which only ICU admissions and deaths in different scenarios in the presence/absence of
detected symptomatic cases are excluded from vaccination (SA14 and SA15). vaccination.
In the context of fast RT-PCR-based mass screening if there is an outbreak, We computed the age-specific number of symptomatic infections in individuals
under-ascertainment of symptomatic cases could be only related with the with and without underlying conditions on a daily basis by applying an age-specific
sensitivity of RT-PCR tests. The sensitivity is quite high (98%) if the interval probability of respiratory symptoms of 18.1%, 22.4%, 30.5%, 35.5% and 64.6%
between symptom onset and RT-PCR test is within 7 days, but decreases to 68% respectively for 0–19, 20–39, 40–59, 60–79 and 80+ years of age, as estimated
if the time interval is 8–14 days (ref. 63). The mean time interval from symptom from contact tracing data in Lombardy20. We assume that individuals with and
onset to the date of collection of the sample for PCR testing was estimated to be without underlying conditions have the same age-specific probability of developing
4.7 days in Hunan33. Accordingly, we considered as ascertainment probabilities of symptoms.
symptomatic cases 70% (SA14) and 90% (SA15). The daily age-specific number of hospital admissions in the two subpopulations
was computed by applying the age-specific proportion of laboratory-confirmed
Vaccination schedule and efficacy. Since December 2020, China has given conditional symptomatic cases requiring hospitalization (Supplementary File 4), delayed by an
approval or emergency use approval for seven COVID-19 vaccines. The National average time of 3.8 days between symptom onset and hospitalization17.
Health Commission recommends that inactivated vaccines are administered The daily age-specific number of patients admitted to ICU in the two
on a two-dose schedule with an interval of ≥21 days, recombinant subunit subpopulations was computed by applying to hospitalized cases an age-specific
vaccines administered on a three-dose schedule with an interval of ≥28 days, and probability of being admitted to ICU19, and distinguishing patients requiring
recombinant adenovirus type-5-vectored vaccines administered one dose. For intensive care in survivors and non-survivors. Survivors are admitted to ICU after
simplicity, in the main analysis, we modelled the administration of an inactivated an average time of 7 days from hospitalization. Non-survivors are admitted to ICU
vaccine developed by the Beijing Institute of Biological Products64, which entails after an average time of 8 days after hospitalization16.
a two-dose schedule across all age groups with an interval of 21 days. In separate The daily age-specific number of deaths in the two subpopulations was
sensitivity analyses, we explored an interval of 14 and 28 days (SA16 and SA17). computed by applying the age-specific fatality ratio among symptomatic cases
China approved its first local COVID-19 vaccine (developed by Sinopharm) (Supplementary File 4), delayed by an average time of 13.9 days between symptom
for general public use on 31 December 2020, with an estimated VE of 79.3%21. onset and death18.
In the main analysis, we used a VE of 80% against infection in individuals aged
20–59 years. In the developed model, vaccination confers partial protection, Data analysis. For each scenario, 200 stochastic model realizations were
that is, vaccinated individuals are 80% less likely to develop infection upon an performed. The outcome of these simulations determined the distributions of the
infectious contact. Sensitivity analyses using a VE of 60% (SA9) and 90% (SA10) number of symptomatic infections, hospitalizations, ICU admissions and deaths.
were performed separately. The alternative values of VE were selected on the basis We defined 95% credible intervals as quantiles 0.025 and 0.975 of the estimated
of published upper efficacy of vaccines of 94–95% and in such a way to cover a distributions. We used a Bayesian approach to estimate Rt from the time series
plausible efficacy range of forthcoming vaccines65–67. of symptomatic cases by date of symptom onset and the distribution of the serial
Phase 2 clinical trials demonstrated that vaccine immunogenicity was lower interval17. The methods are described in detail in Supplementary File 5.
among older individuals than in younger adults64. And for other inactivated
vaccines such as influenza vaccine, a lower VE is observed in children compared Reporting summary. Further information on research design is available in the
with young adults68. Accordingly, we assumed an age-dependent VE. In particular, Nature Research Reporting Summary linked to this paper.
given a baseline efficacy VE among individuals aged 20–59 years (80% in the main
analysis), we assumed a 50% lower VE in individualsNATuRE HuMAn BEhAVIOuR Articles
12. Wu, J. T., Peak, C. M., Leung, G. M. & Lipsitch, M. Fractional dosing of 42. Palacios, R. et al. Double-blind, randomized, placebo-controlled phase III
yellow fever vaccine to extend supply: a modelling study. Lancet 388, clinical trial to evaluate the efficacy and safety of treating healthcare
2904–2911 (2016). professionals with the adsorbed COVID-19 (inactivated) vaccine
13. Zhang, J. et al. Patterns of human social contact and contact with animals in manufactured by Sinovac - PROFISCOV: a structured summary of a study
Shanghai, China. Sci. Rep. 9, 15141 (2019). protocol for a randomised controlled trial. Trials 21, 853 (2020).
14. Yang, J. et al. Who should be prioritized for COVID-19 vaccination in China? 43. The interim analysis data of the COVID-19 inactivated vaccine phase III
A descriptive study. BMC Med. 19, 45 (2021). clinical trial of Sinopharm Wuhan Institute of Biological Products released.
15. Yang, J. et al. Disease burden and clinical severity of the first pandemic wave Wuhan Institute of Biological Products http://www.wibp.com.cn/Chs/Detail.
of COVID-19 in Wuhan, China. Nat. Commun. 11, 5411 (2020). aspx?Id=14669 (2021).
16. Xie, J. et al. Clinical characteristics and outcomes of critically ill patients with 44. About variants of the virus that causes COVID-19. Centers for Disease
novel coronavirus infectious disease (COVID-19) in China: a retrospective Control and Prevention https://www.cdc.gov/coronavirus/2019-ncov/
multicenter study. Intensive Care Med. 46, 1863–1872 (2020). transmission/variant.html (2021).
17. Zhang, J. et al. Evolving epidemiology and transmission dynamics of 45. Davies, N. G. et al. Estimated transmissibility and impact of SARS-CoV-2
coronavirus disease 2019 outside Hubei Province, China: a descriptive and lineage B.1.1.7 in England. Science, eabg3055 (2021).
modelling study. Lancet Infect. Dis. 20, 793–802 (2020). 46. Stefanelli, P. et al. Co-circulation of SARS-CoV-2 variants B.1.1.7 and P.1.
18. Deng, X. et al. Case fatality risk of the first pandemic wave of novel Preprint at medRxiv https://doi.org/10.1101/2021.04.06.21254923 (2021).
coronavirus disease 2019 (COVID-19) in China. Clin. Infect. Dis. 47. Challen, R. et al. Risk of mortality in patients infected with SARS-CoV-2
ciaa578 (2020). variant of concern 202012/1: matched cohort study. Br. Med. J. 372,
19. Guan, W. et al. Clinical characteristics of coronavirus disease 2019 in china. n579 (2021).
N. Engl. J. Med. 382, 1708–1720 (2020). 48. Davies, N. G. et al. Increased mortality in community-tested cases of
20. Poletti, P. et al. Association of age with likelihood of developing symptoms SARS-CoV-2 lineage B.1.1.7. Nature 593, 270–274 (2021).
and critical disease among close contacts exposed to patients with confirmed 49. Meehan, M. T. et al. Age-targeted dose allocation can halve COVID-19
SARS-CoV-2 infection in italy. JAMA Netw. Open 4, e211085 (2021). vaccine requirements. Preprint at medRxiv https://doi.org/10.1101/2020.10.08.
21. Sinopharm COVID-19 vaccine licensed in China. Sinopharm http://www. 20208108 (2020).
sinopharm.com/s/1223-3763-38840.html (2021). 50. Zhang, J. et al. The impact of relaxing interventions on human
22. Curret development and production capacity of domestic COVID-19 vaccine. contact patterns and SARS-CoV-2 transmission in China. Sci. Adv. 7,
CNWest http://news.cnwest.com/szyw/a/2020/12/04/19343015.html (2021). eabe2584 (2020).
23. Chairman of Cansino Bio. After the increase in production capacity, the 51. Bubar, K. M. et al. Model-informed COVID-19 vaccine prioritization
company’s COVID-19 vaccine will be released in large quantities. Huanqiu strategies by age and serostatus. Science 371, 916–921 (2021).
Net https://baijiahao.baidu.com/s?id=1692936657439211781&wfr=spider&for 52. Giordano, G. et al. Modeling vaccination rollouts, SARS-CoV-2 variants and
=pc (2021). the requirement for non-pharmaceutical interventions in Italy. Nat. Med. 27,
24. The first batch of BBIBP-CorV (Sinopharm) has shipped. Sinopharm 993–998 (2021).
http://www.sinopharm.com/s/1223-3769-39020.html (2021). 53. Li, Y. et al. The temporal association of introducing and lifting
25. Sinovac claims that the annual production capacity of COVID-19 vaccine will non-pharmaceutical interventions with the time-varying reproduction
reach 2 billion doses by June. Reuters https://cn.reuters.com/article/ number (R) of SARS-CoV-2: a modelling study across 131 countries. Lancet
sinovac-biotech-covid-vaccine-0303-idCNKCS2AV0DL (2021). Infect. Dis. 21, 193–202 (2021).
26. Chinese and foreign media enter the 1 billion-level COVID-19 vaccine 54. Wibmer, C. K. et al. SARS-CoV-2 501Y.V2 escapes neutralization by South
production base. Sinopharm http://www.sinopharm.com/s/1223-4126-39018. African COVID-19 donor plasma. Nat. Med. 27, 622–625 (2021).
html (2021). 55. Huang, B. et al. Integrated vaccination and physical distancing interventions
27. Wu, J. T., Leung, K. & Leung, G. M. Nowcasting and forecasting the potential to prevent future COVID-19 waves in Chinese cities. Nat. Hum. Behav. 5,
domestic and international spread of the 2019-nCoV outbreak originating in 695–705 (2021).
Wuhan, China: a modelling study. Lancet 395, 689–697 (2020). 56. Han, S. et al. Dynamic optimization of COVID-19 vaccine prioritization in
28. Li, Q. et al. Early transmission dynamics in Wuhan, China, of novel the context of limited supply. Preprint at In Review https://doi.org/10.21203/
coronavirus–infected pneumonia. N. Engl. J. Med. 382, 1199–1207 (2020). rs.3.rs-257573/v1 (2021).
29. Abbott, S., Hellewell, J., Munday, J., group, C.n.w. & Funk, S. The 57. World population prospects 2019. Population Division, Department of
transmissibility of novel coronavirus in the early stages of the 2019-20 Economic and Social Affairs, United Nations https://population.un.org/wpp/
outbreak in Wuhan: exploring initial point-source exposure sizes and (2019).
durations using scenario analysis. Wellcome Open Res. 5, 17 (2020). 58. Pan, A. et al. Association of public health interventions with the
30. Chinazzi, M. et al. The effect of travel restrictions on the spread of the 2019 epidemiology of the COVID-19 outbreak in Wuhan, China. JAMA 323,
novel coronavirus (COVID-19) outbreak. Science 368, 395–400 (2020). 1915–1923 (2020).
31. Natsuko, I. et al. Report 3: transmissibility of 2019-nCoV. Imperial College 59. Li, Z. et al. Active case finding with case management: the key to tackling the
London https://doi.org/10.25561/77148 (2020). COVID-19 pandemic. Lancet 396, 63–70 (2020).
32. Report of the WHO–China joint mission on coronavirus disease 2019 60. Xing, Y., Wong, G. W. K., Ni, W., Hu, X. & Xing, Q. Rapid response to an
(COVID-19). World Health Organization https://www.who.int/publications/i/ outbreak in Qingdao, China. N. Engl. J. Med. 383, e129 (2020).
item/report-of-the-who-china-joint-mission-on-coronavirus-disease-2019- 61. The COVID-19 outbreak in Beijing. Xinhua net http://www.xinhuanet.com/
(covid-19) (2021). politics/2020-06/19/c_1126135352.htm (2020).
33. Hu, S. et al. Infectivity, susceptibility, and risk factors associated with 62. Report of H1N1 pandemic influenza vaccination from Ministry of Health.
SARS-CoV-2 transmission under intensive contact tracing in Hunan, China. The Central People’s Government of the People’s Republic of China http://www.
Nat. Commun. 12, 1533 (2021). gov.cn/gzdt (2020).
34. Sun, K. et al. Transmission heterogeneities, kinetics, and controllability of 63. Xiao, A. et al. Dynamic profile of RT-PCR findings from 301 COVID-19
SARS-CoV-2. Science 371, eabe2424 (2021). patients in Wuhan, China: a descriptive study. J. Clin. Virol. 127,
35. Li, L. et al. Influenza-associated excess respiratory mortality in China, 104346 (2020).
2010-15: a population-based study. Lancet Public Health 4, e473–e481 (2019). 64. Xia, S. et al. Safety and immunogenicity of an inactivated SARS-CoV-2
36. Wang, J. et al. Acceptance of COVID-19 vaccination during the COVID-19 vaccine, BBIBP-CorV: a randomised, double-blind, placebo-controlled, phase
pandemic in China. Vaccines 8, 482 (2020). 1/2 trial. Lancet Infect. Dis. 21, 39–51 (2021).
37. Wang, J. et al. The changing acceptance of COVID-19 vaccination in different 65. Callaway, E. COVID vaccine excitement builds as Moderna reports third
epidemic phases in China: a longitudinal study. Vaccines (Basel) 9, 191 (2021). positive result. Nature 587, 337–338 (2020).
38. Shao, G., Ding, W., Yu, Y., Ma, H. & Zhijie, A. Willingness of parents to 66. Voysey, M. et al. Safety and efficacy of the ChAdOx1 nCoV-19 vaccine
vaccinate family members with coronavirus disease 2019, influenza, and (AZD1222) against SARS-CoV-2: an interim analysis of four randomised
pneumococcal vaccines, Anyang City, May to June 2020. Chinese J. Vaccine controlled trials in Brazil, South Africa, and the UK. Lancet 397,
Immun. 26, 629–633 (2020). 99–111 (2021).
39. Supply vaccines to eliminate human diseases. Sinovac http://www.sinovac. 67. Polack, F. P. et al. Safety and efficacy of the BNT162b2 mRNA Covid-19
com.cn/?optionid=468&auto_id=1877 (2021). vaccine. N. Engl. J. Med. 383, 2603–2615 (2020).
40. The application for conditional marketing of CansinoBio Coronavirus 68. Yang, P. et al. Influenza vaccine effectiveness against medically-attended
Vaccine ConvideciaTM was accepted by the National Medical Products influenza illness during the 2012–2013 season in Beijing, China. Vaccine 32,
Administration. CanSinoBIO http://www.cansinotech.com.cn/html/1///179/ 5285–5289 (2014).
180/806.html (2021). 69. Liu, Q. H. et al. Measurability of the epidemic reproduction number
41. Products instruction. Beijing Institute of Biological Products https://www.bjbpi. in data-driven contact networks. Proc. Natl Acad. Sci. USA 115,
com/?p=75 (2021). 12680–12685 (2018).
Nature Human Behaviour | www.nature.com/nathumbehavYou can also read