Daily Grain / Hogs Marketing Outlook 2/3/2020 - AC Trading
←
→
Page content transcription
If your browser does not render page correctly, please read the page content below

Daily Grain / Hogs Marketing Outlook
                        Written by: Jim Gerlach
                               2/3/2020

Early Call 8:45am EST: Corn down 2, beans up 1, wheat down 3. Global equities are
mixed overnight with Asian markets very weak after China was closed for a week while
Europe and the U.S. are mostly higher. Analysts knew the selling in China would be
severe as they caught up to the rest of the world related to the coronavirus. Overnight,
China's CSI 300 Index fell as much 9.1% while the Shanghai Composite settled down
7.72% for the worst single-day losses since August of 2015. The blows kept coming to
China over the weekend with the U.S. and Australia saying they would deny entry to all
foreign visitors who had recently been in China while Russia, Japan, Pakistan and Italy
have all announced restrictions. Hong Kong has closed 10 of its 13 border crossings
with China as well. The impact on economic growth in China will be noticeable,
although at the moment uncertain. Grains are mixed overnight as downside momentum
remains in control at present. Production estimates out of South American remain on the
rise at a time in which demand concerns in the world's largest feed market are front
burner. The February insurance pricing period begins this week with producers
beginning to make decisions about spring rotations.

Grains: Wheat fell 1.2% to $5.53 ¾ on the CBOT Friday on worries that the virus
outbreak in China will eat into demand. Corn for March delivery rose 0.5% to $3.81 ¼,
while soybeans fell 0.4% to $8.72 ½ on Friday, ending the month down 7.5%. The
coronavirus outbreak will likely reduce China's ability and willingness to buy huge
amounts of U.S. agricultural produce, as agreed in the trade deal that Beijing recently
signed with President Trump, an official at the Food and Agriculture Organization of
the United Nations said Friday. "It was already a bit difficult mathematically to figure
out whether China would in fact meet that commitment," Abdolreza Abbassian, a senior
economist at the FAO and secretary of the Agricultural Market Information System, told
Dow Jones Newswires. "And now, the situation has deteriorated more on the demand
side. This is not China's fault." This despite the fact that Chinese imports of food
increased after the SARS outbreak in 2003. Agricultural prices have probably fallen too
far in response to fears about the spread of coronavirus in China, says Jean-Yves Chow,
director of agri-food for Mizuho Bank in Asia. Still, he says the illness does pose a
                                                                                       1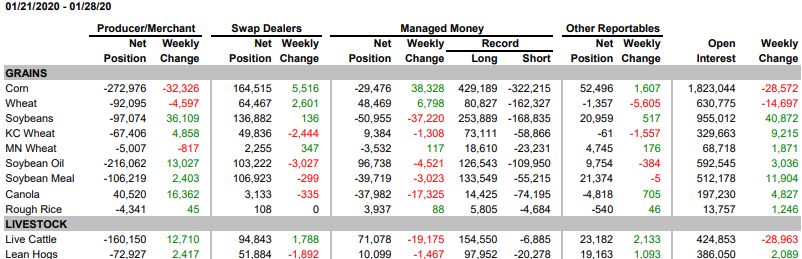
serious risk to demand. "I think this week will be a very slow month [for the food trade]
but at the same time people have to feed themselves," Chow said. "So I think there has
been some overreaction, but we will have to wait to see how the markets change over
the next two months," he says. Crop prices have dropped since the signing of trade deals
meant to buoy the farm economy, clouding the outlook for farmers working to secure
financing for this spring's planting season. Soybean futures have fallen since a trade
agreement meant in part to boost Chinese demand for the U.S. crop was reached two
weeks ago. Corn futures have fallen by over 2% in that time, a span that also included
the signing on Wednesday of a trade agreement among the U.S., Canada and Mexico.
Traders blame some of the recent pressure on the spread of coronavirus, which is
exacerbating concerns recent trade pacts won't be enough to lift farmers out of a six-
year slump. Corn fell 1.7% and wheat gave up 0.9% for the month. Soybean prices
could remain under pressure in 2020 even if China starts to buy U.S. oilseeds in large
quantities in the second half of the year because if China buys more soybeans from the
U.S., it will stop buying as many beans from Brazil. Brazil would struggle to sell those
soybeans to other importers, leading to a massive buildup in stockpiles inside the Latin
American country. One private analysts calculates that volume of soybeans stored in
Brazil at the end of the season could leap to 14mmt in 2020 from 1mmt in 2019.

Rains remained focused across the central 1/3rd of the Brazilian soybean belt over the
weekend, improving moisture for soybeans. Central Brazil rains taper early this week
and fieldwork advances favorably in center/west Brazil as rains remain limited until the
weekend. Northern Brazil rains ease again next week, aiding fieldwork and rains aid
central Brazil in the 11-15 day period while dryness builds in RGDS in the south. In
Argentina, highs climbed into the low/mid 90s yesterday and last 2 more days before
turning much milder the rest of the 10 day period. Timely rains favor the southwest ¾ of
Argentina Tue-Wed, improving dwindling moisture and keeping yields stable. Eastern
Buenos Aires (10% of the belt) is still at risk of dryness. 11-15 day rains remain limited
but with wetter risks. In the U.S., Delta/southeast Midwest rains remain active the next
2 weeks, with localized wheat damage risk in the northeast Delta (15% of the SRW
belt). Rain/snow benefit southern Plains wheat this week. A colder pattern next week in
the Midwest/Plains occurs, but winterkill threats are very low.

The Buenos Aires Grain Exchange pegged 2019/20 soybean production at 53.1mmt vs.
51mmt in October and 55.1mmt last year. Ukraine pegged the 2019/20 wheat crop at
28.3mmt, below the USDA’s 29.0mmt with the final corn crop figure at 35.8mmt vs. the
USDA at 35.5mmt. The corn crop was unchanged from last year, while the wheat crop
was up from 25.1mmt a year ago. The EU Commission raised their estimate of the EU’s
2019/20 corn imports to 20mmt from 19mmt previously, still slightly below the
USDA’s 21mmt and down solidly from last year’s 25.2mmt. Russian wheat production

                                                                                         2
this year could reach 79.5mmt, one of the largest volumes on record, as farmers sowed a
record winter wheat area consultancy IKAR said. IKAR expects the winter wheat area at
16.3 million hectares this season (15.9 million last season). The USDA Ag Attaché to
Australia pegged the country's wheat crop at 15.0mmt vs. USDA at 15.6mmt and would
be the lowest in over a decade.

Soybean futures have now fallen for 9 straight sessions, with improving South
American weather and the realization that China may not buy U.S. soybeans
immediately starting the decline and coronavirus fears extending it. The selling has
caused many relationships to get out of balance, including soymeal and corn, which has
the former at the cheapest level relative to the latter since August. Prior to the August
lows, soymeal is trading at the cheapest levels relative to corn since early 2016. China
bought 16.94mmt of U.S. soybeans in 2019, up from 16.6mmt in 2018. Pre-trade war,
soybean purchases by China made up more than half of U.S. ag purchases in 2017 and
32.85mmt of U.S. soybeans. Many traders believe China will need to buy at least that
amount of soybeans to reach the $40 billion ag purchase target. If China reverts to 2017
imports, U.S. soybean exports to China would increase 584mb. Of course, other
customers are likely to switch to non-U.S. origin, so it wouldn’t likely be a net gain that
large. If China buys more soybeans from the U.S., it will stop buying as many beans
from Brazil. Brazil would struggle to sell those soybeans to other importers, leading to a
massive buildup in stockpiles inside the Latin American country. One analyst calculates
that the volume of soybeans stored in Brazil at the end of the season could leap from
1mmt in 2019 to 14mmt in 2020, weighing on global prices, with U.S. basis levels
likely to firm vs. South American origin. Also, China would likely buy heavily during
their seasonal purchase time from Sep-Feb and not much outside that window. It’s
unclear if the U.S. would give China a calendar year upon the Feb 15th, 2020
implementation date of phase one for $40 billion, or if they expect it by the end of 2020.
The point here is timing is everything and other than some “goodwill” purchases prior
to September, I don’t expect the Chinese to buy U.S. soybeans in bulk until fall.

Traders are starting to wonder how the USDA will handle upcoming balance sheets for
the Feb 11th WASDE report. Most of the comments so far have repeated their stance
throughout the trade war that estimates are always made under the “policy in place”
standards at the time of the report, which meant no deal, no demand. How that comes
into play now that the deal has been signed remains to be seen. A wire service story last
week reported that, “the agency’s global crop supply and demand report will factor in
all provisions of the China deal that are publicly available,” according to a USDA
spokesperson. She went on to say that, “analysts will consider China’s demand in light
of the trade deal to develop estimates for individual commodities. USDA will issue a
white paper explaining this approach soon, hopefully before the next WASDE.” Some

                                                                                          3
traders have keyed off the phrase “all provisions that are publicly available” to mean
that private deals by the Chinese government may not be included. Since China has kept
tariffs in place against U.S. ag goods for the most part, unless this changes it means the
Chinese government will either need to buy themselves or at least allow special
exemptions and/or rebates to companies that buy. In other words, none of this is very
clear right now and we all know how the market hates uncertainty.
We can’t talk about markets today without talking about the Chinese coronavirus as
everyone wants to know just how serious the outbreak will become, but that is
something none of us know at this point. China has ring fenced and quarantined infected
areas and those provinces will be phased to return to work in 7-9 days. The death toll
from the coronavirus outbreak rose past 360 and total confirmed cases reached almost
17,400. The current number of coronavirus infections has already passed the SARS total
of 2003. According to the U.S. Centers of Disease Control and Prevention (CDC),
SARS took the lives of 774 people over a nine-month period before outbreaks stopped
in July 2003. SARS had a fatality rate of 9.6% compared to coronavirus fatality rate of
2.2%, but that may change. Assuming an incubation period of up to 14 days, with an
average of 7 days before a person presents with symptoms of the virus and succumbs to
the illness within the first week of diagnosis, the current fatality rate may yet
underestimate the eventual rate. If, on the other hand, the number of infections is as
vastly underestimated, even more so than the fatality rate, that 2.2% coronavirus fatality
rate could fall, which would be good news for those who have contracted the illness.
The only death outside of China occurred in the Philippines. At the risk of sounding
callous, even if the current death toll reached the SARS level, it would not be enough to
make a speck of difference to U.S. grain demand. World births are expected to exceed
deaths by 80.5 million in 2020. Unfortunately, that was not one of last week's headlines,
but those numbers have a bigger impact on grain demand than any flu virus. There is, of
course, a slight risk that I'm wrong, and this could be the start of a devastating
catastrophe, in both human terms and economic impact. However, markets are
emotional and we are not good at predicting things we have no way of knowing about. I
suspect fears about the coronavirus are overblown where it concerns U.S.
grain/livestock demand and that a fantastic opportunity lies before end users, but the
million dollar question is when? We’ve likely lost enough value to make short put/long
call strategies attractive, but they are marginable and require a commitment to
ownership at the put strike level. Out of the money calls are another alternative without
the margin risk, but you’re also buying carry and paying upfront premiums.
Low mortality, highly contagious is probably the best description of coronavirus.
Children with poorly developed immune systems and elderly with health issues are at
most risk to coronavirus similar to influenza. If not in those categories coronavirus has a
4very low mortality risk. The virus can range from not much more than a common cold
to a strong bout of flu. A healthy strong individual has virtually zero change of
succumbing to the virus. The case fatality rate has fallen significantly since first
reported. There are now 9 confirmed cases in the U.S., where they appear to have the
situation well monitored, while there was the first death outside of China in the
Philippines. Geopoliticist Peter Zeihan wrote that "this is not the Big One". It will not be
much different than having a doubling up of the flu season, although the economic
impact is certainly much greater. China is a much more open country today than back
when they dealt with SARS years ago when China was more isolated. There are
confirmed cases in 24 countries. Something like 2/3rd of the Chinese economy is going
to be shut down temporarily. Companies in China have closed factories this week and
supply chains will be challenged in the short term to maintain output. This will harm
GDP this quarter. The Chinese government is being challenged politically by this
epidemic. The government bears some political risk. One thing they will not want to
happen is food shortages. If anything, Beijing is going to want to make food more
available and as affordable as possible. ASDM's CEO says that he doesn't think that
global food demand will be negatively impacted. Food demand has actually risen in
similar cases in China. Markets are more at risk to the psychology of fear and
uncertainty than they will be to actual demand destruction.
On the demand front, Asian palm oil prices gained 0.6% after data from the Southern
Peninsular Palm Oil Millers Association point to a decline in production. Data from
southern Malaysia indicates that production for Jan 1-31 fell 4.3% on month, which
adds to ongoing concerns of lower supply of the oil due to dry weather. Respected trade
publication Oil World analyst Thomas Melke said he sees palm oil prices potentially
rising as much as $150/mt from current levels if Malaysia fully implements its planned
B30 blending mandate in 2020. He puts a conservative estimate of Malaysian palm oil
prices during Jan-Jun at $800/mt vs. current prices near $670/mt, down from $770/mt in
mid-Jan. The USDA announced a 134,000mt sale of 2019/20 optional origin corn to
South Korea Friday. Three South Korean feed mills bought 202,000mt of Mar-Apr
optional origin corn, with the U.S. the likely supplies. There is talk that China could
take U.S. corn into southeast China for their livestock herd rather than transit domestic
corn from the northeast thru coronavirus impacted provinces. The latest weekly DDGs
market update from the U.S. Grains Council showed for the week ending 01/23 DDGs
were at 107% of cash corn values. The DDG to soybean meal ratio is 0.50, which was 1
point more favored to DDGs vs. the previous week. Marketing year to date U.S. corn
export sales are trailing last year by 10.8mmt, soy sales exceed last year by 1.3mmt
while wheat export sales exceed last year by 3.0mmt. Despite ASF cutting Chinese hog
production sharply, Dec soy imports of 9.8mmt brought 2019 imports to 88.9mmt, the
2nd highest ever. As Chinese hog production transitions away from “mom and pop”
5production to commercial production, both meal and corn usage should increase
exponentially.
Friday’s CFTC report
showed that managed funds
trimmed their corn short
38,000 contracts to 29,000,
increased their soybean
short 37,000 contracts to
51,000, increased their long
7,000 contracts to 48,000, reduced their soybean oil long 5,000 contracts to 97,000 and
increased their meal short 3,000 contracts to 40,000. The combined 5 market managed
fund position was unchanged at 25,000 contracts vs. last week. The wheat and soybean
oil longs were larger than expected. The gross long position held by large spec traders in
Chicago wheat rose to 114,765 contracts last week, the largest on record. Spring wheat
spec traders continued their longest net short holding period on record. The managed
money short in corn was the smallest since August 20th. Index funds continue buying
corn, soybeans and Chicago wheat, purchasing a net 91,722 contracts of the three
commodities since December 17th. They have their largest long in corn since August
13th.
Livestock: Cash hogs are called $1 lower to $1 higher, with most bids expected steady
to $.50 lower. Slaughter Monday is expected at 496,000 head. It wouldn't be surprising
to see prices lower again in the hog market, as the market is in what seems to be a
perpetual downfall worrying about both internal and external factors. The national bid
lost $1.71 Friday to close at $52.49, while the IA/MN bid lost $.29 to close at $53.15.
The 01/29 CME Lean Hog Index was up $.38 to $62.78. USDA’s Pork Carcass Cutout
was $1.33 lower on Friday at $69.57 on good movement of 341 loads, with belly cuts
down the most after a $6.12 drop. Estimated packer margins were $28.72/head for non-
integrators and $15.51/head for integrators vs. $29.35 and $16.73 the previous day.
Weekly kill was down 0.63% vs. last week, but up 13.95% vs. a year ago in large part
due to a ½ day weather-related kill last year. Cash traded weaner pig prices were
$51.67, down $7.48 from a week ago. China’s commerce minister confirmed on
Saturday that China will actively seek additional imports of meats from abroad to stem
developing shortages. U.S. pork is the cheapest meat available and should witness
substantial Chinese demand now that the phase one agreement is active. Charts look
horrible but the chart gaps actually create opportunity. April hogs left 4 open chart gaps
now since early January and it would be very unusual for the market to leave so many
chart gaps open. Those chart gaps will provide targets for the recovery when it begins.
That means that the further the market breaks in panic now, the more upside potential
6from a low that is being created. That is the glass half full analysis, but the first thing
that they will have to do is stop going down. U.S. hatcheries set a record 240 million
eggs the week ending Jan 25th, beating the previous record in December. It was 4%
above last year and 1% above the prior week. Cumulative placements have reached 760
million this year, up 4% from last year. The surge in poultry production should boost
domestic meal demand. Also, there are reports more than 300 million chickens are at
risk in Hubei, China because of feed not reaching the province. If the lockdown
continues, the number of chickens at risk will grow each day and could lead to China
coming to the U.S. to help replace losses.
Aggressive pressure in lean hog futures seen last week has created significant weakness
through the entire complex. April lean hog futures fell nearly $12 last week, creating
additional concerns of liquidation and uncertainty where support levels will finally hold.
Widespread concerns of overall demand pressure in China surrounding coronavirus has
caused many to scale back expectations of export demand gains to the country, at least
for the short term. The growing concern in the hog complex is not entirely on the people
effected by the virus, but the overall impact to the economic structure and health of both
China and many other countries who rely on China's economy for their market support.
While concerns of moving pork product cause markets to tumble, the expectations of
additional growth in domestic hog production levels through the upcoming months is
curbing market support. Given the hog market is extremely oversold, the potential for a
quick and aggressive market bounce is also likely to create more activity early Monday
morning, but at this point, it is uncertain which direction will win the most support
through the trading day. Huge losses in the lean hog market Friday left the week $10.00
lower than last week's close in the February contract. The bottom of the board gave way
on Wednesday and since then prices have dropped $7.00 in the last three days. February
lean hogs closed $4.17 lower at $57.12, April lean hogs closed $4.22 lower at $61.60
and May lean hogs closed $2.30 lower at $70.02. Cutout values declined $8.42 from
Thu-Thu last week to the lowest level since Sep 25th and have dropped near $11 from
the January high as pork production has been well above trade expectations. Oddly, cash
prices have rallied during the same period, suggesting that packers may be looking past
coronavirus fears towards growing demand from China and U.S. hog numbers falling
back to 2-4% above last year. However, there are several things I’ve learned in 29 years
of trading that have saved me a lot of heartache. One, the market can remain irrational a
lot longer than you can remain solvent and two, never add to a losing position. With that
in mind, I’d be careful adding to a hog long right now regardless of what you believe
the fundamentals are. On the other hand, if you have no position, it may be a good time
to start to nibble at the long side. Finally, end of month/quarter can have an odd effect
on markets as money managers often jump in/out to take profits.
7Cattle futures trade is expected mixed in limited early trade Monday. With live cattle
futures falling $4.63 in April contracts last week, the market still remains oversold, but
given the weaker structure in all livestock markets, there has been little interest in
aggressively offsetting the market pressure from the last couple of weeks. The cattle
inventory report released Friday afternoon brings a mixed bag to the table. While
overall cattle numbers have shifted slightly lower, including a pullback in beef cows, the
confirmation of increased cattle on feed as of January is likely to have the most
immediate impact on overall market direction. Monday slaughter runs are expected near
121,000 head. Friday's anxiousness centered around the Cattle Inventory report, which
unveiled that the Jan 1 cattle inventory was down just slightly and that the 2019 calf
crop is down 1%. It's important to remember that this is a bi-annual report, and that this
is the first time in six years (the first time in the last 12 printed reports) that the data has
shown a decrease in total numbers. That is significant, noteworthy and most definitely
bullish. The board was reluctant to get caught closing higher before confirmation that
the report did indeed show lighter numbers. Nearby contracts closed mostly lower and
deferred contracts closed mildly higher. February live cattle were down $0.40 at
$121.37, April live cattle were down $0.52 at $119.67 and June live cattle closed $0.45
lower at $111.57. A light trade developed in the North mostly at $194 ($4.00 lower than
last week's weighted average) and business in the South was mostly just clean up. It's
interesting to look at the last couple of weeks' worth of Saturday kills and it's important
to notice that packers are starting to back off on Saturday kills and are trying to spread
supplies out without having to invest higher in the cash market. Boxed beef prices were
lower, with choice down $0.35 ($213.00) and select down $0.82 ($210.66) with a
movement of 74 loads. Friday's slaughter is estimated at 122,000 head, steady with a
week ago and 17,000 head more than a year ago. Saturday's slaughter is projected to be
around 30,000 head. Cash is called steady. It will be interesting to see what Monday's
showlists amount to, and at this point packers are going to work hard on keeping prices
right where they have them. Feeder cattle markets closed the week far better off than
where things were headed earlier in the week. March feeders closed $0.42 higher at
$136.07, April feeders closed $0.40 higher at $137.52 and May feeders closed $0.42
higher at $139.70. As the market closes down for the week and catches its breath before
next week, most would agree that, although prices fell this week with the Cattle
Inventory report showing lower numbers, this week has the opportunity to trade higher.
The European Food Safety Authority has published its latest annual update on the
presence of African swine fever in the European Union. During the period covered by
the report, November 2018 to October 2019, Czechia became officially ASF-free. The
disease was, however, confirmed as present in Slovakia, meaning there continues to be
nine affected countries in the EU. In 2019, the area of the EU affected by ASF expanded
progressively, moving mainly in a southwestern direction. The report shows that all
8phases of the epidemic are now represented in the EU: areas recently affected following
either an isolated introduction or geographic expansion from affected areas; affected
areas that are expanding; areas where ASF infection has been present for some time,
including areas where ASF seems to be fading out; and non-affected areas. The situation
varies substantially between Member States, due to multiple influences including the
structure of domestic pig production (in particular, the proportion of backyard holdings),
geographical conditions, and the characteristics of the wild boar population. Backyard
(non-commercial) farms present particular challenges for an ASF eradication program,
such as uncontrolled movements of pigs and people, poor biosecurity and the
identification of holdings.
Weather: The operational runs of the U.S. and European models are in fair to
sometimes good agreement during the outlook period. The European model is favored
today. The mean maps cover the 8 to 10 day period today feature a split jet stream
pattern. The northern branch of the jet stream features a building ridge through the
eastern Pacific pushing northward into the Gulf of Alaska and northwestern Canada.
This appears to be setting up as a blocking ridge, especially on the U.S. model. The U.S.
model is somewhat stronger and a little further north with this ridge. We note a mean
trough position in eastern Canada between Hudson Bay and southern Greenland. This
ridge west, trough east, pattern suggests colder weather in the Canadian Prairies region
of Canada. The U.S. model continues to forecast colder weather than the European
model in the area. This is likely due to the further north position of the blocking Gulf of
Alaska ridge on this model. The southern branch of the jet stream is showing a mean
trough over the western U.S. with a ridge over the Gulf of Mexico and above normal
heights pushing northward in the eastern U.S. The European model features a minor dip
in the jet stream off the coast of New England. This southern branch jet stream is
looking stronger today than it has during the past week or two. The further west position
of the trough and the Gulf of Mexico and southeast U.S. ridge suggests that the heavier
precipitation may move to include more of the central/southern Plains and Midwest
regions during the outlook period rather than where the heavier rain will be during this
week. This week the activity is mainly from the lower Miss river valley through the east
coast states. The Gulf of Mexico and east coast above normal heights points towards the
warmest anomalies these locations, however not nearly as warm as it has been recently.
The coldest anomalies in the U.S. may favor the western U.S. area. How cold would
depend on whether the western trough can tap on any potentially cold in western
Canada and this depends on how strong the Alaska blocking ridge becomes.
North American Weather Highlights: Colder weather returns to the central/southern
Plains this week but not cold enough to cause problems for winter wheat or to be very
stressful to livestock. Rain and some precipitation in southern areas maintains favorable
9soil moisture in this portion of the wheat belt. Increasing precipitation may occur during
the 6-10 day period associated with a mean western US trough. Rain this week in the
Midwest will maintain conditions too wet in southern and eastern areas. Next week the
rain or snow may become more widespread and heavier in the region. This is due to the
southern branch of the jet stream becoming more active in this region rather than in the
southeast U.S., where it will be active during this week. The northern Plains sees no
significant storms during the next 5-7 days. A more variable temperature pattern with
some periods of cold weather expected after that, possibly very cold at times.
Global Weather Highlights: A turn in Brazil to warmer, drier weather in Rio Grande do
Sul and Parana during the next 7 days will deplete soil moisture, increasing stress on
developing and filling soybeans. This situation bears watching. Favorable weather
continues for filling soybeans in central Brazil, with no significant disruptions to the
early harvest. Significant periods of hot/dry weather in northeast Brazil this growing
season will have a major impact on soybean production. A brief surge of hot
temperatures, lasting 2-4 days, began in the southern growing belt of Argentina early in
the weekend period and extended to the central ag belt by Sunday. The weekend heat
included readings of 100-102F in southwest growing areas. The hot weather is likely to
continue today and Tuesday with high temperatures well into the 90s F. The heat surge
has increased stress to reproductive to filling corn and soybeans and diminished soil
moisture for planting second crop soybeans in the south. After this period, cooler
temperatures are likely and also some rain. It is not certain this rain would occur with
high coverage or be more than just light to locally moderate. The bias would be that the
heavier rain and coverage is more likely in Cordoba and Santa Fe and less likely in La
Pampa and Buenos Aires this week, but this could change a little either way. Conditions
mostly favor developing to reproductive corn and sugarcane in South Africa after recent
rains and a variable temperature pattern. The crop belt may be somewhat hotter,
somewhat drier, during the next 5 days. The 6-10 day period looks to feature increasing
shower activity and cooler temperatures again. There are no significant concerns for
crops at this time. Winter-time precipitation and no major cold snaps in China will
mostly favor winter wheat and rapeseed. Northeast China is colder at this time but it
appears this cold weather stays north of the winter wheat belt. There will be adequate to
surplus soil moisture for crops areas from the southern North China Plain southward and
mostly adequate soil moisture and irrigation through the northern North China Plain this
spring. Also of note, increasing rain south of the Yangtze river should improve
conditions for planting crops during the spring months. Developing to early
reproductive wheat and rapeseed in India will have benefited from significant rains that
occurred during January. Light to moderate showers also occurred in Pakistan and
northwest India early last week as well. This favors winter wheat in key growing areas
in and around Punjab, Pakistan and Punjab, India. The weather pattern looks drier
10during the next week to ten days but not very warm. An active weather pattern has
returned significant moisture to the Germany and Poland area during the past week,
improving conditions for winter grains and oilseeds. Warmer temperatures mostly favor
these crops but leaves them less winter hardy than is usually the case this time of year.
No major cold snaps are indicated but seasonally cold weather may develop at times.
Ukraine/west Russia sees no major cold weather threats during the next 7 to 10 days.
However, seasonally cold weather is likely to return to the region for a time. There is
also likely to be an increase in precipitation through southern and eastern areas. This
could mean a significant risk for heavy snow in the region, improving the protective
snow cover in wheat areas. Widespread rain, showers and thunderstorms occurred
through east-central Australia during January, improving conditions for developing
crops but there is still a long way to go to end the drought. Following the extremes of
the growing season, I am not sure whether this will matter much as it concerns the yield
forecasts for these crops but it should at least stabilized crop yield forecasts.
Macros: The macro markets are mixed as of 8:30am EST, with Dow futures up 0.6%,
the U.S. dollar index is up 0.3%, crude oil is down 0.1% and gold is down 0.4%. The
S&P 500 on Friday sold-off to a 3 ½ week low and closed 1.77% lower. The DJIA lost
2.09% and the Nasdaq 100 lost 1.58%. Bearish factors included concern that the spread
of the China coronavirus will derail the global economy, and the unexpected 5.3 point
decline in the U.S. Jan Chicago PMI to 42.9, weaker than expectations of +0.7 to 48.9
and the steepest pace of contraction in 4 years. Chinese authorities over the weekend
announced a slew of support measures designed to support the Chinese economy and
financial system in the wake of the virus. State-supported financial institutions today are
also expected to be out in force, providing some buying support for Chinese stocks.
China's economy is being hit hard by the virus since there are large swaths of the
Chinese population under quarantine, large-scale business shutdowns, and the extension
of the Lunar New Year holiday through this week in a large portion of the country.
There is no sign that the spread of the virus is yet slowing. The impact from the
coronavirus is likely to rival that from SARS with a hit to China's Q1 and Q2 GDP of
one percentage point or more. SARS caused a 2 percentage point hit to China's GDP in
Q2-2003 to 9.1% from Q1's 11.1%. The consensus is that U.S. GDP will take a hit of at
least 0.2 percentage points from the virus, with Goldman forecasting a 0.4 point hit to
Q1 U.S. GDP. U.S. exports to China will decline, U.S. supply chains will be disrupted
by the near shutdown of China's economy, and U.S. citizens may reduce their travel and
stay away from public places since the virus has already migrated to the U.S.
11The U.S. markets this week will focus on
the extent of the economic damage being
done by China's coronavirus,
Washington events including President
Trump's State of the Union address on
Tuesday and the Senate's verdict on
Wednesday in President Trump's
impeachment trial, the Democratic
presidential campaign as the first vote
occurs today with the Iowa caucuses,
global stocks, which are focused on the
extent of today's sell-off in the Chinese
mainland stocks, world bond yields, which have plunged on the coronavirus with the
amount of negative interest-rate global debt rising by $2.7 trillion to $13.9 trillion in just
the last two weeks, a heavy earnings week with 96 of the S&P 500 companies reporting,
and Friday's Jan payroll report (expected +160,000 after Dec's +145,000). Brexit will be
in the news today as Prime Minister Johnson delivers a speech laying out his demands
for a UK/EU trade deal. Meanwhile, the EU today is scheduled to release the details of
its negotiating mandate. The UK Telegraph over the weekend reported that PM Johnson
is "privately infuriated" that the EU seems to be backtracking on the plan for a UK/EU
free trade agreement because the UK will not agree to any dovetailing of UK
regulations and taxes with the EU. PM Johnson is threatening to move from a Canadian-
style free trade agreement to an Australian model where the two sides pick some sectors
for cooperation while other sectors operate under WTO tariffs. This week's Chinese
economic data will be watched for the extent of the virus damage done thus far. China's
Jan Caixin services PMI on Tuesday night is expected to show a 0.5 point decline to
52.0, adding to Dec's 1.0 point decline. China's Jan trade report on Thursday night is
expected to show a 4.5% drop in exports and a 2.0% increase in imports.
Stocks fell sharply on Wall Street Friday as fears spread through the markets that a virus
outbreak emanating from China will dent global growth. The Dow Jones Industrial
Average skidded more than 600 points and the S&P 500 index erased its gains for
January. Technology companies, which do a lot of business with China, led the losses.
Airlines fell after Delta and American suspended flights to and from the country. Just
two weeks ago, the S&P 500 had closed at an all-time high, having climbed around 13%
since early October. A preliminary trade deal signed by the U.S. and China earlier in the
month eased a big source of uncertainty in the markets. Volatility was running at 12-
month lows and even a dust up between the U.S. and Iran didn't rock markets. Then
came the virus outbreak in China. Markets around the globe have sold off on concerns
about the potential economic impact of the outbreak. Hong Kong's Hang Seng fell 5.9%
12this week and South Korea's Kospi dropped 5.7%. Markets in Europe declined as well.
The U.S. stock market, which had calmly been setting record after record, suffered its
worst January since 2016 and its first monthly loss since August. The virus has infected
almost 10,000 people in just two months, mostly in China. The World Health
Organization has declared the outbreak a global emergency, a designation that signals
that the virus is now a significant risk to other countries and requires a global response.
The death toll stood at 213, including 43 new fatalities, all in China.
The S&P 500 sank 58.14 points, or 1.8%, to 3,225.52. The Dow Jones industrials fell
603.41 points, or 2.1% to 28,256.03 The Nasdaq dropped 148 points, or 1.6%, to
9,150.94. Bond prices rose, a signal that investors are seeking safety. The yield on the
10-year Treasury fell to 1.51% from 1.55% late Thursday. In another sign of how much
fear is in the market, the yield on the three-month Treasury rose above the 10-year yield,
a relatively rare occurrence that hasn't happened since October. Investors see such
inversions as a fairly reliable warning signal of a recession within a year or so, though
the track record isn't perfect. Economists are scrambling to calculate the virus' impact on
China's economy. The Chinese economy is far bigger and more closely integrated with
the rest of the world than it was at the time of the SARS outbreak 17 years ago. China
now accounts for 16% of global economic output, up from 4% in 2003. Ben May,
director of global macro research at Oxford Economics, estimates that the virus will
shave 0.4 percentage points off Chinese economic growth this year, leaving it at 5.6%,
the slowest since 1990, and reduce global growth by 0.2 percentage points to 2.3%, the
weakest since the financial crisis. Others expect a repeat of the SARS experience: a
quarter or two of weaker Chinese growth followed by a quick and full recovery with
limited fallout worldwide. "History suggests that unless the end of the world is going to
be caused by this flu-like virus, it will prove to be only a slight headwind for the global
economy,' Carl Weinberg, chief economist at High Frequency Economics, wrote in a
research report.
Concerns over the potential impact the virus could have intensified Friday after the U.S.
State Department warned against travel to China and some U.S. carriers responded by
suspending flights. The move by U.S. airlines helped deepen a slide in oil prices. U.S.
crude fell nearly 6% in January, a decline that coincides with a sell-off on energy stocks.
The sector is down 11.2% for the year, the biggest decliner in the S&P 500. Industrial
stocks, which include airlines and other transportation companies, also ended the month
in the red. Exxon Mobil slid 4.1% after the country's biggest oil producer's profit slid
more than 5% in the fourth quarter and fell short of Wall Street forecasts. Rival Chevron
fell 3.8% after it posted a quarterly loss of $6.6 billion. Benchmark crude oil fell 58
cents to settle at $51.56 a barrel. Brent crude oil, the international standard, dropped 13
cents to close at $58.16 a barrel. Wholesale gasoline was unchanged at $1.49 per gallon.
13Heating oil declined 1 cent to $1.63 per gallon. Natural gas rose 1 cent to $1.84 per
1,000 cubic feet. Gold fell 60 cents to $1,582.90 per ounce, silver rose 2 cents to $17.97
per ounce and copper was unchanged at $2.52 per pound, but it's down 6.4% for the
week. Copper is widely used in manufacturing and is often seen as an indicator of how
that sector is doing. The dollar fell to 108.37 Japanese yen from 108.78 yen on
Thursday. The euro strengthened to $1.1089 from $1.1031. European markets closed
broadly lower. Markets in Asia finished mostly lower, though Japan's Nikkei 225 rose
1%.
Summary: For the week, March corn closed down $.06, March soybeans were down
$.29 ½, March Kansas City wheat was down $.20 ½, March Chicago wheat was down
$.19 ¾ and March Minneapolis wheat was down $.13 ¾. March corn ended up $.01 ¾
$3.81 ¼ Friday. With investors rattled by soaring coronavirus infection counts, it was a
tough week for the stock market and commodity prices in general. March corn has done
well to stay above support levels, so far. Sunday evening and Monday's trade will be
interesting as higher infection counts seem likely to continue and may present further
challenges to the long side of the market. In South America, the seven-day forecast is
below normal for much of Brazil's crop areas and that is favorable for soybean harvest
progress and timely planting dates for corn. Above-normal precipitation is expected
over Argentina's main crop areas, a bearish market influence for corn prices. Earlier
Friday, USDA reported South Korea bought 5.3mb (134,000mt) of optional origin corn
for 2019-20, the source to be determined later. Fundamentally speaking, March corn
prices should have support at current levels, but fears about coronavirus remain a
bearish risk. Technically, the trend in cash corn remains sideways and, in spite of recent
volatility, winter is typically a quieter season for trading.
March soybeans ended down $.03 ¾ at $8.72 ½ Friday, capping a bearish week of
coronavirus news. While coronavirus selling in soybeans is partly emotional and suspect
as to how bearish it may actually be, the anticipation of a large soybean crop being
harvested in Brazil is a legitimate bearish risk and is also weighing on prices. The latest
seven-day forecast expects a range of light to heavy precipitation across Brazil's main
growing areas but is expected to be below normal overall and mostly favorable for
harvest progress. Thursday's lower export sales total of 17.3mb for last week was
slightly bearish and likely related to the anticipation of cheaper new-crop supplies in
Brazil. While future sales are apt to become more difficult, we can't forget that U.S.
soybean exports are in better shape at this point in 2019-20 than where they were last
year; 935mb have been shipped so far, up 43% from a year ago. Aside from coronavirus
fears, current soybean fundamentals suggest a national average cash soybean price near
$9.00 and early anecdotes suggest soybean acres will be higher in 2020 but remain less
14than corn acres. Amid persistent selling, the trend in cash soybean prices has turned
down.
March KC wheat closed down $.05 ½ at $4.65 ½ Friday, also getting bearish pressure
from coronavirus news, even though the fundamental logic is not very strong for wheat
prices. It is also fair to acknowledge that wheat prices have had decent rallies this winter
without much reason, so seeing March KC wheat fall back doesn't need a lot of
explanation. The Jan 22 high of $5.04 ¾ represents a gain of over a dollar since early
September and will likely serve as resistance until spring. Friday's seven-day forecast is
mostly dry for the HRW wheat region and expects moderate to heavy precipitation in
the southeastern U.S., including many SRW wheat areas. There is some concern of
drought in western Kansas and eastern Colorado, but the area also received beneficial
precipitation this week. March Minneapolis wheat ended down at a new one-month low.
SRW wheat continues to have the least bearish argument of the three, but prices fell
back this week after getting close to their five-year high last week. Technically
speaking, the trend remains up for cash SRW wheat, but is suspect. Trends are sideways
for cash HRW and HRS wheats.
March soybeans sold off on Friday and closed lower for the third week in a row on the
weekly chart. The near and intermediate-term March soybean trends point down. The
selling phase picked up fresh momentum last week on the breakdown below March
soybean swing low support at $8.82 ½, the Dec 2 low. That level now becomes March
soybean resistance. Friday's selling tugged March beans to their lowest level since late
May. Daily March soybean momentum fell to an oversold 20% on Friday on the 14-day
relative strength index. Any reading below 30% is considered oversold. That leaves
beans vulnerable to a snap-back correction at any time, but the market is falling in
search of fresh demand. On the downside, there is a vacuum of March bean support
until the $8.65 ½ low from May 21. March corn edged slightly higher Friday in a quiet,
inside day session on the daily chart. The short-term March corn trend is bearish-neutral
in a range bordered by resistance and support at $3.94-$3.75 ¼. March corn traded
below the 10-day and 20-day moving averages at $3.85 ¾-$3.85 ¼, which gives the
bears the slight technical edge within that neutral range. On the upside, the 10-day
moving average is first March corn resistance and a recovery above that line and
resistance at $3.88 ¼ would be needed to turn the focus back toward the range top
resistance at $3.94. On the downside, a sustained corn breakdown below $3.75 ¼ would
be a weak trend signal and could open the door to a new selling wave if that were to
unfold. For now, neither the bulls nor the bears reveal strong short-term trend control.
A/C Trading Co. does not accept orders to buy or sell by e-mail, text or any other form of social media. This material has been
prepared by a sales or trading employee or agent of A/C Trading Co. and is, or is in the nature of, a solicitation. By accepting this
communication, you agree that you are an experienced user of the futures markets, capable of making independent trading decisions, and
agree that you are not, and will not, rely solely on this communication in making trading decisions. DISTRIBUTION IN SOME
15JURISDICTIONS MAY BE PROHIBITED OR RESTRICTED BY LAW. PERSONS IN POSSESSION OF THIS COMMUNICATION
INDIRECTLY SHOULD INFORM THEMSELVES ABOUT AND OBSERVE ANY SUCH PROHIBITION OR RESTRICTIONS. TO
THE EXTENT THAT YOU HAVE RECEIVED THIS COMMUNICATION INDIRECTLY AND SOLICITATIONS ARE
PROHIBITED IN YOUR JURISDICTION WITHOUT REGISTRATION, THE MARKET COMMENTARY IN THIS
COMMUNICATION SHOULD NOT BE CONSIDERED A SOLICITATION. The risk of loss in trading futures and/or options is
substantial and each investor and/or trader must consider whether this is a suitable investment. Past performance, whether actual or
indicated by simulated historical tests of strategies, is not indicative of future results. Trading advice is based on information taken from
trades and statistical services and other sources that A/C Trading Co. believes are reliable. We do not guarantee that such information is
accurate or complete and it should not be relied upon as such. Trading advice reflects our good faith judgment at a specific time and is
subject to change without notice. There is no guarantee that the advice we give will result in profitable trades.
16You can also read