AUSSIE MINE 2018 HEALTHY, BUT FUTURE FIT? - PWC AUSTRALIA

Page created by Katie Zimmerman
 
CONTINUE READING
AUSSIE MINE 2018 HEALTHY, BUT FUTURE FIT? - PWC AUSTRALIA
Aussie Mine 2018
Healthy, but future fit?
AUSSIE MINE 2018 HEALTHY, BUT FUTURE FIT? - PWC AUSTRALIA
Overview                                                                            The looming challenges:
                              We’ve seen some remarkable results for the MT50
                              in 2018, due to the continuing upward trend in
                              commodity prices coupled with cost-focused            • Operating costs are again moving more closely
                              strategies of prior years. At a glance things seem      in line with revenue
                              healthy. But further analysis reveals organisations   • Exploration expenditure is still limited, and has
                              and mining leaders have further opportunities to        reduced as a proportion of capex
                              focus on several key areas to be ‘future fit’, and
                              position themselves for long-term positive growth.    • There is a lack of new mines – be it risk
                                                                                      aversion or permitting challenges, capital
Welcome to the 12th           At a high level, the MT50 are dealing with two          expenditure is centred primarily on brownfield
                              extremes:
edition of Aussie Mine,                                                               operations

‘Healthy, but future fit?’    The good:                                             • The sector risks becoming less relevant to the
                                                                                      next generation workforce – tertiary enrolments
                              • Investor confidence has returned with, market         for mining engineers are rapidly shrinking,
                                capitalisation surging 28% on last years MT50,
Aussie Mine provides            and all but three of the MT50 experiencing an
                                                                                      and negative press about working culture and
                                                                                      conditions such as fly-in/fly-out (FIFO) isn’t
industry and financial          increase in this measure                              helping attracting top talent
analysis on Australia’s       • Revenue continued its rise (up 13%) with nearly     • A brewing global trade war continues to make
                                all commodity groups contributing to EBITDA
mid-tier mining sector as       margins hitting 31% – maintaining near-record
                                                                                      business leaders nervous.

represented by the mid-tier     levels                                              This edition of Aussie Mine will look at the impact
                                                                                    these factors are having on the MT50.
50 (MT50) – the largest ASX   • With profits soaring back to 2012 levels, the
                                sector ploughed money into dividends, debt          Simply put, while they appear healthy, they must
mining companies with a         reduction and capex – even setting aside cash       renew focus to be ‘future fit’.
market capitalisation of        for future deals.

less than $5 billion at
30 June 2018.

2 | PwC
AUSSIE MINE 2018 HEALTHY, BUT FUTURE FIT? - PWC AUSTRALIA
Contents

 1
 Who made the cut - the
                          2
                          The vital signs look good
                                                      3
                                                      MT50 in perspective
                                                                            4
                                                                            Productivity – time for
 top 50 mid-tier miners                                                     new ways of thinking

 5
 Building a future
                          6
                          Deals analysis and
                                                      7
                                                      Financial analysis
                                                                            8
                                                                            Voluntary reporting
 fit workforce            outlook                     Income statement      and trends
                                                      Balance sheet
                                                      Cash flow statement

9Explanatory notes and
                          10
                          PwC contacts
 key contributors

                                                                                           Aussie Mine 2018 | 3
AUSSIE MINE 2018 HEALTHY, BUT FUTURE FIT? - PWC AUSTRALIA
The vital signs look good:                             But the challenges are significant:

                                                         Operating costs                        Impairments
     Market cap     28% on last year’s MT50,             jumped by

                                                        10%
     or 53% for this year’s MT50

     Revenue continues to rise       %13                                                               56%

                                                                          12%
                                     ...and a big war
     EBIDTA margins maintain         chest with cash
     record high levels at 31%
                                     up 25% to over      Exploration
                                     $6 billion
                                                         as a proportion
                                                         of capex decreasing
     Capital expenditure increased       by 32%

     Dividends paid continue to surge up         33%                 Gold grades in the MT50     Deal volumes
                with an additional 5 companies paying                have reduced by over        are back

                       ...future fit?
                                                                     20%          in the last
                                                                                  2 years

                                                        Workforce                                 in a time of rising prices
  Class of 2018                                         challenges
  4 companies graduated,
  highest on record.                                    are looming

4 | PwC
AUSSIE MINE 2018 HEALTHY, BUT FUTURE FIT? - PWC AUSTRALIA
Who made the cut -
the top 50 mid-tier miners
The 50 largest mining companies listed on the Australian Securities Exchange with a market capitalisation of less than $5 billion at 30 June 2018.
These companies have an average market capitalisation of almost $1.2 billion.
                                                                                                             Market Capitalisation as at   Market Capitalisation change 2017
2018 Rank       2017 Rank    Company Name                        Primary Commodity             Producer
                                                                                                             30/06/2018                    to 2018
      1                 3    Iluka Resources Limited             Mineral Sands                               4,710                         30%

      2                 na   AngloGold Ashanti Limited           Gold                                        4,550                         -13%

      3                 4    Northern Star Resources Limited     Gold                                         4,449                        56%

      4                 10   Independence Group NL               Diversified                                  3,017                        63%

      5                 7    OZ Minerals Limited                 Copper                                       3,012                        36%

      6                 8    Mineral Resources Limited           Iron Ore                                     2,997                        47%

      7                 9    Regis Resources Limited             Gold                                         2,583                        36%

      8                 11   St Barbara Limited                  Gold                                         2,514                        74%

      9                 12   New Hope Corporation Limited        Coal                                         2,485                        95%

     10                 6    OceanaGold Corporation              Gold                                         2,317                        -4%

     11                 13   Saracen Mineral Holdings Limited    Gold                                         1,791                        89%

     12                 27   Lynas Corporation Limited           Rare Earths                                  1,550                        301%

     13                 23   Pilbara Minerals Limited            Lithium                          -           1,509                        171%

     14                 14   Sandfire Resources NL               Copper                                       1,451                        63%

     15                 17   Orocobre Limited                    Lithium                                      1,348                        85%

     16                 18   Galaxy Resources Limited            Lithium                                      1,241                        89%

     17                 21   Western Areas Limited               Nickel                                       971                          69%

     18                 15   Resolute Mining Limited             Gold                                         945                          8%

     19                 na   OM Holdings Limited                 Manganese                                    914                          635%

     20                 16   Syrah Resources Limited             Graphite                         -           860                          18%

     21                 43   Kidman Resources Limited            Lithium                          -           771                          282%

     22                 na   Jupiter Mines Limited               Manganese                                    750                          100%

     23                 19   Alacer Gold Corp.                   Gold                                         734                          20%

     24                 22   Westgold Resources Limited          Gold                                         672                          19%

          New entrant        Returning entrant
                                                                                                                                                         Aussie Mine 2018 | 5
AUSSIE MINE 2018 HEALTHY, BUT FUTURE FIT? - PWC AUSTRALIA
Market Capitalisation as at   Market Capitalisation change
2018 Rank        2017 Rank    Company Name                     Primary Commodity   Producer
                                                                                              30/06/2018                    2017 to 2018

      25                 na   New Century Resources Limited    Zinc                   -       660                           100%

      26                 20   Gold Road Resources Limited      Gold                   -       649                           11%

      27                 24   Zimplats Holdings Limited        Diversified                    646                           20%

      28                 44   Altura Mining Limited            Lithium                -       592                           207%

      29                 26   Dacian Gold Limited              Gold                   -       587                           47%

      30                 28   Champion Iron Limited            Iron Ore                       553                           43%

      31                 na   Global Geoscience Limited        Lithium                -       529                           223%

      32                 25   Metals X Limited                 Diversified                    490                           20%

      33                 na   Aurelia Metals Limited           Diversified                    488                           512%

      34                 32   Mount Gibson Iron Limited        Iron Ore                       477                           32%

      35                 34   Perseus Mining Limited           Gold                           445                           49%

      36                 na   Atlas Iron Limited               Iron Ore                       399                           187%

      37                 41   Base Resources Limited           Mineral Sands                  333                           57%

      38                 na   Tungsten Mining NL               Tungsten                       320                           3141%

      39                 31   Tribune Resources Limited        Gold                           318                           -13%

      40                 37   Ramelius Resources Limited       Gold                           307                           29%

      41                 na   Panoramic Resources Limited      Nickel                 -       305                           223%

      42                 38   Silver Lake Resources Limited    Gold                           302                           28%

      43                 na   Paladin Energy Ltd               Uranium                        300                           100%

      44                 na   Metro Mining Limited             Bauxite                        293                           101%

      45                 42   Brockman Mining Limited          Iron Ore               -       291                           38%

      46                 na   Flinders Mines Limited           Iron Ore               -       273                           55%

      47                 na   West African Resources Limited   Gold                   -       263                           53%

      48                 na   Australian Mines Limited         Nickel                 -       238                           642%

      49                 45   Pantoro Limited                  Gold                           237                           24%

      50                 na   Tawana Resources NL              Lithium                -       236                           174%

           New entrant        Returning entrant

Source: CAPIQ

6 | PwC
AUSSIE MINE 2018 HEALTHY, BUT FUTURE FIT? - PWC AUSTRALIA
The vital signs look good
                                                                                                             MMG successfully commissioned its Dugald River
This rang true in 2018, with                            The fit                                              project ahead of schedule and under budget.
positive commodity prices                               MMG, Yancoal, Evolution and Whitehaven have          Coupled with strong copper and zinc prices and
                                                        leapt from the top end of the MT50 – a level of      growing copper production at Las Bambas, this
across most sectors and recent                          upward movement not seen since 2007. Typically       launched MMG out of the list.
cost-out strategies delivering                          at most only one or two companies exceed our
                                                                                                             Yancoal has had a spectacular two years. Starting
remarkable returns. This year                           market capitalisation threshold in any given year.
                                                                                                             outside the list in 2016, it raced through the ranks,
                                                        A combination of factors led to the successes of
saw the most impressive                                 these four companies:
                                                                                                             with its performance supercharged by thermal coal
                                                                                                             prices and with the recent Coal & Allied acquisition
‘graduating class’ in the                                                                                    from Rio Tinto almost doubling production.
                                                        Mid-tier upwards mover
12-year history of Aussie Mine,
                                                                                                             Evolution continued to prioritise margins,
with four companies from last                                         MMG Yancoal Evolution Whitehaven       reporting annual record lows for AIC and AISC
year’s MT50 group breaking                                                                                   in 2018. Benefiting from increased production
                                                        Large                                                following its recent acquisition of a 30% stake in
through the $5 billion market                           commodity                                            Ernest Henry, Evolution has focused on quality,
capitalisation ceiling.                                 price
                                                        shift
                                                                                                             not size – clearly well received by the market.
These favourable conditions meant that this year’s                                                           Whitehaven rose out of the list due to record
MT50 market capitalisation surged 28% against           Recent                                               production at Maules Creek and surging thermal
last year’s group of companies, growing to $58.7        expansion                                            coal prices. With the acquisition of Rio’s 75%
billion. Better still, when focusing solely on the 50                                                        stake in the Winchester South coking coal project
companies in the 2018 list, market capitalisation                                                            in June 2018, Whitehaven shows no sign of
is up a staggering 53%. Only three of this year’s       Recent
                                                        acquisition                                          slowing in the coming year.
MT50 failed to improve their market capitalisation
position during 2018, a sign that investor
confidence has returned.                                State
                                                        owned

                                                                                                                                                Aussie Mine 2018 | 7
AUSSIE MINE 2018 HEALTHY, BUT FUTURE FIT? - PWC AUSTRALIA
The healthy
This year saw nine first-time entrants to the
MT50, with New Century, Aurelia, Tungsten
Mining and Tawana headlining the inclusions –
all benefiting from successful deals. OM Holdings,
Jupiter Mines, Panoramic and Paladin were
welcomed back into the list. It was ‘take two’ for
Jupiter Mines and Paladin, who reappeared on the
ASX this year. Jupiter Mines made its return after
four years with one of the biggest mining IPOs
in the last decade, while Paladin was reinstated
to official quotation following its successful
recapitalisation.

The out of shape
Eleven companies fell by the wayside this year.
After three years in the MT50, Teranga delisted
itself from the ASX due to lack of trade activity,
though it remains active on the TSX. Realm
struggled in the face of acquisition by Taurus
Resources. Despite some recent positive
sentiment in uranium pricing, the looming closure
of the Ranger mine has ended ERA’s run and it
fell from the list for the first time since Aussie Mine
began in 2007.

Picking up pace...
Anticipation surrounding developments
at lithium miners Kidman Resources
and Altura Mining doubled their market
capitalisation, driving them up our list in 2018.
They rose 22 and 16 rankings respectively.
The push towards electric vehicles has created
tremendous belief in lithium. Though this
battery mineral was barely mentioned in earlier
editions of Aussie Mine, there are now seven
lithium-related companies in the MT50.

8 | PwC
AUSSIE MINE 2018 HEALTHY, BUT FUTURE FIT? - PWC AUSTRALIA
MT50 in perspective
The MT50 group of companies is continuing to         ASX 200 vs Standardised MT50
outperform the broader ASX 200 – a trend that’s      140%
gathered pace since late 2015. While the ASX
                                                     120%
200 has grown a modest 9% since July 2015, the
                                                     100%
MT50 market capitalisation has grown a
staggering 140%.                                      80%

                                                      60%
Compared to 2017, the group’s market
                                                      40%
capitalisation has grown an incredible 53% to
                                                      20%
$58.7 billion, with gold, lithium and coal leading
the way. The headroom of market capitalisation        0%
over net assets has also improved from 57% to        -20%
                                                            1/07/2015          1/01/2016      1/07/2016              1/01/2017                  1/07/2017                1/01/2018
99% in 2018. This translates to a $30.2 billion      -40%
premium over net assets, with all commodities                                                           ASX 200                   MT50
reaping the benefits of improved investor            Source: CAPIQ
sentiment. However, recent history can serve as a
warning, with a similar premium wiped out in the
space of two years between 2011 and 2013.
                                                     MT50 Index: Market Capitalisation vs Net Assets

                                                     100%                                                                                                                                62,500
                                                      90%
                                                                                                                                                                                         52,500
                                                      80%
                                                      70%
                                                                                                                                                                                         42,500
                                                      60%
                                                      50%                                                                                                                                32,500
                                                      40%
                                                                                                                                                                                         22,500
                                                      30%
                                                      20%
                                                                                                                                                                                         12,500
                                                      10%
                                                       0%                                                                                                                                2,500
                                                               2009     2010         2011    2012         2013             2014          2015         2016           2017         2018

                                                                           Net Assets ($m)    Market Capitalisation ($m)            Net Assets / Market Capitalisation

                                                     Source: CAPIQ

                                                                                                                                                                            Aussie Mine 2018 | 9
AUSSIE MINE 2018 HEALTHY, BUT FUTURE FIT? - PWC AUSTRALIA
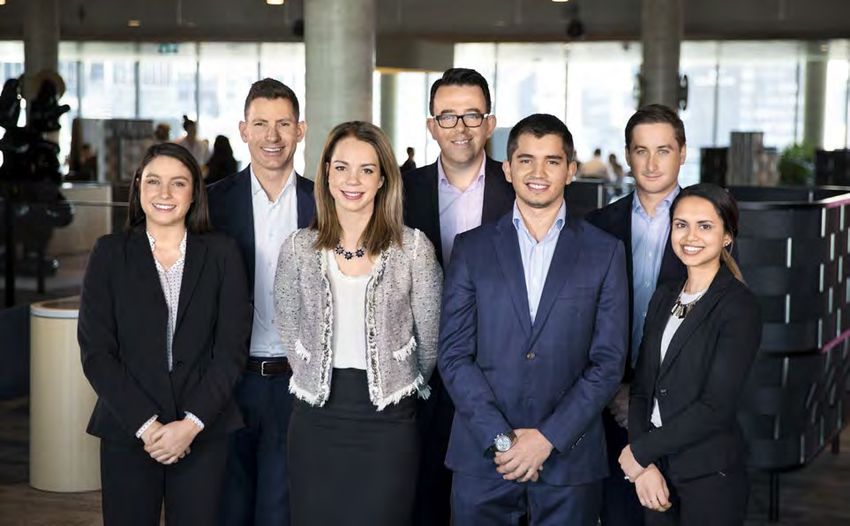
This year has been particularly successful for the
                                                       Commodity              % change in operating costs   % change in production
group’s profit line, adjusted net profit after tax
lifted by 69% to $2,996 million levels having not
been this high since 2012.                                      Coal          21%                           10%

Gold miners continue to represent a third of the
list and contributed the most top line growth of the            Copper        26%                           0%
commodities within the group (the exception being
iron ore, which fell slightly) as revenues grew 13%
                                                                Gold          5%                            9%
to a collective $21,986 million. Revenue lifted off
the back of a positive pricing environment across
most commodities and improved production                        Iron ore      -5%                           -16%
levels.

Thirty-five of the MT50 are in production and          Source: PwC Analysis

make up 86% of the list’s market capitalisation.
Those in exploration and development trumped
their producing counterparts however, with market
capitalisation increasing by an average of 124%
vs. 45% for their producing peers, clear evidence
investors are willing to back sorely needed new
projects.

Interestingly, for those MT50 companies in
production there are indications that cost control
remains problematic. Taking a look at major
commodity groups, the changes in operating
costs versus production year on year highlight the
challenges facing coal and copper companies,
with operating costs increasing at a substantially
greater rate then production levels.

10 | PwC
Productivity – time for new
ways of thinking
ASX 100 v Key commodities price movements                                                                                                                              While commodity prices have risen to highs
                                                                                                                                                                       not seen since 2012, growing challenges and
100%                                                                                                                                                                   upheavals to global trade have caused many
                                                                                                                                                                       mid-tier mining companies to become less secure
                                                                                                                                                                       about what lies ahead. These commodity price
 80%
                                                                                                                                                                       rises have left many acquisition targets out of
                                                                                                                                                                       reach for the MT50, and doubts about economic
 60%                                                                                                                                                                   models and business cases have added to
                                                                                                                                                                       uncertainty around where prices will go next.

 40%                                                                                                                                                                   With acquisitions becoming more challenging,
                                                                                                                                                                       most mining companies are looking to brownfield
                                                                                                                                                                       expansion of existing operations or capital
 20%                                                                                                                                                                   investment in equipment to improve productivity.
                                                                                                                                                                       The logic here – common among large and small
                                                                                                                                                                       companies alike – is that growth or renewal of
  0%
                                                                                                                                                                       existing operations is the ‘silver bullet’ to improved
                                                                                                                                                                       mining and site productivity.
(-20%)
                                                                                                                                                                       Our productivity work with miners indicates this
                                                                                                                                                                       ‘internal focus’ has not increased productivity
(-40%)                                                                                                                                                                 as miners had hoped. PwC’s Mining Equipment
                                                                                                                                                                       Productivity database* (the world’s largest
         01/2015

                   04/2015

                             07/2015

                                        10/2015

                                                  01/2016

                                                                04/2016

                                                                          07/2016

                                                                                           10/2016

                                                                                                     01/2017

                                                                                                                   04/2017

                                                                                                                             07/2017

                                                                                                                                         10/2017

                                                                                                                                                   01/2018

                                                                                                                                                             04/2018
                                                                                                                                                                       equipment-level productivity database) shows
                                                                                                                                                                       that equipment productivity has only improved
                                                                                                                                                                       marginally over the past decade despite nearly
                                 Gold                Iron Ore                       Coal                       Copper                  ASX100                          every mining company touting productivity
                                                                                                                                                                       increases in the last decade.
Source: www.indexmundi.com & www.marketindex.com.au

                                                                                                                                                                       * A database encompassing over 10,000 pieces of
                                                                                                                                                                       equipment across 2 billion activity cycles – focused on open cut
                                                                                                                                                                       mining

                                                                                                                                                                                                                   Aussie Mine 2018 | 11
Worldwide Mining Equipment Productivity Index

140%

120%

100%

 80%

 60%

 40%

 20%

  0%
                2008              2009            2010               2011   2012         2013                2014   2015       2016   2017

           Electric Rope Shovel                          Front End Loader          Hydraulic Shovel/Excavators             Truck        Ancilliary

Source: PwC’s Mining Equipment Productivity Database

12 | PwC
MT50 working up a sweat?                                                                                 Support supervisors and
We expect mid-tier miners to be more productive        Productivity from                                 superintendents
than big mining companies as they:                     people, not gear                                  Supervisors and superintendents are the heart
• Have less equipment to focus on                      As commodity prices remain high, most             of any mining organisation, and productivity
                                                       miners will return their focus to maximising      stems from their ability to lead improvements.
• Generally have less equipment on each site and       volume – generally, this takes the form           Most of these leaders have worked their way up
  lower associated congestion                          of investing in additional equipment. This        from operator positions and have developed an
                                                       is a guaranteed way to reduce overall             understanding of mining systems. But many don’t
• Have more control of strategy and culture            productivity as the equipment tends to            have experience translating ideas into business
                                                       either run at low utilisation rates, or, shifts   cases and actionable plans. As a result, we’ve
• Provide top performing employees more
                                                       existing equipment into poor performance.         seen many productivity initiatives kick off strongly
  freedom to have an impact.
                                                                                                         but then struggle to maintain momentum beyond a
However, our experience shows mid-tier miner           So how can the MT50 maximise volumes at           few weeks.
productivity tends to be much more mixed. Even         minimal cost?
                                                                                                         Helping supervisors and superintendents improve
within individual companies, productivity variations   Companies should focus on three things            their ability to deliver improvement projects
between sites can be immense.                          to dramatically improve their existing            is a simple and proven way to gain fast and
So how can the MT50 really move the needle on          equipment productivity:                           sustainable productivity uplifts. Providing the right
productivity? For large mining companies, there’s                                                        tools, fit-for-purpose methodologies, and hands-
                                                       1. Support supervisors and superintendents
a push for automation and removal of manual                                                              on coaching significantly increases operational
labour in operations, especially in open cut mining.   2. Accept failure                                 productivity.
Yet the anticipated benefits of automation are still
to be proven, and the setup costs (equipment,          3. Move from ‘dirt boss’ to ‘data boss’
infrastructure and operations) generally require
scale to make the business case economic.

For many companies in the group, our
experience in robotic mining indicates brownfield
enhancements will see limited upside from
automation in the near term. MT50 companies
are generally very good ‘fast followers’, and
most would benefit from waiting until equipment
providers have addressed key performance
concerns before looking to adopt to autonomous
equipment.

                                                                                                                                            Aussie Mine 2018 | 13
Accept failure                                        Move from ‘dirt boss’ to
Leadership of mining companies is often               ‘data boss’
dominated by large personalities, carrying a ‘big
                                                      Few industries have assets that produce more
stick’ mentality towards performance. Failure is
                                                      data than mining equipment. Yet many mining
publicly called out and shamed, stifling innovation
                                                      companies do not use this data – instead
and leading to conservative cultures where only
                                                      managing via ‘gut feel’, handwritten notes (often
minor productivity improvements are realised.
                                                      on the back of supervisor’s hands) or basic, high-
Coaching and support from managers and general
                                                      level reports. Major mining companies are starting
managers is essential in creating a culture of
                                                      to embrace data analytics as a differentiator of
continuous improvement and productivity.
                                                      performance, but we’re still to see this approach
One-on-one training of mining leaders on
                                                      being widely adopted across mid-tier miners.
meeting preparation and situational management,
observations and on-the-spot feedback on culture,     Most companies struggle with getting started in
are proven to have significant and lasting impacts    analytics, or try ‘drinking from the firehose’ and
on behaviour, and on the development of an            measuring everything, eventually drowning in a sea
improvement-focused mindset across operational        of incorrect and faulty data. Focusing on a specific
teams.                                                issue (i.e. shift change/last load to first load or
                                                      loading unit operator variability) allows teams to
                                                      not just understand the opportunity better, but to
                                                      identify and address data quality and monitoring
                                                      issues, simplifying the next analysis.

                                                      To deliver productivity gains without sacrificing
                                                      safety performance, future fit mid-tier miners
                                                      should follow the learnings of their global peers
                                                      pursuing ‘standardised work’ projects. Using
                                                      sound data analysis, these projects better enable
                                                      the blue collar workforce to use technology,
                                                      making tasks quicker, smarter and safer.

14 | PwC
Building a future fit workforce
WA School of Mines engineering enrolments                                                                    Following the recent uptick in mining performance,
                                                                                                             the war for talent is back on the agenda. The need
400                                                                                                          for the mid-tier mining sector to build tomorrow’s
                                                                                                             workforce remains unabated, and future supply
350                                                                                                          looks far from where it needs to be.

                                                                                                             Broader industry-relevant tertiary enrolments
300                                                                                                          have been declining in recent years, and recent
                                                                                                             data released by the Western Australian School
250                                                                                                          of Mines shows rapidly declining enrolments for
                                                                                                             mining engineers. Mining engineer enrolments
                                                                                                             have dropped each year for five consecutive years,
200                                                                                                          now plummeting to less than one-third of 2013
                                                                                                             enrolments.
150
                                                                                                             Some of the primary reasons for the decline in
                                                                                                             enrolments are:
100
                                                                                                             • Enduring negativity from past behaviours (job
 50
                                                                                                               cutting during the downturn, not addressing
                                                                                                               environmental impacts, challenging community
                                                                                                               relations, a lack of workforce diversity etc.)
   0
            2013                    2014                   2015            2016                2017   2018   • A general lack of awareness among students
                                                      Enrolments         Expon. (Enrolments)
                                                                                                               about the opportunities within the mining
                                                                                                               industry
Source: Curtin University. Enrolments are year to date at 17 July 2018
                                                                                                             • A view that this cyclical industry is tough on
                                                                                                               its workforce, particularly FIFO workers (e.g.
                                                                                                               physical and mental impacts on wellbeing,
                                                                                                               extended absence from friends and family).

                                                                                                                                              Aussie Mine 2018 | 15
There’s a new paradigm in workforce talent that         Get fitter for the fight for talent
needs to be addressed by mid-tier miners, which                                                                The top priorities mid-tier miners
appears to be proving difficult. Mid-tier miners        The MT50 should proactively showcase the
                                                                                                               should address in order to get fitter
are not simply competing against each other             benefits and opportunities that a career in mining
                                                                                                               for the fight for talent:
for top talent, rather, they’re up against a vast       presents. The sector is undergoing substantive
array of industries and much more appealing             and exciting change - and presents graduates           • Acknowledge that organisational culture
organisations such as the Googles of the world.         with huge opportunities to not only work with a          must align more closely with the values
As mining companies continue to invest and focus        myriad of new technologies (automation, robotics         of graduating millenials, and tailor
on innovation and digitisation, the demand for          and artificial intelligence), but positively impact      accordingly.
digitally skilled candidates will increase. And while   communities and the environment. As it stands,
traditional engineering roles will continue to remain   mining has a brand problem. And it’s not helping       • Modify existing recruitment strategies
relevant, the need for people who are competent         the war for talent. Remaining relevant to the future     and sources to meet the needs of a more
in AI, robotics, data analytics and mechatronics        workforce is a no-brainer ‘must-do’, particularly        digitally enabled mining company.
will be key for future fit mining organisations.        given the stiff competition.
                                                                                                               • Work towards an optimal balance and
The mining businesses of the future will see a          The real-world application of technology involved        interaction between the new workforce
convergence of perspectives between mining              in mining processes, and the positive social             and the experienced campaigners, who
engineers and newer-age digitally focused roles.        impact that miners can achieve when working              have seen the ups and downs before.
                                                        in unison with local communities doesn’t often
Recruiting senior talent – board                        receive the attention of social media channels.        • In light of fierce competition from global
                                                                                                                 peers, develop mentoring programs for
and senior executive diversity                          There are multiple workforce successes and good
                                                        news stories that mid-tier miners and industry           new recruits to foster high performers
to remain a challenge                                   bodies can use to actively promote to tomorrow’s         and loyalty. This will be particularly
                                                        workforce.                                               important when looking to improve
Role modelling senior female talent won’t come
                                                                                                                 gender equality, as the mid-tier will be
easily for the MT50 when looking to attract the
                                                                                                                 unable to ‘buy’ talent the way their global
next generation of workers. Despite a continuing
                                                                                                                 peers can.
focus on improving gender equality across
workplaces, the group has plenty of work to do.

Of the entire MT50, only Lynas Corporation has a
female chief executive/managing director currently
at the helm.

Things are slightly better in the boardroom. While
the number of male board members has remained
the same between 2018 and 2017 (at 259), the
representation of female board members has
increased from 30 to 40 (13%). This still remains
well below the comparative percentage in the top
40 companies reported in our global Mine series,
which shows a female board representation of
19%.

16 | PwC
Deals analysis and outlook
Deals rise in time of higher prices                      Key contributors to this year’s deal activity        PwC deals perspective –
                                                         include:
– have we seen this before?                                                                                   what will appeal in 2019?
The MT50 group has enjoyed strong commodity              • OZ Minerals – acquiring Avanco Resources           Gold – expect more global deals
prices and healthy balance sheets, driving significant     for $425 million, funded by cash, adding           Having enjoyed strong prices, strong demand,
appetite for deals in 2018. There has been a shift         further diversification to its operations          and favourable exchange rates, we’re expecting to
from 2017 where the group were divesting non-              by adding copper production and further            see an ongoing presence of M&A activity for gold
core assets to pay down debt and return equity to          exploration opportunities in Brazil                miners. The MT50 will be looking further abroad
shareholders. The volume of deals increased from 15      • Northern Star – completing its acquisition         for these opportunities, as seen with Northern
in 2017 to 21 this year. However, with quality assets      of the Pogo gold project in Alaska from            Star’s acquisition of the Pogo mine in Alaska.
harder to find and competition high, more bite-sized       Sumitomo Metal Mining, making their first
deals are being made as complementary additions to                                                            Lithium – can’t get enough!
                                                           move overseas                                      Demand is increasing for lithium, boosted by the
existing portfolios. The average value for completed
deals has decreased to $125 million, compared            • Tawana Resources – contributed to a $425           interest in electric vehicles. We’ve seen Galaxy
with $405 million in 2017 (or $185 million excluding       million merger of equals with its Bald Hill        Resources and Pilbara Minerals announce deals,
Yancoal’s $2.7 billion acquisition of Coal & Allied        lithium project joint venture partner Alliance     and we anticipate momentum to continue as
Industries).                                               Mineral Assets to consolidate the joint venture    offshore strategics look to secure access to high
                                                           and provide access to dual listings in Australia   quality resources, and local companies seek to
Gold continued to feature, with four acquisitions by       and Singapore                                      introduce partners to provide capital and offtake
Northern Star and Ramelius and one sale by Saracen.                                                           certainty.
We also saw four deals in iron ore and a few in other    • Hancock Prospecting – looking to bolster
metals including lithium and copper, with some of the      its iron ore interests as it announces an          Base metals – fuelling rising demand
group venturing overseas to secure these deals.            intention to acquire Atlas through compulsory      Copper demand will continue to play an active role
                                                           acquisition, currently estimated at a total        in M&A for 2019 as prices remain strong. We saw
                                                           transaction value of $444 million                  a number of copper deals in 2018, most notably
                                                                                                              OZ Minerals’ purchase of the Antas copper-gold
                                                         • Galaxy Resources – entering into a $373            mine and New Century Resources’ purchase of
                                                           million deal with Korean steel giant POSCO         the Century Mine Rehabilitation Project.
                                                           to sell lithium tenements in Argentina, and        Independence Group and Panoramic
                                                           pursuing other high-grade assets.                  Resources also have pending deals.

                                                                                                                                              Aussie Mine 2018 | 17
Completed M&A transactions greater than $15 million (July 2017 to September 2018)
                                                                             Ownership      Approximate deal   Announcement   Mid Tier 50
Target               Acquirer               Sector          Target Country                                                                         MT50 Role
                                                                             interest (%)   Value $AUDm        Date           Connection

Mt Holland Lithium   Sociedad Química y                                                                                       Kidman Resources
                                            Lithium         Australia        50             147                Jul-17                              Seller
Project              Minera de Chile S.A.                                                                                     Limited

King of the Hills                                                                                                             Saracen Mineral
                     Red 5 Limited          Gold            Australia        100            28                 Aug-17                              Seller
gold mine                                                                                                                     Holdings Ltd

Century Mine
                     New Century                                                                                              New Century
Rehabilitation                              Zinc            Australia        30             169                Oct-17                              Acquirer
                     Resources Ltd                                                                                            Resources Ltd
Project Pty Ltd

Dioro Exploration
Pty Ltd and HBJ
                     Northern Star                                                                                            Northern Star
Minerals Pty Ltd                            Gold            Australia        100            83                 Nov-17                              Acquirer
                     Resources Limited                                                                                        Resources Ltd
and Hampton Gold
Mining Areas Ltd.

Peak Gold Asia
                     Defiance Resources
Pacific                                 Gold/Copper/ Zinc   Australia        100            77                 Nov-17         Aurelia Metals Ltd   Acquirer
                     Pty Ltd
Pty Ltd

Avanco Resources
                     OZ Minerals Ltd        Copper gold     Brazil           100            425                Feb-18         OZ Minerals Ltd      Acquirer
Ltd

Watershed
Tungsten Project     Tungsten Mining NL     Tungsten        Australia        100            15                 Apr-18         Tungsten Mining NL Acquirer
(Vital Metals Ltd)

                     Round Oak                                                                                                Independence
Jaguar Operation                            Copper/Zinc     Australia        100            73                 May-18                              Seller
                     Minerals Pty Ltd                                                                                         Group

                     Fortescue Metals
Atlas Iron Ltd                              Iron Ore        Australia        15             56                 Jun-18         Atlas Iron Ltd       Seller
                     Group Ltd

                     Hancock
Atlas Iron Ltd                              Iron ore        Australia        11             49                 Jun-18         Atlas Iron Ltd       Seller
                     Prospecting Pty Ltd

Central Tanami       Northern Star                                                                                            Northern Star
                                            Gold            Australia        15             20                 Jul-18                              Acquirer
Project              Resources Ltd                                                                                            Resources Ltd

                     Golden Opportunity                                                                                       Northern Star
Pogo Gold Mine                              Gold            USA              100            357                Aug-18                              Acquirer
                     Ventures                                                                                                 Resources Ltd

Total                                                                                       1,499

18 | PwC
Pending M&A transactions greater than $15 million (July 2017 to September 2018)
                                                                             Ownership      Approximate deal   Announcement      Mid Tier 50
Target                     Acquirer              Sector     Target Country                                                                              MT50 Role
                                                                             interest (%)   Value $AUDm        Date              Connection

                           Black Mountain                                                                                        Panoramic
Cherish Metals Pty Ltd                           Nickel     Australia        100            15                 Sep-18                                   Seller
                           Metals LLC                                                                                            Resources Ltd

                           Ramelius Resources                                                                                    Ramelius Resources
Explaurum Ltd                                    Gold       Australia        100            57                 Sep-18                                   Acquirer
                           Limited                                                                                               Ltd

Southern Hills Tenements   Independence Group    Nickel/
                                                            Australia        70             21                 Mar-18            Independence Group     Acquirer
(Creasy Group Pty Ltd)     NL                    Copper

                           Hancock Prospecting
Atlas Iron Ltd                                   Iron Ore   Australia        80             444                Jun-18            Atlas Iron Ltd         Seller
                           Pty Ltd

                           Sandfire Resources
Talisman A Pty Ltd                               Energy     Australia        30             72                 Jun-18            Sandfire Resources     Acquirer
                           NL

Tenements in Salar del                                                                                                           Galaxy Resources
                           POSCO                 Lithium    Argentina        100            373                May-18                                   Seller
Hombre Muerto                                                                                                                    Ltd

                           Alliance Mineral
Tawana Resources NL                              Iron Ore   Australia        100            225                Mar-18            Tawana Resources       Seller
                           Assets Limited

Pilbara Minerals Ltd       POSCO                 Lithium    Australia        5              159                Oct-17            Pilbara Minerals Ltd   Seller

                           New Hope                                                                                              New Hope
Bengalla Coal Project                            Coal       Australia        40             860                Aug-18                                   Acquirer
                           Corporation Limited                                                                                   Corporation Limited

Total                                                                                       2,226

                                                                                                                 While the industry is well placed for
                                                                                                                 further M&A activity to deliver growth,
                                                                                                                 the risk of overpaying in times of rising
                                                                                                                 prices will occupy
                                                                                                                 the minds of mining executives.
                                                                                                                 Cashed up global miners, and the growing
                                                                                                                 presence of private equity firms in recent
                                                                                                                 Australian transactions have only heightened the
                                                                                                                 competition for quality assets.

                                                                                                                                                        Aussie Mine 2018 | 19
Financial analysis
Income statement                                      Aggregated Income statement ($m)             2018       2017       $ change   % change

                                                      Revenue from ordinary activities
analysis                                              Operating revenue                            21,986     19,389     2,597      13%
                                                      Non-operating revenue                        2          2          -          0%

Continued strength in prices                          Total revenue                                21,988     19,391     2,597      13%
                                                      Less expenses from ordinary activities       (11,524)   (10,517)   (1,007)    10%
We’ve seen a continued trend of improved
                                                      Gross profit                                 10,464     8,874      1,590      18%
commodity prices, particularly with coal. The
Australian price of thermal coal has been on the      Selling general and administrative expenses (2,127)     (1,916)    (211)      11%
rise since July 2017, increasing by 31% in the last   Exploration expenses                         (409)      (339)      (70)       21%
year. Infrastructure-driven growth in Asia (mainly    Provision for bad debts                      (4)        (6)        2          -33%
China) has resulted in above-average growth and       Stock based compensation                     (52)       (40)       (12)       30%
a continuing increase in demand for commodities
                                                      Other income/expenses                        (510)      (366)      (144)      39%
like coal. Gold prices continued to remain steady
amid global political and economic instability,       Adjusted EBITDA                              7,362      6,207      1,155      19%
while copper has recently lifted. The Australian      Depreciation and amortisation                (3,762)    (3,392)    (370)      11%
dollar’s relatively stable performance throughout     Adjusted EBIT                                3,600      2,815      785        28%
2018 has continued to help deliver higher             Impairments and writedowns                   (992)      (634)      (358)      56%
commodity prices to the MT50.
                                                      Other non-recurring items                    485        50         435        870%
                                                      EBITDA                                       6,855      5,623      1,232      22%
                                                      EBIT                                         3,093      2,231      862        39%
                                                      Interest income                              107        93         14         15%
                                                      Interest expense                             (455)      (597)      142        -24%
                                                      Other non-operating items                    35         (141)      176        125%
                                                      Profit from ordinary activities before tax   2,780      1,586      1,194      75%
                                                      Income tax (expense)/benefit                 (840)      (716)      (124)      17%
                                                      Net profit/(loss) from continuing
                                                                                                   1,940      870        1,070      123%
                                                      operations
                                                      Earnings of discontinued ops                 67         272        (205)      -75%
                                                      Minority interest in earnings                (3)        2          (5)        -250%
                                                      Net profit/(loss) to parent                  2,004      1,144      860        75%
                                                      Adjusted NPAT                                2,996      1,778      1,218      69%

                                                      Source: CAPIQ
20 | PwC
Revenue                                                               $ Revenue Growth by commodity (2018 v 2017)

Total mining revenue continued its recent rise in
2018, increasing a further 13% to $22 billion.                         600

Gold continues to be the lead contributor,
accounting for 53% of total MT50 revenue in                            500
2018. Gold miners continued to benefit from high
Australian dollar gold prices, which show no sign
of decline amid ongoing global political instability.                  400

Other key drivers of growth in operating revenue

                                                        AUD Million
were diversified metals, manganese and nickel.                         300
Only iron ore experienced a decrease in revenue
(3%), primarily due to slightly weaker realised
prices in 2018.                                                        200

Notable growth in 2018 included OM Holdings
as it restarted mining activity after being in care                    100

in maintenance with additional furnaces firing
up, and Independence Group lifting sales after
                                                                         0
commencing production at its Nova Operations in
July 2017.
                                                                      (100)
Similarly, gold companies benefited from                                        Gold   Diversified   Copper   Iron Ore   Mineral Sands   Coal   Lithium        Other
continuing high Australian gold prices and
production levels lifted to take advantage of
favourable conditions. Ramelius demonstrated
this when it acquired its Edna May operation,                         Source: CAPIQ

helping them achieve a 73% increase in revenue
through 2018.

                                                                                                                                                     Aussie Mine 2018 | 21
Impairment                                           Impairment as a % of capex (purchase of PPE + exploration)
Impairment charges increased unexpectedly by         120%
$358 million (56%) in 2018, from $634 million in
2017 to almost $1 billion this year. This comes
after a continued reduction in impairment charges    100%
since 2015. Closer inspection reveals that
33 MT50 companies recognised an impairment
charge of some sort, with 11 recognising              80%
impairment charges greater than $10 million.

The majority of impairment charges related to
                                                      60%
strategic decisions impacting tangible assets
from specific projects. Impairment reversals were
absent again among the group despite long-
term forecasts and mine plans benefiting from         40%

increased prices. Impairment as a proportion of
capex remains relatively low compared to the
peaks of 2013–2016, when collectively more than       20%
$13 billion was written off by the group.

Notable impairments recorded in 2018 include:          0%
                                                               2010   2011     2012    2013     2014     2015     2016   2017   2018   2019
• AngloGold Ashanti ($384 million) – specific
  mining assets in South Africa were written
                                                     Source: CAPIQ
  down due to changes in mine plans to
  restructure the South African operations, and
  the decision to sell certain assets

• Iluka Resources ($155 million) – following the
  idling of the Hamilton mineral separation plant
  in the Murray Basin

• New Hope ($132 million) – with the impairment
  of the Colton exploration project due to
  increased charges associated with access to
  the Wiggins Island Coal Export Terminal

• Atlas ($104 million) – relating primarily to its
  Horizon 1 Mining properties after rising costs
  and discounts to lower grade iron ore hit home

22 | PwC
EBITDA                                                MT50 EBIDTA by commodity

Consistent with 2017 we saw EBITDA increase in
2018, rising an impressive $1,232 million (22%).                                                                                                                      2018
                                                             Gold
The EBITDA margin of 31% continues the run                                                                                                                     2017
of near record highs for this measure in the past
                                                                                                   2018
two years. This is an impressive performance,              Copper
                                                                                               2017
especially considering two of the best performers
and largest EBITDA contributors from last year’s        Diversified
                                                                                                  2018
publication were Yancoal and Whitehaven.                                               2017

                                                                                           2018
While gold miners were the main contributors to               Coal
                                                                                    2017
total EBITDA, significant growth was achieved by
the coal and diversified miners. Coal benefited               Iron                     2018
from improved prices, which have increased                    Ore                         2017
significantly since January 2016 on the back of
                                                           Mineral                 2018
heightened demand for high-quality Australian coal          Sands               2017
within Asia.
                                                                         2018
                                                           Lithium
31 companies in the group reported a positive                           2017
EBITDA in the current year, marginally up from 30
                                                                 -500           0             500        1,000   1,500      2,000      2,500   3,000   3,500      4,000      4,500
in the prior year. Given the list has 35 producers,
this clearly demonstrates 2018 was a positive year                                                                       AUD Million
for earnings.
                                                      Source: CAPIQ

                                                                                                                                                           Aussie Mine 2018 | 23
Balance sheet analysis                              Aggregated Balance Sheet ($m)                            2018       2017    $ change   % change

                                                    Current assets
This year saw a 14% improvement in the net          Cash and cash equivalents                               6,292      5,278       1,014       19%
asset position of the group, a direct impact of     Inventories                                             3,764      3,383        381        11%
healthier free cash flows from higher prices        Receivables                                             1,816      1,394        422        30%
across our key commodities. Similar to 2017,        Other current assets                                    1,223        765        458        60%
there was a renewed focus in paying down more       Total current assets                                   13,095     10,820       2,275       21%
debt. 2018 also saw miners elect to improve their   Non-current assets
cash position while also reinvesting back into      Long-term investments                                   3,218      3,093        125         4%
their businesses, with capital expenditure levels   Property, plant and equipment                          25,890     24,523       1,367        6%
increasing.                                         Accounts receivable                                          3        79        (76)      -96%
                                                    Loans receivable                                           42         85        (43)      -51%
                                                    Deferred tax assets                                       868        684        184        27%
                                                    Other intangibles                                         130        380       (250)      -66%
                                                    Goodwill                                                  182        209        (27)      -13%
                                                    Other non-current assets                                1,560      1,424        136        10%
                                                    Total non-current assets                               31,893     30,477       1,416        5%
                                                    Total assets                                           44,988     41,297       3,691        9%
                                                    Current liabilities
                                                    Accounts payable & accrued liabilities                  3,147      2,720        427        16%
                                                    Interest-bearing liabilities (short-term borrowings)      691      1,325       (634)      -48%
                                                    Income tax payable, current                               497        421         76        18%
                                                    Unearned revenue, current                                  32        396       (364)      -92%
                                                    Other current liabilities                                 824        433        391        90%
                                                    Total current liabilities                               5,191      5,295       (104)       -2%
                                                    Non-current liabilities
                                                    Long-term debt                                          5,513      5,700       (187)       -3%
                                                    Capital leases                                            176        154         22        14%
                                                    Unearned revenue, non-current                              17         16          1         6%
                                                    Deferred tax liability, non-current                     1,667      1,664          3         0%
                                                    Other non-current liabilities                           3,955      3,549        406        11%
                                                    Total non-current liabilities                          11,328     11,083        245         2%
                                                    Total liabilities                                      16,519     16,378        141         1%
                                                    Net assets                                             28,469     24,919      3,550        14%
                                                    Equity
                                                    Share capital and premium                              37,819     36,256      1,563         4%
                                                    Retained earnings (accumulated loss)                   (8,612)   (10,466)     1,854       -18%
                                                    Other equity                                            (738)       (871)       133       -15%
                                                    Total equity                                           28,469     24,919      3,550        14%
                                                    Source: CAPIQ
24 | PwC
The war chest continues to                                 MT50 Cash Balances
grow...                                                              $8,000

Cash balances have increased 19% across the                          $7,000
group, with lithium, coal and diversified miners
leading the way. Cash balances are now at levels
                                                                     $6,000
not seen since 2012, indicating the collective
balance sheet is continuing to go from strength to
                                                                     $5,000
strength – a sign of the times for the industry as a

                                                       AUD Million
whole.
                                                                     $4,000
A suite of options are available to the group, from
strategic mergers and acquisitions, to retiring debt                 $3,000
and delivering dividends. And so, the question
remains: how should excess cash be used?                             $2,000

                                                                     $1,000
   One thing is for certain –
   shareholders will grow impatient
                                                                        $0
   unless companies clearly articulate                                             2012   2013      2014   2015       2016   2017          2018
   their plans and strategy for capital
   allocation.                                              Source: CAPIQ

                                                              Commodity                     2018              2017                  %

                                                                        Gold                2,287             2,145                 7%

                                                                        Copper              973               782                   24%

                                                                        Iron ore            772               932                   -17%

                                                                        Lithium             744               207                   259%

                                                                        Coal                351               237                   48%

                                                                        Diversified         422               228                   85%

                                                              Other                         737               747                   -1%

                                                              Total                         6,292             5,278                 19%

                                                          Source: CAPIQ

                                                                                                                                           Aussie Mine 2018 | 25
Getting the house in order –                             Index: Gearing ratio
                                                         70%                                                                                                                                   Mid tier 50 Aussie
gearing levels plummet                                                                                                                                                                         miners
                                                         60%
Total debt fell by 12%, with only a few miners                                                                                                                                                 Top 40 global
opting to repay more than they did in 2017. This                                                                                                                                               miners
                                                         50%
indicates gearing may have hit desired levels. In
a change of pace from recent years, gold miners          40%
retired less debt in 2018 when compared to 2017
(total repaid $1,303 million – down 39% from prior       30%

year), while repayments from iron ore miners grew        20%
($16 million – up 93% from prior year).
                                                         10%
With interest rates expected to shift upwards in the
near future, and increased caution from lenders            0%

due to uncertain economic times ahead, the
                                                         (10%)
MT50 heeded the warning on gearing levels. With
cash rising and debt continuing to be paid down,         (20%)
gearing levels have dropped drastically.                      2007      2008      2009        2010     2011     2012       2013    2014          2015     2016      2017        2018

Juniors leading the charge in                            Source: CAPIQ

maximising capital return
                                                         Capital velocity compared to capital expenditure by commodity
Capital velocity, a proxy for measuring the growth
                                                         25%                                                                                                                           4,000
agenda of organisations in capital intensive
                                                                                                          23%
industries, shows how hard capital assets are                           22%
                                                                                                                                                                                       3,500
working to produce revenue as well as serving as         20%                21%
a proxy measure of the growth agenda for capital                                         19%                                                                                           3,000
intensive industries like mining. It’s continued to
                                                                                                      16%
improve in the MT50, with coal, diversified, and         15%
                                                                                                                                                                                       2,500

iron ore miners significantly lifting their investment
                                                                                                                                                                                       2,000
in 2018. Lithium and graphite also occupy high-                                                                         10%                11%                             11%
capital velocity statistics, demonstrating the           10%
                                                                                                                                           9%                                          1,500
                                                                                     10%                                10%
growth in these sectors, although copper has
                                                                                                                                                                           7%
surprisingly remained static despite improved                                                                                                              6%                          1,000
                                                          5%
market conditions.                                                                                                                                         4%
                                                                                                                                                                                       500

                                                          0%
                                                                     Gold          Iron Ore          Lithium      Diversified      Copper               Coal           Other

                                                                       Capital expenditure $m (2018)             Capital Velocity (2018)                 Capital Velocity (2017)

                                                         Source: CAPIQ

26 | PwC
Debt remains the capital source                           Debt v Equity MT50
of choice                                                 $5,000

Access to capital to fuel growth ambitions remains        $4,500
a prominent focus for the group, and 2018 saw
continued strong trends in both debt and equity           $4,000

raisings. Debt continued to be the capital source         $3,500
of choice – particularly with gold miners – with
$2,243 million of capital raised, down slightly from      $3,000

the $2,262 million raised in the prior year. In 2018,
                                                          $2,500
$1,525 million of equity was raised (up 14% from
the prior year), buoyed by the positive sentiment.        $2,000
It was, however, equity that was favoured by the
group’s growing number of diversified and lithium         $1,500

miners – a trend that’s continued from 2017.
                                                          $1,000

For a mining company, a key determining factor in          $500
the decision to raise debt versus equity is the stage
of a project’s mine life.                                    $0
                                                                     2009   2010   2011   2012    2013   2014      2015   2016   2017   2018

For projects in development stages, the split                                                    Debt     Equity
becomes more even, with 57% through debt and              Source: CAPIQ
43% through equity. For projects in pre-production
or exploration stages, there’s a swing back towards
equity, with 8% of capital being raised through debt
and 92% through equity. This reflects the additional
risk inherent at this stage, and also the willingness
of investors to support new projects.

Although capital raising was mainly focused on
advancing existing projects and maintaining
working capital, there was a deals focus
among some of the group. These include Base
Resources, which used equity to raise $100
million of capital for their acquisition of the Toliara
Sands Project, and Aurelia Metals, which used a
combination of debt and equity to raise capital for
its acquisition of Peak Mines.

                                                                                                                                               Aussie Mine 2018 | 27
Cash flow analysis
 Aggregated ($m)                                         2018      2017    $ change    % change

 Cash flows generated from operations
 Net income                                             2,003     1,142         861        75%
 Change in accounts receivable                           (413)     (289)       (124)       43%
 Change in inventories                                   (484)     (371)       (113)       30%
 Change in accounts payable                               494       170         324       191%
 Change in deferred taxes                                 108       (16)        124      -775%
 Change in other net operating assets                     (10)      (63)         53       -84%
 Income taxes (paid)/refunded                             (69)      (34)        (35)      103%
 Other                                                  4,665     4,592          73         2%
 Cash generated from operations                         6,294     5,131       1,163        23%
 Cash flows related to investing activities
 Capital expenditure                                   (5,739)   (4,350)     (1,389)       32%
 Proceeds from sale of property, plant and equipment       71        57          14        25%
Cash acquisitions                                        (117)     (383)        266       -69%
Divestitures                                               24         2          22      1100%
Purchases of investments and intangibles                 (173)     (126)        (47)       37%
Other investing activities                                  1       (67)         68      -101%
Net investing cash flows                               (5,933)   (4,867)     (1,066)       22%
Cash flows related to financing activities
Debt issued                                             2,243     2,262         (19)       -1%
Debt repaid                                            (2,269)   (2,722)        453       -17%
Proceeds from share issues                              1,525     1,335         190        14%
Stock repurchases                                        (112)      (42)        (70)      167%
Ordinary dividends paid                                  (639)     (482)       (157)       33%
Special dividends paid                                       -      (18)         18      -100%
Other financing activities                                (95)     (355)        260       -73%
Net financing cash flows                                  653       (22)        675     -3068%
Net increase/(decrease) in cash                         1,014       242         772       319%

Source: CAPIQ

28 | PwC
Operating cash flows                                    Top five increases in operating cash flows   Commodity              2018               2017             Change ($m)
boosted again
                                                        Iluka Resources Limited                         Mineral Sands       414                128              285
Cash flows from operations continues to reflect
strong growth, with a 23% increase providing                                                            Diversified
                                                        Independence Group NL                                               278                78               200
greater flexibility for the MT50 to pursue different
options with capital allocation.                                                                        Precious Metals
                                                        Zimplats Holdings Limited                                           264                73               191
Iluka had a standout year in this regard, reaping
                                                        OceanaGold Corporation                          Gold                458                321              137
the benefits of higher prices with a staggering
222% increase in operating cash flows. Diversified
companies also performed strongly, with a 180%          New Hope Corporation Limited                    Coal                418                285              133
increase in operating cash flows. Independence
Group had the most significant increase, driven
by its Nova operation in Western Australia, which      The biggest spender in 2018 was AngloGold                        Type of capital expenditure
achieved commercial production in July 2017.           Ashanti, with a substantial investment ($1.1
Zimplats also joined the list of high performers       billion) aimed at improving mine life and margins
this year, recording an increase of $191 million       across existing operations. Similarly, Alacer Gold
driven by higher metal prices, despite reduced         invested significantly, tipping $440 million into an
production.                                            expansion project for its existing mine in Turkey.                                                34%

Gold producers continue to dominate the MT50,          Investment in property, plant and equipment
                                                       (PP&E) across the MT50 also increased, by 11%                                    2018
representing more than half (52%) of aggregated                                                                           56%
operating cash flows, however only OceanaGold          to $1.9 billion. This raises the question of whether
from this cohort made it into the ‘Top five            companies are exercising caution and spending
increases in operating cash flows’ followed by         to sustain and manage current operations, rather
New Hope Corporation, both benefiting from             than thinking of the bigger picture and unlocking                                             12%
                                                       the next level of growth through investing in the                                                              Payment for PPE
increased production and price.
                                                       future.                                                                                                        Payment for E&E

Capital expenditure –                                  Exploration continued to take a back seat, only                                                                Payment for
                                                       representing 12% of total capital expenditure.
‘approach with caution’?                               Is the MT50 investing enough for future supply?
                                                                                                                                                                      Assets
                                                                                                                                                                      in Development &
                                                                                                                                                      24%             Production
With the return of optimism in the industry,           Interestingly, it’s the group’s four diversified
and continued improvement in operating cash            miners that are ramping up exploration activities,
flows, we expected to see increased investment         with an increased spend of 28%, while gold
focused on the future. The heavy investment            miners seem to be focused on investing in current                                2017
in mine development suggests companies are             operations, with an 8% decrease in capitalised                     65%
following through, though it seems an element of                                                                                                         14%
                                                       exploration spending.
conservatism is at play with a significant focus on
existing operations.

                                                                                                                                  Source: PwC Analysis
                                                                                                                                                               Aussie Mine 2018 | 29
An end to gold high grading?                            Dividends
Replacing reserves and extending mine life is still a   AUD Million
key focus for gold miners. Collectively, over a two-
                                                        300
year period to 2018, total resources and reserves                     276
have been maintained, while average grade has
decreased by more than 20%. Are levels being            250
replenished by low grades at higher mining costs?
With exploration expenditures decreasing, a
question remains on whether enough has been             200
                                                                                   185
invested in finding tomorrow’s new mines rather
than harvesting what’s in front of us.
                                                        150                                                                                            142
                                                                                                                                         130
                                                                                                                           124
More companies sharing
                                                                                                        93
returns                                                 100
                                                                                                                      83
                                                                                                                                    73
It’s been a couple of good years for shareholders
in the MT50, with a 33% increase in dividend              50

payments, following a 41% increase last year.                                            16       18
An additional five companies joined the fold of
                                                           0
those prioritising shareholder returns - the total                          Gold         Diversified         Copper          Iron Ore          Other
number of dividend-paying companies up to 16.
Unsurprisingly, all dividend-paying companies
were producers.                                                2018            2017

Iron ore companies increased dividend payments          Source: PwC Analysis

by 70% despite their relatively muted performance
in 2018, while gold companies lifted dividend
payments by almost 50%.
                                                           A trend is emerging among the
More than half of producing companies within               MT50; capital expenditure is
the group are not paying dividends. Aurelia                focused on current operations
Metals was amongst this cohort and chose to use            rather than new projects.
available funds for capital expenditure and the
acquisition of Peak Mines.                                 Investment in new operations and mines
                                                           is particularly challenging – but, without
Similarly Alacer Gold continues to invest funds            it, future supply challenges will be
into the construction of its Sulfide project.              exacerbated.

30 | PwC
Voluntary reporting and trends
                                               Voluntary reporting across the MT50
Increased market                                                                                                                                                              12

capitalisation
demands voluntary                                                                                                                                                             10

reporting

                                                                                                                                                                                   No. of companies reporting
No one industry is immune from concerns                                                                                                                                        8
around trust. Corporate responsibility
continues to rise to prominence and the
                                                                                                                                                                               6
pressure is mounting on the MT50 for
voluntary reporting in its various forms.
                                                                                                                                                                               4
There’s a clear pattern that as companies
get larger and climb higher up (and graduate
from) the list, the need for them to report                                                                                                                                    2
on myriad issues shifts from being a ‘non-
essential’ to ‘expected’.
                                                                                                                                                                               0
                                                    41-50                31-40                    21-30               11-20              1-10                Top > $5B
                                                                                                                                                         (outside the MT50)
                                                                                                      MT50 ranking

                                                              Sustainability Reporting                    ATO Results Release                   TTC Reporting
                                                              Linear (Sustainability Reporting)           Linear (ATO Results Release)          Linear (TTC Reporting)

                                               Source: CAPIQ and PwC Analysis

                                                                                                                                                           Aussie Mine 2018 | 31
Sustainability reporting                                  The capital intensive nature of mining often results   If there’s a change of government, the Labor Party
                                                                                                                 has publicly endorsed further tax transparency
                                                          in vast and legitimate discrepancies between the
Although sustainability reporting is not a new            three data points published.                           reform, with measures including public disclosure
phenomenon, the meaning of sustainability                                                                        of: transfer pricing reporting lodged by SGEs;
varies across companies, with many aspects                With the ATO’s 2017 data release expected              company dealings in any known or suspected
considered beyond environmental. Of the MT50,             shortly, the time delay between tax year end and       tax havens; and the number and size of tax
21 companies currently prepare reports, with eight        public release is also of significance and can         settlements above a value of $50 million,
of the top 10 members reporting. This is in stark         potentially create noise when historical attributes    estimated at approximately 8 settlements per year.
contrast to voluntary reporting under the Australian      are compared to current performance.
Taxation Office’s Tax Transparency Code (TTC),
with only four companies preparing reports.               For members of the MT50 with Australian turnover
                                                          above $250 million, broadly defined as the ‘Top           The future role of
                                                          1000’ largest taxpayers in Australia, additional
The push for tax transparency                             disclosure and compliance requirements now                tax transparency
Australia is among a number of countries pushing          apply. The Reportable Tax Position (RTP)                  The tax transparency tide is only
global tax transparency initiatives.                      schedule must be lodged with the company’s                set to rise, as the tensions between public,
                                                          income tax return each year, where any material           government and corporates flare and trust is
The MT50 companies face increased pressure to             and contestable tax positions must be disclosed.          called into question.
provide “justified trust” to regulators- and to the       The Top 1000 Streamlined Assurance Review
public at large - they’re paying their ‘fair share’.      (SAR) is also underway, whereby taxpayers face a          Tax has become an integral component to
                                                          multi-year review of their income tax affairs.            a company’s social license to operate, with
In December 2017, the ATO released its third                                                                        proactive stakeholder engagement a must.
corporate tax transparency report which revealed          Requirements further increase for the five
total accounting income, taxable income and               members of the group that are Significant Global          Comparable to the beginning of
income tax payable of companies that have                 Entities (SGEs) based on global turnover in               environmental reporting decades ago,
Australian turnover of $100m or more based on             excess of A$1b. SGEs are required to prepare              the MT50 must adapt to new community
2016 tax return information. 19 companies in              general purpose financial statements, subject             standards.
the MT50 had their 2016 information published             to dramatically increased penalties for non-
and the raw numbers do little to explain in any           compliance or late lodgements, increased transfer
informed way whether the MT50 are in fact                 pricing reporting and specifically targeted anti-
paying their ‘fair share’, if in fact such an objective   avoidance rules.
concept of fairness is universally agreed. Despite
the group operating net accounting losses from            This mounting pressure on the MT50 is expected
2014 to 2016, tax was payable by the MT50 in              to continue, with Australia an official supporter
each year, highlighting that the data mandatorily         of the Extractive Industry Transparency Initiative
disclosed to the public does little to bridge the gap     (EITI) since 2006 with plans for domestic
between accounting income and tax payable.                implementation.
What has become evident is that a company
needs to have a clear narrative to communicate
the inputs that result in the output headline data.

32 | PwC
Explanatory notes and key contributors
We have analysed the largest 50 mining               All figures in this publication are reported in
companies listed on the ASX with a market            Australian dollars, except where specifically
capitalisation of less than $5 billion at 30 June    stated. The results of companies that report in
2018. The results aggregated in this report have     currencies other than the Australian dollar have
been sourced from publicly available information,    been translated at the average Australian dollar
primarily annual reports and financial reports       exchange rate for the financial year, with balance
available to shareholders. Companies have            sheet items translated at the closing Australian
different year-ends and report under different       dollar exchange rate. Some diversified companies
accounting policies. Information has been            undertake part of their activities outside of the
aggregated for the financial years of individual     mining industry. Unless specifically stated, no
companies, and no adjustments have been              adjustments have been made to exclude such
made to take into account different reporting        non-mining activities from the aggregated financial
requirements and year-ends. As such, the financial   information.
information shown for 2018 covers periods
between 1 January 2017 and 30 June 2018, with
each company’s results included for the 12-month
financial reporting period that falls into this
timeframe.

                                                                                                           Aussie Mine 2018 | 33
Our 2018 writing team
                        Left to right:
                        Laura Gollant
                        Accountant – Tax, Melbourne
                        Martin Claassen
                        Manager – Assurance, Sydney
                        Madeleine Jarvis
                        Manager – Assurance, Adelaide
                        Anthony Hodge
                        Partner – Assurance, Melbourne
                        Dima Malkin
                        Senior Accountant – Assurance, Melbourne
                        Matthew Kinna
                        Senior Accountant – Assurance, Perth
                        Aliza Syed
                        Manager – Assurance, Melbourne

                        Not pictured:
                        Matt McKee
                        Director – Consulting, Brisbane

                           Acknowledgement
                           We would like to thank the following PwC
                           team members who have made a significant
                           contribution to the development of this
                           publication:

                           •   Stevie Pitcher
                           •   Deena Hooper

34 | PwC
You can also read