London's Economic Outlook: Spring 2018 The GLA's medium-term planning projections
←
→
Page content transcription
If your browser does not render page correctly, please read the page content below

London's Economic Outlook: Spring 2018
The GLA's medium-term planning projections

May 2018
London's Economic Outlook: Spring 2018
                                                                            The GLA's medium-term planning projections

copyright
Greater London Authority
May 2018

Published by
Greater London Authority
City Hall
The Queens Walk
London SE1 2AA

www.london.gov.uk
Tel 020 7983 4922

Minicom 020 7983 4000

ISBN 978-1-84781-693-1

Cover photograph

© Shutterstock

For more information about this publication, please contact:

GLA Economics

Tel 020 7983 4922

Email glaeconomics@london.gov.uk

GLA Economics provides expert advice and analysis on London’s economy and the economic issues facing
the capital. Data and analysis from GLA Economics form a basis for the policy and investment decisions
facing the Mayor of London and the GLA group. GLA Economics uses a wide range of information and data
sourced from third party suppliers within its analysis and reports. GLA Economics cannot be held responsible
for the accuracy or timeliness of this information and data. The GLA will not be liable for any losses suffered
or liabilities incurred by a party as a result of that party relying in any way on the information contained in
this report.
London's Economic Outlook: Spring 2018
The GLA's medium-term planning projections
Contents
1. Executive summary .................................................................................................................. 2
2. Introduction ............................................................................................................................ 7
3. Economic background: Positive momentum in London’s economy amidst mixed signs for the
UK ............................................................................................................................................... 8
4. Review of independent forecasts........................................................................................... 33
5. The GLA Economics forecast ................................................................................................. 39
Appendix A: Explanation of terms and some sources ................................................................. 50
Appendix B: Glossary of acronyms ............................................................................................. 51
Appendix C: Bibliography .......................................................................................................... 52
GLA Economics 1London's Economic Outlook: Spring 2018
The GLA's medium-term planning projections
1. Executive summary
GLA Economics’ 32nd London forecast1 suggests that:
• London’s Gross Value Added (GVA) growth rate is forecast to be 1.6 per cent in 2018. The
growth rate is expected to rise slightly to 1.9 per cent in 2019, before reaching 2.2 per cent
in 2020.
• London is forecast to see increases in the number of workforce jobs in 2018, 2019 and
2020.
• London’s household income and spending are both forecast to increase over the next three
years, albeit at a relatively slow rate.
Table 1.1 summarises this report’s forecasts and provides an average of independent forecasts.
Table 1.1: Summary of forecasts
Annual growth rates (per cent) 20172 2018 2019 2020
London GVA3 (constant prices) 1.4 1.6 1.9 2.2
Consensus (average of independent forecasts) 1.8 1.9 2.0
London civilian workforce jobs 1.3 0.6 0.3 0.7
Consensus (average of independent forecasts) 0.8 0.9 1.0
London household spending (constant prices) 1.5 1.3 1.3 1.2
Consensus (average of independent forecasts) 1.6 1.7 2.1
London household income (constant prices) 0.5 1.6 1.4 1.5
Memo: Projected UK RPI4 (Inflation rate) 3.6 3.4 3.0 3.0
Projected UK CPI5 (Inflation rate) 2.7 2.5 2.1 2.0
Sources: GLA Economics’ Spring 2018 forecast and consensus calculated by GLA Economics
1
The forecast is based on an in-house model built by GLA Economics. For more detail, see: Douglass, G & van Lohuizen, A
(2016). ‘The historic performance of the GLA's medium-term economic forecast model’, GLA Economics Current Issues Note 49,
November 2016.
2
Historic data for London GVA and workforce jobs is based on GLA Economics ‘now-casting’ estimates, while household
spending and household income is based on Experian Economics data. It should be noted that the 2016 figures for London GVA
and civilian workforce jobs are estimates.
3
The methodology used to estimate London’s GVA is outlined in Keijonen, M & van Lohuizen, A (2016). ‘Modelling real
quarterly GVA data for London’, GLA Economics Current Issues Note 50, December 2016.
4
RPI = Retail Price Index. Although not part of the GLA Economics forecast for London. Instead the consensus forecasts
provided by HM Treasury are reported here. See: HM Treasury (2018). ‘Forecasts for the UK economy: a comparison of
independent forecasts’, May 2018.
5
CPI = Consumer Price Index. Although not part of the GLA Economics forecast for London. Instead the consensus forecasts
provided by HM Treasury are reported here. See: HM Treasury (2018). ‘Forecasts for the UK economy: a comparison of
independent forecasts’, May 2018. Also, since December 2003, the Bank of England’s symmetrical inflation target has been
annual CPI inflation at 2 per cent.
GLA Economics 2London's Economic Outlook: Spring 2018
The GLA's medium-term planning projections
There is now less than a year before the end of the Article 50 procedure for the UK to leave the
European Union (EU) with a transition period expected to last from 29 March 2019 to 31
December 2020. The three subsequent London’s Economic Outlook’s (LEO)6, 7, 8 since the June
2016 referendum result have examined London’s position given this vote in detail. However, at
the time of writing, although progress has been made in the talks, uncertainty about the UK’s
future relationship with the EU remains. Box 3.1 in Chapter 3 of this forecast summarises what
has occurred in the Brexit process since the publication of the Autumn 2017 LEO.
Still, the UK currently remains part of the EU and beyond the large depreciation of sterling seen
in the aftermath of the vote, the economic shock of the decision has been more muted than
some expected in the run up to the referendum. However, several economic indicators remain
weaker than they were at the beginning of 2016. While most of these indicators show an
ongoing expansion of London’s economy, they also indicate slower growth than that seen in the
early years of the decade. This moderation in growth is also seen at the UK level. For example,
the Bank of England’s agents found in the first quarter of 2018 that “growth in retail sales
values had slowed, reflecting weaker spending on white goods and homewares. This was
potentially associated with subdued housing market activity, consumers bringing forward
spending to the Black Friday sales in November, and the continued squeeze on household
incomes”9. While in their latest update on business conditions they noted, “business services
growth remained moderate. There was a slight pickup in insolvency and restructuring work,
robust growth in asset management and firm demand for IT services. However, discretionary
spending by corporates, e.g. on events and hospitality, remained weak”10. And “investment
intentions remained modest, reflecting continued uncertainty around Brexit”11.
In terms of credit conditions, the Bank noted that “demand for secured lending for house
purchase was reported to have decreased significantly in Q1, driven by a fall in demand for both
prime and buy-to-let lending, but lenders expected a marked pick-up in demand in Q2. Lenders
reported that household demand for secured lending for re-mortgaging also decreased
significantly in Q1, but expected demand to pick-up again markedly in Q2”. Adding that,
“overall demand for unsecured lending was reported to have decreased in Q1. Within this, there
was a significant decrease in demand for credit card lending but an increase in demand for other
unsecured lending. Lenders expected this to reverse in the next quarter, anticipating an increase
in credit card lending alongside a decrease in other unsecured lending”. However, they further
observed that “lenders reported no change in demand for corporate lending from businesses of
all sizes. Lenders expected an increase in demand from medium-sized business[es] alongside a
slight increase in demand from large businesses in Q2, while demand from small businesses was
expected to remain unchanged”12. In London, having been positive for most of the post
referendum period, consumer confidence has recently turned negative on a month-on-month
basis. It is, however, in line with its long-run average and also above the UK average which, has
6
GLA Economics (2016). ‘London's Economic Outlook: Autumn 2016 The GLA's medium-term planning projections’, November
2016.
7
GLA Economics (2017). ‘London's Economic Outlook: Spring 2017 The GLA's medium-term planning projections’, June 2017.
8
GLA Economics (2017). ‘London's Economic Outlook: Autumn 2017 The GLA's medium-term planning projections’, November
2017.
9
Bank of England (2018). ‘Agents’ summary of business conditions, and results from the Decision Maker Panel 2018 Q1’, 28
March 2018.
10
Bank of England (2018). ‘Agents’ summary of business conditions: May 2018 Update’, 17 May 2018.
11
Ibid.
12
Bank of England (2018). ‘Credit Conditions Survey’, Q1 2018, 12 April 2018.
GLA Economics 3London's Economic Outlook: Spring 2018
The GLA's medium-term planning projections
been negative for most of the post referendum period13. Companies in London also show
growth in business activity as measured by the Purchasing Managers’ Index, having bounced
back from their post-referendum fall, but this growth remains at a more subdued level14.
Statistics from the Office for National Statistics (ONS) show that the UK economy continues to
grow but at a subdued pace at the beginning of the year, with output increasing by 0.1% in Q1
2018 compared to the previous quarter. This was significantly lower than the 0.4% quarterly
growth rate seen in Q4 2017. Output in Q1 2018 was 1.2% higher than a year earlier with UK
GDP recording the lowest year-on-year growth seen since 201215.
Meanwhile, inflation – having risen due in part to the large depreciation of sterling after the
referendum – continues to stand above the Bank of England’s central symmetrical inflation
target although it has fallen back from its recent highs. Consumer Prices Index (CPI) inflation
stood at 2.4% in April 2018, down from 2.5% seen in March 201816. Although inflation has
receded a touch from the highs seen in previous months the Bank of England still needs to
juggle policy between economic growth and inflation. Thus, although the Bank has not raised
rates since November 2017, further rises are still being factored in by most commentators. That
said, even if the expectations of further monetary policy tightening occur, it is likely to remain
extremely accommodating for some time to come. The Bank has thus observed in their May
2018 Inflation Report that the best collective judgment of the members of the Monetary Policy
Committee (MPC) was “that, were the economy to develop broadly in line with the May
Inflation Report projections, an ongoing tightening of monetary policy over the forecast period
would be appropriate to return inflation sustainably to its target at a conventional horizon. As
previously, however, that judgement relies on the economic data evolving broadly in line with
the Committee’s projections”17. The MPC however further noted that “all members agree that
any future increases in Bank Rate are likely to be at a gradual pace and to a limited extent”18.
The growth in workforce jobs in London has continued and at a faster rate than that seen in the
UK as well. Thus, in London, the number of jobs increased to 5.863 million in Q4 2017, a
98,000 (1.7%) increase from a year earlier19 and a new record-high for this series which began in
1996. The employment rate in London stood at 75.2% in the three months to March 2018, a
record high. However, real wages in the UK, have only recently begun to rise again and at a very
marginal rate20. With inflation remaining above target but with employment standing at record
levels there is speculation in both directions as to the future course of real earnings.
Risks to the economy have maybe risen a touch since November 2017, but the main risk remains
associated with the ongoing uncertainty around the impact of Brexit. Other risks remain
relatively subdued although the prospect of interruptions to global trade due to a trade war has
risen compared to the position seen at the end of 2017. And related to this the increased
protectionist sentiment in the US in and of itself is a risk to global growth. Still, as noted, the
economic drag from the referendum outcome and Brexit process has so far been generally more
modest compared to that anticipated by many prior to the vote. However, the ongoing
uncertainty about long-term future trading arrangements for the UK appears – according to
13
Orellana, E. & Wingham, M. (2018). ‘London’s Economy Today’, Issue 188, 26 April 2018.
14
Ibid.
15
ONS (2018). ‘Second estimate of GDP: January to March 2018’, 25 May 2018.
16
ONS (2018). ‘Consumer price inflation, UK: April 2018’, 23 May 2018.
17
Bank of England (2018). ‘Inflation Report’, May 2018.
18
Ibid.
19
ONS Regional labour market statistics.
20
ONS (2018). ‘Analysis of real earnings and contributions to nominal earnings growth, Great Britain: April 2018’, 17 April 2018.
GLA Economics 4London's Economic Outlook: Spring 2018
The GLA's medium-term planning projections
some business surveys – to have dampened business sentiment. Finally, as observed in all
published LEOs since the Brexit vote, it should be noted that the longer-term impact of the vote
remains hard to model with competing claims made by a variety of commentators. In fact, the
exact long-term growth prospects will likely be highly dependent on what post Brexit economic
relationships and policies are followed.
Other risks to the economy persist. Thus, although there has been some evidence of a recent
improvement21, the slow growth in recent years of UK productivity if it generally continued in
the long-term, as some forecasters think may be the case, will act as a dampener on GDP
growth. The size of UK consumer credit growth and the ability of lenders to absorb any losses
associated with it in an economic shock have also been expressed22.
As has been highlighted over many years now, structural problems remain in the Eurozone and
could reappear to cause further problems for its members. All these are concerns due to the
impact they could have on the UK and London’s trade and therefore growth. Still, despite these
risks, the prospects for the Eurozone in the near term remain relatively upbeat compared to the
situation seen in the first half of the decade.
Beyond the risk of a trade war global growth has remained relatively robust, however the high
debt levels seen in China continue to be a concern for the economic stability of that country in
the longer run and therefore in terms of potential knock-on impacts on the global economy.
And the disruptive effects on the world economy of an intensification of the current regional
conflicts cannot be discounted.
Monetary policy continues to return to more historically normal levels in the United States with
this having the potential for some negative knock on effects. This could be especially
destabilising if differing stages in various countries monetary policy cycle interact to exacerbate
the effect. However, although the tightening in US monetary policy continues, it may take some
time yet to return fully to a more historically normal monetary policy regime.
To summarise, the economic environment continues to be relatively uncertain at the UK and
London levels, but despite this the outlook for the London economy remains one of expected
growth for the coming few years. While above the Bank’s target rate, inflation is moderate but
could stay above target due to the ongoing feed through of the inflationary impact of the
recent depreciation of sterling. Given somewhat high inflation, it is possible that growth in real
income will be a touch subdued in the coming few years and this puts some restraint on
household spending which had been a significant driver of economic growth until recently. Still,
despite speculation of further tightening in the coming years, UK monetary policy is likely to
stay at what are historically very accommodating levels for a time to come, providing support to
the national and London economies. Most business surveys continue to show growth and
sterling remains low although London consumers’ confidence about the short-term future
economic outlook has weakened recently. Fiscal policy also appears to be moving in a touch
more expansionary direction. Of the sectors of the UK economy, Business services and finance
continue to grow (albeit at a slightly subdued rate) and given its size in London should continue
to provide some foundation to London’s economic growth. Overall, balancing all these factors
acting on London’s economy, it is likely that both output (see Figure 1.1) and employment (see
21
ONS (2018). ‘Labour productivity, UK: October to December 2017’. April 2018.
22
Bank of England (2017). ‘Financial Stability Report’, November 2017.
GLA Economics 5London's Economic Outlook: Spring 2018
The GLA's medium-term planning projections
Figure 1.2) should see continued growth in the next few years but at a rate that is more
subdued than seen earlier this decade.
Figure 1.1: Trend and forecast output growth
10%
8%
6%
Annual change in real GVA
4%
2%
0%
-2%
Forecast
History
-4%
-6%
Range of independent forecasts GLA Economics Forecast History
Source: GLA Economics estimates for historic data and GLA Economics’ calculations for forecast
Figure 1.2: Trend and forecast employment growth
6%
5%
Annual change in workforce jobs
4%
3%
2%
1%
0%
Forecast
-1%
History
-2%
-3%
Range of independent forecasts GLA Economics forecast History
Source: GLA Economics estimates for historic data and GLA Economics’ calculations for forecast
GLA Economics 6London's Economic Outlook: Spring 2018
The GLA's medium-term planning projections
2. Introduction
The spring 2018 edition of London’s Economic Outlook (LEO) is GLA Economics’ 32nd London
forecast. The forecasts are issued roughly every six months to assist those preparing planning
projections for London in the medium-term. The report contains the following:
• An overview of the recent economic conditions in London, the UK and the world economies
and includes analysis of important events, trends and risks to short and medium-term
growth (Chapter 3).
• The ‘consensus forecast’ – a review of independent forecasts indicating the range of views
about London’s economy and the possible upside and downside risk (Chapter 4). In this
document, ‘consensus forecast’ refers to the average of the independent forecasters listed
under Section 2.1.
• The GLA Economics forecast for output, employment, household expenditure and household
income in London (Chapter 5).
2.1 Note on the forecast
Any economic forecast is what the forecaster views as the economy’s most likely future path
and as such is inherently uncertain. Both model and data uncertainty as well as unpredictable
events contribute to the potential for forecast error. Since the spring 2016 LEO, GLA
Economics’ forecast is based on an in-house model built by GLA Economics23. Before that,
previous forecasts were based on an in-house model built by Volterra Consulting Limited. GLA
Economics’ review of independent forecasts provides an overview of the range of alternative
opinions. Independent forecasts are supplied to the GLA for the main macroeconomic variables
by the following organisations:
• Cambridge Econometrics (CE)
• The Centre for Economic and Business Research (CEBR)24
• Experian Economics (EE)
• Oxford Economics (OE)
Only the most likely outcomes, which the different forecasting organisations provide, are
recorded. Each forecaster may also prepare scenarios they consider less likely, but these are not
shown here. The low and high forecasts reported in this paper show the lowest and highest
estimates respectively from the external organisations for each year. Therefore, the reported
forecasts can come from different forecasters and means that they may not represent the view
of any one forecaster over the whole of the forecast period.
Economic forecasting is not a precise science. These projections provide an indication of what is,
in GLA Economics’ view, most likely to happen, not what will definitely happen.
23
The production of the forecast model is described in more detail in: Douglass, G & van Lohuizen, A (2016). ‘The historic
performance of the GLA's medium-term economic forecast model’, GLA Economics Current Issues Note 49, November 2016.
24
CEBR does not provide a forecast for household expenditure in London.
GLA Economics 7London's Economic Outlook: Spring 2018
The GLA's medium-term planning projections
3. Economic background: Positive momentum in London’s
economy amidst mixed signs for the UK
This section provides an overview of recent developments in the London, UK and world
economies.
3.1 The London economy
London’s economy – as measured by gross value added (GVA) – grew at a modest pace of 1.4%
on average in 2017. This continues a period of relatively subdued growth whereby the capital’s
economy showed no growth on average in 2016 and a modest 1.7% expansion on average in
2015. These are a lot weaker than the rates of growth seen between 2010 and 2014 when the
average rate of expansion was 4.2%.
On a more positive note, the annual rate of GVA growth on a quarterly basis in London has been
steadily improving in recent periods. For example, the annual rate of growth improved for the
third quarter in a row, rising from 0% in Q3 2016 to stand at 1.6% in Q4 2017 five quarters
later.
The UK has also seen slower rates of real GVA growth in recent years. The UK grew 1.8% on
average in 2017 which was down from 2.4% in 2016, 2.5% in 2015 and 3.5% in 2014. And in
contrast to London, on a quarterly basis, the annual rate of GVA growth has been slowing from
a peak of 2.7% in Q4 2016 to stand at 1.3% in Q4 2017.
Comparing London and the UK more closely, the capital has generally had a slower rate of
annual GVA growth than the rest of the country over the past three years. However, looking
over a longer period as shown in Figure 3.1, growth in London has generally exceeded the rest
of the UK. The latest data point too – Q4 2017 – shows that London again grew at a faster rate
than the UK (1.6% versus 1.3%), but it is too early to say whether this is the start of a new
trend.
Figure 3.1: Annual rate of GVA growth for London and the UK, constant prices
Last data point is Q4 2017
12%
10%
8%
Annual rate of change
6%
4%
2%
0%
-2%
-4%
-6%
-8%
1998
1999
2007
2008
2009
2010
2011
2012
2013
2014
2015
2016
2017
2000
2001
2002
2003
2004
2005
2006
UK London
Source: ONS Regional GVA, GLA Economics
GLA Economics 8London's Economic Outlook: Spring 2018
The GLA's medium-term planning projections
Looking at the labour market, London’s employment rate has been at the highest and the
unemployment rate has been at the lowest levels since data collection began in 1992. The
employment rate shows the percentage of residents aged 16-64 who are in work and stood at
75.2% in the three months to March 2018, up 0.7 percentage points from the three months to
December 2017. Meanwhile, the unemployment rate shows the proportion of the 16 and over
resident population who are unemployed but are wanting to work and stood at 4.9% in the
three months to March, down 0.1 percentage points from the three months to December. There
were no statistical differences between London and the UK, though the UK’s employment rate
(75.6%) was also at the highest level since records began in 1971 and the unemployment rate
(4.2%) was the joint lowest since 1975.
The strong performance of London’s labour market is also reflected in the number of workforce
jobs. The number of jobs in London (regardless of whether they are taken by London residents
or not) grew 1.7% year-on-year in Q4 2017, the equivalent of 98,000 jobs, to reach 5.863
million (Figure 3.2). Moreover, the annual rate of job creation in London was faster than in Q3
2017 (0.9%) and also faster than the UK average for Q4 2017 (1.2%).
Figure 3.2: Number of workforce jobs in London
Last data point is Q4 2017
Source: ONS Workforce Jobs
A prospect for London’s economy considering the strong labour market is the potential for
higher consumer spending and business investment (among others). At a basic level, firms
creating new jobs can be a sign of businesses growing and creating more output. Similarly, if
more people are in work and earning income, there can be an increase in household spending
which can further support economic growth. Moreover, this potential increase in consumer
spending is further supported by a rise in average earnings; after accounting for inflation,
average regular real pay across the UK rose year-on-year for the first time in a year in February,
though only marginally (0.2%), with this slight increase continuing into March.
Linked to this is consumer confidence. However, data from GfK-NOP suggested that London
consumers were slightly pessimistic towards the next 12 months in terms of their household
finances, the general economy and the purchasing climate. That is not to say that consumer
GLA Economics 9London's Economic Outlook: Spring 2018
The GLA's medium-term planning projections
spending will necessarily fall as the latest reading of -6 in April is broadly in line with the
average since 1996 of -5 which is largely consistent with retail sales growth (for example) as
shown in Figure 3.3. Still, the consumer confidence data points to a degree of caution on the
economic conditions in London.
Figure 3.3: Consumer confidence and retail sales
Last data points are April 2018
Source: GfK-NOP, ONS Retail Sales
Moving to businesses, the Purchasing Managers’ Index (PMI) survey can show the state of
overall business conditions in London25. It does so by asking private sector firms about the
month-on-month trends in a variety of business indicators like new work and employment. The
most recent PMI data generally point to improving business conditions in London, with firms
reporting higher levels of activity, new business and employment (Figure 3.4). Overall, given
that the Business Activity Index tracks London GVA growth rather well (Figure 3.5), this could
be an indication of further economic growth in the coming months. This is further supported by
London private sector firms being optimistic towards business conditions over the next year.
However, at 67.8 in April, down from a recent peak of 69.8 in January, the level of positive
sentiment was below the average of 69.2 since data collection began in 2012.
25
PMI index readings are based around the 50 no-change mark. Readings above 50 suggest an overall increase in that variable,
while readings below suggest an overall decline. Readings exactly at 50 suggest no-change in that variable compared with a
month earlier. Moreover, the further the index reading is away from the 50 no-change mark, the faster the rate of growth or
decline.
GLA Economics 10London's Economic Outlook: Spring 2018
The GLA's medium-term planning projections
Figure 3.4: London PMI Business Activity, New Business and Employment Indices
Last data point for PMI is April 2018
Source: IHS Markit
Figure 3.5: London PMI Business Activity Index and GVA growth
Last data point for PMI is April 2018 and Q4 2017 for GVA
Source: IHS Markit, ONS Regional GVA, GLA Economics
Other business surveys also point to improving business conditions in London. For example,
around a quarter of the respondents to the Chamber of Business and Industry (CBI) London
Business Survey are feeling more optimistic about future economic prospects in April than six
months earlier. Similarly, expectations for the London economy rose to its highest level in a year
in Q1 2018 according to the London Chambers of Commerce and Industry (LCCI) Capital 500
Quarterly Economic Survey. However, the net balance remained negative and other business
confidence indicators included in the LCCI survey reached their lowest recorded levels since Q3
2016.
GLA Economics 11London's Economic Outlook: Spring 2018
The GLA's medium-term planning projections
Public transport use is also another indicator that can shed light on the current state of the
London economy. For example, more people travelling in London could reflect more jobs i.e.
they are commuting to work. Or it could be for leisure reasons like shopping which could
indicate an increase in household spending. Having noted this, while the latest period showed a
decline, the moving average annual rate of change in total passenger journeys in London has
been largely stagnant in recent periods (Figure 3.6). Still, this is an improvement on the modest
declines reported in previous recent periods and, consequently, points to a more positive picture
for economic conditions in the capital. In more detail, by mode of transport, the moving average
annual rate of change in Tube passenger journeys has been negative since mid-2017 (and for
the first time in almost eight years), while growth is shown for buses.
Figure 3.6: Public transport use in London
Last data point is the 28-day period ending 31 March 2018
Source: Transport for London
Finally, in London’s housing market, most of the evidence points to a continued slowdown at
the start of 2018. The average house price in London was £475,900 in March, according to data
from the ONS and Land Registry. However, this has fallen 0.8% from a year earlier (the
equivalent of nearly £4,000). This follows on from the decline in February which was the first
annual decline since September 2009. This is in line with what survey data has been signalling
for some months now. For instance, property surveyors responding to the Royal Institute of
Chartered Surveyors (RICS) Housing Market Survey in April have been reporting, on balance, a
reduction in London’s house prices for over two years. Moreover, the net balance was also
negative for the Price Expectations Index suggesting that there could be further price
reductions in the coming months (Figure 3.7).
GLA Economics 12London's Economic Outlook: Spring 2018
The GLA's medium-term planning projections
Figure 3.7: House price inflation in London and the RICS Future Expectations Index
Last data points are March 2018 for house prices and April 2018 for RICS Housing Market
Survey
40% 100
Price Expectations Index, net balance
Annual rate of change in house prices
30% 75
20% 50
10% 25
0% 0
-10% -25
-20% -50
-30% -75
-40% -100
Jan-98
Jan-00
Jan-01
Jan-03
Jan-04
Jan-06
Jan-07
Jan-09
Jan-10
Jan-12
Jan-13
Jan-15
Jan-16
Jan-18
Jan-99
Jan-02
Jan-05
Jan-08
Jan-11
Jan-14
Jan-17
ONS/Land Registry annual rate of change in house prices (LHS)
RICS Price Expectations Index - six month lead (RHS)
Source: ONS/Land Registry House Price Index, RICS
Overall, the indicators discussed above suggest that London’s economy is performing
reasonable well and is likely to continue growing, though probably at a relatively subdued pace.
While GVA growth in London has started to pick up, it remains much slower than most of the
rates reported following the financial crisis. Similarly, despite the strong performance of the
labour market, this is not necessarily being translated into higher real earnings and consumer
confidence remains slightly pessimistic. Also, firms are continuing to report higher levels of
activity and new business but, while they are optimistic towards the next 12 months, the level of
positive sentiment was below the long-run average.
3.2 The UK economy
The main measure of economic growth for the UK is Gross Domestic Product (GDP). On this
basis, the UK economy grew 0.1% in Q1 2018 according to the second estimate from the ONS.
While the estimates of GDP can be later revised, this was the slowest rate of quarterly growth
since the economy contracted slightly in Q4 2012. The ONS did note that wintery weather at
the beginning of 2018 did influence construction and retail sales, but these impacts were only
small and there was little impact observed elsewhere in the economy26.
This picture of a slowing economy could also be seen when looking at year-on-year changes in
GDP. The UK economy grew at an annual rate of 1.2% in Q1 2018 which was the weakest
expansion for almost six years. Indeed, the rate of annual growth has now been slowing for four
quarters in a row.
26
ONS (2018). ‘Monthly economic commentary: May 2018’, 25 May 2018.
GLA Economics 13London's Economic Outlook: Spring 2018
The GLA's medium-term planning projections
Figure 3.8: UK GDP in real terms
Last data point is Q1 2018 (second estimate)
Source: ONS (2018). ‘Second estimate of GDP: January to March 2018’, 25 May 2018.
The slowdown was mainly a reflection of a sharp contraction of the Construction sector.
Construction output fell 2.7% on a quarterly basis, its largest rate of decline since 2012. In
contrast, output of the Services (0.3%) and Production (0.6%) sectors increased. Despite this,
there are signs of a long-term weakness in the Services sector. On a year-on-year basis, the rate
of growth was 1.3% which is significantly less than the average growth rate (2.1%) seen since
the financial crisis. This is a trend that can be seen for all four service sectors (Table 3.1). For
example, the latest year-on-year growth estimate for the Business services and finance sector
was 1.7% in Q1 2018 which is below the post-crisis average of 2.5%.
Table 3.1: Percentage annual change in real GVA by broad industry group for the UK
Broad industry group 2016 2017 2018
Q1 Q2 Q3 Q4 Q1 Q2 Q3 Q4 Q1
Agriculture, forestry, and fishing -4.9 -6.6 -6.4 -4.4 -1.4 -0.4 1.0 -0.7 -1.3
Mining & quarrying; oil & gas extraction 4.2 -2.0 1.8 -3.8 1.3 -0.2 -3.3 0.5 0.1
Manufacturing -0.8 1.2 1.0 2.3 2.8 1.4 3.1 2.8 2.5
Electricity gas, steam and air -2.0 5.8 0.8 5.7 1.2 -4.1 1.7 -1.7 3.9
Water supply, sewage 5.9 4.5 5.0 5.6 6.4 2.6 1.0 -0.5 -3.6
Construction 1.8 2.7 4.4 6.5 8.6 6.5 5.76 2.3 -2.7
Distribution hotels and catering 4.5 4.3 4.9 5.2 3.0 2.5 1.8 0.1 0.8
Transport, storage and communication 4.1 3.3 5.2 6.2 4.3 5.0 2.6 2.0 2.8
Business services and finance 2.0 2.3 2.3 2.3 2.0 1.5 1.6 1.7 1.7
Government and other services 1.3 0.6 0.7 -0.4 -0.2 0.1 0.0 0.4 0.0
Source: ONS (2018). ‘Second estimate of GDP: January to March 2018’, 25 May 2018.
The GDP data can also be split into different types of final expenditure. That is, the expenditure
on goods and services which are not used in the production process (i.e. as intermediate
consumption). This includes final expenditure by households, general government and the non-
profit institutions serving households, as well as expenditure used in gross capital formation
GLA Economics 14London's Economic Outlook: Spring 2018
The GLA's medium-term planning projections
(e.g. business investment)27. The latest data refers to Q4 2017 rather than Q1 2018 and is
shown in Table 3.2.
Table 3.2: Annual rates of real growth in domestic final expenditure for the UK
Final expenditure group 2016 2017
Q1 Q2 Q3 Q4 Q1 Q2 Q3 Q4
Households 2.9% 3.3% 3.1% 3.0% 2.6% 1.8% 1.3% 1.2%
Non-profit institutions serving households 0.2% -0.5% 0.6% -0.8% -0.3% 0.0% 0.1% 0.1%
General government 1.6% 0.7% 0.4% 0.7% -0.4% 0.2% 0.1% 0.6%
Gross fixed capital formation -0.9% -0.4% 4.0% 4.6% 4.5% 4.2% 3.6% 4.0%
Source: ONS (2018), ‘UK Economic Accounts time series dataset’.
Household expenditure is important to the UK economy, with it contributing around two-thirds
(63.3%) to UK GDP in 2017. However, the latest estimates showed that consumer spending
grew 1.2% year-on-year in real terms in Q4 2017. This was broadly in line with the rate of
growth for Q3 2017 (1.3%) and was one of the weakest expansions in almost six years. The
ONS partly attributed this to the recent rise in prices faced by consumers28 which, as will
become apparent later in this section, is expected to be temporary as inflation starts to ease. If
this is the case, then household expenditure could support economic growth further in the near
term.
The other notable trend is for gross capital formation. This increased at an annual rate of 4.0%
in real terms during Q4 2017, up from 3.6% in Q3.
Forecasts of the UK economy
Forecasts suggest that the UK economy will continue growing over the next couple of years,
though different organisations take a different view on the expected growth trajectory. Some of
these differences can be linked to different interpretations of the impact of Brexit, inflation,
productivity and global factors like trade. For example, the impact of Brexit is partly dependent
on the negotiations between the UK and the European Commission as well as whether the UK
can secure trade deals with other countries. An update on the progress of Brexit so far is
presented in Box 3.1, while the other risks to the forecasts are discussed in greater detail in
Section 3.4.
Box 3.1: Brexit
This box provides an update on the process and impact of Brexit so far. This follows the
updates included in the three previous editions of LEO29 and so covers the period since
November 2017.
Since the last edition of London’s Economic Outlook (LEO), the talks between the UK and
the EU on Britain’s exit from the Union have moved from the first to the second phase, with
less than a year to go until the 30 March 2019 deadline. The first phase of Brexit talks was
concluded on 8 December 2017, with an agreement (in principle) on the three priority issues
of citizens’ rights, a financial settlement, and Norther Ireland. A joint report30 was published
which set out a common understanding on the future withdrawal agreement, and although a
27
It also includes net trade in goods and services.
28
ONS (2018). ‘Second estimate of GDP: October to December 2017’.
29
See: London’s Economic Outlook: Autumn 2017, Spring 2017, and Autumn 2016.
30
UK Government and EU (2017), Joint Report from the negotiators of the European Union and the United Kingdom
Government, December 2017.
GLA Economics 15London's Economic Outlook: Spring 2018
The GLA's medium-term planning projections
number of specific aspects are still under discussion, it was decided that sufficient progress
had been made that negotiations could move on to the second phase.
These second phase talks – on transitional arrangements and the future EU-UK relationship –
are currently ongoing. The European Parliament and European Council have made clear that
during any transitional arrangement, the UK will still be subject to existing EU regulations, but
will no longer be eligible for inclusion in any EU decision-making processes.
On 2 March 2018, the Prime Minster delivered her second Mansion House speech, in which
she outlined how her government sees Britain’s future ties with the EU, saying: “we want the
freedom to negotiate trade agreements with other countries around the world. We want to
take back control of our laws. We also want as frictionless a border as possible between us
and the EU – so that we don’t damage the integrated supply chains our industries depend on
and don’t have a hard border between Northern Ireland and Ireland”31.
The issue of the customs union and Northern Ireland continues to be a sticking point for the
Government. In April, the House of Lords voted 348 to 225 to amend the EU Withdrawal Bill
in favour of the UK retaining the customs union and the economic linkages this brings.
Following this, on 9 May, the Lords further voted, to back keeping the UK in the single
market after Brexit. This was just one part of a series of changes made to the UK Withdrawal
Bill by the Lords, most of which aim to soften the effects of Brexit. Meanwhile, Brussels has
insisted that Britain provides a legally binding guarantee that there will be no hard border
between Northern Ireland and the Republic of Ireland. There is currently no plan for how this
could be resolved, but remaining in the customs union is seen as the solution to many of the
problems associated with the Irish border. Officials have been asked to draw up ‘revised
proposals’ for post-Brexit customs arrangements so that the Brexit sub-committee can try to
agree on a new model to replace the UK’s membership of the customs union.
The impact of leaving the EU remains one of the largest potential economic risks to London’s
economy. Forecasts published in January 2018 by Cambridge Econometrics and the Greater
London Authority showed, as expected from other forecasts, that the more severe the type of
Brexit, the greater the negative impact on London was expected to be32. The results showed
that Brexit will not only reduce the size of the economy (compared to what it might have
been if Britain remained in the Single Market and customs union – Scenario 1), but also put it
on a slower long-term growth trajectory (Figure 3.9). In a worst-case scenario (with no
transition, no membership of the Single Market or customs union, and no preferential trade
agreements – Scenario 5), the UK could experience a loss of 3.0% (£54.5bn) in GVA by 2030,
while London could experience a loss of up to 2.1% (£10.8bn) in GVA.
31
UK Government (2018). ‘PM speech on our future economic partnership with the European Union’, March 2018.
32
GLA (2018). ‘Preparing for Brexit’, January 2018.
GLA Economics 16London's Economic Outlook: Spring 2018
The GLA's medium-term planning projections
Figure 3.9: GVA growth in the UK and London
140
135
130
Index (2015 = 100)
125
120
115
110
105
100
95
90
2005
2006
2007
2008
2009
2010
2011
2012
2013
2014
2015
2016
2017
2018
2019
2020
2021
2022
2023
2024
2025
2026
2027
2028
2029
2030
UK under Scenario 1 UK under Scenario 5
London under Scenario 1 London under Scenario 5
Source: Cambridge Econometrics
This sentiment was echoed in the Government’s own impact assessments, which were leaked
in January, before being published in full in March 201833. These documents show that the
Government expects the UK to be worse-off under every scenario (with GDP between 2.0%
and 8.0% lower in the long-term than in a remain scenario), with the negative effects of
Brexit hitting every region and sector. Consistent with the GLA analysis, the Government’s
analysis also points to London being more resilient than other UK regions (with long-term
economic output losses between 1.0% and 3.5%).
On the issue of migration, the Prime Minster has said that “as we leave the EU, free
movement of people will come to an end and we will control the number of people who come
and live in our country”. This represents the first time the UK has said that migration could be
a substantive topic in the negotiations. However, Mrs May went on to say that “UK citizens
will want to work and study in EU countries… businesses across the EU and the UK must be
able to attract and employ the people they need. And we are open to discussing how to
facilitate these valuable links”, suggesting some openness in the negotiating process.
EU workers are particularly important to London’s economy, making up 14% of the workforce
(748,000 jobs) in 201634; for some industries, such as Accommodation and food services, and
Construction, the figure is much higher (Figure 3.10). The equivalent figure for the UK is just
6%. Research by GLA Economics shows that these workers tend to be younger, and higher
skilled, than average. However, there is evidence that net EU migration to the UK continues
to fall amid the ongoing Brexit uncertainty. ONS data shows that over the year to September
2017, the number of EU citizens coming to the UK (220,000) decreased by 47,000, while the
number leaving the UK (130,000) is the highest recorded level since 200835. It remains
33
UK Parliament (2018), Government Brexit analysis material published, Mar. 2018.
34
GLA Economics (2018), EEA workers in the London labour market, Jan. 2018.
35
ONS (2018), Migration Statistics Quarterly Report, Feb. 2018.
GLA Economics 17London's Economic Outlook: Spring 2018
The GLA's medium-term planning projections
unclear whether or not this trend will continue, or if this represents a shift in long-term
trends.
Figure 3.10: Percentage of jobs by industry and country/area of birth, London, 2016
Total all sections (A-S)
Accommodation and food service activities
Construction
Administrative and support service activities
Manufacturing
Information and communication
Other service activities
Financial and insurance activities
Professional, scientific and technical activities
Primary and Utilities
Wholesale and motor trades
Education
Transportation and storage
Human health and social work activities
Retail
Real estate activities
Arts, entertainment and recreation
Public administration and defence; compulsory social security
0% 10% 20% 30% 40% 50% 60% 70% 80% 90% 100%
UK Rest of the EEA (excluding the UK) Any other country (excluding UK and EEA)
Source: ONS Annual Population Survey
While significant progress has been made towards a final Brexit agreement, the UK’s future is
far from certain. The Trade Bill has been debated in the Commons on several occasions, and
so far remains un-amended, while the customs bill has yet to begin its process through
parliament; both are likely to be controversial pieces of legislation. The Immigration Bill is
expected in early summer and will involve some significant policy decisions including how
Britain plans to treat EU citizens looking to enter the UK. Looking further forward, European
summits have been scheduled for 28 June, 18 October and 13 December, by which time a
political declaration on a future relationship will be expected to have been signed. With less
than a year until the so-called cliff edge, and the Withdrawal Bill still ‘ping pong-ing’ in
Parliament (with a vote expected in late 2018), the government faces a huge number of
challenges if they are to be prepared for Brexit.
Acknowledging the above, Figure 3.11 shows the range of forecasts for real UK GDP growth.
This includes the International Monetary Fund’s (IMF) forecast who in the April edition of the
World Economic Outlook expects GDP growth of 1.6% in 2018 (up 0.1 percentage points from
October 201736 but unchanged from the January 2018 update), followed by 1.5% in 2019
36
IMF (2017). ‘World Economic Outlook’, October 2017.
GLA Economics 18London's Economic Outlook: Spring 2018
The GLA's medium-term planning projections
(down 0.1 percentage points but unchanged from the January update) and 2020 (down 0.2
percentage points)37. It also includes HM Treasury consensus forecast for the UK economy
based on research from a variety of organisations. From this, the latest average forecast is for
growth of 1.4% in 2018 and 1.5% in 201938, so marginally weaker than the IMF. Meanwhile, the
Office for Budget Responsibility (OBR) raised their forecast of UK GDP growth for 2018 from
1.4% to 1.5%, though they then expect the rate of expansion to slow to 1.3% in 2019 and 2020
before picking up to 1.4% in 2021.
Figure 3.11: Forecasts of real UK GDP growth
Source: ONS (2018), ‘GDP Q1 2018 preliminary estimate’; IMF (2018), ‘World economic outlook’ April 2018; HM
Treasury (2018), ‘Forecasts for the UK economy’, May 2018; OECD (2018), ‘Economic outlook’, interim March
2018; Bank of England (2018), ‘Inflation report’, May 2018; OBR (2018), ‘Economic and fiscal outlook’, March
2018; and European Commission (2018), ‘Winter 2018 economic forecast’.
The OBR and HM Treasury also publishes forecasts for other variables like the labour market
and public-sector net borrowing (PSNB). These are shown in Table 3.3.
Table 3.3: Selected OBR and HM Treasury consensus forecasts for the UK economy
HM Treasury’s Average of Office for Budget
Independent Forecasters Responsibility
(May 2018) (March 2018)
2018 2019 2018 2019
Annual real GDP growth rate 1.4% 1.5% 1.5% 1.3%
LFS unemployment rate 4.3% 4.4% 4.4% 4.5%
Current account -£72.0bn -£63.9bn -£92.5bn -£86.2bn
Public sector net borrowing (financial year) £41.7bn £36.4bn £37.1bn £33.9bn
Sources: HM Treasury (2018). ‘Forecasts for the UK economy: a comparison of independent forecasts’, May 2018;
and OBR (2018). ‘Economic and fiscal outlook’, March 2018.
Other UK economic indicators
Besides GDP, another important economic indicator is inflation as measured by the Consumer
Price Index (CPI). As noted in the autumn 2017 edition of London’s Economic Outlook, the rate
37
IMF (2018). ‘World Economic Outlook’, April 2018.
38
HM Treasury (2018). ‘Forecasts for the UK economy: a comparison of independent forecasts’, May 2018.
GLA Economics 19London's Economic Outlook: Spring 2018
The GLA's medium-term planning projections
of inflation had been picking up largely because of the depreciation of sterling following the EU
referendum result. This made the price of imported goods and services more expensive. The
Bank of England (among others) expected the rise in inflation to be short-lived as the sterling-
related price increases worked its way through the economy. This seems to have been the case –
inflation peaked at 3.1% in November 2017, but has since fallen back with the latest estimate
for April at 2.4%. The Bank of England has an inflation target of 2% so, in that context, the
current rate of inflation is still relatively high.
Given this, there has been increased speculation that the Bank of England may raise interest
rates in the coming months. Previously, the Monetary Policy Committee voted to raise interest
rates by 0.25 percentage points to 0.5% in November 2017 – the first increase since the
financial crisis. The Governor of the Bank of England has already indicated that there would
probably be several interest rate rises over the next few years, especially as the Bank attempts
to ‘normalise’ interest rates from the current ultra-low levels. Even in the Bank’s latest Inflation
Report, it was restated that “were the economy to develop broadly in line with the May Inflation
Report projections, an ongoing tightening of monetary policy over the forecast period would be
appropriate”39. However, it further noted that “any future increases in [interest rates] are likely
to be at a gradual pace and to a limited extent”. Consequently, some commentators like the EY
Item Club40 are currently expecting one or two increases in both 2018 and 2019 (see Figure
3.12).
Figure 3.12: Market-implied interest rate path for the UK
Source: Bank of England (2018). ‘Inflation Report’, May 2018.
Higher interest rates can have several influences on the economy41. This is discussed in greater
detail in Box 3.2. All other things held constant, it can bolster sterling as [interest] returns on
sterling would be relatively higher than other countries leading to an increase in demand for
sterling-based assets by foreigners. It can also reduce consumer demand as higher interest on
savings raises the ‘opportunity cost’ of spending. Likewise, it can reduce the appetite to invest
39
Bank of England (2018). ‘Inflation Report’, May 2018.
40
EY (2018). ‘EY Item Club Spring Forecast’, April 2018.
41
For more information, see Bank of England (1999). ‘The transmission mechanism of monetary policy’, Bank of England
Quarterly Bulletin, May 1999.
GLA Economics 20London's Economic Outlook: Spring 2018
The GLA's medium-term planning projections
and borrow as the cost in terms of debt interest would be higher. It can thus slow the rate of
inflation and negatively affect the rate of economic growth in the short-run through the
combined effect of weaker demand for goods and services. However, the magnitude of these
effects will be dependent on several factors – i.e. the speed and scale of the interest rate
increases, the time it takes for interest rates to work through the transmission mechanism, and
the current state of the wider economy – and therefore provides some further uncertainty to
economic forecasts.
Box 3.2: Monetary policy
This box discusses the importance of monetary policy at influencing an economy with
reference to the current path of monetary policy in the UK and other advanced economies
like the US and Eurozone.
How monetary policy can affect an economy
Monetary policy is one of the main tools to influence the economy, alongside the other main
tool which is fiscal policy which includes government spending and taxation. At a basic level,
monetary policy involves changing the interest rate charged by a central bank to access funds
and this is often the reference point for other market interest rates within an economy. A
reduction in interest rates can lower the opportunity cost of spending, so it can lead to higher
levels of consumer spending and business investment. For example, lower savings interest can
increase spending, banks can lower interest rates on loans increasing credit, and greater
demand for assets can lead to higher prices which in turn can create a positive wealth effect.
Lower interest rates can also lead to a depreciation in exchange rates as it becomes less
attractive to save money in the economy relative to other economies. This depreciation can
also make it more expensive to import goods and services, thereby raising prices. It can also
affect expectations for future interest rates (and inflation) which can influence wage and
price setting that often needs to be agreed in advance. For example, if inflation expectations
are high, wages may be set higher in expectation of higher prices in the future. All in all,
lower interest rates can stimulate demand and economic activity and push up inflation. The
reverse is true for an increase in interest rates.
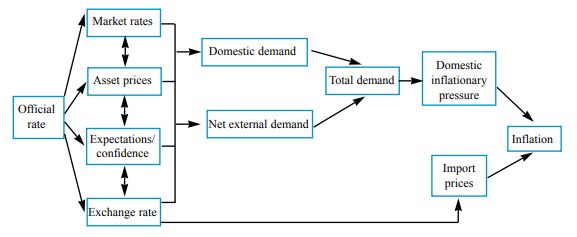
The way that interest rate changes works through an economy is called the transmission
mechanism and is summarised in Figure 3.13. However, it should be noted that a change in
interest rates does not instantly work its way through an economy. For example, fixed interest
rates on savings and borrowing mean that sometimes the change will not be felt until the end
of the fixed period. Some estimates suggest it can take 18-24 months for a change in interest
rates to fully work through an economy42.
42
Dale, S & Haldane, A (1993). ‘Interest rates and the channels of monetary transmission: some sectoral estimates’, Bank of
England Working Paper.
GLA Economics 21London's Economic Outlook: Spring 2018
The GLA's medium-term planning projections
Figure 3.13: The transmission mechanism of monetary policy
Note: not all interactions between variables are shown for simplicity. Taken from: Bank of England (1999). ‘The
transmission mechanism of monetary policy’, Quarterly Bulletin, May 1999.
Another monetary policy tool is the monetary base, i.e. the amount of money in the economy.
Policy to increase this is sometimes called quantitative easing and was used during the
financial crisis. By increasing the amount of money in an economy, the amount available to
spend rises, pushing up demand and stimulating economic activity.
Update on monetary policy in the UK
In the UK, the interest rate the Bank of England changes is called the Bank rate. The
Monetary Policy Committee (MPC) meets monthly to decide monetary policy. While the Bank
is politically independent, the Government has set it a central symmetrical target of 2%
consumer price index (CPI) inflation plus or minus 1%. The Bank should also try to support
strong, sustainable and balanced economic growth by achieving price and financial stability.
In November 2017, the Bank of England raised the Bank rate for the first time since July
2007 (Figure 3.14). The interest rate increase was only by 0.25 percentage points to 0.5% -
reversing a cut following the EU referendum – meaning it remains at historically low levels. As
noted in the November 2017 edition of London’s Economy Today, this announcement was
expected given the improving labour market and inflation being above the 2% target.
GLA Economics 22You can also read