IN 2019-2021 THE ECONOMIC OUTLOOK FOR OAKLAND COUNTY - University of Michigan
←
→
Page content transcription
If your browser does not render page correctly, please read the page content below
THE ECONOMIC OUTLOOK FOR
                          OAKLAND COUNTY
                            IN 2019–2021

                                      Prepared by
                                 Gabriel M. Ehrlich
                                 Donald R. Grimes
                                   Jacob Burton
                               Michael R. McWilliams

  Research Seminar in Quantitative Economics, Department of Economics

                                      Prepared for

                                       April 2019

A condensed version of this report was presented to the 34th annual Oakland County Economic
Outlook Luncheon at the Troy Marriott Hotel on April 26, 2019. Sponsored by fourteen Oakland
County organizations, the luncheon was hosted by the Oakland County Department of Economic
Development & Community Affairs; Chase; and Oakland Community College. The full report is
also available on the Web (updated each year) at www.AdvantageOakland.com or
lsa.umich.edu/econ/rsqe.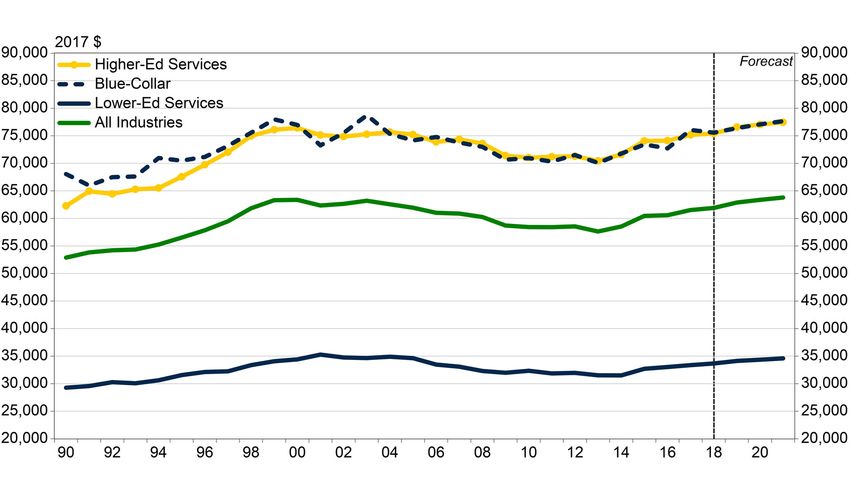
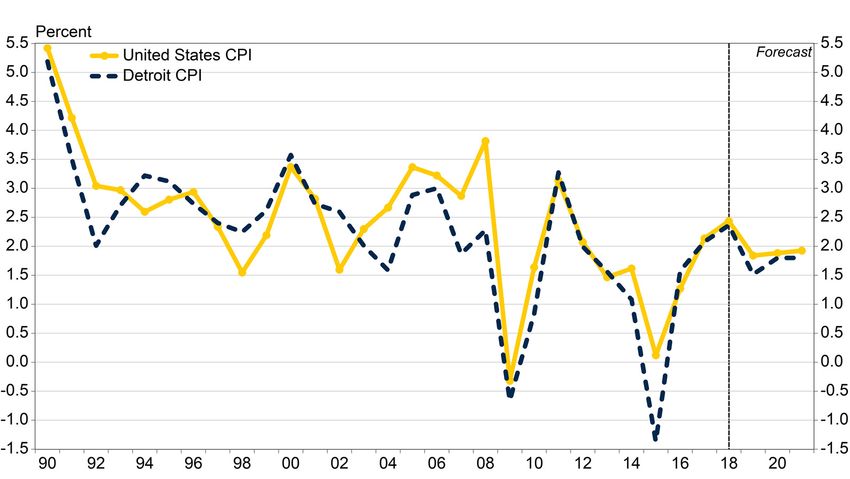
Table of Contents

Introduction ...............................................................................................................................................................1
Review of the Forecast for 2018: A Report Card .....................................................................................................1
The Current State of Oakland County’s Economy......................................................................................................3
   Employment Path of the Oakland County Economy ............................................................................................3
   Job Change in Oakland County by Industry Wage Category, 2010–18 ...............................................................4
   Unemployment Path of the Oakland County Economy ........................................................................................5
   Oakland County Compared with U.S. Counties of Similar Size ..........................................................................6
County Level Real GDP ...........................................................................................................................................8
National Outlook: 2019–21.......................................................................................................................................9
Oakland County Outlook: 2019–21 ........................................................................................................................12
   Inflation ...............................................................................................................................................................12
   Employment Path ................................................................................................................................................13
   Job Change by Industry Wage Category, 2018–21 ............................................................................................15
   Employment by Detailed Industry Category ......................................................................................................15
   Unemployment ....................................................................................................................................................19
   Real Wage ...........................................................................................................................................................20
Conclusion ...............................................................................................................................................................21
Appendix A: Forecast of Jobs in Oakland County by Detailed Industry Division, 2019–21 .................................23
Appendix B: Indicator Values for Comparison of Oakland County with 37 U.S. Counties of Similar Size .........27
INTRODUCTION
Oakland County has been branded as a shimmering horizon of good economic news, a
portrait that is backed up by the numbers. The county has entered a record-setting tenth     Oakland County has entered
consecutive year of uninterrupted job growth since the recession’s low point at the end      a record breaking tenth con-
of 2009. Oakland’s pace of job growth from 2010 to 2018 well outstripped that of both        secutive year of uninter-
the nation and Michigan.                                                                     rupted job growth that well
                                                                                             outpaced both the nation and
The county’s unemployment rate in 2018 posted the lowest annual reading since the            Michigan.
golden year of 2000, 0.6 percentage points below the average U.S. rate for 2018. Oak-
land’s labor force has grown every year since 2011, as improving job opportunities have      The county’s unemployment
drawn more workers into the labor market. And this robust economy approaching full           rate in 2018 posted the low-
employment is percolating in an environment of modest local price inflation.                 est annual reading since
                                                                                             2000.
Some enviable milestones are now in plain sight on the horizon. With a continuation of
job growth this year, the county economy would surpass the vibrant 1990s, the longest
                                                                                             This robust economy ap-
stretch of time for which we have records. Also, the economy is within sight of achieving    proaching full employment is
an all-time employment peak. In addition, the labor market is within a percentage point      percolating in an environ-
of its lowest annual unemployment rate on record. Will the Oakland economy reach or          ment of modest local price
surpass some of these historical milestones over the next few years?                         inflation.
Our view of where the Oakland County economy is now and where it’s headed over the
next three years is the central focus of this report. We offer our take on the path of em-   Some enviable milestones
ployment by industry, unemployment, inflation, and wages through 2021. We also as-           are now on the horizon for
sess the performance of employment over the current recovery and through the forecast        the Oakland County econ-
                                                                                             omy: the longest duration of
period in terms of wage levels. We consider how the county is faring compared with
                                                                                             economic expansion on rec-
counties of similar size around the nation according to indicators of future prosperity.
                                                                                             ord; its all-time employment
As a special addition to this year’s report, we analyze the new county GDP data series
                                                                                             peak; and its lowest annual
generated by the Bureau of Economic Analysis. As always, we also summarize the na-           unemployment rate ever rec-
tional outlook underlying our forecast of Oakland County.                                    orded.
The local forecast is generated from a regional model constructed specifically for this
study at the University of Michigan’s Research Seminar in Quantitative Economics
(RSQE) in the Department of Economics. The regional model uses national economic
indicators from RSQE as inputs. The Oakland model was constructed with the support
of the Oakland County Department of Economic Development & Community Affairs.
Before considering our perspective on how the Oakland County economy will evolve
through 2021, we first take a look at 2018, to learn more about what kind of year it was
and to gauge how well we anticipated developments as that year began.

REVIEW OF THE FORECAST FOR 2018: A REPORT CARD
A year ago (April 26, 2018), we presented our thirty-third economic outlook for Oakland
County at the annual Economic Outlook Luncheon. Last year’s forecast of employment,
unemployment, and inflation for 2018 can now be compared with estimates of the out-
come for that year, to see how accurate our forecast was.
In last year’s report, we forecast that that Oakland County’s private sector would add
11,713 jobs in 2018, for a growth rate of 1.7 percent. We now estimate that the county
gained 8,861 new jobs last year, or 1.3 percent, resulting in an overshoot of 0.4 percent-
age points, or four workers per 1,000. That forecast error is well below our average ab-
solute error of 1.6 percent since 1986.

                                                                                                                            1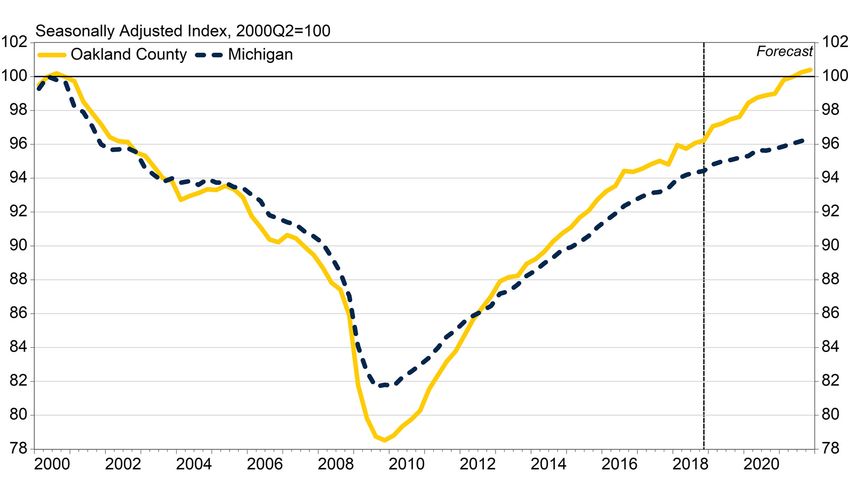
FINAL REPORT
Table 1. Report Card: Track Record over the Years
    Year of    % Forecast Error for                   Year of     % Forecast Error for
    Forecast    Total Private Jobs                    Forecast     Total Private Jobs
     1986              +1.4                            2003               +1.5
     1987              +0.7                            2004               +2.6
     1988              -1.8                            2005               +1.4
     1989              -1.9                            2006               +3.4
     1990              +2.2                            2007                0.0
     1991              +3.9                            2008               +2.3
     1992              -2.0                            2009               +5.5
     1993              +0.5                            2010               -1.7
     1994              -1.3                            2011               -2.5             Last year, we forecast that
                                                                                           private-sector job growth
     1995              +0.2                            2012               -2.6             would continue in 2018 at a
     1996              -0.5                            2013               -1.1             rate of 1.7 percent. We now
     1997              +0.6                            2014               -0.3             estimate that the county
     1998              +1.3                            2015               -0.1             gained jobs at a rate of 1.3
                                                                                           percent. We judge that much
     1999              -1.2                            2016               -0.1             of the shortfall in 2018 was
     2000              +0.6                            2017               +1.1             due to weakness in the lei-
     2001             +1.9                              2018                +0.4           sure and hospitality services
                                                                                           industry.
     2002             +3.2

               (Positive numbers indicate that the forecast was too high;                  For unemployment, we were
                    negative numbers indicate that it was too low.)                        spot on in terms of the
                                                                                           change, but the starting
                  Average absolute forecast error 1986–2018: 1.6%                          point was revised during the
                                                                                           year. The unemployment
                                      Forecast 2018                Actual 2018             rate for Oakland County de-
 Unemployment rate                        3.4%                         3.3%                clined by 0.1 percentage
                                                                                           points from a revised value
 Consumer inflation rate                  2.3%                         2.4%
                                                                                           of 3.4 percent in 2017 to 3.3
                                                                                           percent in 2018.
Forecast date: April 2018

Among the major industry divisions, the largest shortfall in our forecast was in leisure   Our forecast for inflation
and hospitality services. We expected that industry division to grow by 1,514 jobs (2.1    was also very close. Local
percent), whereas we now estimate that it added only 252 jobs (0.4 percent). We believe    prices increased by 2.4 per-
the weakness in this sector is temporary and that growth will bounce back in 2019.         cent in 2018 instead of the
                                                                                           2.3 percent we had forecast.
Our forecast for the government sector was also a little too high. We anticipated job
growth of 1.1 percent in 2018; instead, government employment increased by only 0.8
percent.
We had forecast that the unemployment rate would decline by 0.1 percentage points,
from 3.5 percent in 2017 to 3.4 percent in 2018. We were spot on in terms of the change,
but the starting point was revised during the year. The unemployment rate for Oakland
County did decline by 0.1 percentage points, from a revised value of 3.4 percent in 2017
to 3.3 percent in 2018.

2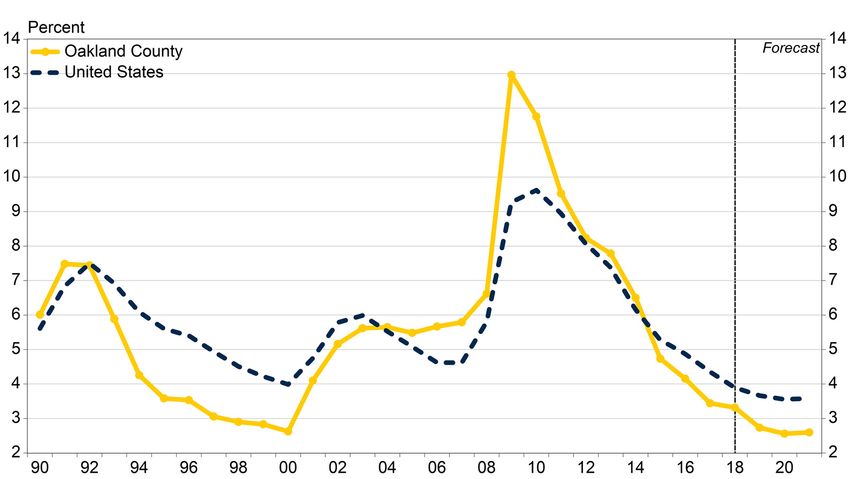
OAKLAND COUNTY ECONOMIC OUTLOOK 2019–2021
Our forecast for inflation was also very close. We underestimated local consumer infla-
tion by 0.1 percentage points. Local prices increased by 2.4 percent in 2018 instead of
the 2.3 percent we had forecast.
This review gives us a glimpse of a county economy continuing to grow deep into the
recovery period in a rapidly tightening labor market. We need to take a more detailed
look at the current state of the economy, however, before we anticipate developments
beyond 2018.

THE CURRENT STATE OF OAKLAND COUNTY’S ECONOMY
Employment Path of the Oakland County Economy
Oakland County’s economy grew vigorously during the 1990s as shown in figure 1. The          The 1990s were a period of
county added 182,700 jobs from 1990 to 2000, an average pace of 2.8 percent per year.        vigorous growth, adding
The county gave up the majority of that growth during the 2000s, shedding 156,500 jobs.      182,700 payroll jobs, an av-
That came to an average rate of decline of 2.2 percent annually. In total, the county lost   erage pace of 2.8 percent per
86 percent of the jobs it had gained in the preceding decade.                                year.

The 2010s have seen a return to growth in Oakland County. We estimate that through
2018, the county has added back 126,500 jobs, registering an average growth rate of 2.1      The 2000s were a tough time
percent per year.                                                                            for Oakland, losing 156,500
                                                                                             jobs during the decade, an
Figure 1. Job Growth in Oakland County, 1991–2018
                                                                                             average growth rate of neg-
                                                                                             ative 2.2 percent per year.

                                                                                             Oakland has returned to job
                                                                                             growth in the current dec-
                                                                                             ade, posting 126,500 job ad-
                                                                                             ditions from 2010 to 2018,
                                                                                             an average growth pace of
                                                                                             2.1 percent per year.

Job growth in the county slipped to a 1.0 percent annual pace in 2017, its slowest rate
during the current recovery period. Based on the currently available data, it appears that
growth bounced back nicely in 2018. We now estimate that the county added 9,300 jobs
for the year, a growth rate of 1.3 percent.
The acceleration in Oakland County’s job growth is a heartening sign this far into the
county’s recovery period. It is especially impressive given the recent softness in Detroit
Three light vehicle sales, which have declined in each of the past three years. In our
view, Oakland’s recent success reflects the ongoing diversification of the county’s econ-
omy toward future growth sectors, which has been enabled by the county’s well-edu-
cated labor force.
                                                                                                                             3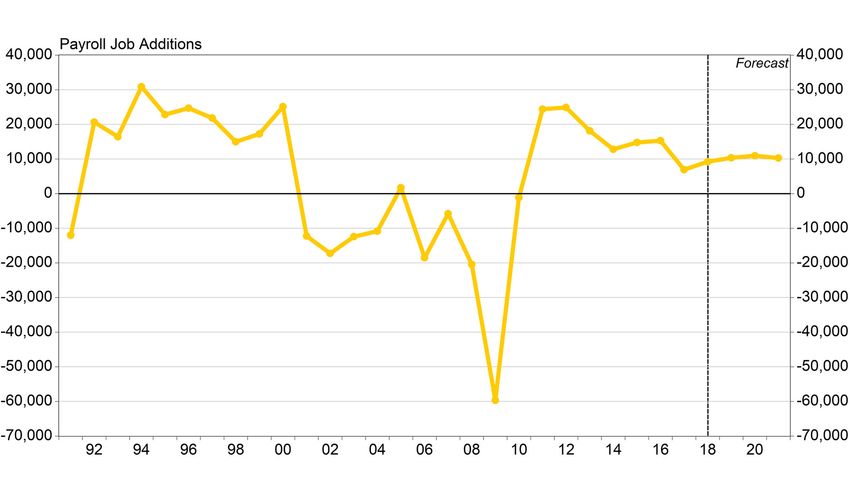
FINAL REPORT
Oakland County’s job gains in 2018 were concentrated in three major industry divisions.
In order, they were: professional and business services; private education and health ser-                      The major industry divisions
vices; and trade, transportation, and utilities. Together, these industries accounted for                       adding the greatest number
over four-fifths of the county’s job gains for the year.                                                        of jobs in 2018 were, in or-
                                                                                                                der: professional and busi-
The government sector has continued to lag the private sector since returning to job
                                                                                                                ness services; private educa-
growth in 2016. The sector grew at a 0.8 percent pace in 2018, half a percentage point
                                                                                                                tion and health services; and
slower than the private sector.
                                                                                                                trade, transportation, and
We now explore further the wage structure of the current recovery.                                              utilities.
Job Change in Oakland County by Industry Wage Category, 2010–18
To better understand what types of jobs have been created in Oakland County over the
recovery period to date, we dissected the job recovery into three wage categories. Spe-
cifically, we partitioned the 151 unique industries in our dataset into three categories
based on their average annual wage in 2017: higher-wage industries ($75,000 or more,
at least 35 percent above the U.S. average of $55,390 in 2017); middle-wage industries
($35,000 to $74,999); and lower-wage industries (under $35,000, or at least 35 percent
below the U.S. average). For comparison, the average annual wage in Oakland was
$61,536 in 2017. We then computed the change in employment, both in number of jobs
and in percentages, over the period from 2010 to 2018 for each of the three wage cate-
gories and for the county overall. The results are shown in table 2.
The current job recovery to date is highlighted in the last column in table 2, which shows
the percentage change in jobs over the eight years by wage category. Higher-wage in-
                                                                                                                Job growth in Oakland over
dustries grew faster than average on a percentage basis in Oakland County from 2010 to
                                                                                                                the current economic recov-
2018. The 49,943 job additions in this category came to total growth of 25.4 percent.
                                                                                                                ery to date (2010–18) is
Middle-wage industries grew more slowly in Oakland County on a percentage basis,                                skewed toward the higher-
15.5 percent. Because the 2010 employment level in middle-wage industries was so                                compensated end of the
large, however, that growth rate translated into 43,156 job additions, only slightly less                       wage scale, with both job
than the number of jobs in the higher-wage industries.                                                          growth and job additions for
                                                                                                                higher-wage industries lead-
Lower-wage industries added 33,361 jobs in Oakland County from 2010 to 2018, the
                                                                                                                ing middle-wage and lower-
fewest of the three wage categories. However, because the 2010 employment level in
                                                                                                                wage industries.
lower-wage industries was relatively small, that translated into a healthy growth rate of
24.6 percent.
An important factor behind the relatively slow growth in the middle-wage industries in
Oakland County during this time is job losses in the government sector.
Table 2. Job Change in Oakland County by Industry Wage Category, 2010–18
                                                                                    Change        % Change
                                                       2010            2018        2010–2018      2010–2018
    Total all industries                              611,142        737,602        126,460           20.7
    Higher-wage industries ($75,000 or more)          196,912        246,854          49,943          25.4
    Middle-wage industries ($35,000 to $74,999)       278,566        321,722          43,156          15.5
    Lower-wage industries (under $35,000)             135,665        169,026          33,361          24.6

Source: BLS, Quarterly Census of Employment and Wages. Higher-wage industries have an average wage in
2017 at least 35 percent above the U.S. average ($55,390) and lower-wage industries at least 35 percent below
the U.S. average.

Next up is a consideration of the unemployed in the current recovery.

4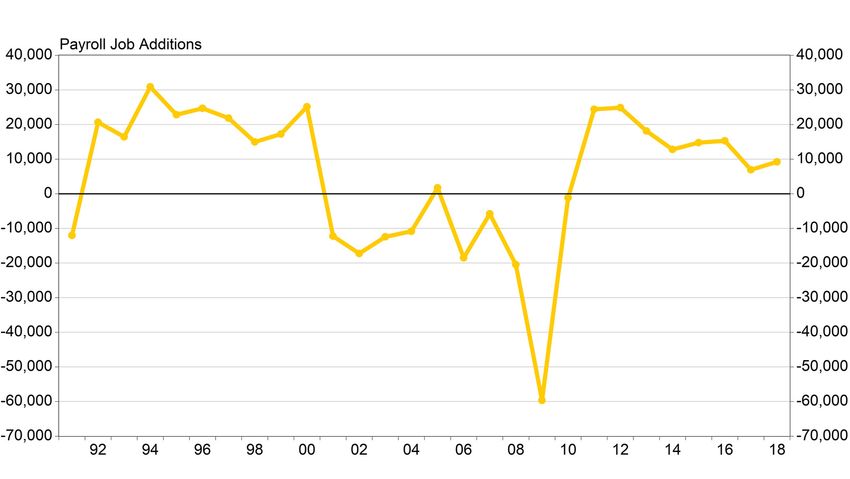
OAKLAND COUNTY ECONOMIC OUTLOOK 2019–2021
Unemployment Path of the Oakland County Economy
The path of Oakland County’s annual unemployment rate from 1990 to 2018 is shown
in figure 2, along with the rate for the United States for comparison.

Figure 2. Unemployment Rates for Oakland County and for the United States,
          1990–2018

Oakland County’s unemployment rate climbed to 7.5 percent in 1991, its peak level dur-
ing the early 1990s recession. It declined over the remainder of the 1990s, reaching a
low point of 2.6 percent in 2000.
Oakland’s unemployment rate climbed to 6.6 percent in 2008, before spiking during the
Great Recession to 13.0 percent in 2009 and 11.8 percent in 2010. The national unem-
                                                                                              Oakland’s     unemployment
ployment rates for those years were 5.8, 9.3, and 9.6 percent, respectively.                  rate averaged 3.3 percent in
Oakland County’s unemployment rate has come down sharply since the Great Recession.           2018—down three-quarters
Oakland’s rate fell below the national rate in 2015, and has stayed there every year since    from its peak in 2009—the
then.                                                                                         lowest annual reading since
                                                                                              2000, and six-tenths of a per-
Oakland’s unemployment rate averaged 3.3 percent in 2018. That was only one-tenth of          centage point below the U.S.
a percentage point lower than the 2017 average, but it was still a move in the right direc-   rate.
tion. It was also the lowest annual unemployment rate the county had recorded since the
all-time low achieved in 2000. The U.S. unemployment rate averaged 3.9 percent in
2018, six-tenths of a percentage point above Oakland County’s unemployment rate for           Growth in the county’s labor
the year.                                                                                     force came almost to a
                                                                                              standstill in 2018, at 0.1 per-
Growth in the county’s labor force came almost to a standstill in 2018, at 0.1 percentage     centage points, reflecting a
points. We believe that slowdown reflects a balancing act between a strong labor market,      balancing act between a
which is drawing more workers into the labor force, and a powerful downward pull from         strong labor market and de-
demographics, as baby boomers increasingly reach the normal retirement age.                   mographics.
We now turn to our traditional comparison of Oakland County with counties of similar
size around the United States on a variety of economic measures.

                                                                                                                                5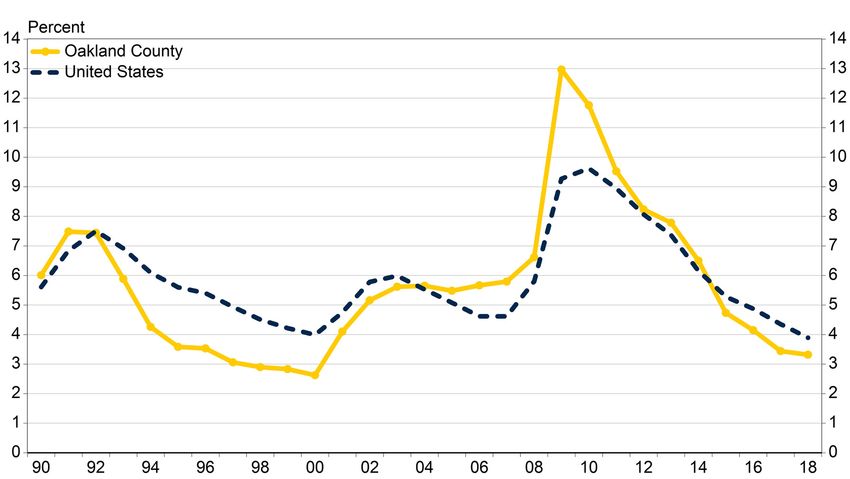
FINAL REPORT
Oakland County Compared with U.S. Counties of Similar Size
It is useful to compare Oakland County’s economic foundation with that of its peer coun-
ties in order to identify Oakland’s relative strengths and to assess the county’s prospects
in the future. To form a peer group, we include all counties that have a population within
350,000 of Oakland’s 2017 level of 1.25 million, i.e., all counties with between 900,000
and 1.6 million residents. There were thirty-seven such counties other than Oakland in              We ranked Oakland among
2017. Many of the nation’s most prosperous and successful counties are included in this             thirty-seven other counties of
group. Like Oakland, many are also among the select group of U.S. counties that have                similar size in the United
a AAA bond rating with multiple rating agencies.                                                    States on a series of
We ranked Oakland County and these thirty-seven other counties on five measures that                measures we consider to be
                                                                                                    indicative of future economic
we consider to be indicative of economic prospects moving forward. The rankings are
                                                                                                    prosperity.
shown in table 3; the data underlying the rankings are provided in appendix B. The
measures we consider are: (1) educational attainment—share of the population aged 25
to 64 (prime working-age population) with at least an associate’s degree in 2017; (2)
child poverty—share of the population aged 17-and-under who lived within families
whose income was below the poverty level in 2017; (3) median family income adjusted
for the cost of living1 in 2017; (4) high income seniors—share of persons aged 65 and
older with income at least five times the poverty line in 2017; and (5) professional occu-
pations—share of employed county residents working in professional and managerial
occupations in 2017.
A lower number for the rank indicates a better position for the measure among the coun-
ties; that is, a rank of 1 is best and 38 is worst. We order the thirty-eight counties, in-
cluding Oakland, by the summation of the rankings across the five measures. This order
is not meant to be a rigorous measure of overall ranking, but it does give a sense of the           Oakland ranks sixth overall
counties’ relative standings. On this basis, Oakland places sixth overall, up three places          among the thirty-eight coun-
from its ranking a year ago, an impressive achievement considering that this peer group             ties, up three places from
contains some of the healthiest local economies in the nation.                                      last year, an impressive
                                                                                                    achievement       considering
Oakland’s status has improved in every measure since our previous forecast with current
                                                                                                    that this peer group contains
rankings between fifth and fourteenth across the different categories. Notably, Oakland
                                                                                                    some of the healthiest local
ranks 5th in professional occupations, 5th in median family income, and 6th in child
                                                                                                    economies in the nation.
poverty. Oakland’s placement in these categories has helped it maintain and improve its
position compared to its peers.
After last year’s forecast presentation, we were asked about the distribution of child pov-
erty within the county. Data for communities within the county are not available for the
year 2017, but 5-year averages for the years 2012−2017 are available. Those statistics
show dispersion in the level of child poverty across communities within Oakland
County. Some communities have reported child poverty rates of zero percent, while oth-
ers report levels above 40 percent. Oakland’s average level of child poverty, however,
has fallen in every year since 2011.
Oakland’s lowest ranking came in the share of high-income seniors, but the county’s
ranking of 14th on this metric still placed the county well into the top half of its peer
group.

1
 Our cost of living calculation is based upon the Bureau of Economic Analysis, Regional Price
Parity Indices for Metropolitan Areas, extended to 2017 using differences in the regional con-
sumer price index from the national consumer price index, and adjusted to specific counties using
the difference between the median gross rent in the county and the metropolitan area from the
2017 American Community Survey.
6
OAKLAND COUNTY ECONOMIC OUTLOOK 2019–2021
We believe that Oakland County’s strong overall performance in these measures suggest
it is securely positioned now and for the future. The combination of an educated popu-
lace, a high share of managerial and professional jobs, and an attractive standard of living Oakland is strongly posi-
should provide a solid foundation for economic prosperity over our forecast period and tioned to thrive in the future,
in the years to come. with an educated populace, a
high share of managerial
Table 3 and professional jobs, and
Oakland County Compared with 37 U.S. Counties of Similar Size* an attractive standard of liv-
(Ranking based on selected Indicators of prosperity) ing.
Associate's Median High-Income
Population Degree or Child Family Persons Aged 65 Managerial, Sum of Rank of
County State 2017 More Poverty Income** or Older Professional Rankings Sum
Fairfax VA 1,148,433 1 8 1 1 1 12 1
Montgomery MD 1,058,810 2 7 3 2 2 16 2
Collin TX 969,603 5 1 2 12 3 23 3
Nassau NY 1,369,514 10 3 6 3 13 35 4
DuPage IL 930,128 6 4 4 11 11 36 5
Oakland MI 1,250,836 8 6 5 14 5 38 6
Bergen NJ 948,406 9 2 13 8 9 41 7
Westchester NY 980,244 11 9 9 5 10 44 8
Wake NC 1,072,203 3 15 7 15 4 44 8
Hennepin MN 1,252,024 4 17 8 16 7 52 10
Fairfield CT 949,921 15 13 11 6 14 59 11
Travis TX 1,226,698 14 18 10 10 8 60 12
Contra Costa CA 1,147,439 17 14 15 4 17 67 13
Fulton GA 1,041,423 7 25 12 18 6 68 14
Suffolk NY 1,492,953 20 5 14 9 22 70 15
St. Louis MO 996,726 16 16 16 19 15 82 16
Mecklenburg NC 1,076,837 13 22 17 24 16 92 17
Allegheny PA 1,223,048 12 19 18 32 12 93 18
Salt Lake UT 1,135,649 24 11 19 20 19 93 18
Prince George's MD 912,756 35 12 20 7 23 97 20
Honolulu HI 988,650 22 10 24 13 36 105 21
Gwinnett GA 920,260 23 21 21 23 27 115 22
Franklin OH 1,291,981 21 30 22 25 18 116 23
Erie NY 925,528 18 27 23 27 26 121 24
Palm Beach FL 1,471,150 25 23 29 17 32 126 25
Sacramento CA 1,530,615 32 24 25 21 25 127 26
Pinellas FL 970,637 28 20 27 29 29 133 27
Hillsborough FL 1,408,566 26 26 30 28 24 134 28
Pima AZ 1,022,769 29 29 32 22 28 140 29
Cuyahoga OH 1,248,514 27 34 26 33 20 140 29
Orange FL 1,348,975 19 28 35 34 31 147 31
Duval FL 937,934 31 31 28 30 30 150 32
Shelby TN 936,961 34 36 31 26 35 162 33
Marion IN 950,082 30 32 34 35 33 164 34
Philadelphia PA 1,580,863 36 37 37 38 21 169 35
Milwaukee WI 952,085 33 33 33 36 34 169 35
Fresno CA 989,255 37 35 36 31 37 176 37
Bronx NY 1,471,160 38 38 38 37 38 189 38
*All counties in the United States with a population between 900,000 and 1,600,000 in 2017
**Adjusted for cost of living
Source: American Community Survey 2017. Census Bureau Population Estimates, April 2018.
7FINAL REPORT
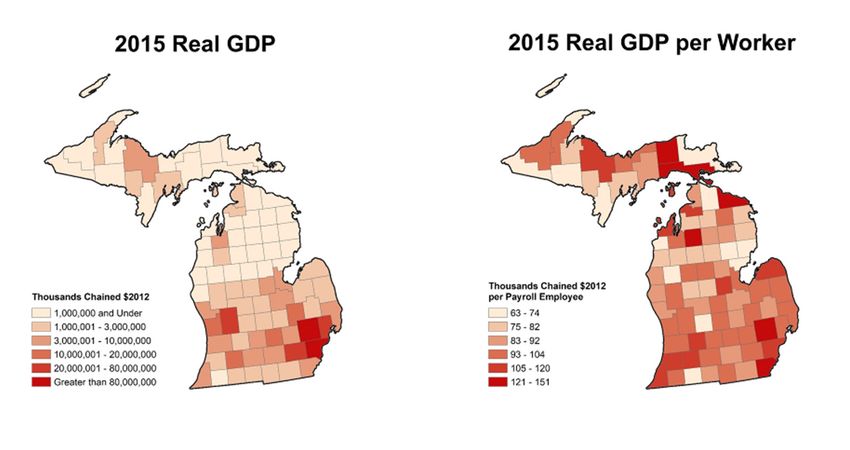
COUNTY LEVEL REAL GDP
The Bureau of Economic Analysis recently released prototype statistics for annual Gross
Domestic Product (GDP) by county covering the years 2012–2015. The left-hand map
in figure 3 shows 2015 real GDP for each of the 83 counties in Michigan.
GDP measures the value of all of the goods and services produced in a particular location
over a specific time period. Real GDP adjusts that measure for inflation, in this case to
be expressed in 2012 dollars.
Oakland County’s real GDP was $101 billion in 2015. That was the largest GDP out of
all of the counties in Michigan, about 25 percent larger than the next-largest level, in Oakland County’s real GDP
neighboring Wayne County. In fact, Oakland County accounted for 23 percent of Mich- was $101 billion in 2015, the
igan’s real GDP in 2015. largest out of all counties in
Michigan and 23 percent of
Private service-producing industries accounted for 76.1 percent of Oakland County’s the state total.
real GDP in 2015. Private goods-producing industries accounted for 19.8 percent, while
government accounted for just 4.2 percent. Relative to Michigan overall, a higher share
of Oakland County’s GDP comes from private-sector service industries and a lower
share comes from government.
Figure 3. Michigan County-Level GDP
The right-hand map in figure 3 shows 2015 real GDP divided by the number of payroll
employees, or output per worker, for each of Michigan’s counties. Oakland County’s In 2015, Oakland County’s
output per worker was $143,100 in 2015, about 32 percent higher than the state average. output per worker (real
Oakland’s level ranked fourth out of the state’s counties. GDP divided by the number
The three counties with higher levels of output per worker in 2015 were Kalkasa, Luce, of payroll employees) was
and Mackinac, each of which had fewer than 5,000 payroll employees. We believe that $143,100, about 32 percent
the small sizes of those counties’ workforces mean their rankings on this measure should higher than the state aver-
be taken with a grain of salt. age.
Wayne County had real output per worker of $115,400 in 2015, which was 19.4 percent
lower than Oakland’s level. Kent, Macomb, and Washtenaw Counties, with the state’s
third- through fifth-largest economies, all had real output per worker near $100,000,
roughly 30 percent lower than Oakland’s.
8OAKLAND COUNTY ECONOMIC OUTLOOK 2019–2021
Private sector output per worker in Oakland County was even higher in 2015 than the
overall level, at $146,400. In the government sector, output per worker was $95,200.
Oakland operates within a broader economic environment that has ramifications for our
outlook for the county. As we extend our analysis into the future, we start with a sum-
mary of the national outlook.
NATIONAL OUTLOOK: 2019–21
The future course of the Oakland County economy depends in part on the overall health
of the national economy. Forecasts of economic indicators for the U.S. economy in
2019–20 are from a release on March 18, 2019, by Jacob Burton, Gabriel Ehrlich, Daniil
Manaenkov, Owen Nie, and Aditi Thapar of the Research Seminar in Quantitative Eco-
nomics (RSQE) at the University of Michigan; they also provided internally generated
extensions of the forecast to 2021. The national outlook is summarized in figures 4, 5,
6 and 7 by economic indicators that are important to Oakland’s economy.
Figure 4. Growth in U.S. Real GDP, 2017–21
Real GDP grew by 2.9 per-
cent in 2018 on par with
The best single measure of the U.S. economy is inflation-adjusted, or real, Gross Do- 2015 as the strongest perfor-
mestic Product (GDP), which comprises all of the goods, services, and structures pro- mance of this business cycle
duced in the economy. As shown in figure 4, real GDP grew by 2.9 percent in 2018, on expansion.
par with 2015 as the strongest performance of this business cycle expansion. Growth
slowed during the course of 2018, however, from an annual rate of 4.2 percent in the
second quarter to 2.2 percent in the fourth quarter. It appears that real GDP
growth will continue
It appears that real GDP growth will continue through June 2019, thus establishing a
through June 2019, thus es-
record for the longest economic expansion in U.S. history.
tablishing a record for the
We expect GDP growth to decelerate over the next few years, as the temporary boost longest economic expansion
from the tax cuts in the Tax Cuts and Jobs Act of 2017 and the extra federal spending in U.S. history.
from the fiscal 2018 and 2019 budgets both fade.
We expect the Federal Reserve to slow its recent pace of monetary tightening going
We are projecting real GDP
forward. We foresee one additional increase in the range for the federal funds rate this
growth of 2.4 percent in
year and one more in 2020 followed by a flat path in 2021.
2019, 1.8 percent in 2020,
Overall, we are projecting annual real GDP growth to register 2.4 percent in 2019, 1.8 and 1.5 percent in 2021 as
percent in 2020, and 1.5 percent in 2021. the fiscal stimulus fades.
9FINAL REPORT
Our forecast assumes a relatively rosy scenario for international trade relations, with no
further tariffs imposed by the United States or retaliatory tariffs by other nations. If trade We view the most prominent
tensions begin to worsen again, our forecast could prove to be too optimistic. risk to our forecast as the
possible eruption of an inter-
Although we are projecting growth to slow down over the next few years, our baseline
national trade war.
outlook does not include a national recession over the forecast horizon. We believe that
the Fed will be able to engineer a so-called “soft landing,” with growth slowing but not
venturing into negative territory.
We view the most prominent risk to our forecast as the possible eruption of an interna-
tional trade war. Although the recently enacted tariffs on Chinese products should not
push us into a recession on their own, an escalating cycle of retaliatory tariffs between
the United States and its trading partners does run that risk.
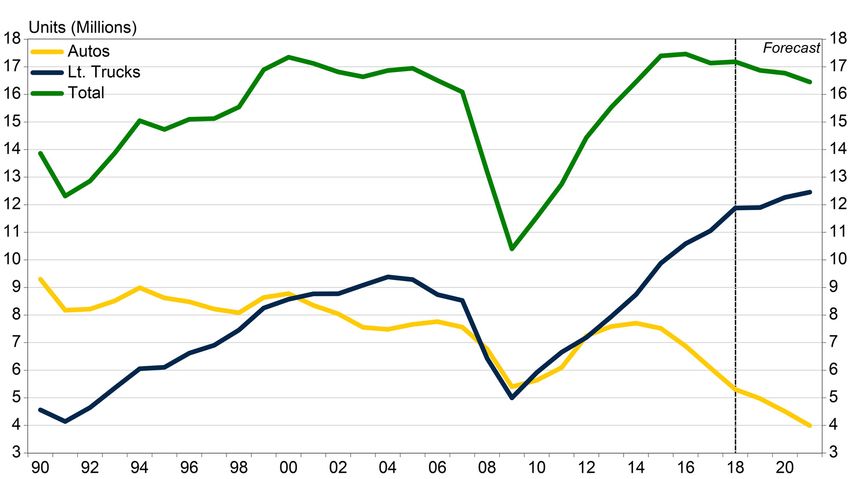
Another important input to the outlook for Oakland is the national vehicle sales forecast.
From a longer-term perspective, total sales of U.S. light vehicles—cars, minivans, sport
Total sales of U.S. light vehi-
utility vehicles, crossovers, and pickup trucks—exceeded 16 million units in every year cles grew every year from
from 1999 through 2007 before plunging to 13.2 million units in 2008 with the onset of 2009 to 2016, when they set
the Great Recession, as shown in figure 5. Sales bottomed out at 10.4 million units in an all-time record of 17.5
2009, and then grew every year through 2016, when they set an all-time record of 17.5 million units. Sales then
million units, although that pace now feels like a hazy memory. Sales came to 17.2 mil- downshifted in 2017–18 to
lion units in 2018, a slight uptick from 2017. between 17.1 and 17.2 mil-
We are projecting light vehicle sales to fall to 16.9 million this year before sliding to lion units.
16.8 million in 2020 and 16.5 million in 2021.
Figure 5. U.S. Light vehicle Sales, 1990–2021 We see sales decelerating a
bit further to 16.9 million
units in 2019, 16.8 million in
2020, and 16.5 million in
2021.
The decline is driven by automobiles, as light truck sales, which include minivans,
SUVs, and CUVs, continue to grow at a moderate pace. We see the light truck share of
vehicle sales edging up to 76 percent of the market in 2021.
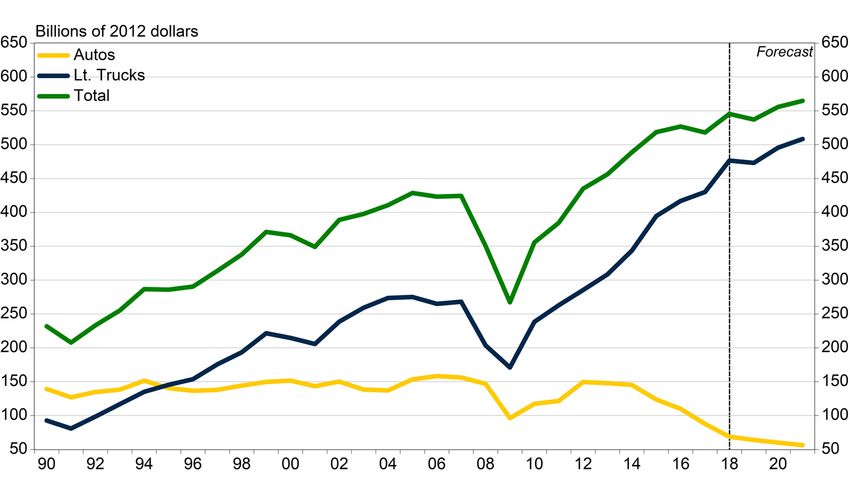
The decline in unit sales of light vehicles over our forecast period obscures a more heart-
ening trend, which is that real U.S. light vehicle output continues to inch up as shown in
figure 6.
The difference between the trends for sales and real output, or value added, arises from
the diverging fortunes of automobiles and light trucks. Since light trucks contain more
10OAKLAND COUNTY ECONOMIC OUTLOOK 2019–2021
value added than automobiles, the continued growth of light truck sales outweighs the
Despite the decline in the
decline in auto sales when it comes to vehicle output. We forecast average growth of 2.2
number of vehicles sold we
percent per year in real output of light trucks from 2018 to 2021, compared with an expect that the real dollar
average decline of 6.5 percent per year in automobiles. value of vehicle output will
We expect total real U.S. light vehicle output to grow from 546 billion chained 2012 increase as buyers shift from
dollars in 2018 to 565 billion dollars in 2021, for a modest average growth rate of 1.2 cars to light trucks, mini-
percent per year. That growth is better than the declines we expect for unit sales, but it vans, SUVs, and CUVs.
is still slower than the average annual growth rate of 5.6 percent recorded between 2011
and 2018
Figure 6. U.S. Light Vehicle Output, 1990–2021
The Detroit Three’s share of the light vehicle market fell from 42 percent in 2017 to 41.7
percent last year as the overall market eked out a small gain, as shown in figure 7.
We see the Detroit Three share dipping a bit further to 41.4 percent in 2019 before nudg-
ing back up to 41.5 percent in 2020 and 2021.
When combined with our outlook for the total light vehicle market, this projection yields
a declining profile for Detroit Three sales. Detroit Three sales fall from 7.2 million units We forecast Detroit Three
per year in 2017 and 2018 to 7.0 million units per year in each of 2019 and 2020. They sales to fall from 7.2 million
then fall a bit further to 6.8 million units in 2021. units in 2017 and 2018 to 7.0
million in each of 2019 and
Our forecast makes several relatively optimistic assumptions: that this year’s contract 2020. They then fall a bit
negotiations between the United Autoworkers and the Detroit Three automakers are further to 6.8 million units in
completed without a prolonged work stoppage; the United States-Mexico-Canada 2021.
Agreement is ratified successfully in all three nations; the Trump administration does
not impose new tariffs on automotive imports from the European Union; and the trade
tensions with China do not result in any substantial new tariffs.
We now turn to our view of the prospects for the Oakland County economy through
2020.
11FINAL REPORT
Figure 7. U.S. Light Vehicle Sales, Total vs. Detroit Three, 2017–21
OAKLAND COUNTY OUTLOOK: 2019–21
The economic outlook for Oakland County through 2020 is measured using information
on employment, unemployment, inflation, and the real wage. First, we consider the local
rate of inflation.
Inflation
Local inflation is measured in figure 8 by the growth rate of the Detroit Consumer Price
Index (CPI). Consumer price data are compiled at the regional level; they are not avail-
able for the county in isolation.
Since 1990, Detroit CPI inflation has averaged 2.2 percent per year, about three-tenths
of a percentage point lower than the average U.S. rate of 2.5 percent.
Local and national inflation both registered 2.4 percent in 2018, pushed upward by a
Local prices rose 2.4 percent
large increase in energy prices that persisted through most of the year. That was the
in 2018, pushed upward by a
highest level since 2011, when Detroit CPI inflation registered 3.3 percent and national large increase in energy
CPI inflation clocked in at 3.1 percent. prices that persisted through
Energy prices tumbled toward the end of 2018 and the start of 2019, which should cause most of the year.
inflation to dip this year. We are forecasting national inflation of 1.8 percent and local
inflation of only 1.5 percent for the year. We are forecasting local in-
flation of 1.8 percent per
Inflation then inches back up toward the Federal Reserve’s target of 2.0 percent as energy year in 2020 and 2021. Na-
prices stabilize. We are forecasting local inflation of 1.8 percent per year in 2020 and tional inflation runs one-
2021. National inflation runs one-tenth of a percentage point higher than local inflation tenth of a percentage point
in each of those years. higher than local inflation in
each of those years.
12OAKLAND COUNTY ECONOMIC OUTLOOK 2019–2021
Figure 8. Inflation Rate, Detroit and U.S. CPI 1990–2021
Next, we evaluate the county’s prospects for job growth in total, putting that in context
with recent job market developments.
Employment Path
On a quarterly basis, using our estimates for the end of 2018, Oakland County has now
completed nine consecutive years of job growth since the previous recession’s low point
at the end of 2009. (The small number of job losses recorded in 2010 is a statistical On a quarterly basis, Oak-
artifact that results from calendar-year averaging. The county actually gained jobs in land County has now com-
each quarter of the year, but not quickly enough to take the annual average above its pleted nine consecutive
level the previous year.) The slowdown in job growth to the rate of 1.0 percent in 2017 years of job growth.
was a temporary hiccup partially brought on by statistical revisions. The pace of growth
bounced back in 2018 to 1.3 percent.
Figure 9. Annual Job Growth in Oakland County, 1991–2021
13FINAL REPORT
We expect growth of 1.4 percent in 2019, 1.5 percent in 2020, and 1.4 percent in 2021. We forecast gains of 10,300
That growth translates into gains of 10,300 jobs this year, 10,900 in 2020, and 10,300 in jobs (1.4 percent) in 2019,
2021 as shown in figure 9. 10,900 (1.5 percent) in 2020,
and 10,300 (1.4 percent) in
In total, we are forecasting 31,600 job additions over our forecast period, an average 2021—cumulating to 31,600
pace of 1.4 percent per year. That is a substantially faster pace than we currently antici- job additions over our three-
pate for both the United States and the state of Michigan over our forecast period. year forecast period, an av-
If our forecast proves correct, the span of Oakland’s current recovery will extend to at erage pace of 1.4 percent—
least twelve years, the longest stretch of time for which we have records. The county’s substantially faster than our
upward trajectory continues to be supported by its strong economic fundamentals. forecast for both the nation
and state.
To put Oakland County’s recovery from the Great Recession into perspective, in figure
10 we plot the quarterly path of the county’s total employment, adjusted for seasonal If correct, our forecast ex-
variations, from the beginning of 2000 to the end of our forecast period in 2021. We tends Oakland’s recovery to
include the same path for Michigan, with both the county and state employment paths at least twelve years, the
indexed to equal 100 in the second quarter of 2000, when Michigan reached its peak longest stretch of time for
employment level.2 which we have records.
Figure 10. Total Jobs in Oakland County vs. Michigan, Seasonally Adjusted, First
Quarter of 2000 to Fourth Quarter of 2021
Oakland County reached its peak employment level in the third quarter of 2000 before
losing 166,500 jobs from then until the fourth quarter of 2009, it’s Great Recession-era
low point—a decline of 21.6 percent from its peak employment level. From the spring of 2000 to
Oakland’s decline was more severe proportionally than Michigan’s peak-to-trough de- the county’s low point in the
cline from the second quarter of 2000 to the third quarter of 2009. Michigan lost 859,100 fall of 2009, the county lost
jobs in that time, 18.3 percent of its peak level. Oakland’s labor market has recovered 166,500 jobs. Then the re-
covery followed: from the
fall of 2009 to the fall of
2018, Oakland gained back
2
Using index values permits us to compare on the same figure two regions with widely different 136,100 jobs.
employment scales. To clarify: an index value of 90 indicates that employment in the relevant
period is 90 percent of its level in the base period (in this case, the second quarter of 2000), that
is, it’s 10 percent less than the base period value. An index value of 110 indicates a level of
employment that is 10 percent higher than its level in the base period.
14OAKLAND COUNTY ECONOMIC OUTLOOK 2019–2021
more vigorously from the recession than Michigan’s overall. We estimate that Oakland
From yearend 2018 to year-
recovered 136,100 jobs from the end of 2009 to the end of 2018.
end 2021, the county is fore-
We forecast that Oakland County will create an additional 32,100 jobs from the end of cast to create an additional
2018 to the end of 2021. (That total differs slightly than the total using calendar-year 32,100 jobs, cumulating to
averages reported alongside Figure 9 because it is from the end of 2018 to the end of 168,200 job additions from
2021.) the bottom of the downturn
through 2021, more than re-
In our forecast, Oakland County sets a new employment peak in the summer of 2021.
plenishing the jobs lost dur-
By contrast, the state as a whole is forecast to remain four percentage points below its
ing the first decade of the
peak employment level in that quarter.
2000s.
The more vigorous job growth we are projecting for Oakland County relative to Michi-
In our forecast, Oakland
gan overall means that the gap between the two index lines in the figure continues to
County achieves a new em-
grow, from 1.8 index points at the end of 2018 to 4.0 points at the end of 2021.
ployment peak in the summer
Job Change by Industry Wage Category, 2018–21 of 2021.
The job change in Oakland County from 2018 to 2021 is distributed in table 4 across
industry sectors based on each industry’s average wage, showing for the forecast period
the same data that table 2 presented for the years 2010 to 2018. The categories are
higher-, medium-, and lower-wage industries. The method for partitioning the data is
outlined in the text for table 2.
The last column of table 4 shows, on a percentage basis, our forecast of job growth
among the higher-, middle-, and lower-wage industries over the next three years. On a
percentage basis, we are forecasting that job growth will be similar in all industry wage
categories over the next three years. Employment in both higher-wage and lower-wage
industries is expected to increase by 4.4 percent, while employment in middle-wage in-
dustries will grow by 4.1 percent.
Table 4. Job Change in Oakland County by Industry Wage Category, 2018–21
Change % Change
2018 2021 2018–2021 2018–2021
Total all industries 737,602 769,172 31,570 4.3
Higher-wage industries ($75,000 or more) 246,854 257,684 10,830 4.4
Middle-wage industries ($35,000 to $74,999) 321,722 335,012 13,290 4.1
Lower-wage industries (under $35,000) 169,026 176,476 7,450 4.4
On a percentage basis, we
forecast job growth to in-
Source: BLS, Quarterly Census of Employment and Wages. Higher-wage industries have an average wage in crease between 4.1–4.4 per-
2017 at least 35 percent above the U.S. average ($55,390) and lower-wage industries at least 35 percent below
the U.S. average. cent across all wage catego-
ries from 2018–21. In terms
One factor we see boosting growth in the middle-wage industries is the government sec- of job counts, more than
tor’s return to growth in Oakland County. Government employment started increasing three-quarters of the net new
in the county in 2016, and we expect its growth to continue at a modest pace over the jobs are created in higher-
forecast period. and middle-wage industries.
In terms of job counts, the higher- and middle-wage industries account for over three-
quarters of the net new jobs created in the county from 2018 to 2021.
Employment by Detailed Industry Category
The projected job movements in total shown for 2018–21 in figure 9 are distributed
among twenty-eight major industry divisions in table 5, and into 204 finer industry divi-
15FINAL REPORT
sions in appendix A. The detail for the employment forecast presented in table 5 in-
cludes, for each industry, the level of employment in 2018 (including three quarters of
preliminary data); the forecast change for 2019, 2020, and 2021; and the cumulative
change over the three-year period 2018–21. The table also includes the average annual
wage for each industry category in 2017 (as does appendix A).3 The government sector
The government sector turned the corner to job growth in 2016 after ten consecutive turned the corner to job
years of job losses, and growth continued in 2017 and 2018. We believe the rebound in growth in 2016 after ten con-
government employment is here to stay. We expect job gains to average around 1.1 per- secutive years of job losses,
and growth continued in
cent per year over the forecast period, for a total of 1,516 job additions from 2018 to
2017 and 2018. We are fore-
2021. The path of those gains is uneven over the forecast period because temporary
casting these gains to con-
workers hired to help conduct the 2020 Census boost the job count for that year. None-
tinue, at an average pace of
theless, the growth that we foresee in the government sector through 2021 does not keep 1.1 percent per year from
pace with growth in the private sector. 2018–2021.
Private-sector employment grew 3.1 percent per year in the first four years of the eco-
nomic recovery, from 2009 to 2013. The pace of growth then slowed to 2.2 percent per
year between 2013 and 2016. In 2017, the number of private-sector jobs in the county
only grew by 1.0 percent, partly because of statistical revisions that reassigned some
professional and technical services jobs to locations outside the county.
In 2018, job growth picked up to 1.3 percent. We are forecasting that jobs in the private
sector will expand at a rate of 1.4 percent in each of the next three years, cumulating to
30,055 total jobs; accounting for 95 percent of all job gains in the county.
The construction industry accounts for 97 percent of the jobs in the aggregate industry The construction industry
category of natural resources, mining, and construction. The category adds 2,124 jobs continues to benefit from a
over the next three years, as residential construction continues to pick up. Specialty pickup in residential con-
trades contractors account for 1,544 total job additions, and residential building contrac- struction, adding 2,124 jobs
tors account for another 281 job gains. over the next three years.
Job growth in the manufacturing sector had been slowing prior to 2016, from 5,756 job
additions in 2011 to just 655 in 2015. The sector rebounded nicely with 2,185 new jobs Growth in the manufactur-
in 2016 and 2,386 new jobs in 2017, but 2018 saw a return to slower growth with only ing sector slowed to just 523
523 job additions. We expect job gains in manufacturing to continue, but at a modest job additions in 2018. We
pace of 688 in 2018, 428 in 2020, and 259 in 2021. expect similar growth over
Transportation equipment (motor vehicle) manufacturing led growth in the early stages the forecast period for a to-
of the recovery, with a total of 5,328 job additions in 2011 and 2012 combined. Growth tal of 1,435 new jobs.
slowed to an average of only 263 job additions per year from 2013 to 2016. The industry
unexpectedly added 1,450 jobs in 2017, but job gains slipped to only 69 in 2018. Over
the next three years we expect transportation equipment manufacturing to add a total of Motor vehicle manufactur-
569 jobs, due in large part to the expansion of production activity at General Motors’ ing contributed only 69 new
Lake Orion assembly plant. jobs in 2018. We see job
growth totaling 569 jobs
over the forecast period in
this sector, due in large part
to the expansion of produc-
tion activity at General Mo-
tors’ Lake Orion assembly
3
The historical employment data are from the Bureau of Labor Statistics Quarterly Census of plant.
Employment and Wages. The average annual wage includes both full- and part-time workers,
weighted equally. Consequently, the average wages for industries that employ a disproportion-
ately large number of part-time workers, such as retail trade and leisure and hospitality, are much
lower than they would be if the wages were calculated only for full-time workers.
16OAKLAND COUNTY ECONOMIC OUTLOOK 2019–2021
Table 5. Forecast of Jobs in Oakland County by Major Industry Division, 2018–21*
Average
Estimate Forecast Employment Change Annual Wage
2018 2018–2019 2019–2020 2020–2021 2018–2021 2017
TOTAL JOBS (Number of persons) 737,602 10,347 10,941 10,282 31,570 61,536
(Annual percentage change) (1.3) (1.4) (1.5) (1.4) (1.4) N.A.
TOTAL GOVERNMENT 45,417 459 940 117 1,516 53,785
TOTAL PRIVATE 692,184 9,888 10,001 10,165 30,055 62,047
GOODS-PRODUCING 94,383 1,421 1,141 936 3,499 79,414
Natural resources, mining,
27,061 734 713 677 2,124 71,196
construction
Manufacturing 67,322 688 428 259 1,375 82,674
Fabricated metal products 10,357 35 -102 -178 -245 61,646
Machinery 11,565 58 98 74 230 83,196
Transportation equipment
21,829 272 172 125 569 105,481
(motor vehicles)
Other manufacturing 23,571 323 261 237 821 70,842
PRIVATE SERVICE-PROVIDING 597,801 8,467 8,860 9,229 26,556 59,302
Trade, transportation and utilities 130,449 940 914 1,024 2,878 54,477
Wholesale trade 37,369 303 424 445 1,172 96,191
Retail trade 79,289 262 202 280 744 34,838
Transportation, warehousing
13,792 375 289 299 963 57,402
and utilities
Information 14,946 178 68 78 324 80,946
Financial activities 53,751 857 843 855 2,555 83,436
Finance and insurance 37,262 498 481 490 1,468 97,254
Real estate and rental and leasing 16,490 359 363 365 1,087 52,835
Professional and business services 187,339 2,470 2,772 2,726 7,969 76,995
Professional, scientific, and
103,944 2,537 2,247 2,197 6,980 91,429
technical
Management of companies and
18,364 226 194 -33 387 124,769
enterprises
Administrative support and waste
65,031 -293 331 562 601 43,089
management
Private education and health services 116,531 2,444 2,494 2,702 7,641 50,170
Private education services 11,118 226 115 127 467 44,851
Health care and social assistance 105,412 2,219 2,379 2,575 7,173 50,761
Leisure and hospitality 70,898 1,602 1,549 1,576 4,727 21,682
Other services 22,498 0 218 268 487 35,591
Unclassified 1,390 -25 0 0 -25 50,427
*Some subtotals do not add to totals due to rounding of annual average computations.
Employment growth in all other manufacturing industries averaged 3.4 percent per year
from 2012 to 2017, compared with 2.5 percent per year in transportation equipment. Job
growth in the non-auto manufacturing industries slowed to 1.0 percent in 2018. We ex- Employment growth in non-
pect job growth to continue to slow over the next three years, to 0.9 percent in 2019, 0.6 auto manufacturing indus-
percent in 2020, and 0.3 percent in 2021, for a total addition of 805 jobs. tries slowed to 1.0 percent in
2018. We expect growth to
Machinery and chemicals account for over one-half of these job gains over the forecast slow further to 0.9 percent in
period, adding 230 and 218 jobs, respectively. The fabricated metals industry is forecast 2019, 0.6 percent in 2020,
to lose 245 jobs over the next three years. and 0.3 percent in 2021, for
a total addition of 805 jobs.
17FINAL REPORT
Employment in wholesale trade4 is forecast to grow 1.0 percent per year over the next
Wholesale trade sees job
three years, cumulating to 1,314 job additions. Motor vehicle and parts merchant whole- growth of 1.0 percent per year
salers account for over half of those job gains (623). over the next three years, led by
motor vehicle and parts mer-
Retail trade is a much larger sector than wholesale trade, but generally pays lower wages. chant wholesalers.
We are bearish on the growth prospects for retail in light of the many job cuts and store
closings that have been announced recently both nationally and in Michigan. Online We are bearish on the growth
competition, technological advances, and the growth of big-box retailers that are less prospects for retail trade em-
labor-intensive than smaller stores all weigh on employment growth in retail trade. We ployment. Online competition,
see growth averaging just 0.3 percent per year over the forecast period, for a total of 744 technological advances, and
new jobs. We would not be surprised if growth in this sector turns out even weaker than the growth of big-box retailers
all weigh on employment
we currently expect. growth, which we see averag-
Transportation and warehousing grow at a relatively strong average rate of 2.4 percent ing just 0.3 percent per year
over the forecast period.
per year from 2018 to 2021, producing a total of 921 new jobs. Many of these new jobs
are effectively replacing jobs in brick and mortar retail stores as on-line shopping con- Transportation and warehous-
tinues to expand. ing grow at a relatively strong
average rate of 2.4 percent per
The information sector adds a total of 324 jobs over the next three years, a modest pace
year from 2018 to 2021. Many
of 0.7 percent per year. Newspaper and book publishers lose 206 jobs between 2018 and of these new jobs are effectively
2021, reflecting a long-term decline that by 2018 had claimed sixty percent of the indus- replacing jobs in brick and
try’s jobs since its peak in 2003. mortar retail stores as on-line
shopping continues to expand.
The finance and insurance industry was slow to recover in Oakland County after the
Great Recession, losing 771 jobs from 2010 to 2014. Employment in the industry then The information sector adds a
grew at a robust pace of 1,164 jobs (3.4 percent) per year between 2014 and 2017. total of 324 jobs over the next
Growth slowed sharply in 2018 to only 300 jobs (0.8 percent). We expect growth to pick three years, a modest pace of
up a bit to an average pace of 489 jobs per year over the next three years, for a total of 0.7 percent per year.
1,468 jobs. We are forecasting that depository credit intermediation establishments, such
The finance and insurance in-
as commercial banks, will show flat employment over the next three years as rising mort-
dustry is expected to add 1,468
gage interest rates take a toll. Insurance carriers, agencies, and other activity related to jobs over the next three years.
insurance are expected to fare a bit better, adding 669 jobs over the next three years.
The real estate and rental and
The real estate and rental and leasing industry grows by a total of 1,087 jobs over the leasing industry grows at an
next three years, for an average growth rate of 2.2 percent per year, as the residential real average rate of 2.2 percent per
estate market continues to improve. Most real estate agents are self-employed, and thus year over the next three years,
are not included in the payroll employment statistics presented here. as the residential real estate
market continues to improve.
From 2009 to 2018, employment in the professional and business services super-sector
grew by 51,041 jobs, an average rate of 3.6 percent per year. This super-sector accounted Employment in the professional
for 40 percent of all job gains in the county between 2009 and 2018, almost twice its and business services super-
share of total employment in 2009 (22 percent). This aggregate category contains three sector grew at a sizzling rate of
divisions: professional, scientific, and technical services; management of companies and 3.6 percent per year from 2009
enterprises; and administrative support and waste management. Many of the jobs asso- to 2018. Many of the jobs asso-
ciated with the knowledge
ciated with the knowledge economy are in this sector, which in Oakland County is economy are in this sector, and
closely identified with the motor vehicle industry. Over the next three years we expect in Oakland it is closely identi-
this super-sector to add 7,969 jobs. fied with the motor vehicle in-
dustry. Over the next three
years we expect this super-sec-
tor to add 7,969 jobs.
4
“Wholesalers sell merchandise to other businesses and normally operate from a warehouse or
office. These warehouses and offices are characterized by having little or no display of merchan-
dise. In addition, neither the design nor the location of the premises is intended to solicit walk-in
traffic.” U.S. Census Bureau NAICS industry definition. http://www.census.gov/eos/www/na-
ics/index.html
18You can also read