Enhancing Pension Adequacy While Reducing the Fiscal Budget and Creating Essential Capital for Domestic Investments and Growth: Analysing the ...
←
→
Page content transcription
If your browser does not render page correctly, please read the page content below
risks
Article
Enhancing Pension Adequacy While Reducing the Fiscal
Budget and Creating Essential Capital for Domestic
Investments and Growth: Analysing the Risks and Outcomes in
the Case of Greece
Georgios Symeonidis * , Platon Tinios and Panos Xenos

                                           Department of Statistics and Insurance Science, School of Finance and Statistics, University of Piraeus,
                                           Karaoli ke Dimitriou 80, 18534 Piraeus, Greece; ptinios@unipi.gr (P.T.); pxenos@unipi.gr (P.X.)
                                           * Correspondence: george.simeonidis@gmail.com

                                           Abstract: Many countries around the world are resorting to mandatory funded components in their
                                           multi-pillar pension systems with the purpose of catering for the financial pressure from ageing.
                                           This paper aims at analysing the possible replacement rates for such a scheme, by choosing different
                                           assumptions and setting the best combined area for the expected result. Then, an approach for
                                           analysing the potential for the implementation of such a scheme in Greece is presented along with
                                           the actuarially projected expected benefit expenditure and respective accrued capital. A result of the
                                           introduction of such a component is expected to be the elevated replacement rate at retirement with
                                           a concurrent alleviation of the fiscal burden for the state. The projected scale of savings will also
                                           provide domestic financing for investments generating growth.

                                 Keywords: funded pensions; adequacy; capital investment; growth


Citation: Symeonidis, Georgios,
Platon Tinios, and Panos Xenos. 2021.
Enhancing Pension Adequacy While           1. Introduction
Reducing the Fiscal Budget and
                                                 This paper aims to estimate the effect on replacement of the potential introduction of
Creating Essential Capital for
                                           a mandatory fully funded scheme in the Greek pension system. This goal will be achieved
Domestic Investments and Growth:
Analysing the Risks and Outcomes in
                                           by analysing three parameters and providing an approach to determining the optimal
the Case of Greece. Risks 9: 8.
                                           mix of the three. The proposed approach is based on a three-dimensional analytical tool
https://doi.org/10.3390/risks9010008       that brings together the essential parameters: (1) The average number of years of the
                                           annuity (e.g., life 2 expectancy at the age of claiming the annuity), (2) the expected return
Received: 4 November 2020                  on investments, and (3) the contribution rate applied to the pensionable earnings of the
Accepted: 23 December 2020                 nation’s participants. An actuarial projection of the benefits and contributions (assets)
Published: 29 December 2020                using the cohort method for the total of employed people in Greece is also conducted to
                                           provide an analysis of the projected effects of a possible implementation of this system on
Publisher’s Note: MDPI stays neu-          the accrued capital, the government budget and over national debt.
tral with regard to jurisdictional clai-         The Greek pension system is likely to suffer a great deal in the future due to the
ms in published maps and institutio-       population ageing, with a 16% decline in population from 2019 to 2060, while at the same
nal affiliations.                          time, it has been underfunded in the past decades (EPC 2015b, 2015c, 2018). The state is
                                           also expected to be one of the four European states to surpass 65% old-age dependency
                                           ratio in 2070 (EPC 2020). Moreover, since Greece’s population is dramatically shrinking,
Copyright: © 2020 by the authors. Li-
                                           this is expected to put great pressure on the country, with a quickly rising demographic
censee MDPI, Basel, Switzerland.
                                           dependency ratio, compared to the European average (EPC 2018). The sustainability of
This article is an open access article
                                           the system has long been in question. Recent pension reforms have proved unsuccessful
distributed under the terms and con-       in restoring the financial stability of the pension system (EPC 2015b, Symeonidis 2016).
ditions of the Creative Commons At-        The pension expenditure in Greece has exceeded 17.5%, of Gross domestic product (GDP)
tribution (CC BY) license (https://        in 2016 (Eurostat 2019) with the European average at 11.2% of GDP, while contribution
creativecommons.org/licenses/by/           rates vary from 27 to over 30% for the pension branch, being one of the highest rates in the
4.0/).                                     EU (EPC 2018). Such a burden to the economy nurtures uncertainty for pensioners and

Risks 2021, 9, 8. https://doi.org/10.3390/risks9010008                                                             https://www.mdpi.com/journal/risks
Risks 2021, 9, 8 2 of 17
undermines competitiveness. Except for the continuous legislation changes, horizontal
pension cuts have deprived some pensioners of more than 50% of their income. Losses were
heaviest among those contributing most, which is inversely proportional to reciprocity1 .
The reforms and cuts were all a result of the necessity of external funding of the Greek
economy by the European Commission, the European Central Bank and the International
Monetary Fund after the Greek prime minister turned to these for help in 2010, under ex-
treme financial conditions and near bankruptcy. In 2017 and 2018 there seems to be a slight
increase in contribution collection brought by the latest legislation, but nevertheless the
funding gap of the system remains close to 50% (Government Official Journal 2018). In this
respect, providing financial stability while securing adequate pensions and acceptable level
of consumption in retirement incomes remains a very difficult task to achieve, especially
when (Pay-As-You-Go) PAYG systems are coupled with intense population ageing.
PAYG has the dominant role in the Greek pension system, while occupational schemes
and private insurance are practically non-existent. More explicitly, PAYG (social security
benefits) payments for primary and secondary pensions in 2017 and 2018 amounts to 24
billion EUR per year (Government Official Journal 2018), while occupational pension funds
pay almost 90 million EUR (OECD.stat 2020) and private insurance companies almost 28
million EUR (Hellenic Association of Insurance Companies 2020).
Looking into the developed countries as a whole, foreseen intense population ageing
poses a financial burden in public pension systems in the present or near future. (European
Commission 2010, 2012; OECD 2015, 2017). Most European countries that have mature pay-
as-you-go (PAYG) defined benefit schemes are facing problems in financing these programs
due to program maturation, population ageing, prior promises of overly generous benefits,
changes in employment patterns or a combination of the above. The most common practice
for these countries were parametric reforms or systemic reforms, which helped public
pension systems deal with the increased financing needs (EPC 2015c, 2018).
The rest of the paper is arranged in five sections as follows. The second section
provides a brief literature review on the introduction of funded schemes internationally
and the relativity of the latter to the promotion of savings and potential growth. In the
following section, we present the methodology and all necessary equations together with
the corresponding parameters are discussed. We then present and explain the results in the
fourth section. In the final section, we make discussion on and the aforementioned results.
Further analysis is provided in the same section addressing the use of these findings in the
implementation of funded schemes, and the Greek case is specifically stressed.
2. Literature Review
Some countries decided to introduce mandatory fully funded pension schemes, as a
second tier to the PAYG tier. Recent developments have led law-makers to acknowledge
that fully funded components can be an integral part of an adequate third-age income.
In this direction, several countries, including Sweden and some Eastern Member States
such as Bulgaria, Estonia, Croatia, Latvia, Lithuania, Hungary, Poland, and Slovakia, have
switched part of their public pension schemes into (quasi-) mandatory private funded
schemes (EPC 2018). The introduction of funded pillars gained momentum across Europe
after the 1990’s (Feldstein 1995, 1996, 1998). However, the reversals which followed the
2008 economic and financial crisis actually reduced or completely eliminated the role of
funding in many countries (Bielawska et al. 2017).
One of the main arguments in favour of funded schemes is that they promote growth.
Davis and Hu (2008) argue that funding of pensions connects to higher economic growth,
especially for emerging market economies, due to higher saving rates, capital market
development and reduced labor market distortions. The OECD (2013) likewise stresses
the importance of private pensions to economic growth, looking into the institutional role
1 Horizontal pensions cuts refer to the reduction in pension amounts based on the sole criterion of the amount itself. For example, a 20% reduction of
all pensions above 1200 euros.Risks 2021, 9, 8 3 of 17
of private funds, while the latter continue to grow and invest. (Bijlsma et al. 2014) link
growing pension savings to general economic growth, through the investment of fund
assets. Zandberg and Spierdijk (2013) conclude that the long-run effect on growth borne
out of funded pensions is positive when using estimates from a model with overlapping
observations, but the effect is not the same when a simple cross-sectional model is used.
However, both Davis and Hu as well as Zandberg and Spierdijk (2013) have been challenged
by (Cavallini et al. 2013). The latter proceeded to re-estimate the Davis and Hu (2008) by
using the total pension fund assets definition of Zandberg and Spierdijk (2013) and a more
sophisticated common correlated effects mean group (CCEMG) and common correlated
effects pooled (CCEP) estimators (accounting for a multifactor error structure) for 12 OECD
countries over the period 2001–2010. (Cavallini et al. 2013) have ultimately found no
evidence of a long-term relationship between pension fund assets and economic growth.
Overall, the preliminary data for 2019 show that pension funds held USD 32.3 tril-
lion in the OECD area (OECD 2020) while the nominal investment rates of return of all
funded and private pension plans vary between 2.3% and 9.7% for the years 2015–2019
(OECD 2019a).
Having said that, let there be no doubt that funded schemes, as PAYG schemes, also
come with flaws. After all, the main question that Lindbeck and Persson (2003) asked
before reforming the Swedish pension system, whether there is an ideal system, remains
rhetorical in essence. On the one hand, according to Barr (2000) it would be possible to
achieve essentially the same result by making similar benefit cuts and tax increases in the
existing PAYGO DB schemes, but this has not proved to be very successful, maybe because
of the political implications it involves, rather than introducing a new pension type. On
the other hand, in the funded schemes, fluctuations in stock and bond markets are the
principal risk experienced by investors; this is why a funded component must always
be part of a cohesive savings strategy including the other, ostensibly safer, pillars and
components. More specifically, Góra and Palmer (2020) conclude that, although funded
schemes are expected to generate a higher rate of return than notional funded schemes, they
are considerably more volatile, which makes them appropriate for a second pillar but not a
first universal (mandatory) public pillar. As regards the differences in efficiency between
fully funded and notional schemes, Góra and Palmer (2004) further compare the efficiency
of the fully funded schemes as opposed to other types of schemes concluding amongst
other that the fully funded schemes are potentially superior to notional schemes because
they can create saving and promote financial market development. Finally, Holzmann
and Hinz (2005) argue that successful reform of pensions depends first and foremost on a
careful consideration of the macroeconomic and fiscal environment and whether the latter
can support the reform.
3. Methodology
3.1. Funded Schemes—Formulas and Parameters
Let us analyse the three parameters mentioned above (annuity, return on investment,
contribution rate) and build on the logic of our calculations. The idea behind funded
systems is that each contributor sets aside a certain amount of money per period of time; in
the end of their working life, they get back the accumulated funds. These correspond to
the future present value of the amounts paid, increased by the return on investment, and
paid out in the form of a lifelong pension flow (annuity).
Hence, a simplified formula describing the accrued amount would be:
n
Acc = ∑ i =1 X (1 + i ) n (1)
where:
Acc: is the accrued amount at retirement,
X: is the amount of contributions per year (assumed fixed),
i: is the yearly rate of return on investment,Risks 2021, 9, 8 4 of 17
n: is the number of years of contribution
3.1.1. The Baseline Scenario Analysis
Let us assume that a new mandatory, fully funded system starts today, without any
financial burden from past commitments. The potential transition from an already existing
system and its financial burden is not analyzed in this paper and could be a topic for further
analysis. A critical indicator in such a system is the projected replacement rate at the time of
retirement. The replacement rate is defined as the fraction of the first pension amount, over
the last wage. Sometimes, yet not in this paper, the denominator is also computed as the
average career income instead of the last wage, which introduces an element of confusion.
In order to calculate representative replacement rates for the fully funded system, we first
have to further specify formula (1).
Starting from formula (1) and looking into a more complex case, we can account for
income variability and maturity, in order to calculate the required contribution rate as a
percentage of a specific amount of income (e.g., 6% on earnings). In addition, we can take
into account a percentage of expenses on contributions. In this context, the accrued amount
at time n shall be given by:
1
Accn = Xn ∗ (1 − E)(1 + i ) 2 + Accn−1 (1 + i ) (2)
where:
Accn : is the accrued amount at time n,
Xn : is the amount of contributions at time n as percentage of income, before expenses,
E: is the percentage of expenses on contributions,
i: is the yearly rate of return on investment,
n: is the number of years of contributions
The annual return rate on investment (i) is assumed to be constant for the purpose of
simplicity. Payments are assumed monthly; hence, the amount of the last year is multiplied
1
by (1 + i ) 2 as if there were one payment in the middle of the year, to simplify.
Let us use formula (2) and proceed to calculate the replacement rate for a proposed
funded scheme. To do that, certain additional assumptions are needed. These are the salary
maturity per year2 , a possible contribution rate which would serve as a norm or as the
minimum3 , an expense rate on contributions and a real return rate (after expenses).
An annuity is needed to convert the funds accumulated into a pension at retirement.
In most of the developed countries but also elsewhere, recent legislation and reform trends
indicate a full working career of about 40 years for a full pension and the retirement
age thresholds are typically at an age between 62 and 67 years. In this paper, the full
career is assumed to be close to the maximum, hence 40 years. We shall also assume an
average/representative annuity of 15.64, which is a joint annuity based on EVK20004 and
HAS5 2005 tables. This annuity corresponds to the Greek mandated (67) age threshold
which is slightly higher than the effective retirement age in most cases. However, given
extensive reforms over the bailout period, forward-looking assumptions may reasonably
differ from historical data. Since, however, the mortality tables come in many variations
according to country, e.g., continent, race, employment, and so on, so other values for the
annuity are also assumed in the sensitivity analysis.
2 The percentage of increase of a person’s salary due to legislated increase based on more years of work, an increase in pay or a promotion.
3 Legislators are expected to present people with a standard percentage of contribution to either begin with or serve as the standard where choice is
not made.
4 EVK2000 is the official mortality table for valuations reported to the Secretariat-General for Social Insurance, based on Gazette B1432/2006,
Ministerial Decision 2. Mortality of Greeks is greater than that of the Swiss, a fact which provides better benefits when the EVK2000 is used for the
Greek population.
5 Hellenic Actuarial Society.Risks 2021, 9, 8 5 of 17
Since we are looking into a scheme that is mandatory, a minimum contribution rate
on pensionable earnings is assumed for organizational reasons. This will be set at 6% of
pensionable earnings to begin with, based on European experience (European Commission
2008). Further analysis on other possible contribution rates is provided in the sensitivity
scenarios. Other assumptions include 0.5% maturity per year on income and an expense
rate of 0.5% on contributions.
The real return rate (RRR) is our final and maybe the most important variable and
should be thoroughly investigated before selecting a working assumption for our baseline.
Firstly, there is a case to be made about current returns being very low because of quantita-
tive easing6 in an attempt to reduce the effects of the recent monetary crisis that started
in 2008 (Rajan 2019) and more recently with the depression that started in February 2020
due to the COVID-19 pandemic. In his comparative report, covering almost 200 pension
funds, with more than 3 trillion assets under management/advisement, in 50% of pension
plan respondents, quantitative easing was reported to have undermined the longer-term
financial viability of pension plans. At the same time, 62% of respondents reported that
quantitative easing has overinflated the value of pension liabilities via zero-bound interest
rates. It is also mentioned that falling rates also inflate the present value of future liabilities,
as measured under prevailing pension regulation. As a ball park estimate, the report men-
tions, a 1% fall in rates delivers a 20% rise in pension liabilities and a 10% fall in the funding
ratio—a measure of a plan’s ability to meet its future commitments. As with very low or
zero interest rates, negative interest rate policy also creates problems as regards pension
returns as these exacerbate effects of low (but positive) policy rates and quantitative easing
(IMF 2017).
Expanding the view to a longer period, as regards future returns, Gratton and Scott (2018)
argue that it is important to use longer historical data periods for forecasts, as many as
100 years or even more. Based on data from Credit Suisse, they calculated return rates
for many large countries for the years 1900 to 2014 and concluded that the long-term
returns for zero-risk investments was close to 2% for the US, but 6.4% for risk premiums.
Consequently, for a mixed portfolio of 50% zero risk bonds and 50% stocks, one would
earn 4.2% on average in the long term. For the UK, the respective return is 3.5%. The
average historical returns for the US, the UK, Japan, Germany, France, and Australia are
2.8% above inflation. In the OECD (2015, 2017, 2019b), the real rate of return on funded,
defined contribution pensions for calculations is assumed to be 3% per year.
In the Pension Adequacy Report (European Commission 2018), the assumed rate for
the base case is 3% while the interest rate assumed to calculate the annuity is 0.8% lower
than the assumed rate used during the accumulation phase, in order to account for the cost
of buying the annuity, administrative and management expenses.
Based on the analysis of the averages of the 20-year through 30-year maturity of the
Zero-coupon yield curve spot rates of AAA-rated euro area central government bonds
and the whole euro area central governments bonds (Eurostat 2018), we see in the table
below that the averages vary between 2.12% to 2.76%. This gives values, which have to
be assumed as minima, as the whole period of the crisis is included. Table 1 contains
zero-coupon yield curve spot rates for all Euro Area (EA) bonds as well as all AAA bonds,
for different time intervals and years of maturity.
6 Quantitative easing (QE) is a form of unconventional monetary policy in which a central bank purchases longer-term securities from the open
market in order to increase the money supply and encourage lending and investment. Buying these securities adds new money to the economy,
and also serves to lower interest rates by bidding up fixed-income securities. It also expands the central bank’s balance sheet. Source: https:
//www.investopedia.com/.Risks 2021, 9, 8 6 of 17
Table 1. Zero-coupon yield curve spot rates.
All EA Average AAA Average All EA Average AAA Average
Maturity/Time
10 (2008–2017) 10 (2008–2017) 10 (2004–2013) 10 (2004–2013)
Maturity: 10 years 2.82 2.12 3.86 3.38
Maturity: 20 years 3.50 2.73 4.38 3.88
Maturity: 25 years 3.61 2.77 4.46 3.91
Maturity: 30 years 3.65 2.76 4.48 3.90
Source: (Eurostat 2018), calculations by authors.
If we look back at earlier years, the respective values are much higher, reaching 5%
for the years 2004–2013. If we looked back at the data even before the crisis started, the
rates would rise even more. For example, the respective spot rate for 20-year maturity of
EA bonds was 5.5% in 1999 (Eurostat 2012). The deep correction during the Greek crisis
could imply, as happened in the cases of Spain, Cyprus and Portugal, some re-alignment
concerning returns especially in the first post crisis years. In conclusion, the baseline case, a
3.5% return is a prudent assumption for a time period close to the full working career. The
authors do take into account that there is intense discussion (Lukaszl and Summers 2019;
Schmelzing 2020) about the long-term decline on returns and treat this issue with sensitivity
analysis in Section 3.1.2.2, where a minimum return of 2% is chosen.
Blending the two aforementioned inquiries, we choose RRR in our basic scenario to
be 3.5%. Using the assumptions mentioned before and outlined in Table 2, we estimate
that the replacement rate is calculated at 26.02% for 40 years or 0.65% yearly, for an annuity
of 15.64 years. These can be found in Table 2.
Table 2. Assumptions on calculating the replacement rates for the defined contribution fund ETEA.
Income maturity 0.50%
Total contribution rate 6.00%
Expenses on contributions 0.50%
Total working life in years 40
Expected life of the annuity 15.64
Source: calculations by authors.
We observe that the replacement rate covers a significant amount of return on retire-
ment, with a contribution of 6% on pensionable income. To benchmark this for the Greek
case (follows in the paradigm section), let us say that for the same amount of contributions,
the present system replaces at 0.45% yearly. More specifically, the latest pension reform of
2016 replaces contributions at 0.45% yearly for the years until 2014, while for 2015 and on
the system works on NDC principles and takes into account the annual wage growth. Let
us look at the further options for replacement below, while expanding the main calculation
variables chosen in the baseline.
3.1.2. Sensitivity Analysis
In the previous subsection, a careful selection of assumptions was made. However,
sensitivity analysis is deemed necessary so that possible extreme behaviour of the system
is highlighted while still in the planning period.
3.1.2.1. Annuity Sensitivity
One of the assumptions to analyse further would be the annuity and the expected life
span it refers to. Life expectancy not only varies greatly from country to country, but is also
increasing. Moreover, the choice of whether or not to transfer the annuity to a spouse, if the
contributor dies, implied a range of values to look into in order to determine the possible
outcomes for the respective replacement rates.
The normal retirement age for men and women around Europe varies between 62
and 67 years old, while some countries (EPC 2018) tend to reform in the direction of aRisks 2021, 9, 8 7 of 17
part of the future increase in life expectancy be incorporated in the statutory retirement
age. The fully funded private pension schemes are not usually subject to a minimum
retirement age, as the choice of leaving the work force is based on the amount amassed at
that point, since ownership is one of the most important aspects of such funds. However,
since this paper is looking into a mandatory funded scheme, which in the Greek case will
go hand-in-hand with the social security pension, it is prudent that people be asked to
fulfil the criteria for a primary pension before retiring from the funded scheme. Having
chosen an annuity based on the EVK2000, we now enrich our research using the mortality
tables GR19907 , PM60648 , and HAS 2005 and 2012 tables. Based on these, we will look
for a possible annuity range to fulfil the sensitivity analysis, focusing on the most recent
tables. For the PM6064 mortality table, we calculate ages at last birthday, (e.g., age 67.7 is
calculated as age 67) and subtract five years for women and two years for men in order to
better convey the increase in longevity and allow for the fact that these tables are dated.
This method—using PM6064 and subtracting years to cater for the increase in longevity – is
common/standard practice in the Greek pension calculations9 . The results are depicted in
the tables below. Table 3 refers to the average length of the pay-out period with longevity
based on unisex life expectancy for women as well as men for the first two columns, and to
each gender for the next four.
Table 3. Ages and respective annuities under different mortality tables.
EAA2012 EAA2005 PM6064 GR1990
AGE Unisex Unisex Men (-2) Women (-5) Men Women
62 24.70 21.71 16.30 18.39 18.36 21.04
63 23.84 20.90 15.63 17.68 17.62 20.18
64 22.99 20.11 14.97 16.98 16.88 19.32
65 22.15 19.34 14.33 16.30 16.16 18.47
66 21.32 18.57 13.71 15.63 15.46 17.62
67 20.50 17.82 13.10 14.97 14.77 16.80
68 19.70 17.08 12.50 14.33 14.10 15.98
69 18.91 16.36 11.93 13.71 13.45 15.19
70 18.13 15.66 11.37 13.10 12.81 14.42
Source: Calculations by authors.
As long as the legislated normal retirement age for the primary pension in Greece is
still 67, a prudent set of values derived from the above table is from 14.00 and proceeding
to value 18.00, with a 0.1 interval. The replacement rates arising from the main annuity
values can be found in Table 4.
Table 4. Main annuity values and respective replacement rates.
Annuity 14 15 16 17 18
Replacement 29.10% 27.10% 25.40% 24.10% 22.70%
Source: calculations by authors.
3.1.2.2. Return Rate Sensitivity
As mentioned earlier, sensitivity analysis on rate of return values is very important.
Looking back at Table 1, we may assume values for the return rate varying between 2%
and 6%. This spectrum of values covers possible cases of prudent assumptions between
lower returns for crises and higher returns during intense financial growth. Again, a step
7 Greek Mortality Tables, 1990 data.
8 French Mortality Tables, Assured Lives, 1960–1964 Experiences, Male, used in the Greek Actuarial calculations in the past.
9 Ministerial Decree D K4-4381/1979.Risks 2021, 9, 8 8 of 17
of 0.1% has been chosen. The main values of the return rate and respective replacement are
depicted in Table 5 below:
Table 5. Main return rate values and respective replacement rates.
Return rate 2% 3% 4% 5% 6%
Replacement 18.80% 22.80% 28.50% 36.80% 46.90%
Source: calculations by authors.
3.1.2.3. Contribution Rate Sensitivity
The initial/minimum contribution rate as proposed for this funded scheme is 6% on
pensionable earnings. Since, however, this scheme is assumed to be fully funded, it is
logical that higher contribution rates can be accepted so that people willing to set more
money aside for their old age earn a higher replacement. European Commission (2008)
presents the contribution rates to privately managed funded schemes across different
European countries and these vary between 5% and 9%. Therefore, starting from the
proposed minimum to be legislated, we examine the replacement rates for a step of 0.1%
up to 10%. Table 6 shows the main contribution rate values and respective replacement
rates.
Table 6. Main contribution rate values and respective replacement rates.
Contribution rate 6% 7% 8% 9% 10%
Replacement 26.00% 30.40% 34.70% 39.00% 43.40%
Source: calculations by authors.
3.2. Methodology for the Greek Case Study
The Greek case study has been utilized using the cohort simulation projection method.
Several European countries use such models for their social security systems (European
Commission 2007) Cohort simulation projection models are based on up-to-date cross-
sectional information regarding the labour activity and social security contributions by
various social groups (cohorts). Further break-down by gender, position in the labour
market and demographic characteristics is also possible and has been taken into consid-
eration (TARKI 2008). The input is based on aggregate data for the cohorts instead of
person-by-person specific data. The averages are projected for each year using formulas
for demographics and finances. The transition from year t to year t + 1 changes the status
of a person (active, inactive or pensioner) and is mapped onto the following year using the
actuarially assumed transition probabilities. These are included in the mortality tables as
analysed earlier in the text, and the assumptions on retirement rates which are calculated
through the experience of the historical data of the last few years before the base year of
the projection.
The projection of the active population from t − 1 to time t is expressed by the
following equation:
Act( x, s, t) = Act ( x − 1, s − 1, t − 1)· p x−1 (aa) (3)
The interpretation of the above equation is the following:
The active population at time t, aged x with s years of past service equals the active
population aged x − 1 of the previous year, with s − 1 years of service multiplied by the
probability of a person aged x − 1 to stay active. An active person may become inactive
through retirement, invalidity, death and unemployment.
On the income side, the contribution base can be calculated as the product of the
number of contributors by the average insurable earnings. On the other hand, benefit
expenditure is calculated as the result of the product of benefit expenditure in year (t − 1)Risks 2021, 9, x FOR PEER REVIEW 9 of 17
Risks 2021, 9, 8 9 of 17
On the income side, the contribution base can be calculated as the product of the
number of contributors by the average insurable earnings. On the other hand, benefit ex-
penditure is calculated as the result of the product of benefit expenditure in year (t − 1) by
by the survival rate of pensioners reaching time t, plus the benefit expenditure from newly
the survival rate of pensioners reaching time t, plus the benefit expenditure from newly
awarded pensions.
awarded pensions.
Contribution
Contribution base of
base = (number = (number of contributors)
contributors) × (average
× (average insurable insurable earnings)
earnings) (4)
(4)
Benefit
Benefit Expenditure
Expenditure = (benefit
= (benefit expenditure
expenditure in (tin
−(t1))− 1)) × (survival
× (survival rate)
rate) + (newly
+ (newly awarded
awarded pensions)
pensions) (5)
(5)
The remainder
The remainderbetween
betweencontributions
contributionscollected
collectedandandbenefits
benefitspaid
paidisiscapitalized
capitalizedat
atthe
the
end of the projection year, adding to the existing capital from previous
end of the projection year, adding to the existing capital from previous years, towards years, towards
creating the
creating the total
total capital
capitalavailable
availablefor
forinvestment
investmentas aspresented
presentedin inthe
theresults
resultschapter.
chapter.
More specifically,
More specifically,benefits
benefitsare
arecalculated
calculatedusingusingthetheaverage
averagesalaries
salaries of
ofthe
theprojected
projected
population for
population for the
the respective
respective years
years ofof service
service in
in the
the projection
projection period
period and
andapplying
applying the
the
probabilities of exit accordingly. Further, more detailed functions are utilized,
probabilities of exit accordingly. Further, more detailed functions are utilized, as described as de-
scribed
by by Iyerand
Iyer (1999) (1999) and Plamondon
Plamondon et al.per
et al. (2002) (2002)
the per
use the use of actuarial
of actuarial cohort model-
cohort modelling for
ling for
social social security.
security.
3.2.1.
3.2.1. Assumptions
Assumptions Used
Used in
in the
the Projections
Projections
The
The population projections used
population projections used inin the
the valuation
valuation come
come from
from Eurostat.
Eurostat. These
These projec-
projec-
tions
tions are
are prepared
prepared for
foreach
eachmember
memberstatestateand
andmake
makeuse
useofofcertain
certainassumptions
assumptionsprovided
provided
by
by each
eachmember
memberstate.
state.Greece
Greeceisisexpected
expected to to
receive some
receive of the
some greatest
of the pressure
greatest fromfrom
pressure the
demographic
the demographicdependency
dependencyamongst its European
amongst counterparts
its European (Figure
counterparts 1). 1).
(Figure
Old-age dependency ratio (65+/15-64))
70.00
50.00
30.00
2030 2040 2050 2060
Greece EU EA
Figure 1.
Figure 1. Old-age
Old-age dependency
dependencyfor
forGreece,
Greece,the
theEU
EUand the
and Euro
the Area,
Euro years
Area, 2030–2060.
years (Source:
2030–2060. (Source:
(ΕPC2015a)).
(EPC 2015a)).
The set of macroeconomic
The macroeconomic assumptions
assumptionsusedusedininthe
thevaluation
valuationwaswas thethe
same
sameused by
used
DGDG
by ECFIN
ECFIN (Directorate General
(Directorate for for
General Economic andand
Economic Financial Affairs
Financial of the
Affairs of EU), in the
the EU), incon-
the
text of the
context OMC
of the for pensions.
OMC The starting
for pensions. point point
The starting is the is
EUROPOP2013
the EUROPOP2013 population projec-
population
tion for thefor
projection period 2013 to2013
the period 2060to(Eurostat 2015). These
2060 (Eurostat 2015).combined set of projections
These combined enabled
set of projections
the calculation
enabled of GDP of
the calculation forGDP
all Member States up
for all Member to 2060.
States up toIt2060.
is worth mentioning
It is worth at this
mentioning
at thisthat
point point
thethat theGDP
Greek Greek GDP
has has by
shrunk shrunk by approximately
approximately 20% from20%2010from 2010and
to 2013 to more
2013
and
thanmore
30% than
from 30%
2008from 2008
to 2013 to 2013 (Symeonidis
(Symeonidis and Venetsanakou
and Venetsanakou 2016). The2016). The basic
basic macroeco-
macroeconomic
nomic assumptions assumptions forfor
for Greece Greece for the projection
the projection period 2013–2016
period 2013–2016 may be mayfoundbeinfound
(ΕPC
in (EPC 2015a).
2015a).
3.2.2.
3.2.2. Labour
Labour Force
Force Participation
Participation Projections
Projections
In
In Greece, labour force participationisisprojected
Greece, labour force participation projectedtotoincrease
increasefor
forage
agegroup
group55–64,
55–64,from
from
42.4% in 2013 to 78.0% in 2060. The largest increase will be experienced until
42.4% in 2013 to 78.0% in 2060. The largest increase will be experienced until 2020, 2020, reaching
reach-
59.4%. The The
ing 59.4%. participation rate for
participation rateage
forgroup 65–7465–74
age group increases from from
increases 4.4 in4.4
2013
in to 24.4toin24.4
2013 2060 in
and this is the main driver behind the results of the projection, reflecting on
2060 and this is the main driver behind the results of the projection, reflecting on the the changes in
social
changes values and the
in social life and
values expectancy (Table 7). (Table 7).
the life expectancyRisks 2021, 9, 8 10 of 17
Table 7. Participation rate, employment rate and share of workers for the age groups 55–64 and
65–74.
2013 2020 2030 2040 2050 2060
Labor force participation rate 55–64 42.4 59.4 69.4 74.5 77.2 78
Employment rate for workers aged 55–64 35.5 51.5 63.6 71.3 73.8 74.6
Median age of the labor force 39 42 44 44 43 43
Source: (EPC 2015a).
The average effective entry age in the labour force is constant for the projection period
(22.6 years for men and 24.1 for women). Due to pension reforms the average contributory
period is projected to reach 37.8 years for men and 37.5 for women by 2060. The percentage
of adult life spent at retirement decreases for both men and women. AWG/EUROPOP2013
assumptions on lab or force participation rates and employment rates have been taken into
account.
3.2.3. Wages, Inflation, Pension Indexation
The wage growth is obtained by the product of inflation and labour productivity. No
negative growth is applied. Salary valorisation is adjusted using the rate of inflation and
rate of growth in labour productivity.
This adjustment is higher than the actual increase in the salaries observed in past years,
leading to a high valuation of accrued rights and thus pension expenditures observed in
the most recent years. On the other hand, it recognizes the high potential for investments in
technical progress, including processes that are inherent in a positive economic future for
Greece. The inflation rate used in the valuation (GDP deflator) can be seen in Table 10 below.
Primary pensions benefit indexation is fully linked to a uniform adjustment index, which
cannot exceed CPI. In particular, the index is equal to the minimum of CPI and the sum
of 50% CPI and 50% GDP growth [min (50% GDP growth +50% CPI, CPI)]. No nominal
increase in pensions up to 2015 occurs in the calculations based on current legislation. The
formula for secondary pensions benefit indexation according to legal provision is
γt = min 1 + gt−2 − r ∗ SFt − 1, inflationt−1 (6)
where g: notional rate of return, r: discount rate = 1.3%, SF: sustainability factor = Contribu-
tions previous year/Benefits previous year. In the case of the DC fund (new supplementary
fund) we assume SF = 1, hence the SF does not actually apply. This indexation can take
negative values. Table 8 below includes the values for inflation.
Table 8. Inflation values.
2013 2014 2015 2016 2017 2018–2060
inflation −2.1 −0.7 0.4 1 1.5 2
Source: (EPC 2015b).
In the valuation, the participation rates for employment are assumed to be 2 percentage
points higher per year, for the age group 20–64 compared to the baseline. The increase
is linear in the period 2016–2025 and remains stable thereafter. Experience has shown
(OECD 2011, Carone and Salomäki 2001 and Van Rijckeghem 1997) that the reduction of
contributions has helped boost employment, so this scenario is the most appropriate in our
case. This scenario is the main scenario used throughout the pension projections.
This valuation covers all available labour force and works under the main principle
that all people working will in fact be contributing to some supplementary fund. To this
day, this is not the case, as some portions of the population, like doctors and engineers,
do not contribute to such funds. The main contributors for the secondary pension inRisks 2021, 9, 8 11 of 17
Greece are private employees and civil servants. Most of the current contributors for the
supplementary pension are enrolled in one large fund named ETEAEP10 .
The coverage statistics can be found in Table 9 below.
Table 9. Total insured population.
Base Year (2013) Coverage Percentages Insured
SQ total 4,188,200
Labor Supply = DC Contributors 4,188,200
100%
Source: Calculations by authors, (EPC 2015b).
While the individual replacement rates for this paper are calculated solely on the re-
spective annuities and other chosen assumptions, the use of a cohort model is implemented
so the total insured population is projected accordingly, and all the available decrements
are taken into account. For this reason, the outputs of the Hellenic Actuarial Authority
valuation year 2015 are also used and adjusted as such. The data used are in two main
categories, individual data and consolidated data.
The minimum retirement age for full pension as legislated in 2010 and modified in 2012
has reached 67 years of age with the alternative of 62, if 40 full years of contributions have
been fulfilled. Furthermore, the minimum retirement age been linked to life expectancy
change at year 65. Therefore, a further increase in retirement age minimum has been
modelled for years 2021, 2030, 2042, and 2051 by one year.
As stated earlier, the projection assumes that the total supply of the employed people
contributes to the new capitalized fund. For this reason, the results of the 2015 valuation
(EPC 2015b) are up scaled so that the population includes the full supply of employed
people. This means that more active population is assumed so as the labour supply number
provided actually matches the real number of people recorded in the market. Table 10
presents the number of contributors for the capitalized fund of the supplementary pension.
Table 10. Funded scheme Contributors (total employed persons).
Year Number of Employed
2020 4,665,652
2030 4,993,526
2040 4,922,508
2050 4,467,694
2060 4,189,135
Source: Calculations by authors.
A calculation of the total contribution revenue flowing into the system is necessary,
so as to present the volume of investment funds available and their possible impact on
GDP growth. The population and contribution margin have been adapted so they include
the total working population, and the contribution percentage is 6%. The macroeconomic
scenario used is—as stated earlier—the higher employment scenario and this means that
new entrants are calculated with the increased employment rate.
4. Results
4.1. Results for the Funded Scheme’s Replacement
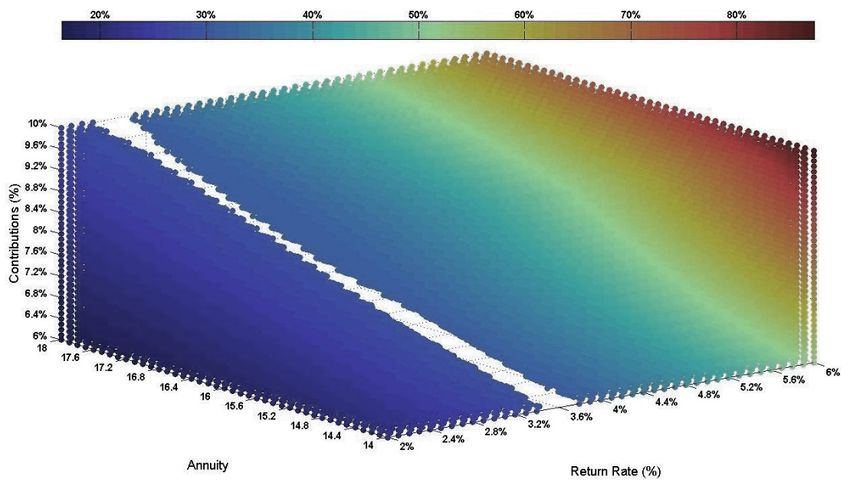
Summing up the baseline scenario and the three sensitivity criteria results, the next
step is to define an interval within which a measurable replacement rate is born. Drafting
all the necessary data in Matlab (R2019b) we create Figure 2 below, a color-coded three-
dimensional graph. The contribution rate lies on the left axis, measuring from 6% to 10% on
10 Greek acronym: ETEAEΠ. (Unified Fund for Supplementary Pension and Lump-sum Benefits).021, 9, x FOR PEER REVIEW 12 of 17
on pensionable earnings. The annuity, plotted for values 14–18, lies on the bottom left axis,
Risks 2021, 9, 8 and the return rate on the bottom right, for values 2% to 6%. The replacement is color- 12 of 17
coded and the code legend lies on top, dark blue being close to 0% and graduating to red,
which reaches to as much as 100%, as it gets darker in colour. The warmer the colours, the
higher the corresponding
pensionablereplacement
earnings. The rate. The colder
annuity, plottedthe
forcolours, the lower
values 14–18, thethe
lies on replace-
bottom left axis, and
ment rate, respectively. An area of special interest to us is that of the
the return rate on the bottom right, for values 2% to 6%. The replacement replacement rates is color-coded
close to 30%. For this area, color-coded white, we can see possible
and the code legend lies on top, dark blue being close to 0% and graduatingcombinations that to red, which
would derive the necessary
reaches replacement.
to as much as 100%,This
as itarea
getsproves
darkeran inimportant
colour. Thepoint towards
warmer the
the colours, the higher
attainment of such a replacementreplacement
the corresponding rate. All three parameters
rate. The colder can becolours,
the useful inthethis direction,
lower the replacement rate,
and even returns as low as 3.5%
respectively. An areacanof provide
specialainterest
decent replacement,
to us is that ofprovided the annuity
the replacement rates close to 30%.
and contribution rate are such that they allow this. All three parameters
For this area, color-coded white, we can see possible combinations that wouldare important in derive the
order to achieve the goal of a decent return on contributions, but can be off-set
necessary replacement. This area proves an important point towards the attainment of such by the
remaining twoaparameters
replacement if rate.
someone has not
All three been putting
parameters can be aside a substantial
useful percentage
in this direction, and even returns as
of their income,
lowdecide
as 3.5% to leave earlieraordecent
can provide the market does not
replacement, reach its
provided thefull potential
annuity and re-
contribution rate
spectively. are such that they allow this. All three parameters are important in order to achieve the
For other goal
totalofreplacement
a decent return rateonvalues, one has to
contributions, butlook
can atbe the coloured
off-set by the line on top,two parameters
remaining
which explainsifthe colour codes and then refer to the diagram below matching the
someone has not been putting aside a substantial percentage of their income, decide torespec-
tive colour zone.
leave earlier or the market does not reach its full potential respectively.
Figure 2. Combined
Figure 2. sensitivity
Combinedanalysis of the
sensitivity contribution
analysis rate, annuityrate,
of the contribution andannuity
the rate and
of return andofthe
the rate different
return and respective
replacementthe different
rates. respective
(Source: replacement
Calculations rates. (Source: Calculations by authors).
by authors).
An example toFor helpother total replacement
understand this graph rate
wouldvalues,
be toone has atovalue
choose look at thethe
from coloured
far- line on top,
right part of thewhich
whiteexplains the3.6%
line, e.g., colourforcodes
RRR, and
whichthen refer to to
intersects theannuity
diagram below
life valuematching
14.4. the respec-
On the far left,tive
this colour zone. to almost 6.2% contribution rate. In this case, the replace-
corresponds
An exampleamounts
ment rate for these parameters to help close
understand
to a 30%this graph would be to choose a value from the
target.
In general, the far right and far left sides represent theRRR,
far-right part of the white line, e.g., 3.6% for two which intersects
diametrically to annuity life value
opposed
14.4. On the far left, this corresponds to almost 6.2% contribution
areas, providing very high and very low return rates respectively. The graph can be used rate. In this case, the
replacement
to obtain different rate for
results when these parameters
combining the three amounts closein
parameters to questions,
a 30% target.
then the
colour that corresponds In general, the far right can
to the combination andbe far left sides
matched to represent
the legendtheon two diametrically
the top of the opposed
graph. areas, providing very high and very low return rates respectively. The graph can be used to
obtain different results when combining the three parameters in questions, then the colour
thatGreek
4.2. Results for the corresponds
Case Studyto the combination can be matched to the legend on the top of the graph.
A new pension funded
4.2. Results for scheme
the Greekcomes with great policy challenges before its imple-
Case Study
mentation. To begin with, extensive changes should be applied to the legal framework
A new pension funded scheme comes with great policy challenges before its imple-
already in place in order to account for the new funded scheme. Most researchers would
mentation. To begin with, extensive changes should be applied to the legal framework
already in place in order to account for the new funded scheme. Most researchers would
place this scheme under a second pillar, however Paparigopoulos (2019) states that funding
of pensions does not necessarily mean the new scheme cannot be installed in the firstRisks 2021, 9, 8 13 of 17
pillar, from a legal perspective. A further analysis of some policy aspects can be found in
(MoL 2019). One of the most sensitive matters discussed is the introduction of investment
rules that apply to the fund manager(s) and that they must be described in legal detail.
While a functioning capital market must be in place for investments to work properly, if
the state decides to install the funded scheme in the first pillar, any investment rules must
respectively be formulated in order to be consistent with the institution of social security in
general.
Within a framework of reform towards privatization, emphasis on a minimum pension
amount may help the reform discussion and the respective transition be more successful.
Urging people to participate in funded schemes instead of making the latter mandatory
has also proved to have some positive reactions. (Orenstein 2013). Finally, it is always
important to allow time for public debate and gradual implementation. In the case of
Sweden, even though time was allowed to process the reform, this proved to be less than
the one needed when looking back (Könberg et al. 2006).
The expected capital available coming from a potential funded scheme in Greece,
under the aforementioned assumptions and conditions can be found below. Table 11 below
shows annual amounts at indicative intervals per decade for contributions, benefits and
reserves. The reserves are calculated as the reserve of the previous year increased by 3%
(an estimated return rate for assets) plus the annual surplus of contributions minus benefits
for the current year.
Table 11. Funded scheme fiscal evolution (current prices, in mil.euros).
Year Contributions Benefits Reserve
2017 3751 1 3750
2020 3752 14 15,543
2030 4766 200 68,670
2040 6585 1410 149,214
2050 8911 5025 255,722
2060 12,120 11,131 371,500
Source: calculations by authors.
The total reserve for 2060 is almost 372 billion euros, estimated with a 3% return rate
for assets. To appreciate the magnitudes involved, we note that the Greek National Debt in
2016 was 312 billion euros and the GDP for 2060 was projected (EPC 2015a) to be 725 billion
euros in current prices—meaning that reserves amount to 51% of GDP. If this amount
corresponds to net savings, the availability of these funds could prove a major impetus to
growth. Recall that private sector savings have been negative in Greece since before the
crisis (Meghir et al. 2017). A new funded pension scheme of this magnitude would have a
non-negligible effect on the availability of investment funds for the Greek economy, with a
positive effect on growth. The transition to a new capitalized supplementary insurance
system aims both at better return on policyholders’ contributions with a view to improving
the level of retirement benefits compared to the existing system as well as boosting the
Greek economy through investments. Since Greece is part of the European Commission,
the rules and regulations of the latter must be respected, however an adaptation that will
help invest a large portion of the accrued capital locally thus improving the internal market
and the Greek economy is deemed legitimate (MoL 2019).
Furthermore, the total debt of the state could be significantly reduced because of two
different reasons. To begin with, the total implicit11 debt of the Greek pension system, as
calculated with the open method approach, is one of the larger in Europe, based on the
2015 data, showing a slightly better trend based on 2018 data (DG ECFIN 2020). As the
fiscal burden from the public pensions will partially be alleviated from the introduction
11 Implicit (also mentioned as unfunded) pension liabilities measure governments’ long-term commitments to current and future generations of
pensioners.Risks 2021, 9, x FOR PEER REVIEW 14 of 17
Risks 2021, 9, 8 14 of 17
calculated with the open method approach, is one of the larger in Europe, based on the
2015 data, showing a slightly better trend based on 2018 data (DG ECFIN 2020). As the
fiscal burden from the public pensions will partially be alleviated from the introduction
of the funded
of funded scheme,
scheme, this
this will
will help the long-term
long-term implicit
implicit pension
pension liabilities.
liabilities. To
To go
go on,
on,
the capital
the capital accrued from the funded scheme will help promote national investments and
long-sought growth,
long-sought growth, toto boost
boost economy. The general government
government debtdebt of the Greek state
amounted to
amounted to 166%166% GDP for the year 2019 (Eurostat 2020), which further proves the need
for reforms in the direction of growth and a smaller state pension
for reforms in the direction of growth and a smaller state pension pillar. pillar.
The numbers
The numbers mentioned
mentioned in in the
the table
table above
above are
are also
also depicted
depicted in
in Figure
Figure 33 below:
below:
Fiscal evolution of the new system as a % of GDP
41
37
33
29
25
21
17
13
9
5
1
0% 10% 20% 30% 40% 50% 60%
Contributions/GDP Benefits/GDP Reserve/GDP
Figure 3. Contributions
Contributions and
and benefits
benefits for
for the total population
population for the new defined contribution
contribution fund,
fund, reserve
reserve of the new
defined contribution fund
defined contribution fund with
with 3%
3% annual
annual return
return rate.
rate. (Source:
(Source: Calculations
Calculations by
by authors).
authors).
5. Conclusions
5. Conclusions
Mandatory funded components in pension systems may promote savings for the
economyMandatory funded components
and investments, and mightin pension
alter systems may promote
the macroeconomic savings
links between for the
pensions
economy and investments, and might alter the macroeconomic links
and the economy, while simultaneously contributing to the solution of fiscal dilemmas. between pensions
and the
They do economy, while simultaneously
so by generating contributing
income for pensioners to the solution
and alleviating of fiscal
the general dilemmas.
government
They do so by generating income for pensioners and alleviating the general
budget from a part of the implicit pension debt in the long term. In the short term, if the government
budget
case from includes
in point a part of athe implicit which
transition, pension debt in the the
is frequently long term.
case, theIn the short
issue term,rights
of accrued if the
case in point includes a transition, which
has to be carefully looked into before the reform. is frequently the case, the issue of accrued rights
has toAs,behowever,
carefully funded
looked into before
schemes the reform.
make contributors more subject to the risks of fluctu-
ations in stock and bond markets, it is verycontributors
As, however, funded schemes make important tomore subjectpossible
anticipate to the risks
ratesofoffluctua-
return
tions in stock and bond markets, it is very important to anticipate possible rates of return
and identify investment strategies to achieve them, especially in an era where quantitative
and identify investment strategies to achieve them, especially in an era where quantitative
easing has reduced returns greatly. In the long term, different combinations of contribu-
easing has reduced returns greatly. In the long term, different combinations of contribution
tion rates, rates of return and annuity values, indicate that it is possible to achieve a decent
rates, rates of return and annuity values, indicate that it is possible to achieve a decent
replacement rate from the funded component, which can contribute to increasing the total
replacement rate from the funded component, which can contribute to increasing the total
replacement and income for old age. Such a component can make a valuable contribution
replacement and income for old age. Such a component can make a valuable contribution
to overall system adequacy.
to overall system adequacy.
In Greece, the interest in a new system is two-fold. First, the present overall pension
In Greece, the interest in a new system is two-fold. First, the present overall pension
system is in constant need of state subsidies by approximately 50% yearly (Government
system is in constant need of state subsidies by approximately 50% yearly (Government
Official Journal 2018). Secondly, there is increasing awareness of the policy makers that
Official Journal 2018). Secondly, there is increasing awareness of the policy makers that
failure to reform the system conclusively can generate fiscal burdens on the state which
failure to reform the system conclusively can generate fiscal burdens on the state which
in
in turn
turn may
may lead to pension
lead to pension reductions
reductions or or increased
increased contributions.
contributions. The The latter
latter may
may also also
lead
lead totoaavicious
viciouscircle ofof
circle unemployment,
unemployment, disinvestment
disinvestmentandand economic
economicrecession and ulti-
recession and
mately to the extended need for financial assistance as in the case of Greece
ultimately to the extended need for financial assistance as in the case of Greece (European (European
Commission 2020). A funded component, supplemented with a safety net and other pillars
of a multi-pillar pension system, may serve as an important societal tool in order to caterRisks 2021, 9, 8 15 of 17
for the financial pressure from ageing and enhance post-retirement stability, supporting the
financing of consumption after retirement. At the same time, it may help reduce implicit
pension debt and general government in a direct and indirect way respectively, by reducing
future pension deficits and boosting economy and growth, which will consequently help
increase employment. Finally, amassing contributions from the new funded scheme
corresponding to large percentages of GDP and investing them could lead to safer pensions
and better returns. If used wisely and well organized, political alternation has minimum
impact.
Author Contributions: All authors have contributed substantially to this work. Conceptualization,
G.S. and P.X.; Methodology, G.S.; Software, G.S.; Validation, G.S.; Formal Analysis, G.S.; Investigation,
G.S.; Resources, G.S., P.T. and P.X.; Data Curation, G.S.; Writing—Original Draft Preparation, G.S.;
Writing—Review & Editing, G.S., P.T. and P.X.; Visualization, G.S. Supervision, G.S., P.T. and P.X.;
Project Administration, G.S., P.T. and P.X.; Funding Acquisition, P.X. All authors have read and
agreed to the published version of the manuscript.
Funding: The publication of this paper has been partly supported by the University of Piraeus
Research Center. More specifically, the APC was funded by the University of Piraeus Research
Center.
Acknowledgments: The authors thank the referees for their comments which helped to improve the
manuscript. The authors would also like to thank Vasiliki Takou and Alberto La Mantia for useful
insight regarding the best way to present data for replacement.
Conflicts of Interest: The authors declare no conflict of interest.
References
Barr, Nicholas. 2000. Reforming Pensions: Myths, Truths, and Policy Choices (Working Paper). Washington, DC: International Monetary
Fund.
Bielawska, Kamila, Agnieszka Chłoń-Domińczak, and Dariusz Stańko. 2017. Retreat from Mandatory Pension Funds in Countries of
the Eastern and Central Europe in Result of Financial and Fiscal Crisis: Causes, Effects and Recommendations for Fiscal Rules. Warsaw:
Instytut Zarzadzania
˛ Ryzykiem Społecznym.
Bijlsma, Michiel, Casper van Ewijk, and Ferry Haaijen. 2014. Economic Growth and Funded Pension Systems, Netspar Discussion Papers.
Netspar Discussion Paper No. 07/2014-030. Available online: https://ssrn.com/abstract=2470544 (accessed on 30 October 2020).
[CrossRef]
Carone, Giuseppe, and Aino Salomäki. 2001. Reforms in Tax-Benefit Systems in Order to Increase Employment Incentives in the EU.
European Commission. Economic Paper Number 160. September. Available online: http://europa.eu.int/comm/economy_
finance (accessed on 30 October 2020).
Cavallini, Pietro, Carmeci Gaetano, and Millo Giovanni. 2013. Are Funding of Pensions and Economic Growth Directly Linked? New
Empirical Results for Some OECD Countries. Trieste: EUT Edizioni Università di Trieste.
Davis, Philip E., and Yuwei Hu. 2008. Does Funding of Pensions Stimulate Economic Growth? Journal of Pension Economics and Finance
7: 221–49. [CrossRef]
DG ECFIN. 2020. Quarterly Report on the Euro Area Volume 19, No 2. Institutional Paper 135. October 2020. Luxembourg: Publications
Office of the European Union.
Economic Policy Committee (EPC). 2015a. The 2015 Aging Report—Underlying Assumptions and Projection Methodologies. Luxembourg:
Publications Office of the European Union.
Economic Policy Committee (EPC). 2015b. Greek Country System Fiche 2015. Athens: Hellenic Actuarial Authority.
Economic Policy Committee (EPC). 2015c. The 2015 Aging Report: Economic and Budgetary Projections for the EU Member States (2013–2060).
Luxembourg: Publications Office of the European Union.
Economic Policy Committee (EPC). 2018. The 2018 Aging Report: Economic and Budgetary Projections for the EU Member States (2016–2070).
Luxembourg: Publications Office of the European Union.
Economic Policy Committee (EPC). 2020. The 2021 Aging Report: Underlying Assumptions and Projection Methodologies. Institutional Paper
142. November 2020. Luxembourg: Publications Office of the European Union.
European Commission. 2007. Pensions Schemes and Projection Models in EU-25 Member States. Luxembourg: Office for Official
Publications of the European Communities.
European Commission. 2008. Privately Managed Funded Pension Provision and Their Contribution to Adequate and Sustainable Pensions.
Luxembourg: Publications Office of the European Union.
European Commission. 2010. Green Paper towards Adequate, Sustainable and Safe European Pension Systems. Luxembourg: Publications
Office of the European Union.You can also read