Karst and Sinkhole Hazards - Kentucky Emergency Management
←
→
Page content transcription
If your browser does not render page correctly, please read the page content below
Karst and Sinkhole Hazards
Definitions and Description
Derived from a Slavic word meaning “barren, stony ground,” the term karst has been variously
used to describe a landscape (terrain), a geologic setting (terrane), and a type of aquifer (or
hydrology) characterized by features formed by the dissolution of soluble bedrock:
       “A terrain, generally underlain by limestone or dolomite, in which the topography is chiefly
       formed by the dissolving of rock and which may be characterized by sinkholes, sinking streams,
       closed depressions, subterranean drainage, and caves (Monroe, 1970).

       A terrane underlain by soluble rock in which the topography is chiefly formed by dissolving of
       rock … and may be characterized by sinkholes, sinking streams, closed depressions,
       subterranean drainage, and caves … (Field, 1999).

       “Karst is a unique hydrogeologic terrane in which the surface water and ground water regimes
       are highly interconnected and often constitute a single, dynamic flow system.” (Taylor and
       Greene, 2008).

       “An aquifer in which the flow of water is or can be appreciable through one or more of the
       following: joints, faults, bedding-plane partings, and cavities — any or all of which have been
       enlarged by dissolution (Quinlan and others, 1991).

Karst has a wide geographic distribution, covering approximately 13 percent of Earth’s land
surface, and is present on almost every continent underlain by carbonate rocks of various
geologic age (Ford and Williams, 2007). In the United States, approximately 18 percent of all
exposed or shallow bedrock exhibits, or has the potential for forming, karst or karst-like
features (Weary and Doctor, 2014). Many geologic, topographic, and climatologic factors
influence the development of karst, and not all karst features—such as sinkholes, caves, and
springs—are present to the same extent or develop in the same way in every karst area. For
example, although the occurrence and formation of sinkholes in Florida are often used for
conceptual and comparative purposes, karst features there have formed in bedrock and under
very different geologic and hydrogeologic conditions from karst features in Kentucky. Although
comparing karst characteristics in the various states can be useful and informative, karst
features are also locally to regionally unique, so that karst features in one state may not be
completely analogous to those in another (Fig. 3-1).
In Kentucky, approximately 50 to 60 percent of the state has karst or potential for karst, as
indicated by maps showing areas where limestone crops out. About 38 percent of the state has
at least some karst development that can be recognized on topographic maps, and 25 percent
of the state is known to have well-developed karst features. Data obtained from the 2010 U.S.
Census indicate that 2,894,115 people, or about 67 percent of the state’s population, live in a
karst region (Cecil, 2015). Some of the larger Kentucky cities and towns located on karst are
Frankfort, Louisville, Lexington, Lawrenceburg, Georgetown, Winchester, Paris, Versailles, and
Nicholasville (all located in the Inner Bluegrass Region); Fort Knox, Bowling Green,

                                                                                                  KGS - 36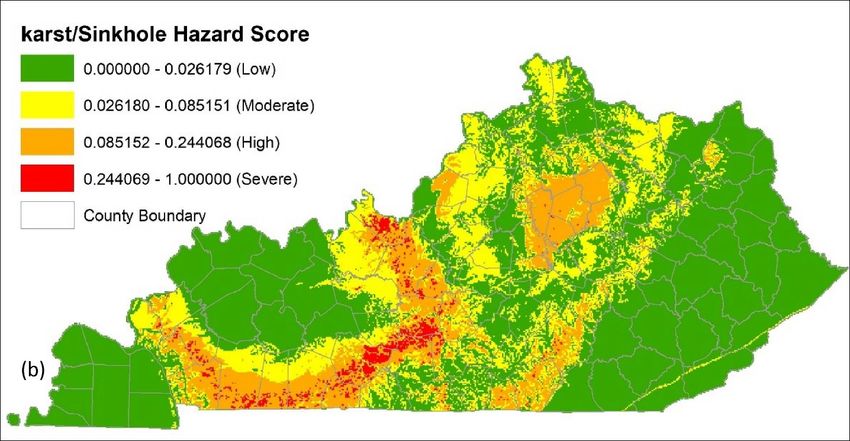
Elizabethtown, Munfordville, Russellville, Hopkinsville, and Princeton (in the Western
Pennyroyal Region); and Somerset, Monticello, and Mount Vernon (in the Eastern Pennyroyal
Region).

          (a)

          (b)

Figure 3-1. Comparison of typical surface and subsurface karst features in the Inner Bluegrass (a) and
Western Kentucky Pennyroyal (b) karst regions of Kentucky.

Facts
    •   Approximately 20 percent of the conterminous United States and 50 percent of the U.S. east of
        the Mississippi River is underlain by soluble and potentially karstic bedrock (Weary and Doctor,
        2014).
    •   Much of Kentucky‘s prime farmland is underlain by karst, as is a substantial amount of the
        Daniel Boone National Forest, with its important recreational and timber resources.
    •   Caves are important karst features, providing recreation and unique ecosystems. Mammoth
        Cave is the longest surveyed cave in the world, with more than 400 miles of passages. Two
        other caves in the state are known to extend more than 30 miles, and seven mapped
        Kentucky caves are among the 50 longest in the United States (Gulden, 2018).
    •   Kentucky is ranked fifth nationally among states affected by sinkhole hazards.

                                                                                                  KGS - 37
•   Karst aquifers and springs supply drinking water and water used for agricultural, industrial, and
        recreational purposes to an estimated 20 to 25 percent of the global population (Ford and
        Williams, 2007). Karst aquifers and karst springs provide much of the base flow to surface
        streams worldwide, and the caves, aquifers, and springs present in karst areas provide critical
        habitat for a variety of rare, threated, or endangered aquatic and terrestrial organisms (Culver
        and White, 2004).
    •   About 40 percent of groundwater used for drinking water in the U.S. comes from karst aquifers.
    •   According to the Kentucky Division of Water, springs and wells in karst areas supply water to
        tens of thousands of private homes, and are also used by five public water suppliers serving
        more than 164,000 citizens in total: Hardin County Water District No. 1, Hardin County Water
        District No. 2, Georgetown Municipal, Cadiz Municipal, and Green River Valley Water District
        (Rob Blair, Source Water Protection Program, Kentucky Division of Water, written
        communication, April 9, 2018).

Karst hazards that could have an impact on Kentucky’s citizens and infrastructure include sinkholes,
flooding, and groundwater and surface-water contamination. Sinkholes are by far the largest and most
frequently encountered karst hazards.

Sinkholes
Subsidence—a natural or human-induced process that results in progressive lowering of local or regional
land-surface elevations—is a consequence of karst development and may occur over long-term
(including geologic) and short-term timescales. Sinkholes, also called dolines in the scientific literature,
are arguably the most distinctive and abundant type of subsidence-related feature (Ford and Williams,
1989). Sinkholes are physically manifested as closed and internally drained topographic depressions, of
generally circular shape, that develop where soil or other overburden material subsides or collapses into
subsurface voids. Sinkholes can form as a result of both natural (karst-related) processes and as a direct
or indirect consequence of human activities. Human activities that can cause sinkholes include
groundwater withdrawals, alteration or diversion of surface runoff, subsurface mining; subsurface
erosion, piping, or compaction of unconsolidated soils or sediments along buried pipelines or beneath
highways and roads; and decaying buried organic debris (e.g., tree roots, buried trash, and other debris).
Sinkholes also form in nonkarst areas where leaking water or sewer pipes and other human activities
create or result in subsidence, compaction, or subsurface erosion (i.e., piping) of soil, gravel, or other fill
materials. Pipeline leakage and flooding affect highway roadbeds, pipelines, and other utility trenches,
and often confuse nongeologists because the “sinkholes” created by these localized collapses may not
be, and often are not, related in any way to karst or karst processes (Kuniansky and others, 2016).
Sinkholes are classified by geologists using numerous descriptive terms depending on the types of
geologic materials and processes or sequence of processes involved in their formation. Waltham and
others (2005), for example, defined six classes of karst-related sinkholes. For simplicity, sinkholes may
be grouped into two broad categories: subsidence and collapse. Subsidence and collapse sinkholes often
occur together in the same karst area, and many sinkholes form as a combination of the two processes.
Subsidence sinkholes form by the relatively slow and gradual subsurface dissolution of soluble bedrock
and piping of unconsolidated cover materials (soil, alluvium) into fractures and conduits enlarged by
solution in the epikarst, a zone of intensified weathering and dissolution at the soil-bedrock interface.
Subsidence sinkholes in Kentucky are generally recognizable as broad, shallow, bowl-shaped depressions
(Fig. 3-2a, b). These sinkholes are largely responsible for the rolling topography that characterizes much

                                                                                                       KGS - 38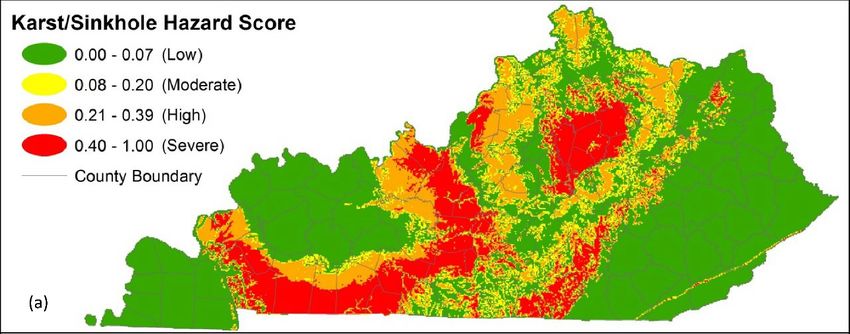
of the Bluegrass and Western Pennyroyal Regions. Diameters can range from several tens to hundreds
of feet, and shapes can be circular, elongate or irregular and complex.

Figure 3-2. Examples of common subsidence sinkholes formed in a rural agricultural setting (a) and a
suburban setting (b).

Collapse sinkholes form suddenly by failure of the roof or arch of soil, bedrock, or other surface and
subsurface materials located above subsurface karst voids and caves (Waltham and others, 2005). Their
seemingly unpredictable occurrence makes them a hazard of particular concern in karst areas. Collapse
sinkholes that form over voids in unconsolidated materials—soil, sediment, or brecciated bedrock—are
common and are referred to as cover-collapse sinkholes (Currens, 2012. Cover-collapse sinkholes are
typically steep-walled circular or funnel-shaped depressions (Fig. 3-3) having diameters that range from
a few feet to hundreds of feet. Depths may vary, and may be somewhat dependent on the thickness of
soil or unconsolidated material above karstified bedrock. The Kentucky Geological Survey began
developing a catalog of case histories of cover-collapse occurrences in 1997 and has documented 354
occurrences throughout the state; an average of 24 new reports are received each year (Currens, in

                                                                                                 KGS - 39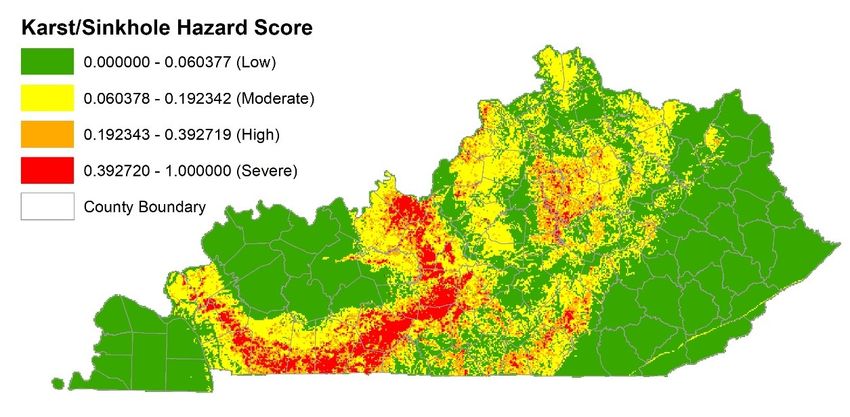
press). Statistical evaluation of the data in the catalog indicate that cover-collapse sinkholes in Kentucky
are on average 9 feet long, 6 feet wide, and 8 feet deep (Currens, in press). Many of them can be
substantially larger in size, however. One of the largest documented cover-collapse sinkholes in the
state—the Dishman Lane sinkhole in Bowling Green—was about 150 feet in diameter and more than 16
feet deep (Kambesis and others, 2003). Historically, most cover-collapse sinkholes are reported between
April and June (Currens, 2012. Factors that may influence the natural formation of cover-collapse
sinkholes include freeze-to-thaw weather cycles and rainfall, particularly intense or prolonged storms
occurring after relatively dry conditions (Waltham and others, 2005).

Figure 3-3. Cover-collapse sinkholes like those seen here are typical of the kind that occur most
frequently in Kentucky.

Impacts of Sinkhole Hazards

Karst-related subsidence, and particularly catastrophic sinkhole collapse, is a wide-spread, nationally
recognized hazard (Weary, 2015). The extent of the problem and the cumulative economic impacts are
difficult to assess for many states, however, because of under-reporting, the lack of a centralized
database managed by appropriate state or federal authorities, inconsistent or insufficiently detailed
documentation about sinkhole damage, and lack of follow-through regarding remediation costs (Weary,
2015; Kuniansky and others, 2016). The available data indicate that sinkhole-related damage is greatest,
in order, in Florida, Texas, Alabama, Missouri, Kentucky, Tennessee, and Pennsylvania, although these
rankings are somewhat anecdotally based (Weary, 2015). Human fatalities and injuries as a result of
sinkholes are rare, but damage to homes, buildings, highways, and other infrastructure results in many
millions of dollars in repair and remediation costs each year, and acts to devalue property values and
raise insurance costs (Weary, 2015). Best estimates derived from reviews of available state-by-state data
indicate that annual costs related to sinkhole damage nationwide range from $125 to $300 million per
year (Kuniansky and others, 2016).

Most damage and injuries resulting from karst-related subsidence in the U.S. are caused by cover-
collapse sinkholes, because these types of sinkholes are extremely common and they typically occur
without warning as sudden ground failures (Weary, 2015). Unlike other natural hazards, cover-collapse
sinkholes generally do not depend on extreme weather events. In many cases, visible indicators of
subsidence and sinkhole development are simply overlooked or misinterpreted. These indicators include

                                                                                                    KGS - 40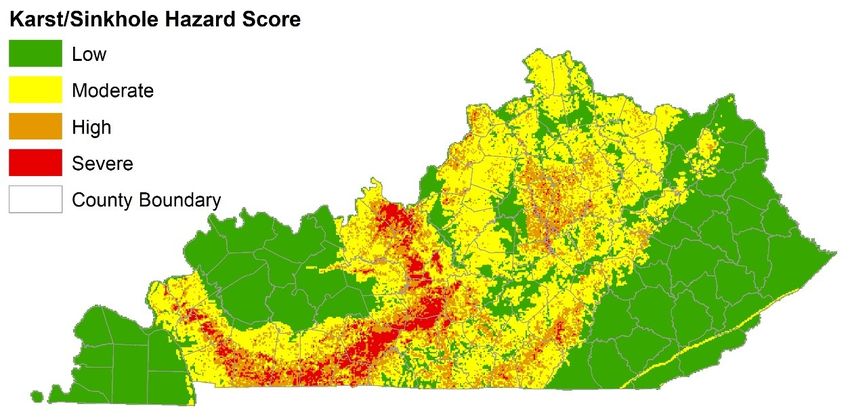
curvilinear cracks developing in soil, asphalt, and concrete; development of swales, gullies, or other
shallow surface depressions that may result in surface ponding of water; slumping, sagging, or tilting of
trees, roads, rails, fences, pipes, poles, signs, and other vertical or horizontal structures; and step-like
fractures developing in the foundations and walls of houses or buildings.

Because of a scarcity of well-documented data, the impact of sinkholes on the economy of Kentucky is
difficult to quantify. Dinger and others (2007) estimated the annual costs of repairs of cover-collapse
damage to be in the range of $20 to $24 million. Two of the most spectacular and best-documented
cases of damage caused by sinkholes in Kentucky are the 2002 Dishman Lane event, which cost $1.2
million to remediate, and the more recent Feb. 12, 2014, National Corvette Museum event, also in
Bowling Green, which cost more than $3.2 million to repair, not including the loss of the cars
themselves, estimated by the museum to be an additional $3.1 million (Polk and others, 2015). The
National Corvette Museum and Dishman Lane sinkholes represent extreme and worst-case scenarios of
damage caused by collapse sinkholes in Kentucky (Fig. 3-4a, b). Fortunately, such large and especially
damaging sinkholes as these are relatively rare in this state. Damage from the more typical cover-
collapse sinkholes varies over a very wide range, but may be generally less than a few thousand to tens
of thousands of dollars per event. Currens (in press) reported that two of the more expensive known
cover collapses that involved private residences resulted in damage costs of $12,000 and $40,000, and
suggested that an average cost of about $16,000 is a reasonable estimate of damage caused by a typical
cover-collapse event that involves a structure such as a house or building.

                         (a)

                                                                                                      KGS - 41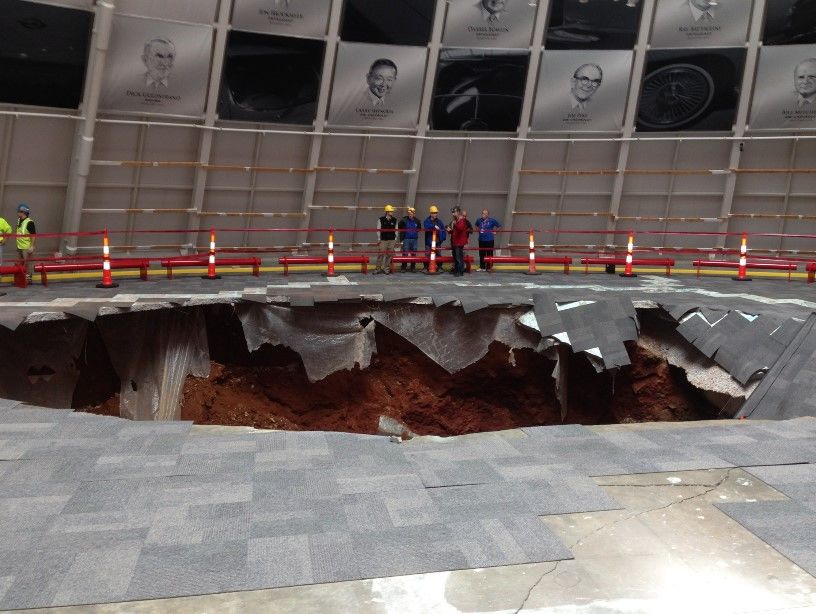
(b)

Figure 3-4. Damage associated with collapse sinkhole events at Dishman Lane in 2003 (a) and the
National Corvette Museum in 2014 (b), both in Bowling Green, is some of the largest ever reported in
Kentucky. (Photo (a) courtesy Western Kentucky University Department of Geography and Geology;
used with permission).

Other Potential Impacts and Hazards

Three other potential karst hazards are worthy of consideration: sinkhole flooding, dam construction
and maintenance, and groundwater/surface-water contamination. With the exception of flooding, these
hazards are relatively rare and are mostly localized in scope and impact. Depending on the specific
location, severity, and circumstances of occurrence, however, they have the potential to have an
adverse impact on large numbers of citizens and local and regional economies. Available data are
insufficient to attempt a quantitative risk assessment about any of the three. The following information
is provided to raise awareness of the issues and provide food for thought about the need for additional
investigation, analysis, and emergency preparedness.

Sinkhole flooding
Karst-related flooding is perhaps an unrecognized hazard in much of the United States, including in
Kentucky. In addition to being a topographic feature, sinkholes and karst valleys (valleys that may be
formed by multiple sinkholes coalescing and that contain sinking or losing streams) have the hydrologic
function of acting as catchment basins in which storm runoff is collected and diverted underground into
the enlarged fractures, cave streams, and solutional openings that comprise the conduit drainage
network of a karst aquifer (Taylor and Greene, 2008). Runoff accumulating in a sinkhole may infiltrate
slowly through soil or sediment or may be drained rapidly underground through throat-like openings
called swallets. Individually and collectively, karst conduits have fixed upper limits on cross-sectional
areas and volumes; therefore, inflows during storms result in increasing flow velocities and hydraulic
head. Whenever the elevation of hydraulic heads in conduits or the larger karst aquifer increase to the
point at which the heads equal or exceed-land surface elevations in sinkhole depressions, flooding
occurs. In the central and western parts of Kentucky where the karst is characterized by expansive

                                                                                                  KGS - 42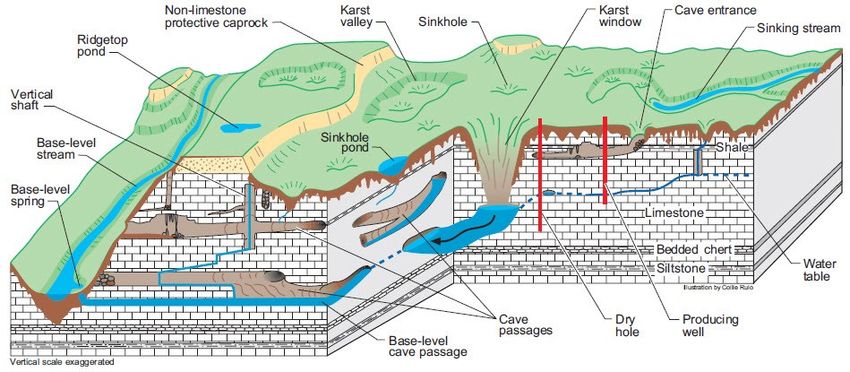
sinkhole plains and larger karst basins tens to hundreds of square miles in area, conditions are favorable
for extensive sinkhole flooding that has the potential to greatly impact local and regional roads,
farmlands, economic activity, and houses and other infrastructure.

Sinkholes and karst valleys may also flood whenever the hydraulic drainage capacities of swallets or
underlying conduits are exceeded by the inflow of storm runoff. This can be exacerbated by land-
development practices (increased impervious surfaces, surface routing of stormwater drainage) and by
swallets being clogged by washed-in sediment, trash, and other debris. An unusually severe and well-
documented case of this type of flood occurred in February 1989 and affected citizens living in the
Tashamingo subdivision and the Delaneys Ferry Road area of Jessamine County (Currens and Graham,
1993). Several homes were isolated by blocked roads, and two homes were flooded; one was damaged
extensively.

Two other mechanisms that are common causes of karst-related flooding are restricted drainage from
sinkholes and the presence of lower-permeability epikarst and bedrock. Unlike in Florida, most sinkholes
in Kentucky do not intersect a base-level (perennial) water table. Instead, relatively thick, clayey residual
soils that form in the bottoms of many sinkholes throughout the state impede downward infiltration and
percolation, especially during intense storms, resulting in intermittent ponding. Development of a
seasonal or intermittent water table perched on lower-permeability carbonate bedrock in the epikarst
zone is another common mechanism that causes or exacerbates flooding of sinkholes and basements,
particularly in urban and suburban areas. Sinkhole- and epikarst-related flooding in Bowling Green and
other parts of Warren County is relatively frequent and has prompted the county to enact strict zoning
regulations and building codes. The City of Versailles has spent more than $500,000 to purchase flood-
damaged property in order to take remedial action. In Lexington, repeated impacts to homes and roads
in several neighborhoods, especially in the Stonewall–Cindy Blair development in southwest Fayette
County, created by epikarst- and sinkhole-related flooding, has cost the Lexington-Fayette Urban County
Government at least $1.5 million in remediation and led to a municipal ordinance on urban
development in and near sinkholes and their associated floodprone areas (Dinger and Rebmann, 1991).

Flood recurrence data and flood inundation maps are unavailable for most of Kentucky’s karst areas at
present. Various approaches for delineating and mapping sinkhole floodplains have been proposed and
implemented, at least experimentally or at local scale, in other states (Kemmerly, 1981; Hart and others,
2009). These mapping attempts lack sufficient data and have certain technical deficiencies.
Development of a suitable methodology for assessing the potential severity and risks associated with
sinkhole flooding in Kentucky, especially in the state’s urban areas, would be extremely beneficial.

Dam Construction and Maintenance
Potential impacts of karst on dam construction and maintenance is another relatively under-recognized
and unassessed potential hazard. A number of mostly low-head dams built for flood control, navigation,
and public water supply are present throughout Kentucky’s karst areas. Many of these are included in a
list of dams with high hazard potential in the National Inventory of Dams compiled by the U.S. Army
Corps of Engineers (www.damsafetyaction.org/KY/about-eaps/where.php; last accessed 4/11/2018).
Issues having to do with construction and long-term maintenance similar to those encountered at Wolf
Creek Dam, for example, could occur at many of these dams or at future dam sites located in the state’s
major karst areas. No study or evaluation has been conducted to date to evaluate the specific role that

                                                                                                     KGS - 43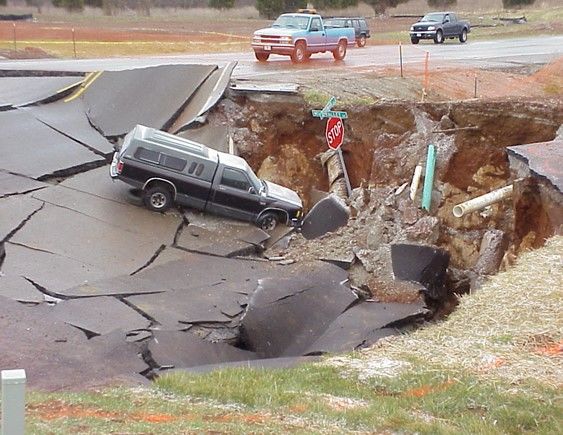
the presence of karst plays in the assessment of the status of these dams. The Water Technology
website (https://www.water-technology.net/projects/wolf-creek-dam-remediation-kentucky-us/; last
accessed 4/11/2018) described the potential scope of the problem, remedial actions, and economic
impacts at Wolf Creek Dam:

        The US Army Corps of Engineers (USACE) completed foundation remediation works for
        the Wolf Creek Dam in March 2013 at total $594 million. The project was carried out to
        prevent possible flooding from the dam, which experienced seepage issues for more
        than five decades. Property damage worth $3bn is estimated on occurrence of a
        potential breaking of the dam. The dam was built on the Cumberland River located in
        south central Kentucky. The geology of the location is mainly composed of Karst
        formations, which lead to the breakup of the limestone in the dam’s foundation. The
        dam first witnessed seepage in 1968. First efforts to avoid seepage were made from
        1968 to 1970 by grouting the dam’s foundation. A major construction project was
        carried out from 1975 to 1979, in which a reinforced concrete cut-off wall was
        constructed through the earth embankment into the rock foundation. The problem was
        still not solved, with seepage intensifying in 2005. The project comprised of constructing
        a new barrier wall upstream on the right side of the concrete monoliths, to stop
        seepage in the Karst geology of the rock. A protective concrete embankment wall
        (PCEW) was also constructed to protect the embankment during the construction of the
        main barrier wall. The construction of the main barrier was completed in March 2013,
        ahead of the estimated December 2013 schedule. The barrier wall utilized about 1,197
        piles measuring three feet in diameter and extending up to 275ft deep into the bedrock
        below the foundation of the embankment, which is about 75ft deeper than the original
        wall. The barrier wall measures 4,200ft in length, which is about 61% longer than the
        existing wall. The protective embankment wall constructed of concrete is six foot wide
        and about 230ft deep. The extension of the wall along the embankment is about
        3,600ft. The construction of the protective wall was completed in June 2012.

Groundwater and Surface-Water Contamination
In Kentucky, thousands of citizens obtain potable water from wells and springs in karst aquifers.
Contaminant releases in karst areas can have rapid and catastrophic effects on drinking-water supplies
(Field, 1992). Contaminants are easily injected into karst aquifers through sinkholes and sinking streams
and through solution-enlarged fractures and shafts in karstified bedrock (Vesper and others, 2001).
Water-tracer tests conducted in karst areas throughout the United States indicate that groundwater and
injected stormwater flows at very rapid rates through conduit networks; contaminant transport times in
karst aquifers commonly range from a few hours to less than a few days, providing little or no
opportunity for contaminant filtration, sorption, or degradation, and little to no time for emergency
response (Worthington, 2011).

Determining when, where, and at what concentration a pollutant will arrive is critical to assessing the
potential impacts of a contaminant spill or release, and initiating a proper emergency response (Field,
1992). Some, but not all, of the data needed to make these assessments are available for parts of the
state’s karst areas. KGS, working collaboratively with the Kentucky Division of Water, has conducted
hundreds of water-tracing tests throughout the state’s karst areas and used this information to develop

                                                                                                     KGS - 44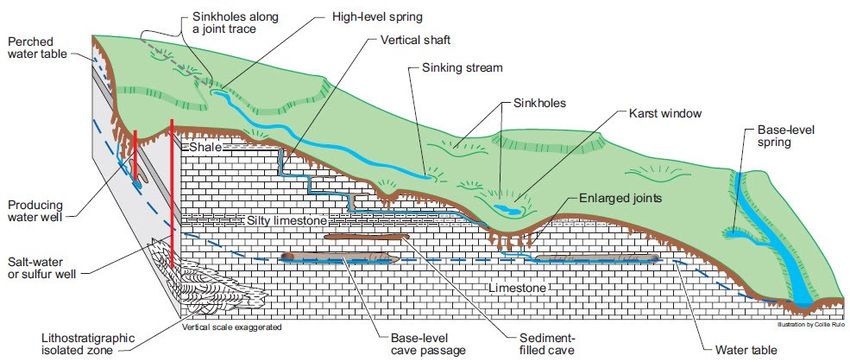
a series of maps of karst-groundwater flow paths and basin boundaries. The information provided by
these maps helps answer the question of where a potential contaminant spill will go and which
downstream users may be affected. In many cases, tracer-test data maintained by KGS and the Division
of Water are also available to at least roughly estimate when a contaminant may arrive. There are few
data to adequately predict at what concentration a contaminant may arrive, nor how long
concentrations will persist in the aquifer above safe drinking-water limits.

The Kentucky Division of Water has the mandated responsibility of protecting public drinking water and
the state’s surface and groundwater resources, and maintains programs such as the Source Water
Protection Assistance Program to help communities and municipal entities develop protection plans for
wellheads and spring basins. Permitted public water suppliers located in karst areas are listed in Table 3-
1. Although wellhead and spring basin protection plans are required for these suppliers, some are based
on minimally adequate quantitative data. Thousands of other citizens in the state obtain drinking water
from private water wells or springs, for which there are no protection plans and for which little is known
about the potential vulnerability of the karst aquifer to contamination. An additional consideration that
is often overlooked is that karst springs and groundwater discharging from karst aquifers contribute to
the surface water of many of the Commonwealth’s streams—these surface-water resources, which are
also the source of much of the public’s drinking water, are therefore also potentially affected by
contaminant spills in karst. Quantitative water-tracing tests and additional mapping of karst aquifers are
needed to provide this vital information and to ensure that the state’s drinking-water resources are
protected and emergency preparedness is adequate.

Table 3-1. Permitted public water suppliers located in karst areas in Kentucky.

 Public Water Supply                                                                             Estimated Population
                                                                                                 Served Directly
 Hardin County Water District No. 1 (includes Fort Knox and Radcliffe)                                              27,033
 Hardin County Water District No. 2 (includes Elizabethtown)                                                        78,326
 Georgetown Municipal                                                                                               35,714
 Cadiz Municipal                                                                                                      5,609
 Green River Valley Water District                                                                                  17,431
                                                                                                 Total:            164,113
Source: Rob Blair, Water Quantity Management Section, Watershed Management Branch, Kentucky Division of Water, written communication,
April 9, 2018.

Table 2. Summary of sinkholes and karst-related hazards.
 Karst/Sinkhole Profile Risk
 Extent                                                             Karst-related hazards: Approximately 55 to 60
                                                                    percent of the state, as indicated by areas
                                                                    underlain by carbonate bedrock and mapped
                                                                    Karst Potential Index1.
 Potential Hazard Impacts                                           Minor to severe structural damage to buildings;
                                                                    increased building or landscape repair and
                                                                    maintenance costs, decreased property values;
                                                                    damage to pipelines and other above- or below-
                                                                    ground utility infrastructure; seepage and
                                                                    underflow, structural undermining, and potential

                                                                                                                            KGS - 45
failure of dams on streams in karst areas;
sinkhole and other karst-related flooding;
groundwater or surface-water contamination in
the event of a chemical spill or release, with the
potential to affect private and public water
supplies.
Period of Occurrence Sinkholes only: At any time.
Number of Events in Kentucky Sinkholes only: 101,632 mapped sinkhole
depressions2; 354 documented cover-collapse
sinkholes (1997–2017)3
Annual Rate of Occurrence Sinkholes only: Unknown; insufficient data
available.
Warning Time Sinkholes: Often cannot be determined;
formation of subsidence sinkholes may provide
early warning signs; cover-collapse sinkholes may
or may not.
Recorded Losses Not documented.
Annualized Loss Undetermined, but estimated at $20–$24
million4.
1 Currens and others (2009)
2 Paylor and others (2003)
3 Currens (in press)
4 Dinger and others (2007)
Assessing Vulnerability by Jurisdiction
Grid-Level Risk Assessment Model
Evaluation of the assessment method in the 2013 Plan
Karst and sinkholes are well recognized as geologic hazards in Kentucky and were included for
risk assessment in the 2013 State Hazard Mitigation Plan (Kentucky Emergency Management,
2013). To assess hazard by jurisdiction, the 2013 plan divided the state using the U.S. National
1-km2 grid, and a hazard score was calculated for each grid cell. The scores statewide were
subsequently divided into four categories using the natural breaks classification, which
partitions data to minimize variation within each group while maximizing difference among
groups. The four hazard categories were low, moderate, high, and severe, in ascending order of
the scores (Fig. 3-5a). In the 2013 plan, the karst/sinkhole hazard score was calculated using a
formula that sums the percentage of areas with potential for karst development and the
percentage of areas of sinkhole occurrence.
The percentage of area with potential for karst was calculated from the Kentucky karst
potential map (Currens and others, 2009), which delineates areas with high and moderate
potential for karst development based on mapped outcrops of carbonate bedrock at or near
KGS - 46the land surface, using 1:500,000-scale geologic maps (Fig. 3-5b). The percentage of area of
sinkhole occurrence was calculated from a sinkhole map (Paylor and others, 2003) derived from
digitizing closed depressions on 1:24,000-scale topographic maps (Fig. 3-5c). The karst
potential map identified a 19,981-km2 area with high karst potential and a 17,968-km2 area
with moderate karst potential. The total area occupied by sinkholes was approximately 1,059
km2, based on the sinkhole map. Because the area identified as having the potential for karst is
much larger than the area of mapped sinkhole occurrence, the spatial distribution of the
karst/sinkhole hazard scores is mostly influenced by karst-potential information and is little
influenced by sinkhole occurrences.
Sinkhole occurrence is a proxy measurement of karstification, however; karstification is also
influenced by additional important hydrogeologic factors such as soil thickness, bedrock
porosity and permeability, topography, and surface and subsurface drainage. Because the
formation of sinkholes is generally recognized as the most prominent karst-related hazard in
Kentucky, we believe the method used to assess karst/sinkhole hazard should give more weight
to the information on sinkhole occurrence.
KGS - 47Figure 3-5. (a) The karst/sinkhole hazard map (from Kentucky Emergency Management, 2013)
in the 2013 plan and the two source datasets: (b) karst potential map and (c) sinkhole map.
Modifications to the Karst/Sinkhole Hazard Assessment in the 2013 Plan
To better incorporate information about sinkhole occurrence, we tested two modifications to
the karst/sinkhole hazard assessment method used in the 2013 plan. The first modification
assigns a higher weight to area percentage of sinkhole occurrence than to area percentage with
KGS - 48karst potential. The second modification substitutes sinkhole density (number of sinkholes per
square kilometer) for percentage area of sinkhole occurrence, and sums sinkhole density and
karst potential area percentage. To compare the results from the two modifications with the
scores in the 2013 plan, the same classification method (natural breaks) and the same four
hazard categories (low, moderate, high, and severe) were used.
Increase Weight for Sinkhole Area Percentage
Calculation of the karst/sinkhole hazard score in the 2013 plan can be expressed as:
0.5 × (karst area percentage) + 0.5 × (sinkhole area percentage) (1)
In equation 1, the weights for karst area percentage and for sinkhole area percentage are equal
(0.5) and sum to 1. To increase the influence of sinkhole area percentage on the score, we
tested several weight combinations of increased weight for sinkhole area percentage and
decreased weight for karst area percentage, while keeping the sum of weights as 1. We found
adjusting sinkhole-occurrence weights in a way that meaningfully improves upon the 2013
hazard scores to be difficult, however. For example, using a weight of 0.75 for sinkhole area
percentage and a weight of 0.25 for karst area percentage, which can be expressed as
0.25 × (karst area percentage) + 0.75 × (sinkhole area percentage) (2)
decreased the overall hazard scores, but barely changed the spatial distribution of hazard
categories with natural breaks(Fig. 3-6a). Using a weight of 0.9 for sinkhole area percentage and
a weight of 0.1 for karst area percentage, which can be expressed as
0.1 × (karst area percentage) + 0.9 × (sinkhole area percentage) (3)
mostly shifted areas from higher hazard categories to lower hazard categories, whereas the
spatial pattern of hazard remained similar to that in the hazard score in the 2013 plan (Fig. 3-
6b).
KGS - 49Figure 3-6. Spatial distribution of karst/sinkhole hazard scores with (a) a weight of 0.75 for
sinkhole area percentage and a weight of 0.25 for karst area percentage and (b) a weight of 0.9
for sinkhole area percentage and a weight of 0.1 for karst area percentage.
Combining Sinkhole Density With Karst Area Percentage
Sinkhole density has been applied in conjunction with other data to assess sinkhole hazard in
other karst regions. For example, Kaufmann and Quinif (2002) delineated three collapse hazard
zones (low, moderate, and high) using sinkhole density and the relationship between the water
KGS - 50table and the top of the limestone bedrock for Tournaisis, Belgium. SSM (2018) defined zones
of low, moderate, and high sinkhole risk based on sinkhole density and carbonate formations in
Pennsylvania. Table 3-3 lists the sinkhole density values used to define hazard categories in the
Kaufmann and Quinif (2002) and SSM (2018) studies, showing that sinkhole density values used
for defining hazard categories are highly dependent on available data and field-specific
conditions.
Table 3-3. Association of sinkhole hazard categories with sinkhole density values for Tournaisis,
Belgium, and Pennsylvania.
Hazard Category Sinkhole Density Used for Sinkhole Density Used for
Tournaisis, Belgium Pennsylvania
Low < 1 per km2 < 1 per mi2
Moderate 1–15 per km2 1–100 per mi2
High > 15 per km2 > 100 per mi2
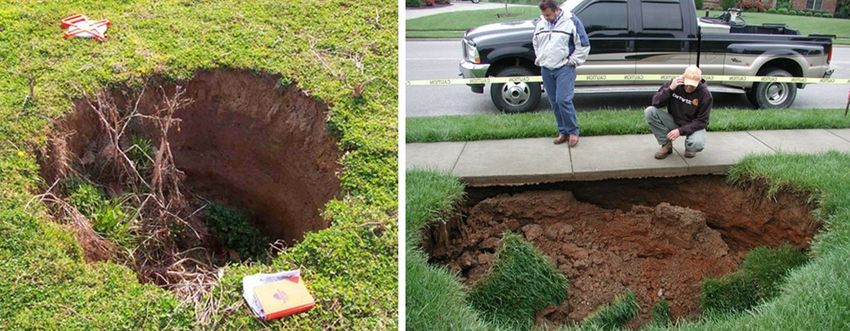
Keeping the same four hazard categories used in the 2013 plan, we identified a combination of
sinkhole density values (Table 3-4) that yields a reasonable spatial distribution of hazard score
(Fig. 3-7).
Table 3-4. Definition of hazard categories in Kentucky in terms of karst area and sinkhole
density.
Hazard Category Definition
Low Area of no potential for karst
Moderate Karst area without sinkholes
High Karst area with 1–9 sinkholes per km2
Severe Karst area with > 9 sinkholes per km2
KGS - 51Figure 3-7. Karst/sinkhole hazard scores based on karst area and sinkhole density.
The hazard scores shown in Figure 3-7 have no associated numerical values. To make the
hazard scores work directly with a numerical exposure score for assessing risk, we developed
the following formula:
karst/sinkhole score= log10((karst area percentage) + (sinkhole density) + 1) (4)
where log10 is the base-10 logarithmic function. The number 1 on the right side of the equation
was added to keep the score positive. The scores calculated from equation (4) are further
normalized to the range 0–1. Figure 3-8 shows the resulting hazard scores.
KGS - 52Figure 3-8. Numerical karst/sinkhole hazard scores based on karst area percentage and sinkhole
density.
Figures 3-7 and 3-8 show that the karst/sinkhole hazard scores calculated from the combination
of karst potential area and sinkhole density have increased spatial variability in hazard
categories in areas with high and moderate karst potential, compared with hazard scores in the
2013 plan. The increased variability is a reflection of the sinkhole occurrences (Fig. 3-5c).
Conclusions
The spatial distribution of the karst/sinkhole hazard scores in the 2013 plan is heavily
influenced by karst-potential information and little influenced by sinkhole occurrences. Because
we believe sinkholes are the most prominent karst-related hazard in Kentucky, we tested two
modifications while using the same data sources as in the 2013 plan. We found the
modification that combines karst potential area and sinkhole density better reflects sinkhole
occurrences and also considers information on karst potential areas.
Future Research Recommendations
Although appropriate assessment methods can improve hazard scores, the scores are
ultimately the result of source data. The karst potential map and sinkhole map used for the
current karst/sinkhole hazard assessment are outdated. The karst potential map is based on
1:500,000-scale geologic maps. A more detailed karst potential map based on 1:24,000-scale
geologic maps is available and more accurately delineates carbonate formations (Currens and
others, 2009). The sinkhole occurrence map used for the 2013 plan was derived from digitizing
closed depressions from 1:24000-scale topographic maps. The topographic maps were mostly
created prior to the 1970s, and many new sinkholes may have formed since then. In addition,
KGS - 53the sinkholes on the topographic maps were not field verified. Zhu and others (2014)
demonstrated that many more sinkholes can be located with high accuracy by using airborne
LiDAR (Light Detection and Ranging) data, and their study led to continued efforts at KGS to use
LiDAR to locate sinkholes in Kentucky since 2014. Up to now, however, sinkholes have been
mapped using LiDAR for only seven counties because of funding and resource constraints.
Consequently, we recommend the following to improve karst/sinkhole hazard assessment in
Kentucky:
1. In the near term, replace the karst potential map with the more detailed karst potential
map (based on 1:24,000-scale geologic maps) in assessing karst area percentage.
2. Accelerate sinkhole mapping using LiDAR through collaboration between KGS, Kentucky
Emergency Management, the Natural Resources Conservation Service, and FEMA, with
the goal of having a statewide sinkhole map based on LiDAR data available for the 2023
mitigation plan update.
Waltham and others (2005) summarized parameters that should be considered when assessing
karst/sinkhole hazard. The parameters applicable to Kentucky are bedrock (type, depth,
fracturing, fault), type of cover soil, topography, and sinkholes (number, size, type). Although
some information on bedrock and sinkholes is considered in the current assessment method, a
future assessment method should test if adding more of the parameters listed above can
improve hazard evaluation.
Although quantifying the karst/sinkhole hazard is important and necessary, as Waltham and
others (2005, p211) noted, “It may be argued that hazard predictions must be inherently
general because of the numerous variables involved, and that attempts to quantify the hazard
or predict the time of collapse are usually inappropriate.”
References Cited
Cecil, M.C., 2015, Population and land use in Kentucky karst regions: University of Kentucky
Departments of Earth and Environmental Sciences and Geography, Kentucky Geological Survey,
independent study final report, 15 p.
Culver, D.C., and White, W.B., eds., 2004, Encyclopedia of caves: Amsterdam, Elsevier Academic Press,
654 p.
Currens, J.C., 2012, Cover-collapse sinkholes in Kentucky, USA: Geographic and temporal distribution:
Carbonates and Evaporites, v. 27, p. 137–142.
Currens, J.C., and Graham, C.D.R., 1993, Flooding of the Sinking Creek karst area in Jessamine and
Woodford Counties, Kentucky: Kentucky Geological Survey, ser. 11, Report of Investigations 7, 33
p.
Currens, J.C., Paylor, R., and Crawford, M., 2009, The karst potential index for Kentucky, progress report
[abs.]: Proceedings of the Kentucky Water Resources Annual Symposium, March 2, 2009,
University of Kentucky, Kentucky Water Resources Research Institute, p. 3–4.
KGS - 54Dinger, J.S., and Rebmann, J.R., 1991, Ordinance for the control of urban development in sinkhole areas
in the Blue Grass karst region, Lexington, Kentucky: Kentucky Geological Survey, ser. 11, Reprint
29, 14 p.
Dinger, J.S., Zourarakis, D.P., and Currens, J.C., 2007, Spectral enhancement and automated extraction
of potential sinkhole features from NAIP imagery—Initial investigations: Journal of Environmental
Informatics, v. 10, no. 1, p. 22–29.
Field, M.S., 1992, Karst hydrology and chemical contamination: Journal of Environmental Systems, v. 22,
no. 1, p. 1–26.
Field, M.S., 1999, A lexicon of cave and karst terminology with special reference to environmental karst
hydrology: U.S. Environmental Protection Agency, National Center for Environmental Assessment
Office of Research and Development, EPA/600/R-02/003, 214 p.
Ford, D.C., and Williams, P.W., 2007, Karst hydrogeology and geomorphology: West Sussex, England,
Wiley, 562 p.
Gulden, B., 2018, USA longest caves: NSS Geo2 Committee on Long and Deep Caves,
www.caverbob.com/usalong.htm [accessed 4/12/2018].
Hart, E.A., Mills, H.H., and Li, P., 2009, Report on sinkhole flooding and determination of 100-year
sinkhole floodplains for the city of Cookeville, TN: Technical report prepared by Tennessee Tech
University, Department of Earth Sciences, for the City of Cookeville, 62 p., www.cookeville-
tn.gov/uploads/planning/files/sinkflood/SinkholeFloodplainReport.pdf [accessed 4/12/2018].
Kambesis, P., Crawford, N., Croft, L.A., Moore, R., and Pfaff, R., 2003, Dishman Lane collapse, Bowling
Green, Kentucky, in Beck, B.F., ed., Sinkholes and the engineering and environmental impacts of
karst: Proceedings of the Ninth Multidisciplinary Conference on Sinkholes and the Engineering and
Environmental Impacts of Karst: American Society of Civil Engineers, Geotechnical Publication 122,
p. 404–737.
Kaufmann, O., and Quinif, Y., 2002. Geohazard map of cover-collapse sinkholes in the Tournaisis area,
southern Belgium: Engineering Geology, v. 65, p. 117–124.
Kemmerly, P., 1981, The need for recognition and implementation of a sinkhole-floodplain hazard
designation in urban karst terrains: Environmental Geology, v. 3, issue 5, p. 281–292.
Kentucky Emergency Management, 2013, Commonwealth of Kentucky enhanced hazard mitigation plan:
Risk assessment [2013 version]: Kentucky Emergency Management, 173 p.
Kuniansky, E.L., Weary, D.J., and Kaufmann, J.E., 2016, The current status of mapping karst areas and
availability of public sinkhole-risk resources in karst terrains of the United States: Hydrogeology
Journal, v. 24, p. 613–662, DOI 10.1007/s10040-015-1333-3.
Monroe, W.H., 1970, A glossary of karst terminology: U.S. Geological Survey Water-Supply Paper 1899,
26 p.
Paylor, R.L., Florea, L., Caudill, M., and Currens, J.C., 2003, A GIS coverage of karst sinkholes in Kentucky:
Kentucky Geological Survey, ser. 12, Digital Publication 5, www.uky.edu/KGS/gis/sinkpick.htm
[accessed 4/12/2018].
KGS - 55Polk, J.S., North, L., Federico, R., Ham, B., Nedvidek, D., McClanahan, K., Kambesis, P., and Marasa, M.,
2015, Cars and karst: Investigating the National Corvette Museum sinkhole, in Doctor, D.H, Land,
L., and Stephenson, J.B., eds., Sinkholes and the Engineering and Environmental Impacts of Karst,
Proceedings of the Fourteenth Multidisciplinary Conference, Oct. 5–9, 2015, Rochester, Minn.:
National Cave and Karst Research Institute, Symposium 5, Carlsbad, N.Mex., p. 477–482,
dx.doi.org/10.5038/9780991000951.1062.
Quinlan, J.F., Smart, P.L., Schindel, G.M., Alexander, E.C., Edwards, A.J., and Smith, A.R., 1991,
Recommended administrative/regulatory definition of karst aquifer, principles for classification of
carbonate aquifers, practical evaluation of vulnerability of karst aquifers, and determination of
optimum sampling frequency at springs, in Quinlan J.F., and Stanley A., eds., Proceedings of the
Third Conference on Hydrology, Ecology, Monitoring, and Management of Ground Water in Karst
Terranes, Nashville, Tenn.: National Ground Water Association, p. 573–635.
SSM Group (Spotts, Stevens and McCoy Group, Inc.), 2018, Interactive sinkhole risk map:
ssm.maps.arcgis.com/apps/MapJournal/index.html?appid=623bb29640194ac3a02dd7f10dbf4b29
[accessed 2/18/2018].
Taylor, C.J., and Greene, E.A., 2008, Hydrogeologic characterization and methods used in the
investigation of karst hydrology, in Rosenberry, D.O., and LaBaugh, J.W., eds., Field techniques for
estimating water fluxes between surface water and groundwater: U.S. Geological Survey
Techniques and Methods 4-D2, ch. 3, p. 71–114.
Vesper, D.J., Loop, C.M., and White, W.B., 2001, Contaminant transport in karst aquifers: Theoretical
and Applied Karstology, v. 13-14, p. 101–111.
Waltham T., Bell, F., and Culshaw, M., 2005, Sinkholes and subsidence: Karst and cavernous rocks in
engineering and construction: Berlin, Springer, 382 p.
Weary, D.J., 2015, The cost of karst subsidence and sinkhole collapse in the United States compared
with other natural hazards, in Doctor, D.H., Land, L., and Stephenson, J.B., eds., Sinkholes and the
Engineering and Environmental Impacts of Karst, Proceedings of the Fourteenth Multidisciplinary
Conference, Oct. 5–9, 2015, Rochester, Minn.: National Cave and Karst Research Institute,
Symposium 5, Carlsbad, N.Mex., p. 433–445, dx.doi.org/10.5038/9780991000951.1062.
Weary, D.J., and Doctor, D.H., 2014, Karst in the United States: A digital map compilation and database:
U.S. Geological Survey Open-File Report 2014–1156, 23 p., dx.doi.org/10.3133/ofr20141156.
Worthington, S.R.H., 2011, Management of carbonate aquifers, in Van Beynen, P.E., ed., Karst
management: Dordrecht, Springer, p. 243–261, doi 10.1007/978-94-007-1207-2_11.
Zhu, J., Taylor, T.P., Currens, J.C., and Crawford, M.M., 2014, Improved karst sinkhole mapping in
Kentucky using LiDAR techniques: A pilot study in Floyds Fork watershed: Journal of Cave and
Karst Studies, v. 76, no. 3, p. 207–216, DOI: 10.4311/2013ES0135.
KGS - 56A Note on Future Conditions 1
The Commonwealth of Kentucky Enhanced Hazard Mitigation Plan for 2018 (CK-EHMP
2018) has relied on a recent study on climate conditions from modeling specific to
Kentucky that was conducted by the United States Army Corps of Engineers (USACE)
and the Ohio River Basin Alliance (ORB Alliance). This study is called Ohio River Basin:
Formulating Climate Change Mitigation/Adaptation Strategies through Regional
Collaboration with the ORB Alliance.
From this study, the Commonwealth of Kentucky assumes the following:
• There has been a gradual warming trend throughout the Ohio River Basin since the
late 1970s.
• Precipitation has increased during the latter summer and early fall months since the
late 1970s.
• Summer highs and winter lows between 2011 and 2040 will remain generally within
what has been observed over that historic period. (But, record temperatures, rainfall,
or drought cannot be ruled out.)
• The influence of the jet stream across the Ohio River Basin latitudes increases the
variability of the weather (and further complicates forecasting future climatic
conditions).
• Significant changes in river flow discharges and mean annual air temperatures will not
be occurring before 2040. The climate will not vary substantially from what has been
experienced between 1952 and 2001.
In other words, there has been gradual warming since the late 1970s. This gradual
warming will continue without much significant change until 2040. (After 2040, the
modeling in the study predicts temperatures may rise one (1) degree every decade
through 2099.) Further, part of this gradual warming since the late 1970s involves
precipitation increases. Precipitation increases affects nearly every hazard identified in
this hazard mitigation plan: Landslides are triggered by precipitation; sinkholes flood with
increased precipitation; flash flooding increases from severe storms; and winter storms
either increase or become more severe.
The variability interpretation also is interesting and applicable to expected future
conditions for Kentucky’s identified hazards:
With gradual warming and its effects on summer highs and winter lows, with increased
precipitation, and with increased variability of the weather, it is expected that the
probability (or, rather, the frequency and/or severity) of sinkhole events, particularly
sinkhole flooding events, will increase.
1
The below statement is made by the University of Kentucky Hazard Mitigation Grants Program Office (UK-HMGP) and by
Kentucky Emergency Management (KYEM) and does not necessarily reflect the views of the Kentucky Geological Survey (KGS).
KGS - 57You can also read