Dynamics of Disruption in Science and Technology
←
→
Page content transcription
If your browser does not render page correctly, please read the page content below
Dynamics of Disruption in Science and Technology∗
                                                                             Michael Park1 , Erin Leahey2 , and Russell J. Funk1
                                                                       1
                                                                           Carlson School of Management, University of Minnesota
                                                                                 2
                                                                                   School of Sociology, University of Arizona

                                                                                             June 29, 2021
arXiv:2106.11184v2 [cs.SI] 26 Jun 2021

                                                                                                 Abstract
                                                   Although the number of new scientific discoveries and technological inventions has increased dramati-
                                               cally over the past century, there have also been concerns of a slowdown in the progress of science and
                                               technology. We analyze 25 million papers and 4 million patents across 6 decades and find that science
                                               and technology are becoming less disruptive of existing knowledge, a pattern that holds nearly universally
                                               across fields. We link this decline in disruptiveness to a narrowing in the utilization of existing knowledge.
                                               Diminishing quality of published science and changes in citation practices are unlikely to be responsible
                                               for this trend, suggesting that this pattern represents a fundamental shift in science and technology.

                                            ∗ E-mail park1892@umn.edu, leahey@arizona.edu, or rfunk@umn.edu. We thank the National Science Foundation for financial

                                         support of work related to this project (grants 1829168 and 1932596) and the participants of the CADRE workshop for their
                                         feedback.

                                                                                                     1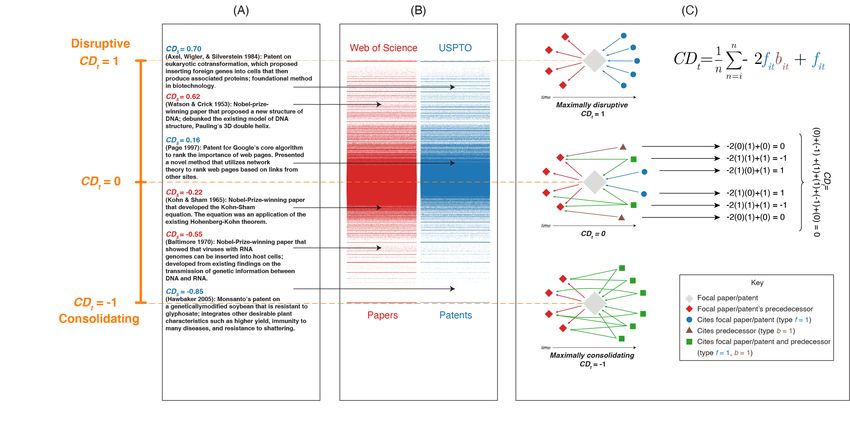
While the past century witnessed an unprecedented expansion in scientific and technological knowledge,
there are growing concerns about a possible slowing of innovative activity [Jones, 2009, Gordon, 2016, Cowen
and Southwood, 2019, Bhattacharya and Packalen, 2020]. Studies have documented declining research
productivity in semiconductors, pharmaceuticals, agriculture, and other fields [Pammolli et al., 2011, Bloom
et al., 2020]. Over time, papers, patents, and even grant applications have become less novel and less likely
to connect disparate areas of knowledge, both of which are important precursors of innovation [Foster et al.,
2015, Mukherjee et al., 2016, Packalen and Bhattacharya, 2020, Jaffe and Lerner, 2011]. The gap between
the year of discovery and the awarding of a Nobel Prize has also increased [e.g., Horgan, 2015, Jones and
Weinberg, 2011, Collison and Nielsen, 2018], suggesting that today’s contributions may not measure up to
those of the past.
    Numerous explanations for this apparent slowdown have been proposed. Some point to a dearth of
“low hanging fruit,” as the easier and more obvious innovations have already been produced [Arbesman,
2011, Cowen, 2011, Gordon, 2016]. Others suggest that the decline may be due to an increasing burden of
knowledge; scientists and technologists require more training to reach the frontiers of their fields, leaving less
time for making breakthroughs [e.g., Einstein, 1949, Jones, 2009, Chu and Evans, 2018]. Yet much remains
unknown, not merely about the causes of slowing innovative activity, but also the depth and breadth of the
phenomenon. To date, the evidence pointing to a slowdown is based largely on studies of particular fields,
using disparate and domain-specific metrics [Pammolli et al., 2011, Bloom et al., 2020], making it difficult to
know whether the observed changes are happening at a similar rate across areas of science and technology.
Little is also known about whether the patterns seen in aggregate indicators may mask important differences
in the degree to which individual works push the boundaries of science and technology.
    In this study, we address these gaps in knowledge by analyzing 25 million research papers from 1945 to
2010 in the Web of Science database (“WoS data”) and 4 million utility patents from 1976 to 2010 in the
United States Patent and Trademark Office’s Patents View database (“USPTO data”). The WoS data include
159 million citations and the text of 28 million paper titles and abstracts. The USPTO data include 18 million
citations and the text of 6 million patent titles and abstracts. Using these data, we join a novel citation-based
measure [Funk and Owen-Smith, 2017] with textual analyses of titles and abstracts to understand whether
papers and patents forge new directions in science and technology over time and across fields.
    To characterize the nature of innovation, we draw on insights from foundational theories of scientific and
technological change [Arthur, 2007, Schumpeter, 1947], which distinguish between two types of breakthroughs.
First, some contributions improve and refine existing streams of knowledge, and therefore consolidate the
scientific or technological status quo. For example, the Nobel Prize winning paper1 Kohn and Sham [1965]
(“KS”) utilized established theorems to develop a method for calculating the structure of electrons, which
cemented the value of prior research. Second, some contributions disrupt existing streams of knowledge,
rendering them obsolete, and propelling future scientific or technological work in new directions. As an
illustration, Watson and Crick [1953] (“WC”), also a Nobel winner, introduced a new (and better) model of
the structure of DNA, which superseded previous approaches and detracted attention away from that prior
work (e.g., Pauling’s triple helix model). KS and WC were both important papers, but their implications for
scientific and technological change were dramatically different.
    To quantify this distinction, we utilize a novel measure—the CD index—which characterizes the consoli-
dating/disruptive nature of science and technology based on the citation networks that form around papers
or patents (fig. 1). The intuition underpinning this measure is that if a paper or patent is disruptive, the
subsequent work that cites it is less likely to also cite its predecessors; for future scientists and technologists,
the ideas that went into its production are less relevant (e.g., Pauling’s triple helix model). If a paper or patent
is consolidating, subsequent work that cites it is also more likely to cite its predecessors; for future researchers,
the prior knowledge upon which the paper or patent builds is still (and perhaps more) relevant (e.g., the
existing theorems KS used to develop their method). The CD index ranges from -1 (most consolidating) to 1
(most disruptive). For our study, we measure the CD index five years after the year of publication (indicated
by CD5 ). As an illustrative example, the WC paper and KS paper both received over a hundred citations
within five years of publication, indicating major attention from subsequent work. However, measured within
the same window, the KS paper has a CD5 index value of -0.22 (indicating consolidation), whereas the WC
paper has a CD5 index value of 0.62 (indicating disruption). The CD5 index has been validated extensively

   1 Data   on Nobel-Prize-winning papers are taken from Li et al. [2019].

                                                               2
in prior research and corresponds closely with expert assessments of disruptive work [Funk and Owen-Smith,
2017, Wu et al., 2019, Bornmann et al., 2019].
Across all fields of science and technology, we find that the rate of disruptive scientific work is declining.
Fig. 2 plots the average CD5 index over time for papers (fig. 2A) and patents (fig. 2B). For papers, the
magnitude of decrease from 1945 to 2010 ranges between 91.9% (for Social Science) and 100% (for Physical
Science); for patents, the corresponding magnitude from 1980 to 2010 ranges from 93.5% (for Computers and
Communications) and 96.4% (for Drugs and Medical). These declines demonstrate that relative to earlier
eras, papers and patents published more recently do less to push science and technology in new directions.2
The general similarity in trends we observe across fields is noteworthy in light of arguments made in prior
work on the disappearance of “low hanging fruit” (i.e., the idea that all the “easy” discoveries and inventions
have already been made) [Cowen, 2011, Gordon, 2016]. Specifically, these arguments would likely predict
greater heterogeneity in the decline, as it seems unlikely that fields with very different subject matter and
ages would “consume” their low hanging fruit at similar times and rates.
The trends we observe are robust, and hold when we use alternate, non-bibliometric, indicators that
rely on analysis of text. Because they create departures from the status quo, disruptive papers and patents
are also likely to introduce new words (i.e., ideas, concepts, explanations). Therefore, if disruptiveness is
declining, we should expect to see a decline in the diversity of words used in science and technology. To
evaluate this possibility, figs. 3A and C document lexical diversity based on the type-token ratio (i.e., the
ratio of unique to total words) of titles of papers and patents, respectively, over time (S2). Across both
science and technology, we observe substantial declines in lexical diversity. For paper titles (fig. 3A), the
magnitude of decrease (from 1945 to 2010) ranges between 88% (for Technology) and 76.5% (for Social
Science); for patent titles (fig. 3B), the magnitude of decrease (from 1980 to 2010) ranges between 81% (for
Computer and Communications) and 32.5% (for Chemical). For paper abstracts (fig. S2A), the magnitude
of decrease (from 1992 to 2010) ranges between 38.9% (for Social Science) and 23.1% (for Life Science and
Biomedicine); for patent abstracts (fig. S2B), the magnitude of decrease (from 1980 to 2010) ranges between
73.2% (for Computers and Communications) and 21.5% (for Mechanical). In S7, we conduct additional
statistical analyses to show that the decline in disruptiveness is unlikely due to field-specific characteristics by
decomposing the proportion of decline attributable to field, author, and year characteristics.
A decline in disruptive activity is apparent not only in reduced lexical diversity, but also in the verbs used
to describe scientific work. If disruptiveness is declining, then verbs alluding to the creation, discovery, or
perception of new things (“disruptive” words) should be used less often over time, whereas verbs alluding
to improvement, application, or assessment of existing things (“consolidating” words) should be used more
frequently. Fig. 3 shows changes in the top 10 most common verbs in paper titles (fig. 3B) and patent titles
(fig. 3D) by decade. For both papers and patents, we find a decrease in the relative number of disruptive
words (blue) and an increase in the number of consolidating words (red), as classified by a panel of reviewers
(S3). Consider the verb, “produce,” which is indicative of disruptive work (e.g., in the sense of producing
new knowledge); in patent titles use of this verb declined in three of the four decades (fig. 3D); a similarly
steep decline was observed in paper titles (table S1). For example, “produce” was used in the title of
Nobel-prize-winning paper by Ingle and Kendall [1937], which used cortin to produce atrophy of the adrenal
cortex in rats. This paper has a CD5 index of 0.56, reflecting its disruptive tendency. Conversely, the verb
“use” is more indicative of consolidating work (e.g., in the sense of using existing knowledge). Utilization of the
verb “use” increased in frequency across all decades in patent titles (fig. 3D) and underwent one of the greatest
increases in utilization in both paper and patent titles (table S1). For example, “use” appears in the title of
the Nobel-prize-winning paper “Understanding, improving, and using green fluorescent proteins” by Cubitt
et al. [1995] to indicate the improvement and application of a previously studied compound. Accordingly, the
paper has a CD5 index of -0.09, reflecting its consolidating tendency. Overall, these textual results affirm
that science and technology has become less disruptive over time.
The trend in “average disruptiveness” that we document disguises considerable heterogeneity in disrup-
tiveness and remarkable stability in the absolute number of highly disruptive works (S4). This result suggests
that the persistence of major breakthrough innovations in science and technology—such as the measurement
of gravity waves, sequencing of the human genome, and development of mRNA COVID-19 vaccines—are
actually consistent with growing expressions of concern about slowing innovative activity. In short, declining
2 In S1, we report similar patterns of decline using alternative measures of disruptiveness.
3aggregate rates of disruptive science and technology do not preclude the possibility of individually highly
disruptive papers or patents.
The patterns of decline in aggregate disruptiveness we observe raise interesting questions about the
underlying causes. Earlier, we suggested that our results are not consistent with explanations that tie slowing
innovative activity to the dearth of “low-hanging fruit.” We also considered several additional possibilities.
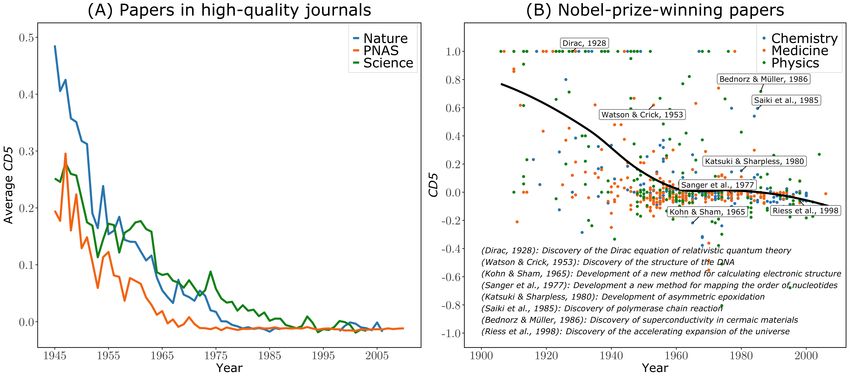
Our analyses suggest that declining rates of disruptive activity are not likely due to a reduction in the
quality of scientific work. If declining disruption is driven by lowering quality standards [e.g., Jaffe and Lerner,
2011, Ioannidis, 2005, Evans, 2013], then the patterns we see in Fig. 2A and B should be less visible when we
subset to work that is likely higher quality. However, this is not the case. When we restrict our sample to
articles published in premier publication venues like Nature, PNAS, and Science or to Nobel-Prize-winning
discoveries (S5), the downward trend in disruptive work holds.
The decline in disruptiveness is also not attributable to changes in citation practices (S6). Given that
the CD5 index is based on forward and backward citations, we use Monte Carlo simulations to randomly
rewire the observed citation networks for both papers and patents. The rewiring algorithm preserves several
structural properties of the underlying networks, including the number of citations to and from each paper or
patent and the age distributions of citing and cited works. We find that values of the empirically observed
CD5 measure are generally lower than those of the simulated CD5 measure (fig. S5): the differences between
the observed and simulated CD5 measures are statistically significant for papers (Kolmogorov-Smirnov
statistic = 0.3903, p < 0.001) and patents (Kolmogorov-Smirnov statistic = 0.1870, p < 0.001). This suggests
that the decline in the CD5 index is unlikely to be driven by changes in citation practices.
Finally, we considered whether declining disruptiveness may be related to the growth of knowledge in
science and technology. On the one hand, as noted previously, scientists and inventors face an increasingly
large burden of knowledge, which may make innovation more challenging. On the other hand, research has
also long suggested that “knowledge begets knowledge” [Romer, 1990, Acemoglu et al., 2016], an idea captured
perhaps most famously in Isaac Newton’s observation in a letter to Robert Hooke, “If I have seen further it
is by standing on the shoulders of Giants” [Koyré, 1952]. Thus, the growth of scientific and technological
knowledge may plausibly be associated with increasing disruptiveness. We evaluated this possibility in a
series of regression models that predicted the CD index as a function of accumulated papers and patents
(a proxy for knowledge) in fields of science and technology (S8). Across models and specifications (S2), we
find a positive and significant association, consistent with the “knowledge begets knowledge” view. This
result is somewhat surprising, both given prior work on the “burden of knowledge” and our own previous
demonstration that periods of declining disruptiveness also coincided with major increases in publishing and
patenting.
We therefore considered that the availability of knowledge may be different from its utilization. In
particular, the dramatic growth in publishing and patenting activity may lead scientists and technologists to
focus on more narrow slices of prior work. As a result, researchers and inventors tend to use far less of the
total existing knowledge space, dampening the rate of disruptive scientific activity [Varga, 2019]. Using three
proxies for utilization, we document a decline in the range of utilized knowledge in science and technology
(fig. 4). First, in all fields we see a decline in the diversity of work cited (fig. 4A and D), indicating that
an increasingly narrower selection of available science and technology is being utilized. Second, we see an
increase in self-citations (fig. 4B and E), which suggests an increased reliance on knowledge that is highly
familiar to author teams. Third, the mean age of work cited is increasing for papers and patents (fig. 4C
and F), suggesting that scientists and technologists may be struggling to keep up with the pace of expansion
in new knowledge and instead rely on older, and likely more familiar, work. All three indicators point to a
consistent story: a narrower scope of existing science and technology is being utilized across all fields. Results
from a series of regression models suggest that utilizing less diverse work, more of one’s own work, and older
work is negatively associated with disruption (S9). When the range of work utilized by scientists narrows,
disruptive activity declines.
In this paper, we document a dramatic decline in the rate of disruptive work across all fields of science
and technology, over several decades. Our analyses show that changes in citation practices and in the quality
of publications are probably not responsible for the decline in disruption. Rather, the decline represents
a substantive change in the nature of science and technology over time, which aligns with concerns about
slowing rates of innovative activity [Evans, 2008]. We document that the dramatic change in the nature of
science and technology is likely attributable at least in part to scientists’ reliance on a narrower set of extant
4research.
These findings have several significant implications. First, when evaluating the progress of science and
technology, it is critical to consider the nature of work that is being produced. The sheer number of papers
and patents fails to capture whether and how new work is pushing existing knowledge in new directions.
To understand the expansion and evolution of the frontiers of science and technology, the nature of new
science and technology being produced should be considered. Second, to foster more disruptive work in
science and technology, a broader array of extant knowledge should be incorporated. Given the vast amount
of scientific work produced, and scientists’ limited human capacity, this is definitely a challenge, but one that
collaborative and diverse teams may help us meet.
5Figure 1: Measurement approach. This figure presents a schematic overview of the CD index. A shows the value of the CD5 index for three Nobel-prize-winning papers
and three notable patents. B shows the distribution of the CD5 measure for all Web of Science papers and USPTO patents in our analytical sample. C shows example citation
networks around three papers/patents wherein the CD index is at the maximally disruptive value (CDt = 1), median value (CDt =0), and maximally consolidating value (CDt =
-1). The panel also provides the equation of the CD index and calculates the CD index for the median value example.
6Figure 2: CD index over time. This figure shows changes in CD5 over time, separately for papers (A) and patents (B).
For papers, lines correspond to Web of Science research areas; for patents, lines correspond to NBER technology categories.
(A) Papers (B) Patents
Life Sciences and biomedicine Chemical
0.5 Physical sciences 0.5 Computers and communications
Social sciences Drugs and medical
Technology Electrical and electronic
Mechanical
0.4 0.4
Average CD5
Average CD5
0.3 0.3
0.2 0.2
0.1 0.1
0.0 0.0
1960 1980 2000 1980 1985 1990 1995 2000 2005 2010
Year Year
7Figure 3: Dynamics of disruption in paper and patent titles. This figure shows evidence of declining disruption across fields of science (A and B) and technology (C
and D) based on the lexical diversity (A and C) and the most common verbs used in paper and patent titles (B and D). Lexical diversity is measured by the type-token ratio.
Disruptive and consolidating verbs were classified by a panel of reviewers (see S3). For papers, lines correspond to Web of Science research areas; for patents, lines correspond to
NBER technology categories.
8Figure 4: Utilization of scientific and technological knowledge. This figure shows the changes in the diversity of
knowledge that is utilized in science (A, B, and C) and technology (D, E, and F) based on the following measures: diversity of
work cited (A and D), rate of self-citations (B and E), and mean age of cited work (C and F). For papers, lines correspond to
Web of Science research areas; for patents, lines correspond to NBER technology categories.
Papers
(A) (B) (C)
1.00 5 14
Mean self-citations per paper
0.99 12
Mean age of work cited
4
Diversity of work cited
10
0.98
3 8 Life Sciences and biomedicine
0.97 Physical sciences
2 6
0.96
Social sciences
4 Technology
1
0.95 2
0.94 0 0
1960 1980 2000 1960 1980 2000 1960 1980 2000
Year Year Year
Patents
(D) (E) (F)
1.00 5 14
Mean self-citations per patent
0.99 12
Mean age of work cited
4
Diversity of work cited
10
0.98 Chemical
3 8 Computers and communications
0.97
6 Drugs and medical
2
0.96 Electrical and electronic
4
Mechanical
1
0.95 2
0.94 0 0
1980 1990 2000 2010 1980 1990 2000 2010 1980 1990 2000 2010
Year Year Year
9References
Daron Acemoglu, Ufuk Akcigit, and William R Kerr. Innovation network. Proceedings of the National
Academy of Sciences, 113(41):11483–11488, 2016.
Samuel Arbesman. Quantifying the ease of scientific discovery. Scientometrics, 86(2):245–250, 2011.
W Brian Arthur. The structure of invention. Research Policy, 36(2):274–287, 2007.
Jay Bhattacharya and Mikko Packalen. Stagnation and scientific incentives. Technical report, National
Bureau of Economic Research, 2020.
Nicholas Bloom, Charles I Jones, John Van Reenen, and Michael Webb. Are ideas getting harder to find?
American Economic Review, 110(4):1104–44, 2020.
Lutz Bornmann and Rüdiger Mutz. Growth rates of modern science: A bibliometric analysis based on
the number of publications and cited references. Journal of the Association for Information Science and
Technology, 66(11):2215–2222, 2015.
Lutz Bornmann, Sitaram Devarakonda, Alexander Tekles, and George Chacko. Do disruption index indicators
measure what they propose to measure? the comparison of several indicator variants with assessments by
peers. arXiv preprint arXiv:1911.08775, 2019.
Lutz Bornmann, Sitaram Devarakonda, Alexander Tekles, and George Chacko. Are disruption index indicators
convergently valid? the comparison of several indicator variants with assessments by peers. Quantitative
Science Studies, 1(3):1242–1259, 2020.
Johan SG Chu and James Evans. Too many papers? slowed canonical progress in large fields of science.
Working Paper, 2018.
Patrick Collison and Michael Nielsen. Science is getting less bang for its buck. The Atlantic, 2018.
Sergio Correia. Reghdfe: Stata module to perform linear or instrumental-variable regression absorbing
any number of high-dimensional fixed effects, 2019. URL https://EconPapers.repec.org/RePEc:boc:
bocode:s457874.
Tyler Cowen. The great stagnation: How America ate all the low-hanging fruit of modern history, got sick,
and will (eventually) feel better: A Penguin eSpecial from Dutton. Penguin, 2011.
Tyler Cowen and Ben Southwood. Is the rate of scientific progress slowing down, 2019.
Andrew B Cubitt, Roger Heim, Stephen R Adams, Aileen E Boyd, Larry A Gross, and Roger Y Tsien.
Understanding, improving and using green fluorescent proteins. Trends in Biochemical Sciences, 20(11):
448–455, 1995.
Marc A Edwards and Siddhartha Roy. Academic research in the 21st century: Maintaining scientific integrity
in a climate of perverse incentives and hypercompetition. Environmental Engineering Science, 34(1):51–61,
2017.
Albert Einstein. The world as I see it. Citadel Press, 1949.
James A Evans. Electronic publication and the narrowing of science and scholarship. Science, 321(5887):
395–399, 2008.
James A Evans. Future science. Science, 342(6154):44–45, 2013.
Jacob G Foster, Andrey Rzhetsky, and James A Evans. Tradition and innovation in scientists’ research
strategies. American Sociological Review, 80(5):875–908, 2015.
Russell J Funk. Making the most of where you are: Geography, networks, and innovation in organizations.
Academy of Management Journal, 57(1):193–222, 2014.
10Russell J Funk and Jason Owen-Smith. A dynamic network measure of technological change. Management
Science, 63(3):791–817, 2017.
Robert J Gordon. The rise and fall of American growth. Princeton University Press, 2016.
Ulrike Grömping. Estimators of relative importance in linear regression based on variance decomposition.
The American Statistician, 61(2):139–147, 2007.
John Horgan. The end of science: Facing the limits of knowledge in the twilight of the scientific age. Basic
Books, 2015.
Frank Huettner, Marco Sunder, et al. Axiomatic arguments for decomposing goodness of fit according to
shapley and owen values. Electronic Journal of Statistics, 6:1239–1250, 2012.
Dwight J Ingle and EC Kendall. Atrophy of the adrenal cortex of the rat produced by the administration of
large amounts of cortin. Science, 86(2228):245–245, 1937.
John PA Ioannidis. Why most published research findings are false. PLoS Medicine, 2(8):e124, 2005.
Adam B Jaffe and Josh Lerner. Innovation and its discontents: How our broken patent system is endangering
innovation and progress, and what to do about it. Princeton University Press, 2011.
Benjamin F Jones. The burden of knowledge and the “death of the renaissance man”: Is innovation getting
harder? The Review of Economic Studies, 76(1):283–317, 2009.
Benjamin F Jones and Bruce A Weinberg. Age dynamics in scientific creativity. Proceedings of the National
Academy of Sciences, 108(47):18910–18914, 2011.
Walter Kohn and Lu Jeu Sham. Self-consistent equations including exchange and correlation effects. Physical
Review, 140(4A):A1133, 1965.
Alexandre Koyré. An unpublished letter of robert hooke to isaac newton. Isis, 43(4):312–337, 1952.
Loet Leydesdorff, Alexander Tekles, and Lutz Bornmann. A proposal to revise and simplify the disruption
indicator. Available at SSRN, 2020.
Jichao Li, Yian Yin, Santo Fortunato, and Dashun Wang. A dataset of publication records for nobel laureates.
Scientific Data, 6(1):1–10, 2019.
Chao Lu, Yi Bu, Xianlei Dong, Jie Wang, Ying Ding, Vincent Larivière, Cassidy R Sugimoto, Logan Paul,
and Chengzhi Zhang. Analyzing linguistic complexity and scientific impact. Journal of Informetrics, 13(3):
817–829, 2019.
Staša Milojević. Quantifying the cognitive extent of science. Journal of Informetrics, 9(4):962–973, 2015.
Satyam Mukherjee, Brian Uzzi, Ben Jones, and Michael Stringer. A new method for identifying recombinations
of existing knowledge associated with high-impact innovation. Journal of Product Innovation Management,
33(2):224–236, 2016.
Mark EJ Newman, Steven H Strogatz, and Duncan J Watts. Random graphs with arbitrary degree distributions
and their applications. Physical Review E, 64(2):026118, 2001.
Mikko Packalen and Jay Bhattacharya. Nih funding and the pursuit of edge science. Proceedings of the
National Academy of Sciences, 117(22):12011–12016, 2020.
Fabio Pammolli, Laura Magazzini, and Massimo Riccaboni. The productivity crisis in pharmaceutical r&d.
Nature Reviews Drug Discovery, 10(6):428–438, 2011.
Paul M Romer. Endogenous technological change. Journal of Political Economy, 98(5, Part 2):S71–S102,
1990.
11Matthew J Salganik and Karen EC Levy. Wiki surveys: Open and quantifiable social data collection. PloS
One, 10(5):e0123483, 2015.
Joseph A Schumpeter. The creative response in economic history. The Journal of Economic History, 7(2):
149–159, 1947.
Brian Uzzi and Jarrett Spiro. Collaboration and creativity: The small world problem. American Journal of
Sociology, 111(2):447–504, 2005.
Attila Varga. Shorter distances between papers over time are due to more cross-field references and increased
citation rate to higher-impact papers. Proceedings of the National Academy of Sciences, 116(44):22094–22099,
2019.
James D Watson and Francis HC Crick. Molecular structure of nucleic acids: a structure for deoxyribose
nucleic acid. Nature, 171(4356):737–738, 1953.
Lingfei Wu, Dashun Wang, and James A Evans. Large teams develop and small teams disrupt science and
technology. Nature, 566(7744):378–382, 2019.
12Supplementary Materials
Description Category
S1 Analysis using alternative measures of disruptiveness Supplemental analysis
S2 Analysis of paper and patent titles and abstracts Supplemental information
S3 Classification of disruptive and consolidating words Supplemental information
S4 Analysis of highly disruptive papers and patents over time Supplemental analysis
S5 Is the decline driven by changes in publication quality? Alternative explanation
S6 Is the decline driven by changes in citation practices? Alternative explanation
S7 Is the decline driven by changes in authors? Alternative explanation
S8 The growth of knowledge Supplemental analysis
S9 Disruptiveness and the utilization of knowledge Supplemental analysisS1 Analysis using alternative measures of disruptiveness
Several recent papers have introduced alternative specifications of Funk and Owen-Smith [2017]’s CD index.
In supplementary analyses, we evaluated whether the declines in disruptiveness we observe are visible using
these alternative measures. First, we randomly drew 100,000 papers and patents each from our analytic
sample. Then we calculated the measures of disruption presented in Bornmann et al. [2020]3 and Leydesdorff
et al. [2020]4 . Results are presented in fig. S1 (papers fig. S1A and patents in fig. S1B). The blue lines indicate
disruption based on Bornmann et al. [2020] and the orange lines indicate disruption based on Leydesdorff et al.
[2020]. Across science and technology, the two alternative measures both show declines in disruption over time,
similar to the patterns observed with the CD index. Taken together, these results suggest that the decline in
disruption we document in science and technology is not an artifact of our particular operationalization.
Figure S1: Alternative measures of disruption This figure shows the decline in the disruption of papers (A) and patents
(B) based on two alternative measures of disruption. The blue lines calculate disruption using a measure proposed in Bornmann
et al. [2020]; the orange lines calculate disruption using a measure proposed in Leydesdorff et al. [2020].
3 We calculate DIlno k where l = 1 [Bornmann et al., 2020, p. 1245].
4 We calculate DI ∗ on [Leydesdorff et al., 2020, p. 4]
14S2 Analysis of paper and patent titles and abstracts
As noted in the main text, we complemented our bibliometric analyses of disruptiveness using text analysis on
paper and patent titles and abstracts, which yield independent evidence of declining disruptiveness over time.
In this supplement, we describe the methodological details of the two types of text analyses we undertake.
Lexical diversity The first type of textual analyses examines changes in the diversity of words used
in papers and patents. Our rationale for these analyses is that increases in disruption should be associated
with increases in the diversity of words used in science and technology. Disruptive discoveries and inventions
create departures from the status quo, rendering their predecessors less useful. While this pattern alone may
have the effect of reducing the diversity of words used, disruptive discoveries and inventions are also likely to
introduce new words; part of the way that disruptive discoveries and inventions render their predecessors less
useful is likely by introducing new words that are more useful than those that came before. Taken together
with the long memory of science and technology (i.e., even obsolete words are still occasionally used), we
therefore anticipate a positive association between disruption and the diversity of words used in science and
technology. Thus, to the extent that our observations on decreasing disruption hold, we should see a decline
in the diversity of words used over time.
To evaluate changes in the diversity of words over time, we pulled all titles and abstracts for papers and
patents in our sample from Web of Science and Patents View. For titles, there was very little missing data in
either Web of Science or Patents View, with titles absent in fewer than 0.01% of cases in both the former
and the latter. For abstracts, Patents View also provides highly complete coverage, with only 0.32% of cases
missing. Web of Science has less robust coverage of abstracts before the early 1990s; from 1945-1991, only
4.45% of papers in our sample include abstracts. Coverage is much better in later years; from 1992-2010,
abstracts are included for 90.85% of papers. We therefore limit our analyses of abstract data from Web of
Science to the 1992-2010 period.
After extracting paper and patent titles and abstracts, we completed a series of processing steps. To
begin, we tokenized each title and abstract using the spaCy natural language processing Python package.
From the resulting lists of tokens, we then excluded those that were tagged by spaCy as stop words, tokens
consisting only of digits or punctuation, and tokens that were shorter than three characters or longer than
250 characters in length. Next, we converted all remaining tokens to their lemmatized form and converted all
letters to lowercase. Finally, we aggregated the resulting lists of tokens to the subfield × year level, separately
for papers and patents and for titles and abstracts.
We evaluate changes in the diversity of words used over time by computing, for each subfield × year
observation, the type-token ratio [Lu et al., 2019], a common measure of lexical diversity. The type-token
ratio is defined as the ratio of unique words to total words. We compute this measure separately for papers
and patents and for titles and abstracts, at the level of the Web of Science research area (for papers) and
NBER technology category (for patents). More specifically, for each field (i.e., research area or technology
category) and each year, we divide the number of unique words appearing in titles by the total number of
words appearing in titles. This measure attains its theoretical maximum when every word is used exactly
once. Thus, higher values indicate greater diversity.5
Linguistic change The second type of textual analyses examines changes in the specific words used in
papers and patents over time. Our rationale for these analyses is that the changes we observe in the CD index
are likely to coincide with changes in approaches to discovery and invention, particularly the orientation of
scientists and technologists towards prior knowledge. For example, to the extent that disruption is decreasing
over time, it seems plausible that we will also observe decreases in words indicating the creation, discovery, or
perception of new things. Similarly, it is also plausible that we will observe concomitant increases in the
use of words that are more indicative of improvement, application, or assessment of existing things, which,
consistent with the notion of consolidation, may reinforce existing streams of knowledge.
To evaluate changes in the utilization of specific words over time, we followed an approach similar to
that described above in our analyses of lexical diversity, using similar samples of papers and patents and
5 In unreported analyses (available upon request) we find similar results when measuring lexical diversity using normalized
entropy.
15Figure S2: Lexical diversity of papaer and patent abstracts over time. This figure shows changes in lexical diversity
(as measured by the type-token ratio) over time for the abstracts of papers (A) and patents (B). For papers, lines correspond to
Web of Science research areas; for patents, lines correspond to NBER technology categories. For paper abstracts, lines begin in
1992 because Web of Science does not reliably record abstracts for papers published prior to the early 1990s.
(A) Papers (B) Patents
0.09 0.09
Life Sciences and biomedicine Chemical
Physical sciences Computers and communications
0.08 0.08
Social sciences Drugs and medical
Technology Electrical and electronic
0.07 0.07 Mechanical
0.06 0.06
Lexical diversity
Lexical diversity
0.05 0.05
0.04 0.04
0.03 0.03
0.02 0.02
0.01 0.01
0.00 0.00
1950 1960 1970 1980 1990 2000 2010 1980 1985 1990 1995 2000 2005 2010
Year Year
preprocessing steps. To simplify the presentation, we limit our attention to words appearing in paper
and patent titles, for which, as noted previously, we have more complete data. However, the patterns we
report below are also observable in analyses using paper and patent abstracts. Prior work has studied
word frequencies in paper and patent titles extensively, and they are generally thought to provide a good
window into the nature of science and technology [e.g., Milojević, 2015]. For the present analyses, during
preprocessing, we also assigned a part of speech tag to each lemma, after which we extracted all nouns, verbs,
adjectives, and adverbs, which we anticipated would provide the most meaningful insights into changes in the
nature of science and technology. At this stage, our data consisted of counts of lemmas by part of speech
appearing in the titles of sample papers and patents. To facilitate analysis, we subsequently reshaped the
data in a long-panel format, separately for papers and patents, where each row was uniquely identified by a
document id × part of speech × token.
With these data in hand, we then conducted two complementary assessments of changes in the specific
words used in papers and patents over time. First, we examined changes in the top 30 most frequently used
words in paper and patent titles by decade. For patents, we present these word frequencies for the years 1980,
1990, 2000, and 2010; for papers, our time series is longer, and therefore we present frequencies for every
other decade (i.e., 1950, 1970, 1990, 2010).
Second, to complement this assessment, we also examined the top 30 words that underwent the greatest
change (either positive or negative) in utilization over the period of our study, again separately by part
of speech (verbs, nouns, adverbs, and adjectives) and for papers and patents. To identify these words, we
created, for each token × part of speech observation, a panel tracking annual utilization by papers or patents
(i.e., the proportion of papers or patents in which the focal token × part of speech appeared for each year).
Subsequently, we computed the Spearman rank correlation between this measure of utilization and the year of
publication (for papers, grant year for patents). Next, we dropped all token × part of speech observations for
which the p-value for the Spearman rank correlation was >0.05. In addition, to help eliminate idiosyncratic
terms, we also excluded token × part of speech observations that appeared, over the entire study window, in
fewer than 1,000 papers or patents (the results are robust to alternative thresholds). Finally, because we
are primarily interested in changing approaches to science and technology (rather than changing objects of
discovery and invention), topical terms are excluded from the table. Topical terms were defined as those
16relating to specific chemicals (e.g., “ammonium”, “phosphorus”, “hydrocarbon”) and drugs (e.g., “penicillin”,
“vitamin”, “barbiturate”), medical conditions (e.g., “jaundice”, “encephalitis”, “paralysis”) and procedures (e.g.,
“ultrasound”, “psychotherapy”, “autopsy”), and organisms (e.g., “fowl”, “chick”, “tobacco”) and organism parts
(e.g., “diaphragm”, “gland”, “ureter”).6
To simplify the presentation and conserve space, we focus our reporting on the results for verbs, which
also generally yielded more substantively interesting patterns (the most frequent nouns were often topical in
nature; the most frequent adverbs and adjectives tended to be general stop words). However, the substantive
conclusions we observe for verbs are also visible with the other parts of speech, several examples of which we
highlight below. Furthermore, to understand whether certain verbs are more likely to be used in the titles of
disruptive or consolidating work, we conducted a survey among researchers familiar with the literature in the
Science of Science (see S3).
Results from our assessments of changes in the most common words by decade are shown in fig. 3B
and D separately for both papers and patents. Words colored in blue indicate those considered to be
disruptive according to our survey results. Disruptive words are verbs more closely related to processes such
as the creation, discovery, and perception of new things. Words colored in red indicate those considered
to be consolidating according to our survey results. Consolidating words are verbs more closely related to
processes such as the assessment, improvement, and application of existing things. Beginning with paper
titles, consistent with our expectations, we observe a decrease in the relative number of disruptive words (blue)
and an increase in the relative number of consolidating words (red). The number of disruptive words stayed
constant across two of the three decade changes (1950 to 1970 and 1970 to 1990). However, it decreased from
three to one once (1990 to 2010). On the contrary, the number of consolidating words decreased once (1950
to 1970), but increased twice thereafter (1970 to 1990 and 1990 to 2010), where the latter increase was a
dramatic one from five to nine consolidating verbs. Furthermore, consolidating words seem to be used in
higher frequencies over time. For example, the consolidating word “base” appears in three of the decades and
increases in usage each time (1970 to 1990 and 1990 to 2010). In addition, even though the consolidating
word “associate” only appears in the final decade, it is used in titles in the final decade more frequently than
any other word of the past decades (i.e., 1.15 is higher than the highest frequency of any word in the past
decades).
We see a similar trend of decreasing usage of disruptive words and increasing usage of consolidating words
in patent titles as well. The relative number of disruptive to consolidating words appearing on the list seems
consistent. However, the frequency of disruptive words is decreasing while the frequency of consolidating
words is generally increasing. For example, the disruptive word “make,” which appears in all four decades
represented in our data, decreases in use in each subsequent decade. Similarly, “produce” appears across all
four decades and registers a decrease across two of three changes (1990 to 2000 and 2000 to 2010). Conversely,
consolidating words “use” and “control” both appear in all four decades, and increase in use in each subsequent
decade. Similarly, the consolidating word “have” appears in all four decades and shows an increase across two
of the three changes (1980 to 1990 and 1990 to 2000). Therefore, we observe a decrease in the frequency
of processes related to disruptive work and a simultaneous increase in the frequency of processes related to
consolidating work. These results are consistent with our argument that there is a decrease in the tendency
of science and technology to be disruptive.
Next, we turn to the results of our analysis of words undergoing the greatest changes in utilization over
time, presented in table S1. Overall, our findings using this approach are align with those just reported.
The results here indicate an overall decrease in the frequency of processes related to disruptive work—or
a decrease in the frequency of verbs associated with the creation, discovery, and perception of new things.
Moreover, there is a general increase in the frequency of processes related to consolidating work—or an
increase in the frequency of verbs associated with the assessment, improvement, and application of existing
things. In particular, in the list of words that are increasing in utilization, the number of disruptive words is
less than the number of consolidating words for both papers (11 disruptive words to 13 consolidating words)
and patents (7 disruptive words to 13 consolidating words). For example, verbs related to the processes
of consolidation, such as “use,” “base,” and “update,” are increasingly utilized in both papers and patents.
6 In unreported analyses (available upon request) we consider several alternative, more sophisticated approaches for estimating
trends in word utilization over time. These analyses were primarily designed to account for potential confounding factors by
adjusting, for example, for field and year effects. Results using these alternative approaches were substantively similar to those
using the simpler approach reported here.
17Similarly, among words that are decreasing in utilization, the appearance of disruptive words is higher than
consolidating ones for both papers (13 disruptive words to 9 consolidating words) and patents (10 disruptive
words to 5 consolidating words). For example, verbs related to the processes of disruptive work such as
“substitute,” “attack,” and “separate” seem to be decreasing in utilization across papers and patents. These
results indicate that relative to the usage of consolidating words, the usage of disruptive words is increasing
less and decreasing more. Overall, based on the patterns in the frequencies of particular verbs appearing in
titles, we conclude that the processes related to disruptive work seem to be decreasing while the processes
related to consolidating work seem to be increasing. Therefore, as we documented using other measures, the
rate of disruptive work across fields of science and technology is likely decreasing.
Results presented in both tables are especially noteworthy when recalling that they are based on raw
data, with no adjustment or transformation other than basic text preprocessing. Overall, then, these results
offer compelling support for the findings we observe on the changing nature of science and technology using
the CD index.7
7 Although not the primary aim of this analysis, we also note that the results we observe in fig. 3B and 3D are consistent
with our previous finding on the decreasing lexical diversity of science and technology. The rate of utilization of the top 30
most common terms has increased dramatically, which suggests the increasing dominance of a smaller number of words. As an
illustration, note that in paper titles, while the verb “use” has risen two positions in the ranks between 1950 and 2010, its rate of
utilization per 100 papers has increased by more than 1250%. This general pattern of increasing dominance is visible across
both papers and patents and both verbs and nouns.
18Table S1: Verbs in paper/patent titles with greatest increasing/decreasing utilization
Increasing utilization Decreasing utilization
Papers Patents Papers Patents
Lemma r Lemma r Lemma r Lemma r
use 0.9974 base 0.9983 prove -0.2485 draw -0.7409
trigger 0.9915 use 0.9983 label -0.2510 recover -0.7429
assess 0.9911 provide 0.9944 illustrate -0.2615 foam -0.7439
generate 0.9890 identify 0.9905 germinate -0.2681 copy -0.7473
predict 0.9880 optimize 0.9894 educate -0.2703 dry -0.7499
link 0.9866 manufacture 0.9871 drop -0.2873 substitute -0.7504
define 0.9856 determine 0.9843 attack -0.2984 finish -0.7510
mediate 0.9854 store 0.9843 administer -0.3026 lift -0.7513
interact 0.9853 associate 0.9829 resemble -0.3384 exercise -0.7529
support 0.9847 distribute 0.9826 judge -0.3412 seal -0.7625
base 0.9847 create 0.9824 look -0.3417 separate -0.7641
detect 0.9830 perform 0.9821 dissect -0.3448 propel -0.7644
dominate 0.9828 comprise 0.9815 purify -0.3700 prepare -0.7703
optimize 0.9818 implement 0.9804 compose -0.3859 spin -0.7709
induce 0.9810 enable 0.9793 let -0.4289 crack -0.7748
drive 0.9808 predict 0.9787 bombard -0.4460 stabilize -0.7790
identify 0.9807 access 0.9784 disseminate -0.4590 lubricate -0.7832
model 0.9794 automate 0.9779 surface -0.4605 cut -0.8064
revisit 0.9787 allocate 0.9776 occur -0.4859 melt -0.8118
assist 0.9782 manage 0.9770 precipitate -0.5308 saw -0.8143
match 0.9779 form 0.9768 sing -0.6272 actuate -0.8286
incorporate 0.9765 record 0.9765 attempt -0.6634 travel -0.8314
target 0.9750 update 0.9756 produce -0.6754 lay -0.8317
construct 0.9735 configure 0.9747 destroy -0.6987 cast -0.8378
suppress 0.9732 integrate 0.9737 pour -0.7407 grind -0.8401
distribute 0.9729 rout 0.9734 call -0.7598 wind -0.8513
probe 0.9729 generate 0.9723 note -0.7769 strip -0.8535
enhance 0.9723 estimate 0.9711 encounter -0.8173 indicate -0.8602
update 0.9721 relate 0.9706 excise -0.8749 burn -0.8742
improve 0.9719 evaluate 0.9703 concern -0.9615 mean -0.9672
Notes: Because we are primarily interested in changing approaches to science and technology (rather than changing objects
of study), topical lemmas are excluded from the table. Topical lemmas were defined as those relating to specific chemicals
(e.g., “ammonium”, “phosphorus”, “hydrocarbon”) and drugs (e.g., “penicillin”, “vitamin”, “barbiturate”), medical conditions
(e.g., “jaundice”, “encephalitis”, “paralysis”) and procedures (e.g., “ultrasound”, “psychotherapy”, “autopsy”), and organisms
(e.g., “fowl”, “chick”, “tobacco”) and organism parts (e.g., “diaphragm”, “gland”, “ureter”).
19S3 Classification of disruptive and consolidating words
In order to classify verbs as disruptive or consolidating we took the following steps. First, two authors of
the paper independently went through the list of all verbs that were used in papers’ and patents’ titles and
abstracts. For each verb, each researcher manually tried to think about whether the token was more likely to
appear in a disruptive or consolidating work’s title. Throughout this process, both researchers found that
it was easier to categorize each word when they thought about how the verb would qualify the disruptive
or consolidation process. In particular, we identified that there were verbs that were describing the process
of creation, discovery, or perception of new things—which were likely to appear in disruptive titles. Then
there were verbs that were describing the process of assessment, improvement, and application of existing
things—which were likely to appear in consolidating titles. This resulted in six categories of verbs, each
of which was associated with disruptive or consolidating work. The disruptive categories were “creation,”
“discovery,” and “perception of new things.” The consolidating categories were “assessment,” “improvement,”
and “application of existing things.”
Second, using All Our Ideas [Salganik and Levy, 2015], we generated a survey to determine which of the
verbs appearing in fig. 3B, fig. 3D, and table S1 were likely to be in the title of a disruptive or consolidating
work. All Our Ideas is an open platform that allows researchers to submit a single question and a list of
potential answers (or “ideas”). The platform them automatically creates a survey associated to a designated
hyperlink. We created six surveys for each of the six categories. For example, for creation, the question was
“Which verb is more indicative of efforts to create knowledge/technology?” For each of the questions, we
submitted the list of all verbs that appear on fig. 3B, fig. 3D, and table S1. A person who accesses one of
the surveys will be prompted with the question and two random choices from the list of verbs we submitted.
The person can choose one of the verbs they believe better answers the question or choose neither of the
two options if they cannot make a decision. Then the person will be prompted with the same question and
another random pair of verbs to choose from. The platform will repeat this process infinitely and concurrently
generate a score for each verb indicating the probability that the verb chosen over any other verb. We
distributed the survey to three researchers who are familiar with research streams in scientific discoveries and
technological inventions.
Finally, for each of the six categories, we took the top 25 words that had the highest score from our All
Our Ideas surveys. The top 25 words from each of creation, discovery, and perception were all deemed more
likely to appear in disruptive titles. The top 25 words from each of assessment, improvement, and application
were all deemed more likely to appear in consolidating titles. There were some words that appeared in both
disruptive and consolidating categories. If this were the case, we compared the relative frequency on each
side of disruptive or consolidating categories. For example, if a word appeared in creation, discovery, and
assessment (two disruptive categories and one consolidating category), we considered the word to be more
closely associated with the side it appeared more frequently in. If a word appeared on both sides equal
number of times, we associated it with the side that it had a higher rank in. This process allowed us to
designate most words on the list as characterizing either consolidating or disruptive works.
20S4 Analysis of highly disruptive papers and patents over time
Observations of slowing progress in science and technology are increasingly robust, supported not just by the
evidence we report above, but also by prior research from diverse methodological and disciplinary perspectives.
Yet as noted previously, there is an awkward tension between these observations of slowing progress from
aggregate data, on the one hand, and continuing observations of seemingly major breakthroughs in many fields
of science and technology—spanning everything from the measurement of gravity waves to the sequencing of
the human genome—on the other. In an effort to reconcile this tension, we considered the possibility that
while overall, discovery and invention may be less disruptive of prior knowledge over time, the high-level
view taken thus far (and also in prior work) may mask considerable heterogeneity. Put differently, aggregate
evidence of slowing progress does not preclude the possibility that some (smaller) subset of discoveries and
inventions are highly disruptive.
To evaluate this possibility, fig. S3 plots the number of disruptive papers in (fig. S3A) and patents (fig. S3B)
over time, where disruptive papers and patents are defined as those with CD5 values > 0. Within each panel,
we plot four lines, corresponding to four evenly spaced intervals—(0,0, 0.25], (0.25, 0.5], (0.5, 0.75], (0.75,
1.00]—over the positive values of the CD5 index. The first two intervals therefore correspond to papers and
patents that are relatively weakly disruptive, while the latter two correspond to those that are more strongly
so (e.g., where we may expect to see major breakthroughs like some of those mentioned above). Strikingly,
despite huge increases in the numbers of papers and patents published each year, we see little change in the
number of highly disruptive papers and patents, as evidenced by the relatively flat red, green, and orange
lines. This pattern helps to account for simultaneous observations of both aggregate evidence of slowing
progress and seemingly major breakthroughs in many fields of science and technology.
Figure S3: Persistence of major breakthroughs. This figure shows the number of disruptive papers (A) and patents
(B) across four different ranges of the CD5 . For papers, lines correspond to Web of Science research areas; for patents, lines
correspond to NBER technology categories.
(A) Papers (B) Patents
175000
60000
150000
50000
125000 CD5 value
40000 (0.0, 0.25]
Count
Count
100000
(0.25, 0.5]
30000
75000 (0.5, 0.75]
20000 (0.75, 1.0]
50000
25000 10000
0 0
1960 1980 2000 1980 1985 1990 1995 2000 2005 2010
Year Year
21S5 Is the decline driven by changes in publication quality?
Figure S4: CD index of high quality science over time. This figure shows changes in CD5 over time for papers published
in Nature, PNAS, and Science (A) and Nobel-Prize-winning papers (B). Colors indicate the three different journals in A; colors
indicate the three different fields that receive the Nobel Prize in the B.
22You can also read