Influence of force volume indentation parameters and processing method in wood cell walls nanomechanical studies - Nature
←
→
Page content transcription
If your browser does not render page correctly, please read the page content below
www.nature.com/scientificreports
OPEN Influence of force volume
indentation parameters
and processing method in wood
cell walls nanomechanical studies
Aubin C. Normand1, Anne M. Charrier1, Olivier Arnould2 & Aude L. Lereu3*
Since the established correlations between mechanical properties of a piece of wood at the
macroscopic scale and those of the cell wall at the submicron scale, techniques based on atomic
force microscopy (AFM) have become widespread. In particular Peak Force tapping, allowing the
differentiation of various layers, has become the new standard for wood cell wall’s nanomechanical
characterization. However, its use requires fully elastic indentation, a good knowledge of stiffness
of the probe and assumes a perfect tip shape of known radius (sphere) or angle (cone). Those
strong hypotheses can result in large approximations in the extracted parameters for complex,
nanostructured, and stiff and viscous materials such as wood. In this work, we propose a reliable and
complementary alternative based on AFM force-volume indentation by refining the Oliver and Pharr
nanoindentation processing and calibration procedure for AFM cantilever and tip. The introduced area-
function calibration (AFC) method allows to considerably reduce these approximations and provides
semi-quantitative measurements. No prior knowledge of the tip shape and cantilever stiffness are
required and viscoplasticity is investigated through a qualitative index. Indentation parameters
variations are shown to impact the resulting measurements, i.e., indentation modulus, viscoplasticity
index, adhesion force and energy. AFC method, applied to map regions of tension wood, provides very
stable mechanical parameters characteristic of each region, which makes this method of high interest
for plant cell wall studies.
Wood mechanics has become an important field of investigation in correlation with the raising circular green
economy and industry. Natural fibers are, for example, increasingly considered as an alternative to glass fibers in
composite materials with polymer r esins1. However, what prevents a generalization of the use of these materials
is, among others, the wide variability of their mechanical properties. Variability at the scale of the work-piece is
heavily influenced by the variability at the fiber scale2. Indeed, wood is a multi-scale material whose mechanical
support function is ensured by the fiber’s walls. Wood cell walls can be seen as a multi-layered composite mate-
rial in which partly crystalline cellulose microfibrils act as a unidirectional reinforcement. These microfibrils
are oriented at a specific angle to the direction of the fiber (the microfibril angle, MFA) whereas the matrix
mostly consists in amorphous lignin and h emicellulose3–6. In the so-called “normal” wood, the secondary layer
(S2) (Fig. 1c), the thickest one, predominantly conditions the mechanical behavior of wood in the longitudinal
direction. In tension wood, which is generated by angiosperms to reorient their axes through the generation of
internal tensile stress during the maturation of new cells, sometimes a specific layer called “gelatinous” (G layer)
(Fig. 1b) replaces or is added to the S27–10. This layer is composed of a higher amount of crystalline cellulose
almost aligned with the direction of the fiber (MFA close to 0°) and of mostly hemicellulose for the matrix7,8,10,11.
In addition to the industrial interest, knowledge of the mechanical properties of wood at parietal layers’ scale
presents a fundamental biological interest for understanding the state of stress within the living tree, and, in
particular, for providing information on how the G layer leads to the generation of maturation s tress8,9,12. Dif-
ferent hypotheses exist to explain this phenomenon, but the lack of micro/nano-mechanical data does not allow
to clearly understand how stresses and strains develop within each layer during maturation (especially the G
layer) and how they are transferred from one layer to the other to explain the stress observed at the macro-scale.
1
Aix Marseille Univ, CNRS, CINaM, Marseille, France. 2LMGC, Université de Montpellier, CNRS, Montpellier,
France. 3Aix Marseille Univ, CNRS, Centrale Marseille, Institut Fresnel, Marseille, France. *email:
aude.lereu@fresnel.fr
Scientific Reports | (2021) 11:5739 | https://doi.org/10.1038/s41598-021-84994-0 1
Vol.:(0123456789)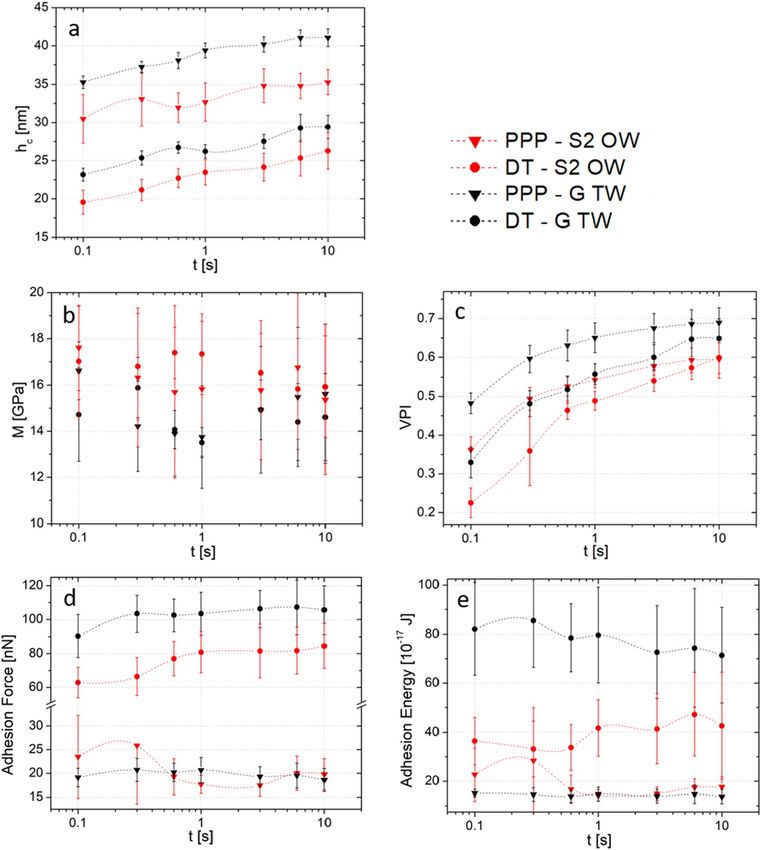
www.nature.com/scientificreports/
Figure 1. (a) Scheme of the tension generation in young poplar trees. (b, c) AFM topographic images of
embedded and ultra-microtomed transverse cuts of tension wood fiber (b) and opposite wood fiber (c).
Nanoindentation has been widely used to perform mechanical characterization in wood science since 1 99713
at the cell wall scale. However, indentation leads to a complex mechanical stress state, consisting of compression
in the direction of indentation and both compression and shear in the transverse direction. Furthermore, because
the wood cell wall is not an isotropic material, indentation does not allow a direct determination of elastic con-
stants of the tested material, but only provides an indentation modulus (M) resulting from the combination of
these elastic constants, as it has been shown theoretically14–16. These theoretical works have already been applied
to wood, allowing to estimate the elastic constants from successive indentation tests, and to deepen the under-
standing of the mechanical behavior of wood at the level of the cell wall17. Since traditional indenters do not allow
resolving the thinnest parietal layers (like the compound middle lamella CML of the order of 100 nm), the use
of atomic force microscope (AFM) has become widespread for carrying out nanomechanical tests on plant cell
walls using nanometric size tips as indenters. Mechanical properties mapping is an increasingly common feature
in AFMs. Peak force quantitative nanoscale mechanical characterization (PF-QNM) or quantitative imaging
(QI) present the advantage of reducing the volume of indented material, achieving excellent spatial resolution
(indentation depth < 5 nm) and acquiring maps of mechanical properties at high s peed18–22. These technics are
based on an intermittent high frequency contact mode (>> 100 Hz) coupled to the choice of a model describing
the mechanics of the contact between the tip and the indented material. The elastic indentation modulus is then
extracted by adjusting its value to fit at best the force–displacement curves acquired with the chosen model.
Various models, such as Hertz, JKR, and DMT, exist for simple tip geometries (i.e., conical, spherical), interact-
ing with an indented volume considered as a flat half space. These models are only valid for contacts remaining
omain23,24, therefore, making impossible the study of viscoplastic behavior. Indentation depths
in the elastic d
associated with the PF-QNM mode are generally very small, very often less than the radius of the tip. However,
because of surface roughness (due to the samples surface preparation) and of the small radius of curvature of
the tips (necessary to reduce the contact area and to increase the resolution), the hypothesis of an elastic contact
is not always verified. Thus, measurements can be biased if the contact regime is not perfectly elastic or if the
shape of the tip is poorly determined. In addition, the extraction of the indentation modulus by this method is
highly dependent on a precise determination of the cantilever stiffness, which is particularly difficult when it
exceeds 20 N/m25, yet necessary to have a cantilever stiffness in the same order of magnitude as the indentation
stiffness of wood cell walls. In order to limit these difficulties, it is recommended to determine beforehand the
contact radius of the tip used on a reference sample with a known indentation modulus18,21 or with a calibration
grid sample26–28 for a given indentation depth.
In the present work, we propose an alternative procedure, complementary to PF-QNM, based on AFM
Force-Volume (FV) indentation mode with a data processing method adapted from the one traditionally used
for nanoindentation13,29–31 coupled with a method of calibration of the tip that we named area-function calibra-
tion method (AFC) using a reference sample. Mechanical measurements made using FV mode and evaluated
with Oliver and Pharr method have already been performed on several materials such as pulp fi bers32 or metal
nanosheets33 for example. They are highly affected by various parameters such as surface roughness (induced,
among others, by the sample surface preparation process), cantilever calibration or the model used to describe
the geometry of the tip. Our aim here is to refine this procedure by establishing a calibration and processing
method to limit the source of potential errors and by studying the influence of indentation parameters on the
calculated mechanical properties. Acquisition of indentation curves in FV mode is slower than in PF-QNM but
offers the possibility of measuring the indentation modulus without requiring the hypothesis of perfectly elastic
Scientific Reports | (2021) 11:5739 | https://doi.org/10.1038/s41598-021-84994-0 2
Vol:.(1234567890)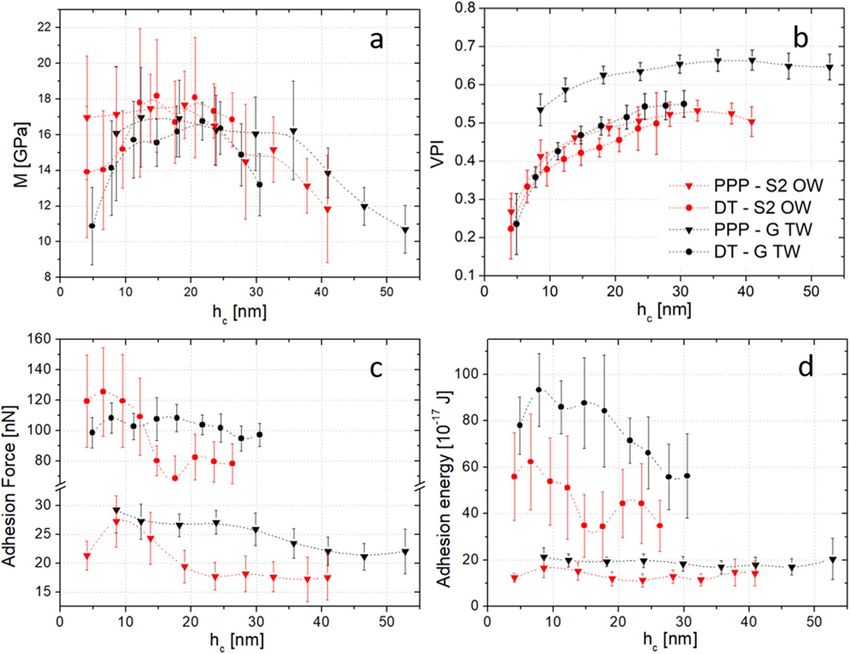
www.nature.com/scientificreports/
Figure 2. Overview of the indentation curve processing and area function calibration procedure. Inset: scheme
of tip-surface interaction during indentation at maximum load. (a) Typical indentation measurement with
loading (blue) and unloading curves (red). The hatched areas A0, A1 and A2, are used for characterization of
adhesion and viscoplasticity respectively. (b) Contact area function for both DT and PPP probes as a function
of indentation depth h c using AFC method (data points-black symbols- and fits-black lines) and adjusted
spherical-conical models (blue lines, Supplementary Section S1). Insets: Electronic microscopy of DT (scale
bar = 400 nm) and PPP tips (scale bar = 100 nm).
indentation. In addition, the AFC method makes it possible to determine the indentation modulus indepen-
dently from the knowledge of the cantilever stiffness and also avoid the need to know the real shape of the tip
beforehand, it therefore allows the use of atypical ones. It consists in building a tip/surface area function, i.e.,
the tip/sample contact area versus the indentation depth function, using a reference sample of known indenta-
tion modulus with a low surface roughness. Moreover, as the average indentation depth can be greater and the
indentation times longer in FV indentation than in PF-QNM, the viscoplastic behavior of the material can be
investigated. This is another attractive point of the presented method. We use a qualitative index characterizing
the viscous and plastic behaviors of the indented material23, two properties of plant cell walls that are yet largely
unknown at this scale. Furthermore, the adhesion is measured both as the force and the energy required to
detach the tip from the indented surface. We focus on the comparison of these two computing methods and on
the interpretation of such measurements applied to wood cell walls.
In order to validate our method, our protocol is applied on two types of parietal layers found in poplar: S2
layers from opposite wood (OW) cell walls and G layers from tension wood (TW) (Fig. 1). Two types of AFM
probes are used to conclude on the influence of the tip. Finally, the influence of indentation time and depth on
the determination of indentation modulus, viscoplasticity index and adhesion are investigated in order to choose
the optimal parameters to establish correlative mappings of these properties.
Results
Brief overview of the method and extracted parameters. Both AFC tip calibration and data pro-
cessing methods are described in detail in the “Materials and methods” section. However, for a better reading of
the manuscript a brief description is given in the following. Indentation curves are acquired using FV mode and
processed with a dedicated Matlab program (see Fig. S1 and S2). A representation of such an indentation curve
(loading and unloading curves in blue and red respectively) is shown in Fig. 2a with a scheme of the tip-surface
interaction during indentation at maximum load (inset). The first step of the AFC method consists in establish-
ing the area function, which describes the evolution of the tip/surface contact area with the indentation depth.
Two examples, obtained using a reference sample of known elastic modulus, are given in Fig. 2b for two differ-
ent tips (5 nm radius PPP probe and 110 nm radius, diamond coated, DT probe). We show that, using this area
function, one can calculate directly the indentation modulus (M) after extraction of the slope S at the maximum
of the unloading curve (Fig. 2a) without prior knowledge of the cantilever stiffness nor approximation on the tip
shape. The proposed method including the extraction of S (discussed later), is an improvement of the popular
Oliver and P harr30 method for processing FV curves.
In addition to M, two other parameters are extracted and will be found useful to discuss the properties of
wood samples later in the manuscript. The viscoplasticity index (VPI) is a qualitative index which represents the
weight of the viscous and plastic components in the material response to indentation. This parameter, which is
rarely exploited in AFM nanoindentation experiments, has been very useful to describe the viscoplastic properties
at the nanoscale independently of the elastic properties. Our method is complementary to the method developed
by Ganser et al.34 to acquire quantitative viscoelastic information using AFM nanoindentations. The later requires
however very strong hypothesis (1. simple linear unidimensional stress–strain relationship, stress = strain * Young
modulus, that is usually limited to uniaxial tests for isotropic material, 2. JKR-spherical contact, which implies
to work in the elastic domain) and long measurements (600 s/measurement) that are not suitable for mapping.
On the contrary, our approach consists in reducing the amount of hypothesis at the cost of having qualitative
Scientific Reports | (2021) 11:5739 | https://doi.org/10.1038/s41598-021-84994-0 3
Vol.:(0123456789)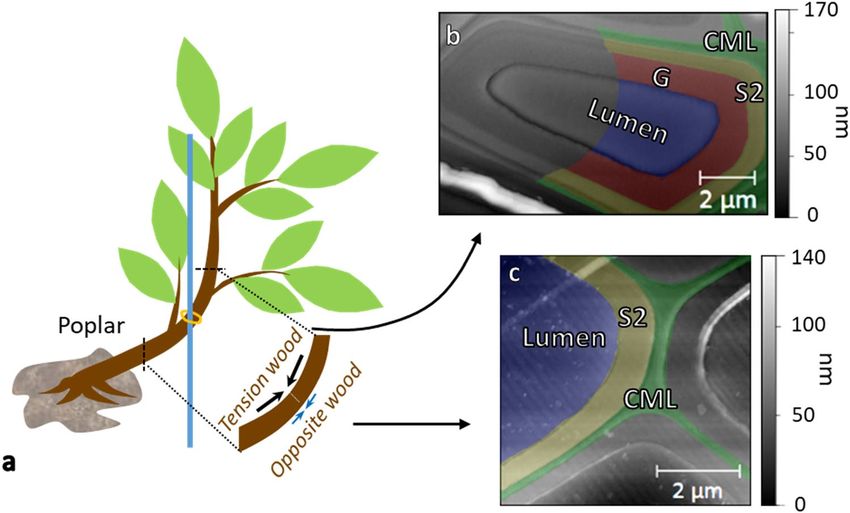
www.nature.com/scientificreports/
Figure 3. Indentation modulus as a function of indendation depth for: (a) PPP probe, (b) DT probe on tension
wood G layer. Indentation modulus is computed using the area function calibration (AFC) (black) or using
spherical-conical geometric model (blue). The dash-dotted lines are guide for the eye. Error bars are standard
deviation, n = 27.
results rather than quantitative. The last parameter, adhesion, i.e., the force ( Fadh) or the energy ( Eadh) needed
to separate the tip from the surface, reflects the interaction between the tip and the surface and can be used to
deduce chemical information from the investigated sample. Although very common, this parameter has not been
extensively investigated in the case of wood samples; we will show here how this parameter can be correlated to
the chemical composition of each layers of the cell wall.
Comparison of indentation modulus extracted with a geometric model or following the AFC
method. To validate our data processing method, we carried out sets of indentation measurements in the
G layer of the tension wood cell walls, using the two different probes, while varying the indentation depth. The
number of indentations per set of measurement is limited by the width of the investigated layers (less than 1 µm).
To avoid overlapping solicitated volumes, the number of indentations was limited to 3 × 3 grids replicated 3 times
for a total of 27 indentations.
For both probe types (PPP and DT probes), indentations were performed and processed using our area-func-
tion calibration method described previously (example of raw indentation curves are available in Supplementary
Section S1). We then compare our AFC method to a spherical-conical tip model to describe the probe geometry
(Supplementary Section S1). This model, which is believed to be the most representative of the AFM tips used
in our experiment, is a continuous model that considers a spherical shape at indentation depths smaller that
the tip radius of curvature coupled with a conical shape for higher indentation depth. The indentation moduli
extracted using the two methods are reported in Fig. 3, in black for the area function calibration method and
in blue for the geometric model. Data obtained with the PPP and DT probes are shown in triangles and open
circles respectively. The analysis was performed for values of the indentation depth hc ranging from 5 to 30 nm
for the DT probe and from 8 to 53 nm for the PPP probe. These two ranges of indentation depths are given by the
experiment itself, the lowest values correspond to the limits for the contact detection and the highest ones to the
cantilevers’ deflections linearity limits. For a given material, these ranges are hence cantilever and tip dependent.
The first observation is that the AFC method allows the extraction of the indentation modulus, here ~ 16 GPa,
independently from the type of probe and indentation depth in a specific range. This range goes from 10 to 35 nm
for the PPP probe and from 10 to 25 nm for the DT probe (black curves in Figs. 3a, b). Note that this value is in
good agreement with previously reported data from the literature (15 GPa for poplar G l ayer35, 18–21 GPa for flax
G layer20). Below the 10 nm limit, the modulus seems underestimated. Since the mechanical properties shall not
depend on the depth of indentation in the parietal layer, this observation may be due to surface damaged by the
cutting process or to surface roughness. Indeed for small indentation depths, the roughness has a great influence
on the volume of material loaded resulting in an over-estimation of the contact area. For large indentation depths,
i.e., hc > 35 nm for the PPP tip and > 25 nm for the DT tip, the measured modulus drop could be explained by a
change of indentation regime between the reference resin and wood cell walls, as well as microfibrils buckling
under high loads36–38. Another explanation would be that the solicitated volume can overflow into less rigid
regions, reducing the measured indentation modulus M. This effect was already h ighlighted31,39, with Berkovich
nanoindentation for higher indentation depths (> 300 nm). It is therefore crucial before any FV measurements,
to check for the adequate range for which the indentation modulus is independent from the indentation depth.
In contrast, the results of data processing using a geometric model show an underestimation of M with the
DT tip (open blue circles, Fig. 3b), and a dependency of M with the indentation depth for the PPP probe ranging
from 5 to 18 GPa for an indentation depth in the range 8 to 53 nm (blue triangles, Fig. 3a). This does not reflect
the mechanical properties of the parietal layer, and illustrates the importance of the data analysis method in get-
ting physically relevant data. The AFC method described here not only provides reliable and reproducible data,
whatever the size of the tip apex, but also provides a way to use atypical tips with weird and unknown s hapes40
or high roughness such as encountered with the DT tips (Inset Fig. 2b).
Scientific Reports | (2021) 11:5739 | https://doi.org/10.1038/s41598-021-84994-0 4
Vol:.(1234567890)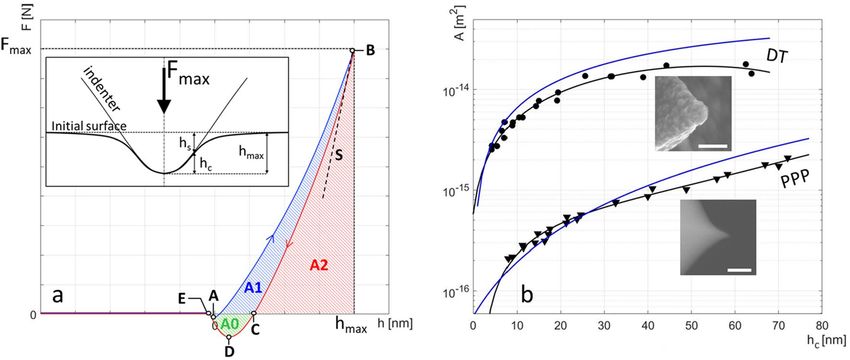
www.nature.com/scientificreports/

                                  Figure 4.  Influence of indentation time on: (a) indentation depth, (b) indentation modulus, (c) viscoplasticity
                                  index, (d) adhesion force, (e) adhesion energy. Measurements are made with DT probe (circles) or PPP probe
                                  (triangles) on S2 layer of opposite wood (OW, red) or G layer of tension wood (TW, black). The dash-dotted
                                  lines are guides for the eye. Error bars are standard deviation, n = 27.

                                  Influence of indentation time and depth on the physical characteristics of wood cell wall. Using
                                  the AFC method, we extracted the different properties of the wood cell wall, i.e., the indentation modulus M,
                                  the viscoplasticity index VPI (see “Materials and methods” section), the adhesion force and adhesion energy in
                                  two regions of the cell walls corresponding to tension and opposite wood. The two kinds of probes previously
                                  introduced, i.e., the DT and PPP probes, are used to emphasize our AFC method regardless of the size and geom-
                                  etry of the tip. In the following we explore how indentation time t and depth hc influence these parameters with
                                  respect to the investigated regions and probes.

                                  Influence of indentation time. In Fig. 4, we report the influence of indentation time corresponding to the time
                                  spent by the tip in contact with the indented surface during the loading and unloading of each test. This is not a
                                  parameter of primary importance for nanomechanical tests carried out by PF-QNM as the acquisition frequency
                                  in this mode is typically greater than 1 kHz. Creep is therefore negligible in such case. However, force-volume

Scientific Reports |   (2021) 11:5739 |                https://doi.org/10.1038/s41598-021-84994-0                                                    5

                                                                                                                                             Vol.:(0123456789)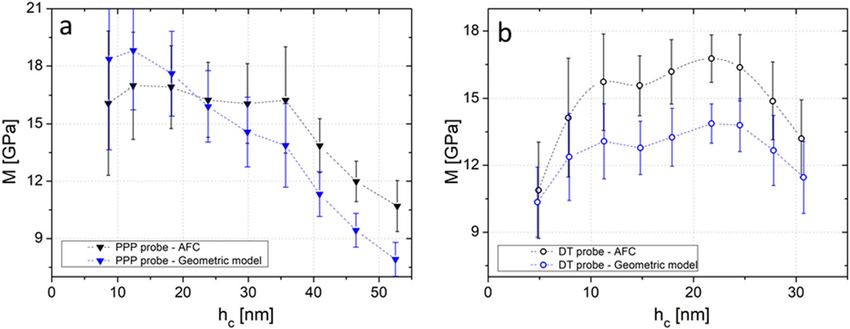
www.nature.com/scientificreports/
mode typically allows indentation time between 0.1 and 10 s and hence gives access qualitatively to time depend-
ent properties of the wood cell wall.
In this study we investigated the effect of the indentation time t on the parameters described above (indenta-
tion modulus M, VPI, force and energy of adhesion) while keeping the cantilever vertical displacement identical
for each measurement. We started by measuring the effect of t on the indentation depth hc (Fig. 4a). In all cases
we noted that the greater the indentation time, the greater the indentation depth. We observed an indentation
depth variation by 15% for the PPP probe and 30% for the DT for an indentation time varying from 0.1 to 10 s,
regardless of the tested cell wall region. This can be explained by the creep/relaxation of the polymer material
under the tip with increasing time; when the indentation time goes up, the viscous component becomes more
important in comparison to the instantaneous elastic component in the mechanical response of the material.
This is confirmed by the viscoplasticity index (VPI), which is shown to increase as well with the indentation time
(Fig. 4c). This demonstrates the relevance of this parameter to characterize the viscous behavior of the material.
We note the VPI index is lower for the DT tip than for the PPP tip when looking at similar cell layers. This could
be explained by the fact that strain and stress are comparatively lower for the larger DT tip than for the smaller
PPP tip. Hence, probe-to-probe comparisons should not be done using the VPI, but it is very useful to compare
qualitatively measurements performed with identical probes.
We also show that the indentation time has no significant effect on the measurement of the indentation modu-
lus whatever the probe used (Fig. 4b). This result confirms that the AFC method, based on indentation modulus
computation from the unloaded curve, makes it possible to overcome the effects of viscosity and plasticity, hence
confirming that the measured modulus is an elastic modulus. It is also important to notice the large standard
deviations (~ 2 GPa) in the indentation modulus. These deviations can be ascribed to two factors, first, to the
error accumulated through the several steps of the process (sensitivity calibration, area function, indentation
depth determination, slope computation), second, to the large volume being tested with FV experiments. Indeed,
the great heterogeneity of the wood microstructure must be reflected in each of the indented volumes, which
ultimately translates into the indentation modulus. In fact, the obtained standard deviations here are similar to
those measured with other AFM modes or by nanoindentation in plant (mainly wood) cell walls13,17–20,22,29,35.
Finally, it appears that adhesion is not significantly influenced by the indentation time (Fig. 4d, e). However,
adhesion measurement depends a lot on the probe used (e.g., shape, dimensions and roughness), and as for the
VPI, comparisons of sets of data can only be made with identical probes. The variation between the two tips can
be attributed to the difference in contact area or in chemical composition (See “Discussion” section).
Influence of indentation depth. Indentation depth is linked to the contact area, mechanical stresses and strains.
It is therefore a fundamental parameter for understanding the mechanical response of the material. Force-vol-
ume mode allows exploring a wide range of indentation depths: from the minimal one, which corresponds to
the limit of detection of the contact, up to cantilevers linearity limit. In this range, the indentation time also
varies from 0.4 s (for a minimum indentation) up to 1.2 s (for a maximum indentation) due to the control of the
cantilever’s displacement. However, comparison with results obtained while varying the indentation time makes
it possible to isolate the influence of time and indentation depth.
As shown previously in the Comparison of indentation modulus extracted with a geometric model or follow-
ing the AFC method section the indentation modulus exhibits a plateau, ranging between 10 and 35 nm for the
PPP probe and between 10 and 25 nm for the DT probe, which corresponds to the adequate indentation depths
to perform a correct measurement for a given tip (Fig. 5a). Below and beyond these limits, indentation modulus
is underestimated, especially for the DT probe.
As expected, the viscoplasticity index increases with the indentation depth. For the PPP tip a plateau seems to
be reached at hc = 30 nm, while for DT the plateau seems to be reached at 25 nm (Fig. 5b). Note that the correct
range of indentation depths cannot be determined universally and depends both on the shape of the probe and
on the sample (surface roughness, microfibrils buckling, surface damage). VPI is lower with the DT tip than for
the PPP, for the same layers and with comparable indentation depths. This reinforces our previous conclusion
that VPI cannot be used to compare results obtained with two different probes. In addition, since VPI is not
equal to zero, whatever the tip used, even for a very shallow indentation depth, we deduce that the indentation
regime is never perfectly elastic. By comparing the results obtained by varying the indentation depth with those
obtained by varying the indentation time, it can be seen that these two parameters both have an influence on this
index. VPI is therefore the result of a convolution of the viscosity and plasticity through the effects of indentation
time and depth. A small depth of indentation coupled with a long indentation time increases the preponderance
of the viscous component in the VPI while a large depth of indentation coupled with a short indentation time
makes it possible to highlight the plastic component. In conclusion, the VPI can be used to establish qualita-
tive comparisons between indented samples for the same tip at the same depth and indentation time. Finally,
indentation depth has no clear impact on the measurements of the adhesion force or energy in regard to the
statistical dispersion (Figs. 5c, d).
Discussion
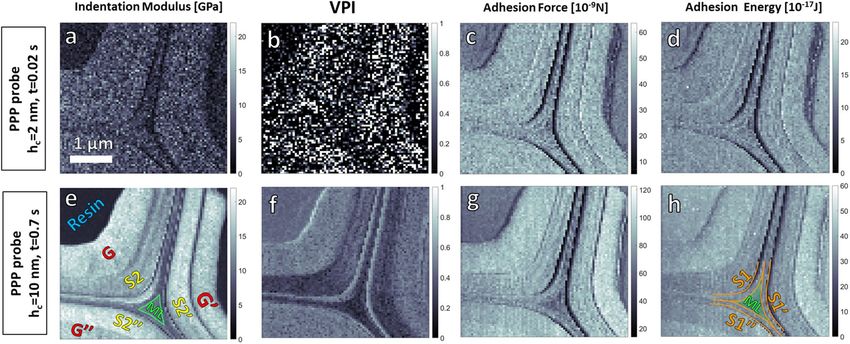
Impact of the indentation parameters in plant cell wall studies. By applying the recommendations
and the method presented above, we explored the impact of the indentation parameters, depth and time rate, on
the resulting wood cell wall analysis using two sets of parameters: The first set, set 1, combines parameters that
are out of the recommended range, i.e., 2 nm indentation depth (far below the 10 nm minimal recommendation)
and an indentation time of 0.02 s. The second set, set 2, follows the recommendations with an indentation depth
and time of 10 nm and 0.7 s respectively. With these two sets, we performed two mappings of the same area at the
intersection of three cells in tension wood using the PPP probe. An acquisition of the topography of the indented
Scientific Reports | (2021) 11:5739 | https://doi.org/10.1038/s41598-021-84994-0 6
Vol:.(1234567890)www.nature.com/scientificreports/
Figure 5. Influence of indentation depth on: (a) indentation modulus, (b) viscoplasticity index, (c) adhesion
force, (d) adhesion energy. Measurements are made with DT probe (circles) or PPP probe (triangles) on S2 layer
of opposite wood (OW, red) or G layer of tension wood (TW, black). The dash-dotted lines are guides for the
eye. Error bars are standard deviation, n = 27.
area was carried out between the two series in order to check that it was not damaged (Supplementary Fig. S3).
Scanned area is 4 × 4 µm2, with a spatial resolution fixed at 50 nm (Supplementary Section S4).
For each map, indentation modulus M (Figs. 6a, e), VPI (Figs. 6b, f), adhesion force (Figs. 6c, g) and adhe-
sion energy (Figs. 6d, h) were extracted using the procedures described earlier. The first striking observation is
that the mappings resulting from the two sets of indentations parameters differ drastically. As expected, in the
case of small indentation depth, below the established recommendations, set 1, not only is the mapping of the
indentation modulus very noisy and the moduli values are underestimated (around 12 ± 3 GPa for G), but it is
also difficult to differentiate between the different layers of the cell wall (Fig. 6a). This contrasts drastically with
the set 2 mapping where each layer (G, S2, S1 and compound middle lamellae CML) are clearly identified with
a range of moduli that will be discussed further. Also using set 1 parameters, it turned out that force-volume
mode reached its limits, probably due to a lack of control of the AFM regulation loop causing the retract curve to
shift above the forward curve. VPI was therefore not determinable using set 1, and the resulting values are unus-
able (Fig. 6b). Although adhesion measurements seem less impacted by the choice of indentation parameters,
(Figs. 6c, d, g, h), set 2 clearly allows resolving the different layers, in particular, S1, ML and even sometimes the
primary wall, S1 can be distinguished. These results hence illustrate the importance of the parameters selected
for the indentations measurements, and how these parameters can impact the results of the analysis.
Several information can be drawn from the mappings with the optimum parameters (Set 2) (indentation
curves in Supplementary Fig. S4):
• Large variations at the transition between the different layers (resin, G, S1, S2, CML) can be explained by
the high roughness in these areas due to cutting effects during sample preparation. These areas do not bring
significant information and are therefore excluded from the analysis (Figs. 6e–h).
• Indentation modulus in the G layer seems constant whatever the portion of the cell observed, and close to 17
GPa (Fig. 6e) in agreements with other reported v alues35. In contrast, the indentation moduli in the S2 and
S1 layers vary significantly depending on the portion of the cell observed (14–18 GPa for S2 and 9 to 14 GPa
for S1) this difference can be explained by a variation of the microfibrils angle (MFA) at the surface generated
by a cutting angle not perfectly perpendicular to the fiber angle as described in35,41. Note that the indentation
moduli in the S2 layer is sometimes higher than those obtained in the G layer (see Fig. 4b) although due to
Scientific Reports | (2021) 11:5739 | https://doi.org/10.1038/s41598-021-84994-0 7
Vol.:(0123456789)www.nature.com/scientificreports/
Figure 6. Maps obtained for two sets of parameters: (a–d) average indentation depth (hc) is 2 nm, indentation
time is 0.02 s, (e–h) average indentation depth (hc) is 10 nm, indentation time is 0.7 s. (a, e) Indentation
modulus, (b, f) viscoplasticity index, (c, g) adhesion force, (d, h) adhesion energy. Mappings are generated from
sets of individual FV curves using a home-made Matlab software.
the lower MFA in the G layer, one can expect it to have the highest value. In addition to the sample misori-
entation mentioned above, this difference could be explained here by the fact that: the indentation modulus
is not very sensitive to the MFA when its value is low (i.e., < 15°)4,42 and/or buckling of the microfibrils36
could occur more easily in the G layer as its cell wall matrix is mainly composed of a hemicellulose gel-like
structure7,8,12.
• VPI values present a low dispersion and allow a good discrimination of each layer, therefore it is a great
physical property to look at in addition to indentation modulus. However, VPI in S2 varies greatly accord-
ing to the observed area of the cell (Fig. 6f), even though there is no obvious correlation between the vari-
ations of modulus in S2 and the variations of VPI. We mainly observe that, for the two upper cells of Fig. 6,
VPIG ≥ VPIS2, VPIS1 > VPICML, the viscoplastic component hence contributes more largely to the mechanical
response in G suggesting a higher viscosity or weaker plastic properties (lower elastic limit or greater plastic
strain) than in other layers. In the case of negligible contribution of plasticity, these results are in agree-
ment with damping factor (tan δ) mapping obtained by CR-AFM on chestnut TW at much larger loading
frequencies35. They also partially agree with macroscopic viscoelastic dynamic characterization (DMA) of
tension wood versus normal wood of tropical species43 at similar loading frequencies, where viscosity of
TW was found higher than of OW’s (or normal wood). Finally, even if VPI cannot be directly associated to
creep behavior because of the plasticity contribution, our results are in agreement with recent studies using
Berkovich nanoindentation creep test s tudies44 in which viscosity in normal wood was found higher in S2
than in CML.
• The way adhesion is measured, as a force (Fig. 6g) or energy (Fig. 6h), does not provide different biological
information concerning the cell walls. This agrees with the DMT and JKR theories of mechanical contact,
which take adhesion into account, and which indicate that the adhesion force is proportional to the adhesion
energy per unit a rea23. Since the contact area is not known during the adhesion phase, it is impossible to
know precisely the proportional factor between these two quantities. However, it can be seen that the ratio
of the adhesion force to the adhesion energy is almost constant, whatever the location on the wood cell wall
(between 2.3 and 2.5). Thus, whatever the parameter (force or energy) used to study adhesion, we observe
a clear trend such as AdhG > AdhS2 > AdhS1 > AdhCML (Figs. 6g, h), with little variations within the S2 layer,
and therefore little dependence to the MFA. This result hence suggests that adhesion could be sensitive to
the chemistry of the different parietal layers. This hypothesis is supported by the existing correlation with
the chemical composition of the matrix of each of these layers: the ratio of the (amorphous) hemicellulose
(hydrophilic)/lignin (hydrophobic) fraction is more important within the G layer (no lignin, matrix made
of hemicellulose in a gel-like s tructure12) than in S2, which is itself more important than in the C ML45. Our
measurements are in adequacy with the hypothesis that adhesion in ambient conditions reflects the affinity of
the indented surface with water: a stronger adhesion corresponds to a more hydrophilic material. In the case
of wood cell walls, this can be interpreted as an area rich in (amorphous) hemicellulose (cellulose molecules
are rich in hydroxyls groups that give them hydrophilic properties), especially in the case of the G layer with
a gel-like s tructure8,12. The local roughness, of the surface and of the tip apex, which is also known for having
a huge impact on adhesion m easurements46, is estimated from a topographic map of the area acquired using
the AFM in semi-contact mode. Average roughness ( Ra) which ranges between 1 and 2 nm for G, S2 and CML
shows no significant differences between these layers (Table 1), and does not correlate with the measured
adhesion, hence strengthening the hypothesis of an adhesion characterizing surface chemistry through its
Scientific Reports | (2021) 11:5739 | https://doi.org/10.1038/s41598-021-84994-0 8
Vol:.(1234567890)www.nature.com/scientificreports/
Fadh/Eadh
Sa (nm) M (GPa) VPI Fadh (nN) Eadh (e−17 J) (m−1) n
G 1.5 17.3 ± 1.6 0.50 ± 0.06 91.0 ± 7.1 39.1 ± 3.3 2.3 889
G′ 1.5 16.7 ± 1.4 0.45 ± 0.05 101.6 ± 5.9 44.5 ± 3.4 2.3 719
G″ 1.2 16.4 ± 1.3 0.47 ± 0.03 90.5 ± 6.9 37.8 ± 3.7 2.4 185
Gave 1.4 16.8 0.47 94.4 40.5 2.3
S2 1.9 13.8 ± 1.4 0.35 ± 0.08 84.2 ± 7.5 34.3 ± 3.4 2.5 860
S2′ 1.9 17.2 ± 1.6 0.31 ± 0.06 89.0 ± 7.4 36.3 ± 3.5 2.5 609
S2″ 1.3 18.2 ± 1.6 0.48 ± 0.05 87.9 ± 6.6 35.4 ± 3.5 2.5 386
S2ave 1.7 16.4 0.38 87.0 35.3 2.5
S1 3.5 14.1 ± 3.6 0.36 ± 0.08 76.1 ± 7.6 31.7 ± 2.9 2.4 145
S1′ 4.1 9.6 ± 1.9 0.32 ± 0.07 68.4 ± 10.8 31.5 ± 3.2 2.2 115
S1″ 3.0 10.3 ± 0.9 0.27 ± 0.06 75.5 ± 8.1 32.0 ± 3.2 2.4 129
S1ave 3.5 11.3 0.32 73.3 31.7 2.4
CML 1.3 9.9 ± 1.2 0.22 ± 0.05 63.4 ± 7.4 27.1 ± 2.6 2.3 75
RESIN 1.1 3.9 ± 1.8 0.43 ± 0.03 64.1 ± 3.6 37.7 ± 2.6 1.7 659
Table 1. Physical parameters extracted from Figs. 6 e–h mappings for the different wood cell wall layers of
three nearby wood cells. n is the number of indentation measurements performed for each analyzed region.
hydrophilic properties. Table 1 summarized the various extracted parameters and the above comparisons
are illustrated by the average values evidenced in bold.
Concluding remarks
The presented Area Function Calibration (AFC) method, allows to considerably reduce the approximations on
materials elastic modulus resulting from a bad knowledge of tip shape and cantilever stiffness usually encoun-
tered with AFM force-volume measurements and open the path to semi-quantitative analysis. This reveals to
be particularly useful to study (relatively) stiff materials, such as wood cell walls or other inorganic materials,
requiring the use of cantilevers with a high stiffness, which is difficult to precisely determine. In addition, it opens
the possibility for using probes not usually dedicated to indentation, such as diamond coated probes with high
surface roughness or atypical probes with weird shapes.
Application of the method to an indentation mapping over a tension wood region allowed the quantitative
mappings of the indentation moduli. It was established that the viscoplasticity index (VPI) depends both on the
viscous and plastic behaviors of the indented material and turned out to be a stable and significant parameter
complementary to elastic indentation modulus. Finally, adhesion was found to reflect the cellulose content
through hydrophilicity and could be used as a complementary approach to other chemical mapping techniques
(such as RAMAN spectroscopy) which do not allow such great spatial resolution. Thus, force-volume indenta-
tion with the presented method has proven to be a rich toolbox to study various physical, chemical properties
and to carry out correlations to deepen our knowledge of wood cell walls.
We believe the AFC method brings the use of AFM force-volume mode to a higher standard where the
extracted indentation moduli are semi-quantitative and we are convinced that it will be very useful to anyone
interested in the nano-mechanical properties of complex materials.
Materials and methods
Sample preparation. Wood samples come from young 7-month-old poplars (Populus euramericana,
“Robusta” and “I214” blend) cultivated in open-field and constrained with a tutor after two months of growth
to induce tension wood generation (Fig. 1a). After harvesting, the samples are cut, stored in water and kept in a
cold room at 5 °C.
To confirm the presence of tension wood, a saffranine-Alcyan blue staining was first performed on an ana-
tomical section in order to reveal the presence of the cellulose rich areas corresponding to tension wood47,48.
Surface roughness is a critical parameter when it comes to AFM indentation measurements. As a result, the
great challenge in sample preparation is to reduce this roughness as much as possible. Our procedure is the fol-
lowing: sample preparation starts with a 1 cm thick stems sections cut with a saw. Matches of an approximate
size of 4 × 1 × 1 mm3 oriented according to the direction of the fibers are then extracted within the tension wood
and the opposite wood. The matches are then dehydrated under vacuum in successive ethanol/distilled water
baths with ethanol concentrations of 50%, 75% and 100% for half an hour each. Dehydration is necessary to
allow inclusion in hydrophobic resin LR white (EMS Catalog LR White Medium grade), which is itself necessary
ood48. Ethanol has been shown to be the solvent which
to avoid the collapse of the gelatinous layer of tension w
minimizes the damages to the G layer49. LR-White has been chosen as the embedding resin that has reduced
penetration into wood cell wall, leading to no change in mechanical measurements at the nanometer s cale50.
Resin inclusion is then obtained by soaking the matches overnight in a 1:1 Ethanol:LR white mixture at room
Scientific Reports | (2021) 11:5739 | https://doi.org/10.1038/s41598-021-84994-0 9
Vol.:(0123456789)www.nature.com/scientificreports/
temperature, followed by two successive resin baths for 1 h and 2 h respectively. Subsequent polymerization is
carried out in an oven at 65 °C for about 24 h.
Finally, the extremity of the samples is cut into a pyramidal shape using a razor blade in order to reduce the
section before ultra-microtoming. Ultra-microtomy (Leica EM UC7) is performed as best as possible perpen-
dicularly to the axis of the fibers. The surface is leveled and the next 100 µm cut with a glass knife. Finishing cuts
are carried out using an ultra diamond knife (RMC Ultra) (final cuts of 50 nm in thickness at 0.6 mm/s). With
such procedure, the local roughness (Ra), computed from topographic images produced in semi-contact mode by
AFM (Figs. 1b, c) on the largest surfaces available of each layer was found to be smaller than 2 nm for all layers.
AFM and tips. Topographic images were first acquired using a NTEGRA AFM from NT-MDT in semi-
contact mode. Indentations were then performed using the same AFM in contact mode, by controlling the dis-
placement of the piezoelectric element in the direction perpendicular to the surface and the time rate required
to perform this displacement. All the tests were carried out below the limit of linearity of each cantilever which
was previously determined.
Two types of tips were used: PPP-NCHR (PPP) from Nanosensors with a radius of curvature of 5 nm as
assessed by scanning electron microscopy (SEM) measurements and a half-cone angle of 20° (manufacturer’s
data). We verified, using the area-function, that the shape of the tip remained unchanged after measurements.
The calibration of this tip using the Sader’s method gives a stiffness of the cantilever of 22 N/m. For the tip, made
of silicon without any coating, elastic modulus and Poisson’s ratio of silicon are used as mechanical constants of
Si = 180 GPa and νSi = 0.28 respectively51. The second kind of tips, the DT-NCLR from Nanosensor
the tip, i.e., E
(DT), is not usually used for nanoindentation tests because of its irregular surface caused by a diamond coating
to make it harder and limit its degradation. Its radius of curvature is estimated to 110 nm and presents a high
surface roughness of a few nanometers. The half cone angle is 20° and the stiffness of the cantilever is estimated
at 70 N/m after calibration by the manufacturer. The values taken as mechanical constants for the diamond are:
Ediamond = 1200 GPa and νdiamond = 0.252.
Determination of tip/surface contact area‑function. The first step of our method consists in estab-
lishing the area function, which describes the evolution of the tip/surface contact area with the indentation
depth. To build this curve several series of indentations were carried out on a reference sample with known
indentation modulus at various indentation depths. For each measurement, the slope S at the beginning of the
unloading curve can be expressed by53:
dF0 2
S0 (hmax ) = (hmax ) = √ · M0 · A(hc ) (1)
dh0 π
where the “0” index refers to the reference sample, with M the indentation modulus, F the maximum force
applied by the tip on the surface, hmax the total indentation depth and hc the effective indentation corresponding
to the contact depth (Fig. 2a)29,30.
Considering the cantilever as a linear spring, the force can be written as F = k · δ with k and δ the cantilever’s
stiffness and deflection, respectively. Let us note:
dδ S
S′ = = (2)
dh k
Using Eqs. (1) and (2), the area function can be expressed as a function of the indentation depth as:
√
π 1
(3)
A(hc ) = · k · S0′ (hmax ) ·
2 M0
with
2
1 − νtip
1 1
= + (4)
M0 MResin Etip
where Etip and νtip are the tip elastic Young’s modulus and Poisson ratio. The resin sample, assumed homogeneous,
and calibrated in reference 18 by nanoindentation is used as reference, with MResin = 4.5 GPa18,50. Note that the
reference sample must have an indentation modulus in the same range as those of the sample under investigation.
For each indentation curve, the four-steps processing goes as follows:
1. Conversion from deflection curves as a function of the displacement of the piezoelectric element to force
curves as a function of the depth of indentation using the cantilever sensitivity (cantilever displacement
versus deflection) measured beforehand on a sample considered to be infinitely rigid (here flat Silicon).
Cantilever stiffness values provided by the manufacturer or obtained using Sader’s method54. It is shown
here that this value does not impact indentation modulus determination.
2. Smoothing using a Savitsky–Golay function to overcome measurement noise.
3. Subtraction of the force baseline.
4. Determination of the slope S 0 at the beginning of the unloading curve to reduce the effects of viscosity and
plasticity.
Scientific Reports | (2021) 11:5739 | https://doi.org/10.1038/s41598-021-84994-0 10
Vol:.(1234567890)www.nature.com/scientificreports/
Extraction of S0 is critical and may influence drastically the resulting values for the elastic modulus. The meth-
odology that we have set to extract this slope is discussed in the following. Oliver and Pharr24,30 recommends fit-
ting the unloading curve with a power law of the form F = α · hm , the slope is then computed as the derivative of
this function at the beginning of the curve. In practice, unloading curves rarely follow such a function in the case
of polymers24. To overcome this difficulty, S is sometimes approximated by a linear regression, however, the range
chosen to fit the unloading curve greatly influence S’s d etermination24. We choose here a compromise between
the two methods: the entire unloading curve is adjusted with a mth degree polynomial and we determine S as the
maximum value of the derivative, i.e. corresponding to the slope at the beginning of the curve (Supplementary
Fig. S5a). In supplementary section S5, values of S are computed using polynomials of degrees ranging from 1
to 8, each point corresponding to an average of 16 curves (Supplementary Fig. S5b). A polynomial of degree 5 is
the best compromise between a good fit quality and a low influence of measurement noise.
To take into account the phenomenon of surface deflection during indentation (Fig. 2a), we assume a “sink-
in” indentation behavior in both resin and plant cell w alls24,39. Indentation depth is corrected using Oliver and
Pharr formula (Eq. 5) with:
Fmax k · δmax δmax
hc = hmax − hs , with hs = ε =ε ′
=ε ′ (5)
S k·S S
where the epsilon coefficient (ε) is introduced to take the indenter geometry into account.
It was shown that ε equals 0.72 for a conical shape, 0.75 for a parabola of revolution and 1 for a cylindrical
flat punch24,30. However, because the shape of the tip is not always well known or does not match the simple geo-
metrical models, we investigated the effect of the value of ε on the resulting indentation moduli. We show that
these moduli have a relative variation of 10% at most for extreme values of ε ranging from 0.5 to 1, thus showing
that this parameter has little influence on the final determination of the moduli (Supplementary Fig. S6). In this
study we chose a value of ε = 0.75 for a parabola of revolution, the closest geometry of the tips we used.
Using Eqs. (3) and (5), we plotted, for each indentation depth hc, the tip/surface contact area A as shown in
Fig. 2b for the two types of tips (See Methods section). For each tip, the area function, expressed as A = f(hc) is
obtained by fitting the curves by a degree 3 polynomial function (Fig. 2b, black lines).
Plant cell wall indentation data processing and extraction of indentation modulus. The inden-
tation curves on the plant walls are processed in a similar manner to those of the reference sample described
above. In addition to the 4 steps described previously, the last step consists in determining the remarkable points
that are required to extract the different physical quantities (indentation modulus, adhesion force and energy,
viscoplasticity index): contact point (A), start of the unloading curve (B), end of the indentation (C), maximum
adhesion (D), end of the adhesion (E) as pointed in Fig. 2a.
As for Eq. (1), and using the area function determined previously with the reference sample, we can write
the indentation modulus as:
√
π 1
M= · S(hmax ) · √ (6)
2 A(hc )
By developing A and S from Eqs. (2) and (3), the sample modulus can be expressed independently of the
cantilever stiffness as:
√
π
· k · S′ (hmax ) S′ (hmax )
M= √ 2 = · M0 (7)
π ′ 1 S0′ (hmax )
2 · k · S0 (hmax ) · M0
Since the plant cell walls are strongly anisotropic materials (transverse isotropic with axis of symmetry along
the microfibrils direction) and that indentation test produces a complex loading, essentially composed of com-
pression in the direction of indentation and compression and shear in the transverse direction, we cannot directly
extract a Young’s modulus, e.g., the longitudinal or transverse m odulus17,29,55. Indentation modulus results from a
4,15,16,56
combination of the elastic constants , and is expressed as follows to take tip deformation into account24,30:
2
1 − νtip
1 1
= + (8)
M Mwood cell wall Etip
thus
2
−1
1 1 − νtip
Mwood cell wall = − (9)
M Etip
Viscoplasticity index mapping. To deepen our knowledge on the mechanical behavior of plant fibers, we
use the dimensionless qualitative viscoplasticity index (VPI) defined as: VPI = 1 − A2/(A1 + A2) (Fig. 2a)23,57,58.
The area under the loading curve, A1 + A2, corresponds to the energy required to perform the indentation and
under the unloading curve, A2, to the energy restored during the indenter withdrawal by the reversible relaxa-
tion of the sample. A VPI of 0 corresponds to a perfectly elastic indentation while an index of 1 corresponds to
a perfectly plastic indentation.
Scientific Reports | (2021) 11:5739 | https://doi.org/10.1038/s41598-021-84994-0 11
Vol.:(0123456789)www.nature.com/scientificreports/
Adhesion force and energy mappings. Adhesion reflects the interaction between the tip and the sample
surface. For measurements performed in air, at ambient conditions and with stiff sample as those here, adhesion
has been shown to characterize the chemistry through the surface water content59. A water bridge forms between
the tip and the indented surface, and the resulting capillary forces are predominant in the measured adhesion.
However, adhesion shall be compared as a qualitative parameter as many authors have warned about the influ-
ence of surface roughness, tip chemistry and geometry23,46. Adhesion can be measured both as the maximum
force of attraction during the separation of the tip with the surface or as an energy (A0) corresponding to the
energy preventing the tip to detach from the sample during tip withdrawal (Fig. 2a).
Measurements protocol and statistical indicators. Since the walls of wooden cells are comparable to
a transverse isotropic material along the microfibrils direction, the angle of the microfibrils on the surface is a
parameter of paramount importance influencing the value of the measured indentation modulus and associated
mechanical parameters. An indentation carried out along the axis of the microfibrils results in the determina-
tion of a larger indentation modulus than for an indentation performed given a different angle29,42,55. The surface
microfibrils angle depends both on the natural wood cell walls microfibrils angle with respect to the direction of
the fiber (biological data, MFA), as well as the cutting angle (sample preparation dependence). This latter causes
a variation of the microfibrils angle at the surface as a function of the indentation position around the c ell35,41.
Although the purpose of the accurate cut is to be perpendicular to the direction of the natural fibers as best
as possible, a small variation can have a large impact on the measured modulus. In order to limit this variability
or to evidence the cutting angle impact, we acquired each set of indentations by replicating it 3 times at different
positions around the same cell, or a neighboring cell.
Each set corresponds to 9 indentations arranged in a 3 × 3 grid with a gap between each indentation in
order to avoid overlapping imprints and solicited volumes (Supplementary Fig. S7). The results of the 3 sets of
9 indentations made with the same parameters are then averaged and the error bars correspond to the standard
deviation over these 27 measurements.
Data availability
The datasets used and/or analyzed during the current study are available from the corresponding author on
reasonable request.
Received: 15 October 2020; Accepted: 23 February 2021
References
1. Gurunathan, T., Mohanty, S. & Nayak, S. K. A review of the recent developments in biocomposites based on natural fibres and
their application perspectives. Compos. Part A Appl. Sci. Manuf. 77, 1–25 (2015).
2. Del Masto, A., Trivaudey, F., Guicheret-Retel, V., Placet, V. & Boubakar, L. Investigation of the possible origins of the differences in
mechanical properties of hemp and flax fibres: a numerical study based on sensitivity analysis. Compos. Part A Appl. Sci. Manuf.
124, 105488 (2019).
3. Bergander, A. & Salmén, L. Cell wall properties and their effects on the mechanical properties of fibers. J. Mater. Sci. 37, 151–156
(2002).
4. Jäger, A., Bader, T., Hofstetter, K. & Eberhardsteiner, J. The relation between indentation modulus, microfibril angle, and elastic
properties of wood cell walls. Compos. Part A Appl. Sci. Manuf. 42, 677–685 (2011).
5. Keplinger, T. et al. A zoom into the nanoscale texture of secondary cell walls. Plant Methods 10, 1 (2014).
6. Yamamoto, H., Kojima, Y., Okuyama, T., Abasolo, W. P. & Gril, J. Origin of the biomechanical properties of wood related to the
fine structure of the multi-layered cell wall. J. Biomech. Eng. 124, 432–440 (2002).
7. Pilate, G. et al. Lignification and tension wood. C. R. Biol. 327, 889–901 (2004).
8. Alméras, T. & Clair, B. Critical review on the mechanisms of maturation stress generation in trees. J. R. Soc. Interface 13, 20160550
(2016).
9. Gril, J., Jullien, D., Bardet, S. & Yamamoto, H. Tree growth stress and related problems. J. Wood Sci. 63, 411–432 (2017).
10. Abedini, R., Arnould, O., Laurans, F., Pourtahmasi, K. & Clair, B. Cell wall thickening in developing tension wood of artificially
bent poplar trees. IAWA J. 36, 44–57 (2015).
11. Prodhan, A. K. M. A., Funada, R., Ohtani, J., Abe, H. & Fukazawa, K. Orientation of microfibrils and microtubules in developing
tension-wood fibres of Japanese ash (Fraxinus mandshurica var. japonica). Planta Int. J. Plant Biol. 196, 577–585 (1995).
12. Clair, B., Gril, J., Di Renzo, F., Yamamoto, H. & Quignard, F. Characterization of a gel in the cell wall to elucidate the paradoxical
shrinkage of tension wood. Biomacromol 9, 494–498 (2008).
13. Wimmer, R., Lucas, B. H., Tsui, T. Y. & Oliver, W. C. Longitudinal hardness and Young’s modulus of spruce tracheid secondary
walls using nanoindentation technique. Wood Sci. Technol. 31, 131–141 (1997).
14. Swadener, J. G. & Pharr, G. M. Indentation of elastically anisotropic half-spaces by cones and parabolae of revolution. Philos. Mag.
A Phys. Condens. Matter Struct. Defects Mech. Prop. 81, 447–466 (2001).
15. Vlassak, J. J., Ciavarella, M., Barber, J. R. & Wang, X. The indentation modulus of elastically anisotropic materials for indenters of
arbitrary shape. J. Mech. Phys. Solids 51, 1701–1721 (2003).
16. Vlassak, J. J. & Nix, W. D. Measuring the elastic properties of anisotropic materials by means of indentation experiments. J. Mech.
Phys. Solids 42, 1223–1245 (1994).
17. Jäger, A., Hofstetter, K., Buksnowitz, C., Gindl-Altmutter, W. & Konnerth, J. Identification of stiffness tensor components of wood
cell walls by means of nanoindentation. Compos. Part A Appl. Sci. Manuf. 42, 2101–2109 (2011).
18. Arnould, O., Siniscalco, D., Bourmaud, A., Le Duigou, A. & Baley, C. Better insight into the nano-mechanical properties of flax
fibre cell walls. Ind. Crops Prod. 97, 224–228 (2017).
19. Casdorff, K., Keplinger, T. & Burgert, I. Nano-mechanical characterization of the wood cell wall by AFM studies: comparison
between AC- and QI mode. Plant Methods 13, 1–9 (2017).
20. Goudenhooft, C. et al. Investigation of the mechanical properties of flax cell walls during plant development: the relation between
performance and cell wall structure. Fibers 6, 6 (2018).
21. Melelli, A., Arnould, O., Beaugrand, J. & Bourmaud, A. The middle lamella of plant fibers used as composite reinforcement:
investigation by atomic force microscopy. Molecules 25, 632 (2020).
Scientific Reports | (2021) 11:5739 | https://doi.org/10.1038/s41598-021-84994-0 12
Vol:.(1234567890)You can also read