The survey of Planetary Nebulae in Andromeda (M31): I. Imaging the disk and halo with MegaCam@CFHT
←
→
Page content transcription
If your browser does not render page correctly, please read the page content below
Astronomy & Astrophysics manuscript no. draft_arxiv                                                                                        c ESO 2019
                                              March 11, 2019

                                                The survey of Planetary Nebulae in Andromeda (M31): I. Imaging
                                                           the disk and halo with MegaCam@CFHT
                                                   Souradeep Bhattacharya1,? , Magda Arnaboldi1 , Johanna Hartke1, 2 , Ortwin Gerhard3 , Valentin Comte1, 4 , Alan
                                                                                     McConnachie5 , and Nelson Caldwell6

                                                    1
                                                        European Southern Observatory, Karl-Schwarzschild-Str. 2, 85748 Garching, Germany
                                                        e-mail: sbhattac@eso.org
                                                    2
                                                        European Southern Observatory, Alonso de Cordova 3107, Vitacura, Casilla 19001, Santiago de Chile, Chile
                                                    3
                                                        Max-Planck-Institut für Extraterrestrische Physik, Giessenbachstrasse, 85748 Garching, Germany
                                                    4
                                                        Aix Marseille Universite, CNRS, LAM – Laboratoire d’Astrophysique de Marseille, 38 rue F. Joliot-Curie, 13388 Marseille, France
arXiv:1903.02597v2 [astro-ph.GA] 8 Mar 2019

                                                    5
                                                        NRC Herzberg Institute of Astrophysics, 5071 West Saanich Road, Victoria, BC V9E 2E7, Canada
                                                    6
                                                        Harvard-Smithsonian Center for Astrophysics, 60 Garden Street, Cambridge, MA 02138

                                                    Submitted: 5th November, 2018; Accepted: 6th March, 2019

                                                                                                                    ABSTRACT

                                                    Context. The Andromeda (M31) galaxy subtends nearly a 100 sq. deg. on the sky. Any study of its halo must therefore account
                                                    for the severe contamination from the Milky Way halo stars whose surface density displays a steep gradient across the entire M31
                                                    field-of-view.
                                                    Aims. Our goal is to identify a population of stars firmly associated with the M31 galaxy. Planetary Nebulae (PNe) are one such
                                                    population that are excellent tracers of light, chemistry and motion in galaxies. We present a 16 sq. deg. survey of the disk and inner
                                                    halo of M31 with the MegaCam wide-field imager at the CFHT to identify PNe, characterize their luminosity-specific PN number
                                                    and luminosity function in M31.
                                                    Methods. PNe were identified based on their bright [O iii] 5007 Å emission and absence of a continuum through automated detection
                                                    techniques. Subsamples of the faint PNe were independently confirmed by matching with resolved Hubble Space Telescope sources
                                                    from the Panchromatic Hubble Andromeda Treasury and spectroscopic follow-up observations with HectoSpec at the MMT.
                                                    Results. The current survey reaches 2 magnitudes fainter than the previous most-sensitive survey. We thus identify 4289 PNe, of
                                                    which only 1099 were previously known. By comparing the PN number density with the surface brightness profile of M31 out to ∼ 30
                                                    kpc along the minor-axis, we find that the stellar population in the inner halo has a 7 times larger luminosity-specific PN number value
                                                    than that of the disk. We measure the luminosity function of the PN population and find a bright cut-off and a slope consistent with
                                                    the previous determination by Ciardullo et al. (1989). Interestingly, it shows a significant rise at the faint end, present in all radial bins
                                                    covered by the survey. Such a rise in the M31 PN luminosity function is much steeper than that observed for the Magellanic clouds
                                                    and Milky Way bulge.
                                                    Conclusions. The significant radial variation of the PN specific frequency value indicates that the stellar population at deprojected
                                                    minor-axis radii larger than ∼ 10 kpc is different from that in the disk of M31. The rise at the faint-end of the PN luminosity function
                                                    is a property of the late phases of the stellar population. M31 shows two major episodes of star formation and the rise in the faint end
                                                    of the PNLF is possibly associated with the older stellar population. It may also be a result of varying opacity of the PNe.
                                                    Key words. galaxies: individual(M31) – galaxies: halo – planetary nebulae: general

                                              1. Introduction                                                               & Mackey 2016). Indeed, through the Pan-Andromeda Archae-
                                                                                                                            ological Survey (PAndAS; McConnachie et al. 2009) map of the
                                              The Andromeda galaxy, M31, is the closest giant spiral disk to                resolved stellar population number counts, we now know about
                                              our Milky Way (MW). It lies at a distance of ∼ 780 kpc with a                 the substructures present in the M31 halo (Giant Stellar Stream,
                                              high inclination to the line-of-sight (i∼ 77 deg) making it ideally           G1 and NE clump, NE and W shelves; McConnachie et al. 2018)
                                              suited for studies of its halo regions. Since galaxies are believed           and that the stellar halo extends out to 165 kpc.
                                              to be formed by hierarchical mass assembly, their outskirts with                  Because of the faint surface brightness of the M31 halo,
                                              long dynamical timescales are expected to have coherent debris                µv > 25 outside the main disk (∼ 15 kpc major axis distance), the
                                              from past accretion events for the greatest longevity (Ferguson               use of discrete stellar tracers is superior to integrated absorption-
                                               ?
                                                                                                                            line spectroscopy in providing a global mapping of the halo
                                                  Based on observations obtained with MegaCam, a joint project              kinematics. Globular clusters (GCs) have been shown to effi-
                                              of CFHT and CEA/DAPNIA, at the Canada-France-Hawaii Telescope
                                                                                                                            ciently trace the outer halo (outside 50 kpc) substructures of M31
                                              (CFHT) which is operated by the National Research Council (NRC)
                                              of Canada, the Institut National des Science de l’Univers of the Centre       (Mackey et al. 2010; Veljanoski et al. 2014) bolstering the idea
                                              National de la Recherche Scientifique (CNRS) of France, and the Uni-          that these clusters and the substructures they trace have been ac-
                                              versity of Hawaii. The observations at the CFHT were performed with           creted in various merger events. However the inner halo sub-
                                              care and respect from the summit of Maunakea which is a significant           structures (within 50 kpc) are not well-traced by the GCs. Some
                                              cultural and historic site.                                                   of these substructures, especially the Giant Stream, may have re-
                                                                                                                                                                         Article number, page 1 of 19
A&A proofs: manuscript no. draft_arxiv

sulted from a single merger event ∼ 2 Gyr ago (Bernard et al.          in the Large Magellanic Clouds (Reid & Parker 2010), and ∼ 1
2015; Hammer et al. 2018) perhaps between M31 and the large            mag below the bright cut-off in M87 (Longobardi et al. 2015).
(M M32P ∼ 2.5 × 10¹⁰ M ) progenitor of M32 (D’Souza & Bell             This dip is suggested to be related with the opacity of the PN
2018).                                                                 and may be characterized by accounting for circumstellar extinc-
    We can gain information on the motions of the stars in the         tion in the PNe. Indeed, circumstellar extinction correction does
low surface brightness regions of M31 by studying Planetary            modify the PNLF (Reid & Parker 2010; Davis et al. 2018) but
Nebulae (PNe) that act as discrete tracers of stars in the halo.       is difficult to estimate for the faint end of the PNLF (beyond ∼
PNe are the glowing shells of gas and dust observed around             2.5 mag below the bright cut-off) to test for changes in opacity of
stars that have recently left the asymptotic giant branch (AGB)        the PN. Additionally PNe mimics like H ii regions and symbiotic
and are evolving towards the white dwarf stage. They are tradi-        stars may be misidentified as PNe thereby affecting the PNLF.
tionally considered the late phases of stars with masses between           Since the first empirical study of the PNLF by Ciardullo et al.
∼ 0.7 and 8 M , but have been shown to exhibit a wide variety          (1989) using 104 objects in the M31 bulge, the number of PNe
of striking morphologies pointing towards a binary evolution in        known in M31 has increased by leaps and bounds. Most notably,
many systems (Jones & Boffin 2017). Since the timescales be-           Merrett et al. (2006, hereafter M06) utilized the custom-built
tween the AGB and PN phases are short, the distribution and            Planetary Nebula Spectrograph (PNS; Douglas et al. 2002) at
kinematics of PNe are expected to be identical to their parent         the William Herschel Telescope (WHT) to identify 2615 PNe
population, having the same angular momentum distribution as           in the disk and bulge of M31 and simultaneously obtain their
the stellar population (e.g. Hui et al. 1995; Arnaboldi et al. 1996,   [O iii] 5007Å magnitude and line-of-sight velocity (LOSV). M06
1998; Méndez et al. 2001). Studying PNe as a population pro-           corroborated the PNLF found by Ciardullo et al. (1989) and in-
vides insight into galactic structure and evolution. Because of        creased the photometric depth to ∼ 3.5 - 4 mag below the bright
their relatively strong [O iii] 5007Å emission, PNe can be read-       cut-off along with the increased uniform coverage. Since then,
ily identified. They have been shown to be efficient tracers of        Martin et al. (2018) and Li et al. (2018) have identified more
stellar light in different galaxies like M87 (Longobardi et al.        PNe in the central regions and circumnuclear region of M31 re-
2013), M49 (Hartke et al. 2017), and many other early-type             spectively adding to the large number of PNe already known in
galaxies (Coccato et al. 2009; Cortesi et al. 2013; Pulsoni et al.     M31.
2018). The luminosity-specific PN number (α-parameter) varies              While some of the PNe identified by M06 have been shown
slightly with B-V colour of galaxies with higher values for late-      to be H ii regions (Sanders et al. 2012; Veyette et al. 2014), the
type galaxies and lower values for early-type galaxies (Buzzoni        M06 PNe sample remains the largest uniform sample of PNe in
et al. 2006). Different α-parameter values point to differences        any galaxy. The LOSV of the M06 PNe predicted links between
in stellar populations even within the same galaxy (e.g. M49;          the NE Shelf and the Giant Stream substructures of M31 which
Hartke et al. 2017).                                                   have been further explored in deep spectroscopic chemical tag-
    The characteristic [O iii] 5007Å PN luminosity function            ging studies by Fang et al. (2015, 2018) to further establish these
(PNLF) has proven itself as a reliable secondary distance in-          links. However while some identified PNe have been associated
dicator for determining galactic distances out to ∼20 Mpc, by          with the halo, a uniform survey of PNe in much of the metal-
virtue of its invariant absolute bright cut-off, M*. The faint end     poor halo of M31 and the inner-halo substructures is necessary
of the PNLF was shown by Jacoby (1980) to follow an expo-              not only to unambiguously trace them but also to probe the vari-
nential function expected from slowly evolving central stars em-       ation in the PNLF further out from the disk to corroborate the
bedded in rapidly expanding, optically thin nebulae (Henize &          invariant nature of its bright cut-off and observe the evolutionary
Westerlund 1963). The PNLF was first described by Ciardullo            effects on its faint end.
et al. (1989) estimated empirically from the brightest PN they             In this paper, we survey the inner 16 sq. degree of M31 (cor-
found in the center of M31 as:                                         responding to 20-30 kpc from the center), covering the disk,
                           ∗
                               −M)                                     parts of the inner halo and some of the inner halo substructures.
N(M) ∝ e0.307M (1 − e3(M             )                          (1)
                                                                       We detect PNe using the on-off-band technique to a depth further
The bright end exponential cut-off, supported with accurate mea-       than M06. The observations and data reduction are described in
sures of foreground extinction, is currently measured at M ∗ =         Section 2. Identification of PNe is described in Section 3. Sec-
−4.54 ± 0.05 (Ciardullo et al. 2013). Apart from M* reducing in        tion 4 describes the identification of the PNe counterparts in a
low metallicity populations (e.g. Ciardullo & Jacoby 1992; Cia-        subsample to Hubble Space Telescope (HST) data. We obtain
rdullo et al. 2002; Hernández-Martínez & Peña 2009), the PNLF          the α-parameter in section 5 and analyze the PNLF in Section 6.
cutoff has proved to be largely invariant with metallicity and age     The discussions of the results are presented in Section 7 and we
of the parent stellar population, and, galaxy type.                    summarize and conclude in Section 8.
    The faint-end of the PNLF has been shown to vary consider-
ably, depending on the details of the stellar population. It is seen
to be correlated with the star formation history of the parent stel-   2. CFHT MegaCam M31 PNe survey
lar population, with steeper slopes associated with older stellar      2.1. Imaging and observations
populations and conversely flatter slopes with younger popula-
tions (Ciardullo et al. 2004; Ciardullo 2010; Longobardi et al.        The observations were carried out with the MegaCam wide-field
2013; Hartke et al. 2017). The changes in the PNLF slope can           imager (Boulade et al. 2003) mounted on the 3.6-meter Canada
result from superposition of multiple stellar populations which        France Hawaii Telescope (CFHT), located near the summit of
can then be disentangled using the PNe kinematics (Longobardi          the Mauna Kea mountain on Hawaii’s Big Island at an altitude
et al. 2015; Hartke et al. 2018). The PNLF has also been shown         of 4204 meters. MegaCam is comprised of a mosaic of 40 indi-
to display a dip for some galaxies. The dip is seen ∼ 3.5 mag be-      vidual 2048 × 4612 CCDs, resulting in a contiguous field of view
low the bright cut-off in the Small Magellanic Cloud (SMC; Ja-         of 0.96 × 0.94 degrees with a pixel scale of 0.18700 /pixel. The in-
coby & De Marco 2002), ∼ 2.5 mag below the bright cut-off for          ner 20-30 kpc radius of the M31 halo were observed through 16
NGC 6822 (Hernández-Martínez & Peña 2009) and also slightly            pointings of the MegaCam imager. The fields are shown in Fig-
Article number, page 2 of 19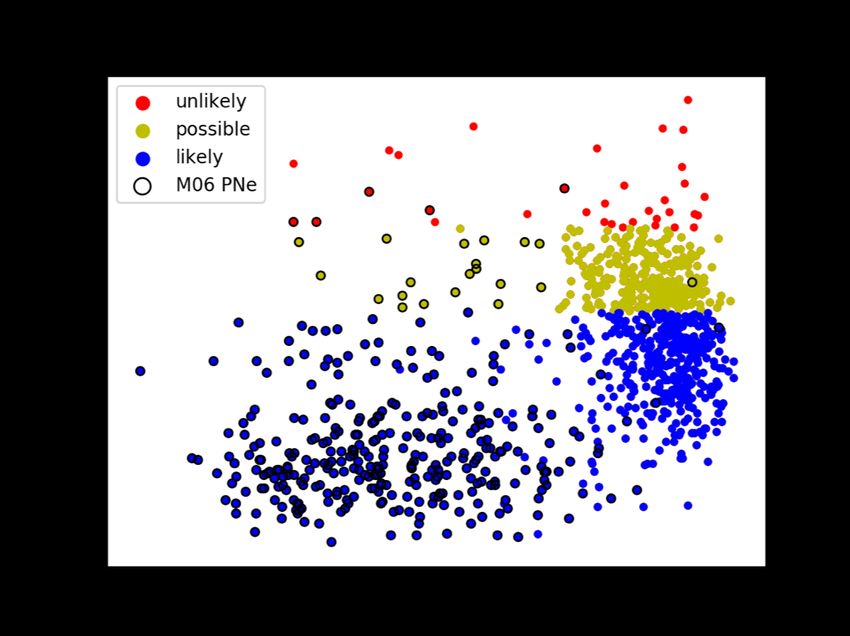
Souradeep Bhattacharya et al.: The survey of PNe in M31 I - Imaging
Table 1. Summary of the field positions, exposure times, and seeing for
the narrow-band (on-band) and broad-band (off-band) images. Limit-
ing magnitudes (m5007,lim ; described in Sect 3.2) for each field are also
provided.
Field α (J2000) δ (J2000) Exp[O iii] Expg SFWHM m5007,lim
(h:m:s) (◦ :0 :00 ) (s) (s) (00 ) (mag)
36_4 00:45:51.9 43:24:20.5 4 × 261 3 × 100 0.97 26.08
36_3 00:40:14.7 43:24:23.7 4 × 261 3 × 100 0.95 26.26
35_5 00:51:18.0 42:21:48.2 4 × 261 4 × 100 0.85 26.30
35_4 00:45:48.0 43:23:02.4 8 × 261 5 × 100 0.64 26.40
35_3 00:40:17.2 42:23:05.6 4 × 261 6 × 100 0.66 26.17
35_2 00:34:45.9 42:21:57.6 4 × 261 3 × 100 0.68 26.12
34_5 00:51:09.5 41:20:18.6 4 × 261 3 × 100 0.90 26.26
34_4 00:45:44.1 41:21:18.7 5 × 261 3 × 100 0.85 26.16
34_3 00:40:18.7 41:21:21.6 4 × 261 3 × 100 0.92 25.93
34_2 00:34:53.3 41:20:27.6 6 × 261 9 × 100 0.47 26.02
33_5 00:51:02.7 40:18:41.6 4 × 261 3 × 100 0.77 25.94
33_4 00:45:41.3 40:19:48.0 4 × 261 3 × 100 0.76 25.64
33_3 00:40:20.9 40:19:50.8 4 × 261 3 × 100 0.84 25.89
33_2 00:35:00.6 40:18:57.6 4 × 261 3 × 100 0.54 25.90
32_4 00:45:39.0 39:18:16.9 4 × 261 3 × 100 0.60 26.13
32_3 00:40:25.1 39:18:26.8 4 × 261 3 × 100 0.59 26.10
to pixels which are more reliable compared to their local back-
grounds. For each field, the exposures corresponding to the on-
band image and those corresponding to the off-band image are
then combined using SWARP3 (Bertin et al. 2002) to produce
the respective on-band and off-band images. The exposures are
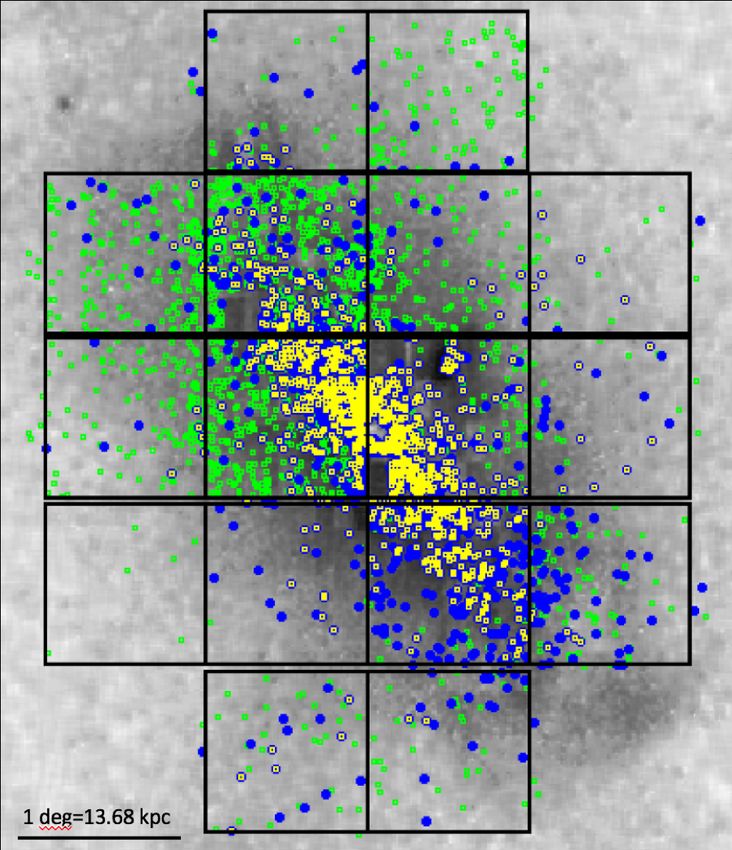
Fig. 1. The fields observed with CFHT MegaCam shown in blue, la- combined using median-type combination in conjunction with
beled with their observation ID. North is up, east is left. The background their respective weight maps, while a background subtraction is
image is from SDSS obtained using the Aladin Sky Atlas (Bonnarel carried out with a background mesh size of 25 pixels. The im-
et al. (2000)). ages thus obtained are used for source extraction.
ure 1. The observations were carried out, with photometric con- 3. Selection of PNe candidates and catalog
ditions, during two runs: October 9-11 and November 6-7, 2016. extraction
Over the course of the observations, seeing varied between 0.500
and 1.100 while the airmass varied between 1.03 and 1.48. Having a bright [O iii] 5007 Å and no continuum emission, extra-
M31 is observed through a narrow-band [O iii] filter (λc = galactic PNe can be identified as objects detected in the on-band
[O iii] image which are not detected in the off-band continuum
5007 Å, ∆λ = 102 Å, on-band) and a broad-band g-filter
images, or have an excess [O iii] - g colour. Additionally, PNe
(λc = 4750 Å, ∆λ = 1540 Å, off-band). The photometry is cal- are typically unresolved at extragalactic distances from ground-
ibrated with observations of spectrophotometric standard stars. based observations and so we only considered point-like objects
Each on-band image generally consists of 4 dithered exposures for analysis. We used the automatic selection procedure devel-
with a total exposure time of 1044 s and each off-band image oped and validated in Arnaboldi et al. (2002, 2003), which has
of 3 dithered exposures with a total exposure time of 300 s. For been optimized for large imaging surveys by Longobardi et al.
some fields there are more dithered images for both on-band and (2013) and Hartke et al. (2017).
off-band, leading to higher exposure times. A summary of the
field positions and exposure times for the on-band and off-band
exposures is presented in Table 1. The exposure time was cho- 3.1. Source extraction
sen such that PNe with an apparent narrow-band magnitude of
6 mag from the bright cut-off m5007 = 20.2 mag, in the m5007 We used SExtractor (Bertin & Arnouts 1996), a source detec-
system described by Jacoby (1989), can still be detected. tion algorithm that detects and measures flux from point-like
and extended sources, to detect and carry out photometry of the
sources on the images. For each field, we measure the narrow-
2.2. Data reduction band and broad-band magnitudes, mn and mb , in dual-image
mode for sources detected on the narrow-band image. The broad-
The data are pre-processed using the Elixir1 pipeline (Magnier & band magnitudes were extracted in the same apertures as on the
Cuillandre 2004), which accomplishes the bias, flat, and fringe narrow-band image. Sources were detected in the narrow-band
corrections and also determines the photometric zero point of the image requiring that 25 adjacent pixels or more have flux values
observations. The zero points for the [O iii] and g-band frames in 1.2 × σ rms above the background. Local backgrounds were cal-
AB magnitudes, normalised to a 1 s exposure, are Z[O iii] = 23.434 culated for the detected sources on apertures having a width of
and Zg = 26.5. For every observed field, a weight-map is com- 25 pixels. and magnitudes were measured with different aper-
puted corresponding to each exposure using WeightWatcher2 tures having widths of 15, 17, 19 and 21 pixels. Magnitudes
(Marmo & Bertin 2008). This is used to assign higher weights were also measured with an aperture having a width of 5 pix-
els corresponding to the core of the sources mcore . Sources for
1
http://www.cfht.hawaii.edu/Instruments/Elixir/home.html
2 3
http://www.astromatic.net/software/weightwatcher http://www.astromatic.net/software/swarp
Article number, page 3 of 19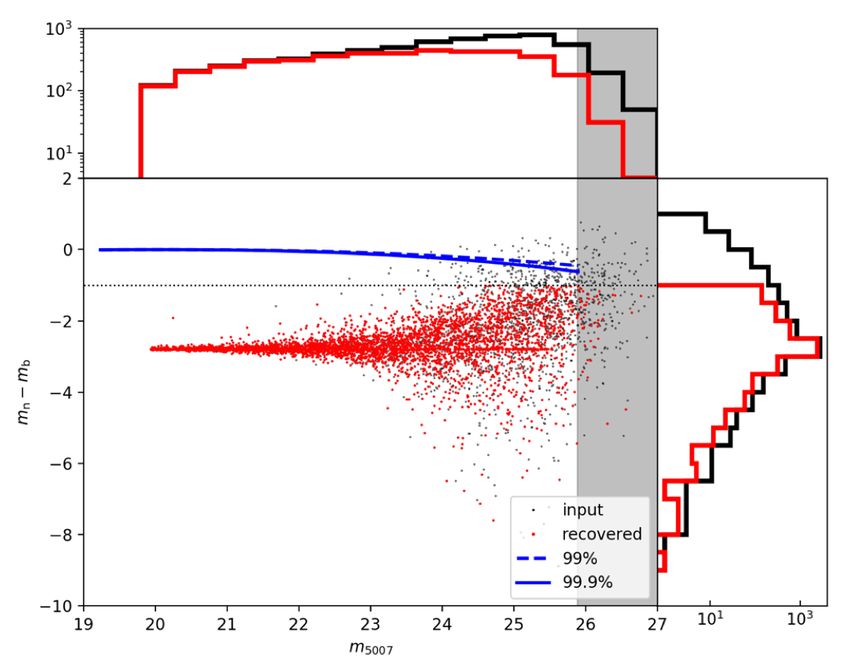
A&A proofs: manuscript no. draft_arxiv

                                                                           Fig. 4. The CMD showing the synthetic continuum sources and the 99%
                                                                           and 99.99% limits on their positions for a single field. The region be-
Fig. 2. The effective survey area is shown in black. CCD edges and         yond the limiting magnitude of this field is shown in grey.
noisy or saturated regions have been masked.

                                                                           then extracted. The magnitude aperture most suited to recover-
                                                                           ing the simulated sources is found to be 15 pixels as detailed in
                                                                           Sect A.4. The limiting magnitude is defined as the magnitude
                                                                           at which the recovery fraction of the simulated sources drops
                                                                           below 50% (Figure 3). This limiting magnitude varies between
                                                                           m5007 = 25.64, for the shallowest observed field, Field# 33_4, to
                                                                           m5007 = 26.4, for the deepest observed field, Field# 35_4. The
                                                                           limiting magnitude is provided for each field in Table 1.

                                                                           3.3. Colour selection
                                                                           We selected PNe candidates based on their position on the m5007
                                                                           versus mn − mb CMD. These are sources with a colour excess
                                                                           mn − mb < −1 that are brighter than the limiting magnitude. The
                                                                           colour excess corresponds to an equivalent width EWobs = 110
                                                                           Å (Teplitz et al. 2000) and was chosen in order to limit contami-
Fig. 3. The recovery fraction of simulated sources for a single field to   nation from background galaxies.
illustrate the limiting magnitude at the 50% completeness limit.               Sources which do not have an excess in mn − mb are classi-
                                                                           fied as continuum sources. However, some colour excess maybe
                                                                           seen for some of these sources during the source extraction from
which a broad-band magnitude could not be detected at the po-              the images, especially for those with fainter magnitudes. We thus
sition of the [O iii] detection were assigned a mb correspond-             simulated the same synthetic point-like population onto the off-
ing to 1 × σ rms above the background in the broad-band im-                band image and checked their position on the extracted m5007
age, similar to Arnaboldi et al. (2002). The narrow-band mag-              versus mn − mb CMD (Figure 4). We calculate the 99% and
nitude, mn , in the AB system is converted to the m5007 system             99.99% limits on their positions in the CMD, below which the
as: m5007 = mn + 2.27. Refer to Sect A.1 for details. The central          probability of detecting continuum sources was reduced to the
part of our survey covering part of the bulge of M31 are mostly            1% and 0.01% level respectively. Sources with colour-excess
saturated. In some observed fields, a few CCDs were noisy. Such            within the 99.99% limit are also discarded as possible PNe.
noisy regions and CCD edges, affected by dithering and satura-
tion, were masked as detailed in Sect A.3. The effective survey
area is shown in Figure 2.                                                 3.4. Point-like selection
                                                                           PNe are typically unresolved point-like objects at extragalac-
3.2. Limiting magnitude                                                    tic distances and to differentiate them from extended ones (e.g.
                                                                           background galaxies or other extended objects with strong [O iii]
In order to determine the limiting magnitude of our sample                 emission), we analyze the light distribution of the simulated
for each field, we simulated a synthetic point-like population             sources, as described in Section 3.2, on the on-band image. For
onto the on-band image (with its corresponding exposure time               each field, we use the half-light radius of the simulated sources,
and zero-point) using the Image Reduction and Analysis Facil-              Rh , the radius within which half of the object’s total flux is
ity (IRAF4 ) task mkobjects. The synthetic population follows a            contained, to determine its upper limit, Rhmax , corresponding
PNLF as detailed in Ciardullo et al. (1989) and the sources have           to 95%-percentile of the simulated population. We considered
a Moffat PSF profile as detailed in Sect A.2. The sources are              sources as point-like if they satisfied the following two crite-
                                                                           ria: these sources (i) have a half-light radius such that 1 < Rh
4
    http://iraf.noao.edu/                                                  < Rhmax , and (ii) they fall in the region where the difference be-
Article number, page 4 of 19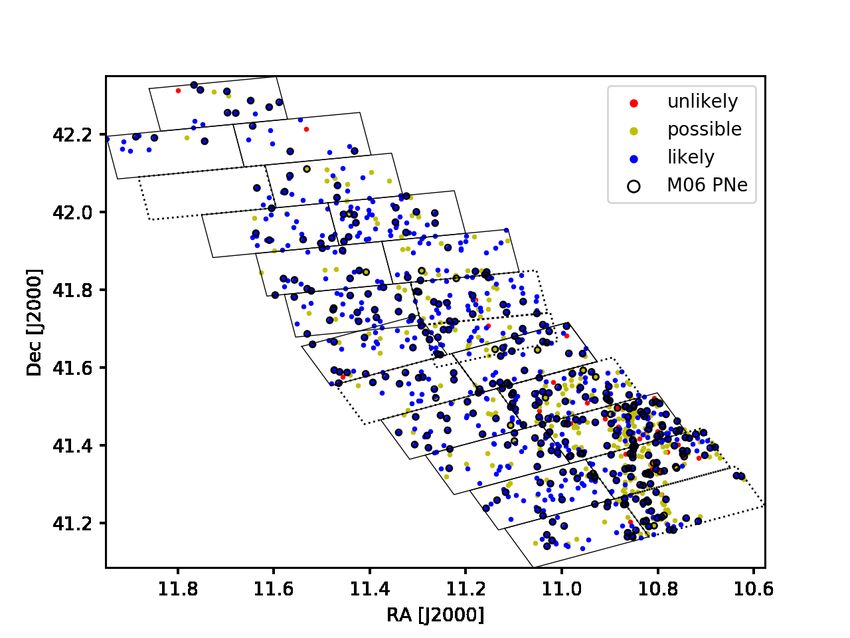
Souradeep Bhattacharya et al.: The survey of PNe in M31 I - Imaging

                                                                             ter, the bright PNe are expected to show some remnant flux in
                                                                             the broad-band as well. This remnant broad-band flux is in the
                                                                             ratio of the filter widths and leads to nearly a constant colour
                                                                                                          ∆λ
                                                                             excess, mn − mb = 2.5log( ∆λ[Ogiii] ) = −2.95, for the bright PNe.
                                                                             The observed constant colour excess is slightly less negative due
                                                                             to the flux contributed to the broad-band from the [O iii] 4959
                                                                             Å line which is expected to be ∼ 1/3 of the brightness of the
                                                                             [O iii] 5007 Å line in PNe, as seen in Figure 6. The final catalog
                                                                             of confirmed PNe is then checked for spurious sources by eye.
                                                                             Regions of spurious sources, typically caused by saturated stars,
                                                                             are masked and the final catalog of confirmed PNe is obtained
                                                                             for each field. Counting the PNe identified in the overlapping re-
                                                                             gions of adjacent fields only once, we identify an unprecedented
                                                                             4289 PNe in M31 in our survey. Their spatial distribution, over-
                                                                             laid on a map of RGB stars identified by the PAndAS survey,
                                                                             is shown in Figure 7. Our survey is uniformly complete (in the
Fig. 5. [Top] The difference between mn and mcore for all sources in
black and those within the 95%-limits of the simulated population in         effective survey area) down to m5007 = 25.64 which is the 50%
red for the simulated population (left) and as applied to the real sources   completeness limit of the shallowest field (Field# 33_4). How-
(right) for a single field. [Bottom] Same as the top panel but for half-     ever photometric depth varies with fields and we find PNe down
light radius, Rh .                                                           to m5007 = 26.4 for the deepest field (Field# 35_4).

                                                                             3.6. Completeness correction
                                                                             Our color and point-like selection criteria would exclude a num-
                                                                             ber of PNe which are affected by photometric errors especially
                                                                             in the fields covering the bright M31 disk. Thus, in order to de-
                                                                             termine the selection completeness of our extracted sample, we
                                                                             follow the procedure outlined in Longobardi et al. (2013) and
                                                                             Hartke et al. (2017). We simulated a population of 104 point-like
                                                                             sources (Sect 3.2) on to the narrow-band image. On the broad-
                                                                             band image, we also simulate sources at the same positions with
                                                                             their fluxes scaled down by the ratio of the filter widths5 . We
                                                                             then use SExtractor in dual-mode to simultaneously extract mn
                                                                             and mb of these simulated sources. Figure 8 shows the CMD
Fig. 6. The CMD for a single field showing all the detected sources          of the simulated population for a single field. The colour ex-
(brighter than the limiting magnitude) in black, the colour-selected         cess remains nearly constant for the bright simulated sources,
sources in blue and identified PNe in red. The 99% and 99.99% limits         as expected from the ratio of their filter widths, but many are
for the continuum sources are shown in blue while the region beyond
                                                                             missed at fainter magnitudes. We can thus determine the selec-
the 50% completeness limit is shown in grey. The histogram (in loga-
rithmic scale) shows clearly the number of PNe recovered as a function       tion completeness of the simulated population at different mag-
of colour with all the detected sources (brighter than the limiting mag-     nitude ranges for each field. To a single candidate extracted in a
nitude) in black, the colour-selected sources in blue and identified PNe     given field, we assign the value of the selection completeness
in red.                                                                      at that magnitude as a probability of being detected after the
                                                                             selection effects. We also compute the detection completeness
                                                                             of the simulated population at different magnitude ranges from
tween mn and mcore , magnitude of the source for flux within an              the recovery fraction and similarly assign a detection probability
aperture of 5 pixels, is within the 95%-limits of the simulated              to each PN candidate extracted in each field. The completeness
population. The point-like selection criteria are shown in Fig-              correction is thus obtained from both the selection and detection
ure 5, as applied to the colour-selected simulated population and            probability. It is further detailed in Sect A.5.
to the real sources.
    In order to estimate the number of continuum sources that
may be misidentified as PNe in any field, we count the number                3.7. Comparison with Merrett et al. (2006) PNe catalog
of point-like continuum sources (excluded as PNe by the colour               We identify those sources in our PNe catalog that have a coun-
selection criteria) and multiply by 0.01%. We estimate that in               terpart in the catalog of PNe identified by M06 by matching
each field, our identified PNe sample may be contaminated by                 them spatially within a 300 aperture (Figure 9). The astrometry
2-4 continuum sources which lie in the faint magnitudes > 25.                of the M06 sample is reliable up to 300 (Veyette et al. 2014). We
                                                                             match 1099 such sources (in yellow in Figure 7). The narrow-
3.5. PNe catalog                                                             band magnitudes of the matched PNe in our survey are 0.045
                                                                             mag brighter than the corresponding value in M06, well-within
For each field, the [O iii] sources that are brighter than the lim-          the photometric uncertainty of the M06 sample. We thus vali-
iting magnitude and fulfill both the point-like and colour selec-            date the [O iii] 5007 Å photometry of our PNe with the sample
tion criteria are considered as PNe candidate. They are shown
in the CMD in Figure 6 for a single field. Since the bandwidth               5
                                                                               We neglect the contribution from the [O iii] 4959 Å line in the broad-
of the broad-band filter also covers that of the narrow-band fil-            band image.

                                                                                                                       Article number, page 5 of 19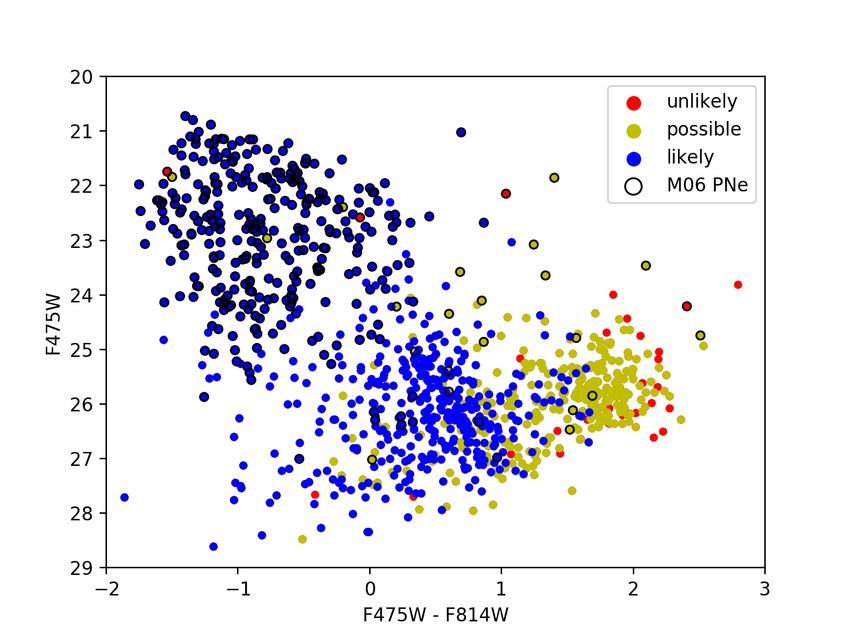
A&A proofs: manuscript no. draft_arxiv

Fig. 7. The PNe identifed by the survey (blue - PNe brighter than m5007 = 25.64 which is the 50% completeness limit of the shallowest field (Field#
33_4), green - PNe with fainter than m5007 = 25.64 with photometric depth varying with field) are overlaid on the map of RGB stars identified by
the PAndAS survey. The M06 PNe re-identified by our survey are shown in yellow. North is up, east is left.

of M06. The photometry of the M06 PN sample is not very ac-                and obtain an accurate PSF to identify PNe in M31. The H ii re-
curate for fainter sources. This is because the PN.S instrument            gions would appear as extended objects and discarded as PNe by
used by M06 has not been optimized for photometry measure-                 our point-like selection. We investigate the contamination of our
ments but rather for the measurement of radial velocities.                 PNe catalog by H ii regions in the next section and further dis-
                                                                           cuss it in Section 7.1. Thus the 82.22% recovery fraction of the
    While we find most of the PNe found by M06 in the observed             M06 PNe is driven by the tighter morphological constraints on
fields, we miss quite a few in the regions masked by us, mainly            the light distribution of the detected [O iii] sources in our survey.
in the crowded bulge and the CCD edges. In our survey area, we             Since the limiting magnitude of our survey is 1.5-2 mag fainter
recover 82.22% of the M06 PNe. Up to 25% of the M06 PNe                    than that of M06, we find a much larger number of new PN can-
candidates were actually H ii regions in the M31 disk (Veyette             didates in the overlapping area.
et al. 2014). The spatial resolution of MegaCam bolstered by the
favourable seeing allows us to improve upon the image quality
Article number, page 6 of 19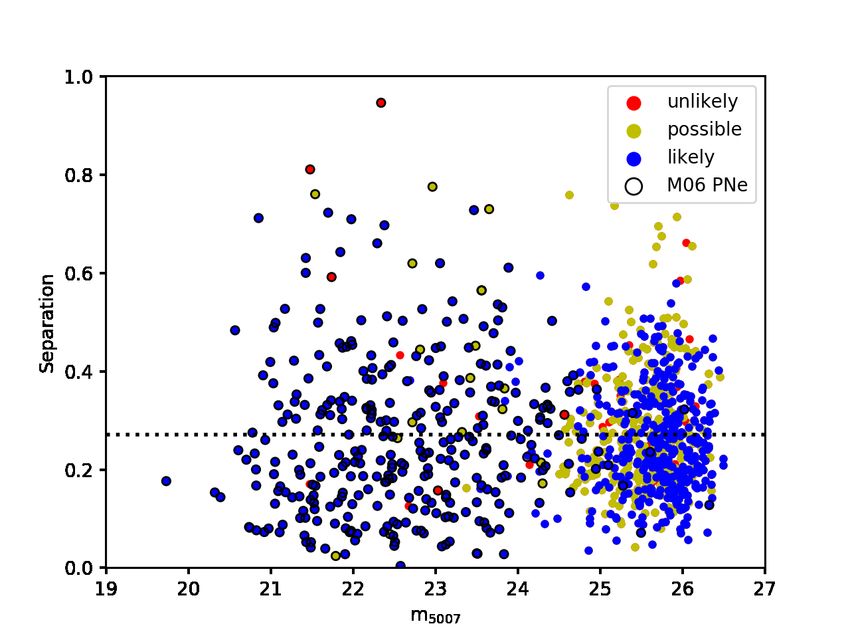
Souradeep Bhattacharya et al.: The survey of PNe in M31 I - Imaging

                                                                           Fig. 10. The ZPN of the PHAT-matched PNe plotted against m5007 . The
Fig. 8. The CMD for a single field showing all the simulated sources       “likely”, “possible” and “unlikely” PNe have been shown in blue, yel-
in black and those recovered as PNe in red (See Section 3.6). The 99%      low and red respectively. The PNe previously found by M06 have been
and 99.99% limits for the continuum sources are shown in blue while        encircled in black.
the region beyond the limiting magnitude is shown in grey. The dot-
ted black line shows the colour selection adopted to limit contamination
from background galaxies. The histograms (in logarithmic scale) show
the number of PNe recovered as a function of colour (right) and mag-
nitude (top) with the simulated sources in black and those recovered as
PNe in red.

                                                                           Fig. 11. The spatial distribution of the PHAT-matched PNe in the PHAT
                                                                           footprint. The solid bricks are those previously analyzed by Veyette
                                                                           et al. (2014) while the dashed ones have been analyzed here for the first
                                                                           time. The “likely”, “possible” and “unlikely” PNe have been shown in
                                                                           blue, yellow and red respectively. The PNe previously found by M06
                                                                           have been encircled in black.

Fig. 9. The difference between the narrow-band magnitudes of this work
and M06 obtained for the matched sources, plotted against m5007 . The
                                                                           4.1. The Panchromatic Hubble Andromeda Treasury (PHAT)
red dashed line corresponds to the mean offset. The region beyond the      The Panchromatic Hubble Andromeda Treasury (PHAT6 ) sur-
limiting magnitude of the shallowest field (Field# 33_4) is shown in
grey. The grey dotted line shows the 90% completeness limit of the
                                                                           vey, covers ∼ 1/3 of the star-forming disk of M31 in six bands
shallowest field.                                                          from the near-UV to the near-IR using HST’s imaging cameras
                                                                           (WFC3/IR, WFC3/UVIS, and ACS/WFC cameras). It combines
                                                                           the wide-field coverage typical of ground-based surveys with
                                                                           the precision of HST observations. The overall survey strategy,
                                                                           initial photometry and data quality (DQ) assessments were de-
4. Counterparts in HST imaging                                             scribed in detail in Dalcanton et al. (2012). We utilize the second
                                                                           generation of photometric measurements of the resolved stars in
To test the image quality of our PNe survey, and to estimate               the PHAT imaging (Williams et al. 2014), which takes advantage
the possible contamination from H ii regions and other sources,            of all available information by carrying out photometry simulta-
we identified PNe counterparts in the HST data available from              neously in all six filters, resulting in a significant increase in the
the Panchromatic Hubble Andromeda Treasury (Dalcanton et al.
                                                                           6
2012) covering a portion of the M31 disk.                                      https://archive.stsci.edu/prepds/phat

                                                                                                                       Article number, page 7 of 19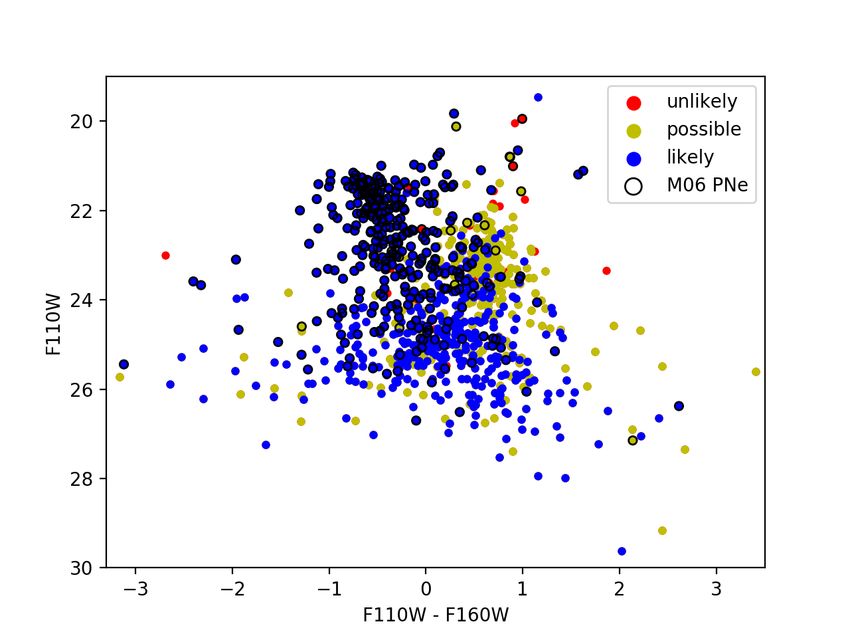
A&A proofs: manuscript no. draft_arxiv

Fig. 12. True colour images of PHAT-matched PNe. F814W, F475W, and F336W were used for the red, green, and blue images respectively. One
“likely” (left), “possible” (center) and “unlikely” (right) PN has been shown. The circle denotes 0.500 around the PN position.

depth and accuracy the photometry over that presented in Dal-
canton et al. (2012).

                                                                         Fig. 14. The F475W mag of the PHAT-matched PNe plotted against its
                                                                         m5007 . The dashed line shows their relation described by Veyette et al.
                                                                         (2014). The “likely”, “possible” and “unlikely” PNe have been shown
                                                                         in blue, yellow and red respectively. The PNe previously found by M06
Fig. 13. The positional separation between the PNe and their PHAT
                                                                         have been encircled in black.
counterpart plotted against m5007 . The dashed line shows the mean po-
sitional separation. The “likely”, “possible” and “unlikely” PNe have
been shown in blue, yellow and red respectively. The PNe previously
found by M06 have been encircled in black.                               files whose square of the sharpness parameter in the F475W fil-
                                                                         ter is below 0.2, to avoid cosmic rays and extended objects. The
                                                                         selection is done on the basis of the following parameters: 1. Dif-
                                                                         ference between F475W mag and the F475W mag expected from
4.2. Finding PNe counterparts in PHAT                                    the m5007 using the relation described by Veyette et al. (2014); 2.
Veyette et al. (2014) conducted a search for M06 PNe counter-            The F475W − F814W colour; 3. The positional separation be-
parts in 16 of the 23 bricks in the PHAT footprint. They find that       tween the PNe and the PHAT counterpart; 4. The roundness of
∼ 25% of the PNe identified by M06 in the M31 disk are either            the PSF. To automatically select candidates on the basis of the
H ii regions resolved in HST or stellar contaminants. They uti-          above parameters, we construct an initial training set with the
lized the photometry presented in Dalcanton et al. (2012). They          PNe in common with Veyette et al. (2014). We calculated the
found a linear relation between the M06 m5007 magnitude and              average value (X̄PN ) and 1σ spread (σPN ) of each identification
the PHAT F475W magnitude given by:                                       parameter. We found that the separation is within 0.700 . For ev-
                                                                         ery PNe, the differences between the training set (X̄PN ) and the
F475W = −0.2240 + 1.0187 × m5007                                  (2)    source (Xs ) parameter values were normalized by the σPN of the
                                                                         parameter values for each source in PHAT within 100 of our PNe
We adopt a similar method to identify PHAT counterparts to our           location. These normalized parameters are of the form:
PNe in the entire PHAT footprint. However, we search for our
counterparts in the updated PHAT photometry from Williams
et al. (2014). We only consider those sources from the v2 star           Zx =   |Xs −X̄PN |
                                                                                   σPN                                                       (3)
Article number, page 8 of 19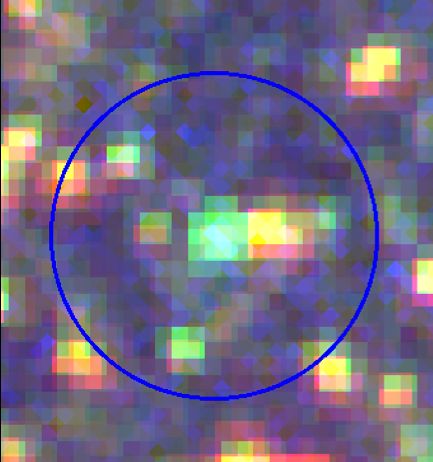
Souradeep Bhattacharya et al.: The survey of PNe in M31 I - Imaging

Fig. 15. The F475W mag of the PHAT-matched PNe plotted against
its F475W − F814W colour. The “likely”, “possible” and “unlikely”
PNe have been shown in blue, yellow and red respectively. The PNe
previously found by M06 have been encircled in black.

We obtain the sum of these normalized parameters, with half the                Fig. 16. The PNe are shown spatially divided into elliptical bins con-
weight given to roundness, as the merit function ZPN .                         taining equal number of PNe brighter than the 50% completeness limit
        ZF475W +Zcolour +Zsep +0.5×Zround                                      of the shallowest field (Field# 33_4).
ZPN =                  3.5                                              (4)
For each PNe, the PHAT source with the lowest value of the ZPN                 F475W mag with the F475W − F814W colour (Figure 15) shows
is considered as the counterpart. The distribution of the assigned             that most of the faint sources that are classified as “possible” and
ZPN with the m5007 of the PHAT-matched PNe is shown in Fig-                    “unlikely” have a larger F475W − F814W colour. The disper-
ure 10. Thresholds in ZPN are used to classify the PNe based                   sion in F475W mag and the larger colour for some of the faint
on the ZPN assigned to those PHAT sources which were not PNe                   sources may be due to the [O iii] 5007 Å line not being as promi-
counterparts. PNe with ZPN < 1.5 are classified as “likely”, those             nent compared to the continuum flux in F475W for the fainter
with 1.5 < ZPN < 2 are classified as “possible” and those with                 PNe.
ZPN > 2 are classified as “unlikely”. The “likely” PHAT sources
have a significantly lower ZPN than that of other PHAT sources in
the search region, but those which are “possible” do not stand out             5. Planetary Nebula luminosity-specific frequency
quite so much. Those classified as “unlikely” may not be PNe at
all as stellar PHAT sources can have ZPN ∼ 2 even though most                  The PNe population follows the sampled (bolometric) luminos-
of them have ZPN > 4. The spatial distribution of PHAT PNe                     ity of its parent stellar population. The PN luminosity-specific
counterparts is presented in Figure 11.                                        frequency (α-parameter; Jacoby 1980) is the ratio of the total
                                                                               number of PNe, NPN , to the total bolometric luminosity of the
                                                                               parent stellar population, Lbol , given by:
4.3. Characteristics of the PHAT-matched PNe
Of the 1023 PNe in the PHAT footprint, 700 are classified as                   α=   NPN
                                                                                    Lbol   = BτPN                                                (5)
“likely”, 292 as “possible” and 31 as “unlikely”. True colour im-
ages of three PNe, one of each classification, is shown in Fig-                where B is the specific evolutionary flux (stars yrs−1 L−1 ) and
ure 12. None of the PHAT PNe are resolved as H ii regions.                     τPN is the PN visibility lifetime (Buzzoni et al. 2006). The α-
The 31 “unlikely” PNe (∼3% of the PHAT PNe) maybe stel-                        parameter value provides the number of PNe expected per unit
lar contaminants. Of the H ii regions spectroscopically identified             bolometric light. We determine the radial PN number density
by Sanders et al. (2012), 81 are present in the PHAT footprint.                profile and by comparison with the stellar surface brightness
Many of these were misidentified by M06 as PNe. We misiden-                    profile of M31, derived from broad-band photometric studies,
tify only 3 of these H ii regions, probably compact H ii regions,              we compute the α-parameter value, similar to the procedure fol-
as PNe which is a testament to the photometric quality and im-                 lowed for M87 (Longobardi et al. 2013) and M49 (Hartke et al.
proved spatial resolution of our survey.                                       2017).
    The mean positional separation of our PNe and their PHAT
counterparts is 0.2700 which is testament to the accurate astrom-              5.1. The radial PN number density profile
etry of the image and the Elixir pipeline greatly benefiting our
survey. Figure 13 shows the variation in separation with m5007 .               Figure 16 shows the distribution of PNe on the sky together with
The separation remains largely uniform throughout the range of                 15 elliptical bins aligned using the known position angle, PA =
m5007 . The correlation between m5007 and the PHAT F475W mag                   38◦ of M31 and its ellipticity = 0.73 (Walterbos & Kennicutt
is also seen for our PNe (Figure 14) although there is larger dis-             1988). The binning has been chosen such that each bin contains
persion at the faint end. Similarly the variation of the the PHAT              the same number of PNe brighter than m5007 = 25.64, which
                                                                                                                        Article number, page 9 of 19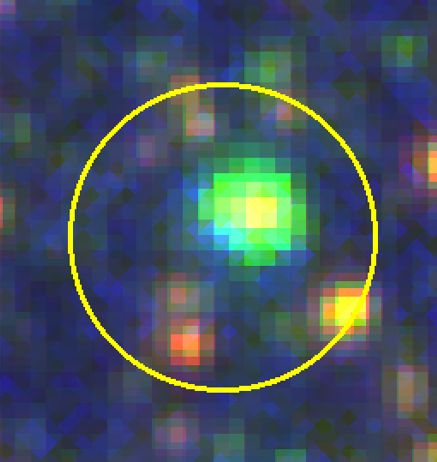
A&A proofs: manuscript no. draft_arxiv

Fig. 17. The radial surface brightness profile of M31 (Irwin et al. 2005)    Fig. 18. The α2.5 values obtained at different elliptical bins are shown
is shown in black while the PN density, using only the PNe within 2.5        in blue. The dotted black line and the dashed black line show the
mag of the bright cut-off, obtained at different elliptical bins are shown   bulge-disk transition and the disk-halo transition respectively from the
in blue. The Courteau et al. (2011) decomposition of the M31 lumi-           Courteau et al. (2011) decomposition of the M31 luminosity profile.
nosity profile into the bulge, disk and halo components, scaled to the
V-band surface brightness profile are also shown. The three-component
photometric model for the predicted PN surface density is shown in           5.2. The PN luminosity-specific number – the α-parameter
blue.
                                                                             We can compute the value of α for the observed M31 PNe from
                                                                             µ0 using the following relation:
is the 50% completeness limit of the shallowest field (Field#
33_4). These bins correspond to 0.65-26.13 kpc radial distances              α=    1
                                                                                   s2
                                                                                      100.4(µ0 −K−(BC −BCV ))                                             (8)
projected on the minor axis of M31, Rmin . The PN logarithmic                where the K = 26.4 mag arcsec is the V-band conversion fac-
                                                                                                                     −2
number density profile is defined as:                                        tor to physical units L pc−2 and BC = −0.07 is the solar bolo-
µPN (r) = −2.5log10 ΣPN (r) + µ0                                      (6)    metric correction. s = D/206265 is a scale factor related to the
                                                                             galaxy distance D. A fixed value of BCV = 0.85 can be assumed
where µ0 is a constant in order to match the PN number den-                  with 10% accuracy based on the study of stellar population mod-
sity profile with the stellar surface brightness profile and ΣPN is          els for different galaxy types (irregular to elliptical, see Buzzoni
the completeness-corrected PN number density which is in-turn                et al. 2006).
given by:                                                                        For the PNe within 2.5 mag of the bright cut-off, we obtain
            NPN,corr (r)                                                     α2.5 = (40.55 ± 3.74) × 10−9 PN L−1,bol . For a PN population
ΣPN (r) =     A(r)                                                    (7)
                                                                             following the PNLF described by Ciardullo et al. (1989), this
NPN,corr is the completeness-corrected PN number in any ellip-               corresponds to a logα = log(α2.5 /0.1) = −6.39 ± 0.04 and τPN =
tical bin. The completeness correction accounts for both detec-              (22527.78 ± 207.78) yr (based on relations described in Buzzoni
tion and colour incompleteness, detailed in Sect A.5. A(r) is the            et al. 2006). M06 obtained α2.5 = (15 ± 2) × 10−9 PN L−1,bol
observed area in any elliptical bin. We obtain the density pro-              but only within 1.8 kpc of the minor-axis radius. Scaling our
file using only the PNe within 2.5 mag of the bright cut-off                 PN number density profile to the surface brightness profile only
(m5007 < 22.56). The resulting PN density profile in each el-                within this interval, we find µ0 = 10.33 ± 0.01 corresponding to
liptical bin is matched to the V-band surface brightness profile,            α2.5 = (20.16±1.87)×10−9 PN L−1,bol which is closer to the value
obtained by Irwin et al. (2005) using photometry and number                  obtained by M06. This may be due to the bulge, disk and halo
counts along the minor-axis of M31. It is shown in Figure 17.                components of M31 having differing α-parameter values.
We compute µ0 = 11.085 ± 0.004. Courteau et al. (2011) decom-
posed the M31 luminosity profile into the bulge, disk and halo
components finding that the halo component becomes signifi-                  5.3. A three-component photometric model for M31
cant from Rmin ∼ 8 kpc and it dominates the luminosity profile               Longobardi et al. (2013) and Hartke et al. (2017) also saw differ-
over the disk from Rmin ∼ 11 kpc. The PN density profile fol-                ences in the α-parameter values associated with different com-
lows the surface brightness profile from Rmin ∼ 2 − 8 kpc, where             ponents of the surface brightness profile, although they looked
the disk dominates the luminosity profile. The M31 B-V colour,               at halo and Intra-group light components. Similar to their pro-
available out to Rmin ∼ 10 kpc, shows a gradient towards bluer               cedure, we describe a photometric model for the predicted PN
colour at larger radii (Walterbos & Kennicutt 1988; Tempel et al.            surface density as:
2010). We find a flattening of µPN with respect to the observed
surface brightness profile at larger radial distances. This corre-           ΣPN (r) = (α2.5,bulge Ibulge (r) + α2.5,disk Idisk (r) + α2.5,halo Ihalo (r))s2
                                                                             e
lates with the B-V colour gradient and the increasing dominance
                                                                                                                                                           (9)
of the halo component in the light-profile. Additionally, the light
from the inner-halo substructures is underestimated by the sur-              where α2.5,bulge , α2.5,disk and α2.5,halo are the α2.5 values associ-
face brightness profile obtained along the minor-axis of M31 at              ated with the bulge, disk and halo components of M31 respec-
larger radii. This may also lead to a flattening of µPN .                    tively. Ibulge , Idisk and Ihalo are the surface brightness profiles of
Article number, page 10 of 19
Souradeep Bhattacharya et al.: The survey of PNe in M31 I - Imaging
Fig. 19. The completeness-corrected PNLF for the whole catalog of Fig. 20. The completeness-corrected cumulative PNLF (binned for vi-
M31 PNe is shown fitted by both the generalised analytical formula sual clarity) for the whole catalog of M31 PNe is shown fitted by both
(in orange) and the Ciardullo et al. (1989) analytical LF (in blue).The the generalised analytical formula for the cumulative PNLF (in orange)
region beyond the limiting magnitude of the shallowest field (Field# and the cumulative PNLF corresponding to the Ciardullo et al. (1989)
33_4) is shown in grey. The grey dotted line shows the 90% complete- analytical formula (in blue). The region beyond the limiting magnitude
ness limit of the shallowest field. of the shallowest field (Field# 33_4) is shown in grey. The grey dotted
line shows the 90% completeness limit of the shallowest field.
the bulge, disk and halo components of M31 respectively as per
the Courteau et al. (2011) decomposition of the M31 luminos- of M31. The radial variation of the α-parameter values found by
ity profile into the bulge, disk and halo components, scaled to M06 also showed an slight increasing trend within the errors at
the V-band surface brightness profile observations by Irwin et al. larger radii. However, for the furthest radial bin in Figure 18, the
(2005). minor axis surface brightness profile may be underestimating the
We simultaneously fit the different α-parameter values of the light from the known inner halo substructures of M31 primarily
photometric model to the observed PN surface density to obtain found along the disk major-axis. This may also be contributing
α2.5,bulge = (5.28 ± 6.25) × 10−9 PN L−1,bol , α2.5,disk = (39.16 ± to the large α2.5,halo value. More accurate surface brightness pro-
file measurements need to be performed in order to quantify the
3.33) × 10−9 PN L−1,bol and α2.5,halo = (273.89 ± 41.31) × 10−9 contribution of substructures to the minor axis surface brightness
PN L−1,bol . The model is also shown in Figure 17. While the profile of M31.
α2.5,bulge is not very well constrained, we find the α2.5,disk is quite
close to the α2.5 obtained for the whole PN sample which is
expected since the surface brightness profile of M31 is domi- 6. Planetary Nebula Luminosity Function
nated by the disk component in our survey. We also find that For different galaxies, the generalised analytical formula for the
the α2.5,halo ∼ 7α2.5,disk . The observed variation in α-parameter PNLF introduced by Longobardi et al. (2013) is:
values in different galaxies that spans almost 2 orders of mag-
∗
nitude is studied by Buzzoni et al. (2006) who show that late- N(M) = c1 ec2 M (1 − e3(M −M)
) (10)
type spiral and irregular galaxies, with bluer B-V colours, are
expected to have larger α-parameter values than the redder early- where c1 is a normalisation constant, c2 is the slope at the faint
type galaxies. Their analysis is based on population synthesis end, and M ∗ is the absolute magnitude of the LF’s bright cut-off.
models of galaxies with different ages, metallicities and mor- The Ciardullo et al. (1989) analytical LF is then a specific case
phological types. The different stellar populations in these galax- of the generalised analytical formula with c2 = 0.307 that repro-
ies thus exhibit very different α-parameter values. Hartke et al. duces their best fit to the PNLF of M31. Observations suggest
(2017) also found that α-parameter values for the intra-group that the slope described by the parameter c2 is correlated with the
light of M49 is 3 times larger than that of its halo. Hartke et al. star formation history of the parent stellar population (Ciardullo
(2018) later confirmed that the halo PNe and intra-group light et al. 2004; Ciardullo 2010; Longobardi et al. 2013; Hartke et al.
PNe were kinematically different corresponding to two separate 2017). In order to ascertain the robustness of the morphology of
parent stellar populations. We can hence infer that the larger α- the PNLF at magnitude ranges not reached before, we investi-
parameter value of the bluer halo of M31 may indicate that the gate the M31 PNLF from our survey with different independent
stellar population of the inner halo is different from that the disk. methods.
While the bluer halo is thus expected to have a higher α2.5 than
the disk, its absolute value measured for the M31 halo is the
6.1. PNLF of M31
highest observed in any galaxy.
We also obtain the radial variation of the α-parameter val- The PNLF is corrected for detection completeness and also for
ues (Figure 18) by scaling the PN number density individually selection completeness due to the colour and point-like selec-
in each elliptical bin, which shows an increase at larger radii. tion, detailed in Sect 3.6. Figure 19 shows the PNLF of M31
The increasing trend in the α-parameter values is a direct con- for all the PNe identified by our survey, fitted by the generalised
sequence of the flattening of µPN , given the B-V colour gradient analytical formula with c2 = 0.279 ± 0.024, which agrees well
Article number, page 11 of 19A&A proofs: manuscript no. draft_arxiv
Fig. 21. The completeness-corrected cumulative PNLF (binned for vi-
sual clarity) for the whole catalog of M31 PNe is shown. It is fitted
with two-modes of the generalised analytical formula for the cumula-
tive PNLF (in orange) with one component dominating the brighter-end
(in green) and another dominating the faint-end (in red). The cumulative
PNLF corresponding to the Ciardullo et al. (1989) analytical formula
(in blue) is also shown. The region beyond the limiting magnitude of Fig. 23. Same as Figure 16 but with 5 elliptical bins.
the shallowest field (Field# 33_4) is shown in grey. The grey dotted line
shows the 90% completeness limit of the shallowest field.
canonical PNLF (like the dip) could be lost. Rodríguez-González
et al. (2015) presented the Cumulative PNLF corresponding to
the analytical PNLF described by Ciardullo et al. (1989). The
Cumulative PNLF for the generalised PNLF is presented as fol-
lows:
∗
+µ)−(3−c2 )M ∗
+µ)
I(M) = c1 ec2 M [ c12 ec2 M + 3−c
1
2
e3(M −( c12 + 3−c
1
2
)ec2 (M ]
(11)
Figure 20 shows the cumulative PNLF of M31 for all the PNe
identified by our survey, fitted by the generalised analytical for-
mula with c2 = 0.257 ± 0.011, which agrees well with that found
from the canonical PNLF thereby corroborating that the effect
histogram binning considerations on the canonical PNLF is neg-
ligible. Only the data corresponding to m5007 < 24 are consid-
ered for the fit. The faint-end of cumulative PNLF also shows
the rise as compared to the fitted function.
Fig. 22. For the deepest field (Field# 35_4), the observed number of
PNe in each magnitude bin is shown in black, while the completeness
corrected number is shown in blue. The region beyond the limiting mag- 6.3. Two-mode PNLF
nitude of this field is shown in grey. The grey dotted line indicates the
90% completeness limit of this field. The rise in the faint-end of the PNLF may be an indication that
there are two PN populations, one dominating the brighter end
and a second one at the fainter end. Thus we fit the observed cu-
with that previously found by Ciardullo et al. (1989). Only the mulative PNLF with two modes similar to Rodríguez-González
data corresponding to m5007 < 24 are considered for the fit. The et al. (2015). The two-mode PNLF is defined as I2m (M) =
bright cut-off remains consistent with the known value of M*. Ib (M) + I f (M), where Ib (M) is the cumulative function for the
The faint-end of PNLF shows a rise as compared to the fitted generalized PNLF set to parameters found in the previous sec-
function. Such a rise is seen at m5007 > 24.5 in all the fields of tion, which accurately represents the observed PNLF before the
the survey. This rise was not seen by M06 whose sample was rise in the faint end, and I f (M) is a cumulative function for
photometrically complete to brighter magnitude (m5007 = 23.5). the generalized PNLF considered with free parameters, c f 1 , c f 2
and M ∗f which are the normalisation constant, slope and bright
6.2. Cumulative PNLF cut-off of a possible second faint PNe population. Rodríguez-
González et al. (2015) had included an additional magnitude cut-
The M31 PNe can be fitted to a cumulative luminosity function off in their definition of the two-mode PNLF where the contribu-
(e.g. Peña et al. 2007, for NGC 3109) to avoid potential his- tion of the brighter mode was set to zero at this magnitude and
togram binning considerations like the bin size, limits, or the only the faint-end contribution was present. We do not include
position of the first bin. However, some important features of the such a magnitude cut-off because any PN population, such as the
Article number, page 12 of 19Souradeep Bhattacharya et al.: The survey of PNe in M31 I - Imaging
Fig. 24. The completeness-corrected PNLF for each elliptical bin is shown fitted by both the generalised analytical formula (in blue) and the
Ciardullo et al. (1989) analytical LF (in orange). The projected major axis elliptical radii covered by each bin is noted along with the fitted slope
of the PNLF. The region beyond the limiting magnitude of the shallowest field (Field# 33_4) is shown in grey. The grey dotted line shows the 90%
completeness limit of the shallowest field.
one dominating in the brighter-end, should have a contribution
down to ∼ 8 mag below the bright cut-off (Buzzoni et al. 2006).
The two-mode fit of the observed PNLF is shown in Figure 21.
For the second possible PNe population, we find c f 2 = 4.4 ± 0.1
and M ∗f = −1 ± 0.3. Thus, the observed cumulative PNLF may
have a second PN population with a much steeper slope and very
different bright cut-off.
6.4. PNLF of the deepest field
The deepest field of our survey is Field# 35_4 which has a
limiting magnitude at m5007 = 26.4 and is 90% complete at
m5007 = 25.6. The PNLF for the PNe observed in this field is
shown in Figure 22 both before and after completeness correc-
tion. We note that the rise in the PNLF at m5007 > 25 is present
in the observed PNLF within the 90% completeness limit. Thus
the rise of the PNLF is a physical property of the observed PN
sample.
Fig. 25. The completeness-corrected PNLF for PHAT-matched PNe is
shown for the “likely” (blue), “possible” + “likely” (yellow) and “possi-
6.5. Radial variation of PNLF ble” + “likely” +“unlikely” (red). The region beyond the limiting mag-
nitude of the shallowest field (Field# 33_4) is shown in grey. The grey
We divide the PNe spatially into 5 elliptical bins (Figure 23) dotted line shows the 90% completeness limit of the shallowest field.
similar to Figure 16. The PNLF corresponding to each bin is
shown in Figure 24. Only the data corresponding to m5007 < 24
are considered to fit each PNLF. We observe that the rise in the that the PNLF corresponding to the innermost bin, covering part
PNLF remains invariant as we go radially outwards indicating of the bulge of M31 which is mostly saturated in our survey, has
that the rise is ubiquitous throughout the surveyed area and not a a steeper fitted slope as expected from PNe corresponding to an
function of photometry in crowded areas. Pastorello et al. (2013) older parent stellar population (Longobardi et al. 2013).
identified PNe in the high metallicity nuclear region within 80 pc
of the center of M31 with HST and SAURON data. They found
a PNLF with a paucity of bright PNe within ∼ 1 mag of the 6.6. PNLF of PHAT-matched PNe
bright cut-off. We find that the bright cut-off remains invariant as
we go radially outwards but this is expected because the median Figure 25 shows the PNLF of the PHAT-matched PNe. The faint-
metallicity of the disk and inner halo stars is largely uniform as end of the PNLF still shows a rise even for the conservatively-
the metal-poor inner halo is colligated with stars associated with selected “likely” PNe. This indicates that the faint PNe have
the more metal-rich substructures (Ibata et al. 2014). We note colour and magnitude consistent with those of the bright PNe.
Article number, page 13 of 19You can also read