What Do Local Government Education Managers Do to Boost Learning Outcomes?
←
→
Page content transcription
If your browser does not render page correctly, please read the page content below
RISE Working Paper 21/064
                                 March 2021

What Do Local Government
Education Managers Do to Boost
Learning Outcomes?
Jacobus Cilliers, Eric Dunford,
James Habyarimana

Abstract
Decentralization reforms have shifted responsibility for public service delivery to local government, yet
little is known about how their management practices or behavior shape performance. We conducted a
comprehensive management survey of mid-level education bureaucrats and their staff in every district in
Tanzania, and employ flexible machine learning techniques to identify important management practices
associated with learning outcomes. We find that management practices explain 10 percent of variation in
a district's exam performance. The three management practices most predictive of performance are: i)
the frequency of school visits; ii) school and teacher incentives administered by the district manager; and
iii) performance review of staff. Although the model is not causal, these findings suggest the importance
of robust systems to motivate district staff, schools, and teachers, that include frequent monitoring of
schools. They also show the importance of surveying subordinates of managers, in order to produce
richer information on management practices.
What Do Local Government Education Managers Do to Boost Learning Outcomes?

Jacobus Cilliers
Georgetown University

Eric Dunford
Georgetown University

James Habyarimana
Georgetown University

Acknowledgements:

We are grateful for exceptional program management and RA support from Shardul Oza, Roxanne
Oroxom, and Anthony Mwambanga. We are also grateful for helpful comments and suggestions from
Christina Brown, Aidan Eyakuze, Baruani Mshale, Risha Chande, Youdi Schipper, and anonymous
reviewers from the RISE Intellectual Leadership Team.

This is one of a series of working papers from “RISE”—the large-scale education systems research
programme supported by funding from the United Kingdom’s Foreign, Commonwealth and Development
Office (FCDO), the Australian Government’s Department of Foreign Affairs and Trade (DFAT), and the
Bill and Melinda Gates Foundation. The Programme is managed and implemented through a partnership
between Oxford Policy Management and the Blavatnik School of Government at the University of Oxford.

Please cite this paper as:

Cilliers, J., Dunford, E. and Habyarimana, J. 2021. What Do Local Government Education Managers Do
to Boost Learning Outcomes? RISE Working Paper Series. 21/064. https://doi.org/10.35489/BSG-RISE-
WP_2021/064

Use and dissemination of this working paper is encouraged; however, reproduced copies may not be
used for commercial purposes. Further usage is permitted under the terms of the Creative Commons
License.

The findings, interpretations, and conclusions expressed in RISE Working Papers are entirely those of the
author(s) and do not necessarily represent those of the RISE Programme, our funders, or the authors’
respective organisations. Copyright for RISE Working Papers remains with the author(s).

                             Research on Improving Systems of Education (RISE)
                                          www.riseprogramme.org
                                      information@riseprogramme.org
1     Introduction

    There is increasing interest in the role that bureaucrats, including local government managers, play in

public service delivery. This interest stems partly from the mixed success of decentralization reforms that

swept across the developing world over the past three decades (Faguet and Pöschl, 2015).1 The motivation

for decentralization was that it would increase allocative efficiency and ignite bottom-up accountability, by

shifting the locus of decision making (over services) closer to the beneficiaries (Ahmad et al., 2003; Oates,

1972; Tiebout, 1956). Contrary to this prediction, there is evidence that the quality of public service delivery

actually deteriorated with decentralization in contexts of low state capacity, or high levels of poverty (Galiani

et al., 2008; Hanushek et al., 2013). This evidence suggests that the quality of mid-level bureaucrats, who

supervise service delivery, can affect the quality. This has inspired recent research examining the role of

bureaucrats, in particular (Banerjee et al., 2020; Pepinsky et al., 2017; Rasul and Rogger, 2018; Rasul et al.,

2019). But up to now, limited empirical work has been conducted in this area.

    This paper describes what local government managers of education services do and explores whether,

and which, management practices are associated with learning outcomes in Tanzania. For this purpose, we

conducted a very detailed management survey in 2019 —taking inspiration from the World Management

Survey (WMS) (Bloom and Van Reenen, 2007)— of District Education Officers (DEOs) and their staff in

each of the 184 Local Government Authorities (LGA) in the country. The Tanzanian education system is

decentralized and DEOs are responsible for implementing government policies at the LGA level, with an

average of 97 primary schools per LGA. DEOs have limited de jure discretion at a school level, since central

government decides on the curriculum, resource allocation, and the hiring, firing and promotion of teachers.

However, they have substantial discretion in the supervision of schools, and how they manage the staff who

directly report to them. For this reason, we also surveyed Ward Education Officers (WEOs), who report

directly to the DEOs and act as a conduit of communication between the DEO and all schools in the Ward

(there are typically 4-5 schools per Ward). By collecting information both from a cadre of staff that the

manager supervises, we are able to make a more detailed observation of management practices than the

typical manager focused survey. We then combine these survey results with rich sources of secondary data,

including: student performance in national standardized exams in 2012 and 2019; 2002 census data; and

data from a nationally representative household survey conducted in 2015.

    We make a number of empirical contributions. First, we document considerable variation in DEO man-

agement practices. We also document positive and significant associations between aggregates of these

measures that increases our confidence in the construct validity of the measures we fielded. We further
   1 The World Bank estimated that 80-100% of all countries were in various stages of decentralizing by the end of the 20th

century (Manor, 1999).

                                                            3
validate these measures by showing that a particular set of our measures of managerial behavior is higher in
regions supported by two large donor programs focused on boosting related aspects of governance.
Second, we employ flexible machine learning methods to examine the importance of management prac-
tices in explaining variation in learning outcomes. Our model also includes historical socio-economic char-
acteristics —such as employment rates, access to government facilities, parents’ level of education, parents’
investment in their child’s education, and child anthropometric measures— and baseline academic perfor-
mance of each LGA, all of which might be correlated with both current student test scores and current
management practices. Given the limited number of observed units and the large number of managerial
practices and indicators for socio-economic status, we use a random forest (RF) with permutation-based
variable importance algorithm to perform feature selection. RF allows us to explore a wide range of predic-
tors, even when the number of observations is less than the number of predictor variables, since only a subset
of predictors are used to construct each tree in the ensemble. We use k-fold cross-validation to tune the
parameters of the model, preventing over-fitting but ensuring the model provides a decent approximation of
the data generating function. We isolate the subset of important features (i.e. the variables the model relied
on most to make its prediction) by permuting each variable and assessing the drop in cross-validated R-
squared. The approach provides a way of exploring which managerial practices matter most. Moreover, the
tree-based models allow for the detection of complex interactions and higher order relationships, detecting
managerial practices that may only be important under specific socioeconomic conditions.
We find that the observed variation in management practices explain about 10 percent of the overall
variation in test scores. This magnitude is consistent with recent findings by Fenizia (2019) who notes that
public sector managers in Italy explain 9 percent of overall productivity, although the empirical approach
of this paper is very different.2 In our analysis, management practices have less explanatory power than
socio-economic factors (23 percent), or prior academic achievement (16 percent). Delving further into which
particular practices influence learning outcomes, the three most important practices are: i) monitoring of
schools by the WEO; ii) school and teacher incentives administered by the local government manager; and
iii) performance review of WEOs. Although the model is not causal, these findings suggest the importance
of having robust systems in place that motivate district staff, schools and teachers, including frequent
monitoring of schools.
This paper joins a small but growing body of work documenting the managerial practices of middle
tier bureaucrats and linking those practices to measures of service delivery. Previous work has shown a
positive correlation between school-level management practices and student learning, or student value-added
2 The author exploits the rotation of managers, using a fixed effects model to “decompose productivity into the components
due to office characteristics, manager effects, and time effects.”
4in learning (Bloom et al., 2015; Crawfurd, 2017; Leaver et al., 2019; Di Liberto et al., 2014). Building on
these papers, a new avenue of research has sought to measure and explain the performance of public sector
managers that work at a level below the central government and above frontline providers. Rasul and Rogger
(2018) and Rasul et al. (2019), for example, examine the role of autonomy and incentives in strengthening
civil servants’ performance in Nigeria and Ghana, respectively. Other studies, that focus on education, have
demonstrated that district superintendents can meaningfully shape school quality in their district (Lavy and
Boiko, 2017; Meier and O’Toole Jr, 2002; Walter, 2018).
In addition to our empirical results, we make the following methodological contributions. First, we show
the value of employing machine-learning techniques, which allows us to take a data-driven, a-theoretical
approach to select the most important practices. Ordinary Least Squares (OLS) estimates are easier to
interpret, but depend on the researcher’s choice of control variables and construction of indices. Second, we
demonstrate that interviewing the staff of mid-tier government managers, as well as the managers themselves,
can provide important additional information on management quality.
The rest of the paper is organized as follows. In Section 2, we describe the institutional context in which
managers operate. Section 3 describes the primary and secondary data used in the analysis. Section 4
presents the methods and results of the machine learning analysis to identify management practices that
predict learning outcomes. We briefly discuss the findings and conclude in Section 5.
2 Context
Over the past three decades Tanzania has undergone a gradual process of decentralization, where respon-
sibility for service delivery has shifted from central to local government, and now falls under a separate line
ministry: the President’s Office for Regional Administration and Local Government (PO-RALG) (Gershberg
and Winkler, 2004). Tanzania is divided into 184 Local Government Authorities (LGAs), commonly known
as districts, that represent the most important locus of authority and resources in service delivery, especially
in education, health care, agricultural extension, local water supply, and roads. In this section we describe
the organization of LGAs and the constellation of stakeholders, programs and policies that potentially shape
the behavior of this important set of actors in the education system.
2.1 LGA Organization and DEO roles and responsibilities
Each LGA has a District Executive Director (DED), appointed by PO-RALG, who is the chief admin-
istrative officer in the district. The DED supervises a set of departments responsible for education, health,
agriculture, water and roads services. For education, each LGA has a primary and a secondary school District
Education Officer (DEO), who are respectively the department heads for primary and secondary education
5services in the district. The median LGA has 95 primary schools, with a range from 13 to 275. Although
their role is quite broadly defined, specific responsibilities include: monitoring of schools; communication
with schools; ensure delivery and adherence to the curriculum; ensure quality teaching; administration of
standardized examinations; coordination and communication with donors and local government; and transfer
of resources such as textbooks. For the purposes of this paper, we focus on the primary school DEOs.
Despite their broad responsibilities for education service delivery, DEOs in fact have limited control
over resources, and no control over the curriculum. Schools receive capitation grants directly from central
government, which also decides the allocation of new teachers and directly remunerates teachers (Gershberg
and Winkler, 2004). The allocation of other resources such as textbooks and instructional materials to
schools is governed by formal rules.3 Consequently, only about 5% of the overall LGA budget for the
primary education department is directly under the discretion of the DEO (see Table A.1).
Nonetheless, there are key areas where DEOs have considerable discretion to influence education perfor-
mance. First, they manage a cadre of staff who report directly to them. The office of the DEO is legally
entitled to have, at a minimum, six staff members who report directly to the DEO (see Figure A.1). In
addition, they manage Ward Education Officers (WEOs), who are required to visit primary and secondary
schools in their Ward on a regular basis, and act as a conduit and communication channel between schools
and the DEO. At the time of the survey, there were 3,915 Wards in the country (median number of 20
Wards per LGA), and typically four to five primary schools and one secondary school per Ward. DEOs
have discretion in the tasks that they assign their staff —which could range from observing teachers in the
classroom and distributing lesson plans to organizing of training— and there could be variation in how well
they supervise and motivate their staff to perform these tasks.
Second, DEOs have informal control over whether and how much certain resources are deployed. At a
very high level, DEOs play an important role both in the consultations, planning and implementation of
education related local government capital development programs.4 Moreover, they play a key coordination
role with donor funded projects —which affords them some control over how and where donor resources are
deployed in their LGA— and can exert pressure on the locally elected Ward Development Councils to mobilize
the community to provide more resources to schools. Finally, they have power over the following areas of
human resource management at a school level: approval of teacher transfers within the LGA, promotion
opportunities for head teachers, teacher leave policies, and the allocation of a small pool of funding meant
3 Headteachers are required to submit information about the school annually to the Basic Education Management Information
System (BEMIS) database, including textbooks needs. However, unlike capitation grants, DEOs receive those books from central
government and administer the allocation to schools using BEMIS enrollment records (the current ratio is 1:3, with aspirations
to make it 1 textbook per student).
4 Local Government Development Grants pay for capital improvements identified by wards approved by the LGA District
Council. They include payments for new infrastructure or renovations to existing infrastructure.
6for teacher allowances. All of these enable an motivated DEO to generate teacher and school incentives for
performance.
Third, even though the DEOs cannot make direct decisions over hiring and firing of teachers and head-
teachers, they can exert substantial soft pressure on schools to increase professional accountability. They
can direct their staff to closely supervise particular schools or teachers, and they can leverage their “bully
pulpit” to publicly recognize well-performing schools or or shame badly-performing schools. For example,
some LGAs hold annual award ceremonies to reward well-performing teachers, schools or WEOs; and some
share rankings of school performance, based on average score in the Primary School Leaving Exam (PSLE),
with all the head teachers in the LGA (Cilliers et al., 2020).
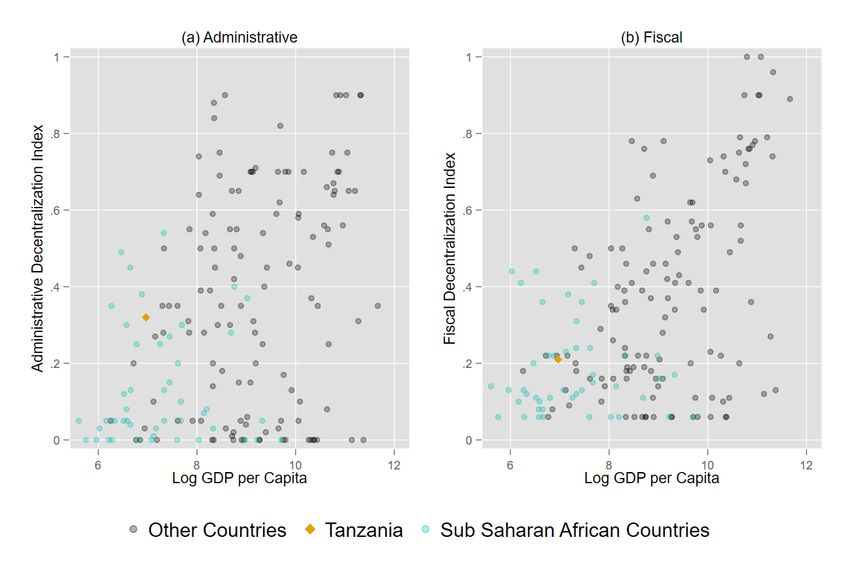
Note that lack of de facto decentralization is common in developing countries, where the delegation
of the responsibilities to local government did not coincide with more authority or fiscal autonomy. For
example, Figure 1 plots the relationship between two different measures of decentralization —administrative,
or fiscal— and log GDP, using data constructed by Ivanyna and Shah (2012). Higher scores are associated
with more decentralization. Tanzania ranks 77 out of 182 countries on the administrative decentralization
index, lower than South Africa (ranked 62) but higher than Kenya (ranked 105). Tanzania’s administrative
decentralization score is low overall, but high relative to most other sub-Saharan African countries.5 Its
fiscal decentralization score is much lower and comparable to the majority of African countries. Tanzania
ranks 104 out of 182 countries on the index of fiscal decentralization.
Figure 1: Relationship between decentralization and log GDP
5 Administrative decentralization is typically understood as an aggregate of three distinct features: deconcentration to lower
levels of national government, delegation of responsibility to local government, and devolution to locally elected officials. The
index created by Ivanyna and Shah (2012) focuses on control over hiring and firing decisions and regulation of local activities.
72.2 Donor Involvement in Tanzania
Multi-lateral and bi-lateral donors play a pivotal role in education sector programming in Tanzania, both
as large contributors of new resources that shape DEO tasks and in defining education system objectives.
Two large programs are the Education Quality Improvement Program in Tanzania (EQUIP-T) and Tusome
Pamoja. Both were designed to enhance learning outcomes in lagging regions in Tanzania.6 EQUIP-T
operated in 9 out of the 26 regions in Tanzania over a six year period (2014-2020), covering 31 percent
of schools in the country. Tusome Pamoja has operated in a different set of four regions in the country
over a five year period (2016-2021), covering 16 percent of schools in the country. Each project has some
discretion over which aspects of the education production process to address. One of the components of
the EQUIP-T program was strengthening district planning and budgeting, with the goal of improving local
education sector governance.7 This included management training for WEOs, monthly meetings between
WEOs, DEOs, and School Quality Assurance Officers, and providing motorbikes and stipends to WEOs (so
that they could conduct monitoring visits and report to district offices). The program worked within the
government’s financing system, so all of the implementation funding was wired to the central government,
who in turn transferred it to the LGAs to spend. Tusome also engages in a number of activities such as
teacher training, training of WEOs on how to provide teacher professional development to teachers, and
developing new materials related to basic skills instruction.
3 Data
3.1 Primary data collection
Between September and November 2019 we visited each of the 184 LGAs of mainland Tanzania and
interviewed the primary school DEO and WEOs from two randomly selected wards in the LGA. The DEO
survey instrument builds on the Development World Management Survey (D-WMS), originally developed by
Lemos and Scur (2016) to survey officials in charge of managing schools and hospitals in developing countries.
Prior to designing the instrument, we conducted unstructured interviews with DEOs and other education
officials in four different LGAs, to help us better understand their day-to-day activities and management
practices. These insights informed the creation of a management survey instrument relevant to the Tanzanian
context which was further piloted and refined in six different LGAs.
In addition to adapting the instrument to the Tanzanian context, our approach is different to the standard
D-WMS in three important ways. First, whereas the D-WMS requires enumerators to rate the managers
6 Theregions were selected on the basis of their poor education performance and resource constraints.
7 Otheractivities include: a) improved access to quality education; b) strengthened school leadership and management; c)
stronger community participation and demand for accountability; and d) improved learning and dissemination.
8on a 5-point scale along a series of different dimensions, we fielded each dimension as a series of yes/no
questions. The purpose was to minimize enumerator discretion, since this forces them to separately judge
each component that enters into the scale. See Table B.1 in the appendix for an example of the distinction
between the two methods. Second, we drew a clear distinction between the DEOs’ management of their staff
and management of schools/teachers. To this end, we added questions on how the DEOs motivate schools
and teachers to perform well. Third, the survey was conducted in person, rather than over the phone. This
was necessary to secure the DEO’s undivided attention for the 1-1.5 hour period required to complete the
survey. There were ten LGAs where we were unable to survey the DEO, either because the DEO was away
during the period of data collection, the DEO did not consent to be surveyed, or a new DEO had not yet
been appointed.
The WEO survey included questions relating to the management practices of the DEO: setting targets,
performance review, rewarding performance, and frequency of interaction with the DEO. We also asked
how frequently they visit schools and about the activities that take place during the school visits. Given
the proximity of WEOs to the schools, the WEO survey can provide a plausibly more reliable source of
information on the actual monitoring activities that take place in the LGA as well as how the DEOs manage
key staff.
We took the following steps to assure high-quality data collection and consistency in answers. First, two
enumerators participated in the survey. One enumerator would ask the DEO open-ended questions while
the other enumerator rated the management practices. The interviewer followed a clear script for both the
open-ended questions and additional prompting questions to ask, if necessary. We decided to separate the
two tasks to prevent the enumerator responsible for recording the DEO’s responses from inadvertently asking
leading questions. Second we trained enumerators extensively on the instruments, with several days spent
exclusively on the DEO interview. For one training exercise, enumerators listened to and coded recordings
of DEO interviews conducted during the pilot. Third, we recorded 115 out of the 174 DEO interviews that
were conducted. Dar es Salaam-based survey supervisors, experts in the DEO survey, would listen to the
recordings every evening and provide feedback/training to the DEO survey teams if they identified problems
with the interviewing approach or how responses were coded. Appendix section B provides further details
on our data quality assurance protocols.
For our descriptive and regression analyses, we construct each management practice score by simply
taking the mean of all the indicators relating to a specific practice. Furthermore, we follow Bloom and
Van Reenen (2007) and group the DEO practices into four categories, taking the mean of the z-score for
each management practice. The categories include: setting targets, operations (budget, curriculum, training,
and resource allocation), monitoring (collecting information, sharing performance indicators, documenting
9problems), and incentives (reward schools and reward teachers). We use the same aggregation for the WEO
survey, except that we draw a distinction between how they are managed by the DEOs (including targets,
monitoring and incentives), and the tasks that they perform (including monitoring of schools).
3.2 Secondary datasets
This study draws on multiple sources of secondary data. First, we have data on every school’s average
performance in the Primary School Leaving Exam, from 2012 and 2019. The PSLE is a standardized national
exam administered to all grade seven students in the country. The examined subjects are Mathematics,
English Language, Science, Social Studies and Kiswahili.8 Every student gets a score ranging between 0
and 250 (scoring up to 50 for each subject). We use this data both as an objective measure of managerial
performance as well as (for prior years outcomes) a proxy for other time-invariant unobserved determinants
of learning outcomes.
Second, we make use of two additional datasets, the 2002 Population Census and the 2015 Uwezo house-
hold survey, that capture the average socio-economic status of households in each LGA. This data allows
us to control for socio-economic determinants of learning outcomes. We use the following variables from
the 2002 Census: household head literacy rate, highest education in the household, unemployment, school
enrollment, ownership of assets, and bucolic status. The 2015 Uwezo household survey was conducted with
197, 451 households, in 4, 750 villages in every LGA in the country. This dataset includes basic socio-economic
characteristics such as the parents’ level of education, employment status, wealth, income, asset ownership,
access to water and electricity, and children’s anthropometric measures. It also includes data on whether a
child was enrolled at pre-school and whether the child goes to a public or private school. For each of the
selected variables we construct the average at the LGA level, and merge these aggregates with the data from
the management survey.9
3.3 Descriptive statistics
Section C in the appendix provides basic descriptive statistics of our sample, as well as a breakdown of
the management practice scores captured in the WEO and DEO surveys. Out of a total of 184 LGAs, we
were able to survey 174 DEOs and 363 WEOs. The DEOs are typically more educated than the WEO, and
they mostly have a background in education: 62 percent of DEOs have previous experience as a teacher,
compared to 71 percent for the WEO. Surprisingly the DEOs have limited experience in their current roles:
8 https://www.necta.go.tz/psle Accessed: June 9th , 2020.
9 One challenge in merging is that the number of LGAs in the country has expanded by roughly 50 percent in the past
decade. There were 132 and 159 LGAs in 2002 and 2015 respectively, compared to 184 in 2019. We overcame this problem
by first merging at a ward level. For wards that never split, this allows us to determine which LGA a household would have
belonged to, given the 2019 sub-divisions. For splitting wards, we assign the same aggregate measure of the mother ward in
the earlier datasets.
10the average years of experience of a DEO is 2.27, and over a quarter of them have less than a year of
experience.
Figure C.1 further demonstrates that there is a large variation in all of the management practices.
Moreover, an examination of the separate indicators (Tables C.3 to C.9) reveals that there is a wide range
of initiatives taken by DEOs and tasks performed by WEOs that could conceivably improve learning, but
these practices and tasks are not universally employed. For example, almost all DEOs reported at least one
target, but fewer than 40 percent of them had well-defined strategies for reaching each target. Similarly,
almost all DEOs reward schools/teachers for good academic performance, but fewer than 30 percent of them
communicated these rewards ex ante to the teachers and schools. Surprisingly, 72 percent of DEOs indicated
that teachers can receive financial rewards. 30 percent of DEOs organize award ceremonies in their LGA.
There is also variation in how deeply the DEO engages with the information created by the WEOs: Almost
all WEOs write reports, a smaller fraction (70 percent) share this with their DEO, and a smaller fraction
(52.3 percent) believe that the DEO actually reads it, and an even smaller fraction (45.2) believe that the
reports are acted upon.
Figure 2 shows the correlations between the main families of management practices, as measured in the
DEO survey. There is a moderate degree of correlation between all the measures, but the magnitudes of the
correlation are relatively small, ranging between 0.03 and 0.41. We observe moderate and statistically signif-
icant pairwise correlations between targets, operations and monitoring. The correlation between incentives
and the other families is smaller.
Figure 2: Correlation matrix
Note. The correlations between the targets, monitoring, operations, and incentives family scores, respectively. Each family is
the mean of the management practice scores. See Table B.2 for the management practices that constitute each family.
113.4 Validation
As a further test for the validity of our instruments, we document co-variation between management
practices and donor-driven governance reform. Table 1 shows that the DEO management practices and
activities performed by WEOs are different in the regions where two large donor-funded programs were
operating the past five years (see section D in the Appendix for a more detailed discussion). The overall
management score, as captured in the DEO survey, is 0.25 standard deviations (SD) larger in the Equip-T
regions, compared to regions that are served by neither donor. There seems to be better target setting,
operations, and monitoring, but weaker school/teacher incentives. Few of these outcomes are statistically
significant at conventional levels of significance, but the magnitudes are large and we have limited statistical
power given that there are only 26 regions in the country.10 The difference is more stark in the WEO survey,
with a difference in the overall score of 0.74SD, with the largest differences in access to resources (1.4 SD)
and monitoring (0.78). Moreover, WEOs in both the donor-funded regions report performing more tasks
overall, more activities when they visit schools, and have access to more resources. All of these impacts are
consistent with the governance reform, resource transfer, and donor activities highlighted in Section 2.
4 Empirical strategy
We employ a random forest model to identify the managerial practices that are most predictive of
academic performance. Our logic is that managerial practices that are predictive of good (bad) academic
performance potentially improve (inhibit) the ways schools function and thus indirectly influence the students
in these schools. Predictive power provides a useful starting point in determining which managerial practices
matter. A random forest averages across many regression trees when making a prediction, where each tree
leverages a random sub-sample of training data and variables. The advantage of the random forest over other
modeling methods is that it can capture both non-linear relationships in the data and layered interactions,
offering a better approximation of the data generating process. Moreover, by randomly sampling features
when generating trees, a random forest reduces the influence of dominant features. This allows the model
to explore different sources of variation in the training data more effectively.
Our outcome of interest is each LGA’s average exam performance in the 2019. We also include in the
model the socio-economic characteristics of each LGA, as captured in the 2002 census and 2015 household
survey, as well as exam performance data from 2012.11 In contrast to typical regression analysis, we do
not pre-process the data to construct aggregate measures for each management practice and an index for
10 The donor-funded programs are implemented at a regional level, and we clustered our standard errors at this level.
11 We do not include exam performance from more recent years, since recent exam performance could itself be a result
of current management practices. In particular, the donor-funded programs that instated governance reforms were directly
targeted at LGAs that performed badly in the PSLEs prior to 2014.
12Table 1: DEO and WEO practices— by donor involvement
Equip-T Tusome
Coefficient SE Coefficient SE R2 N
Panel A. DEO Survey
Overall 0.247 0.278 0.032 0.180 0.013 174
Targets 0.379 0.263 0.132 0.194 0.030 174
Operations
Overall 0.299 0.218 0.172 0.182 0.019 174
Curriculum 0.443 0.204 -0.359 0.188 0.080 174
Resource Allocation 0.350 0.180 0.644 0.243 0.059 174
Teacher Allocation -0.355 0.195 0.079 0.307 0.033 174
Training 0.258 0.242 0.025 0.208 0.015 174
Budget 0.085 0.227 0.061 0.279 0.002 174
Monitoring
Overall 0.270 0.213 0.096 0.207 0.015 174
Collect Information 0.456 0.201 -0.225 0.169 0.066 174
Identify Problems 0.321 0.284 0.187 0.284 0.021 174
Number of Performance Indicators 0.120 0.181 0.339 0.197 0.014 174
Share Performance Indicators -0.241 0.174 -0.066 0.124 0.012 174
Incentives
Overall -0.320 0.252 -0.381 0.127 0.029 174
Reward Schools -0.296 0.237 -0.222 0.147 0.019 174
Reward Teachers -0.254 0.213 -0.432 0.155 0.028 174
Panel B. WEO Survey
Overall 0.739 0.183 0.591 0.164 0.183 184
Targets -0.040 0.222 -0.067 0.201 0.001 184
Resources 1.401 0.162 1.329 0.113 0.601 184
Activities 0.368 0.124 0.320 0.152 0.056 184
Incentives
Overall -0.239 0.179 -0.084 0.169 0.020 184
Performance Review -0.264 0.170 0.148 0.132 0.042 184
Performance rewarded -0.091 0.134 -0.273 0.148 0.016 184
Monitoring (WEO)
Overall 0.779 0.183 0.369 0.238 0.186 184
Meetings 0.807 0.161 0.480 0.250 0.219 184
Reporting 0.375 0.164 0.080 0.166 0.052 184
Monitoring (Schools)
Overall 0.187 0.136 0.170 0.145 0.015 184
Number of Visits -0.175 0.144 -0.273 0.163 0.021 184
Activities During School Visits 0.433 0.161 0.508 0.131 0.083 184
Notes. Each row represents a separate regression. Standard errors are clustered at the regional level.
13socio-economic status; we rather include each indicator separately. This allows for the model to be as flexible
as possible, and further reduces the discretion of the researcher.
When running the models, we first break up our managerial sample into a training (122 LGAs) and
test (52 LGAs) dataset. We then employ k-fold cross-validation using the training data to tune the hyper-
parameters of the random forest.12 We then test the out-of-sample R2 using the held out test data. Our
best performing model yields an out-of-sample R2 of 46.93%, providing support that model offers a good
approximation of the data generating process.
In addition to testing for predictive accuracy, we leverage interpretable machine learning techniques to
determine (i) variable importance and (ii) functional relationships. The former determines which variables
matter to the prediction task, whereas the latter captures how those variables relate to the outcome (i.e.
the marginal effect). Variable importance (VI) captures the extent to which the model relies on a particular
variable when making a prediction. If a variable is deemed “important”, then excluding that variable from
the model results in a reduction in predictive accuracy. Variable importance offers a way to look through the
“eyes of the model” to see which variables it relied on to make its prediction. We rely on a model agnostic
technique that uses permutations to calculate variable importance. The method takes the training data
X train and outcome y train , a trained model fˆ(X train ), and error measure L(y train , fˆ(X train )) — which in
our case is the model fit (R2 ) — as input. We then isolate a variable j in X train and permute the order
of the variable for all i observations, effectively breaking the association between Xjtrain and y train .13 If
L(y train , fˆ(Xj−permuted
train
) < L(y train , fˆ(X train ), then we can conclude that j is important to the model in
generating its prediction. In other words, we scramble each variable, one at a time, and see if the model can
still predict accurately without it. If not, then we conclude that the variable was important in generating
the models prediction.
We can calculate the magnitude of that importance as Equation 1
V Ij = L(y train , fˆ(X train ) − L(y train , fˆ(Xj−permuted
train
) (1)
where the importance of variable j for model fˆ(X train ) is determined by the reduction in predictive accuracy
between the permuted and non-permuted models. We repeat this process for all p variables contained within
the training data, j ∈ 1, 2, . . . , p. Given that the permutations are random, we permute each j variable
12 Specifically, we tune the mtry (i.e. the number of variables that are randomly selected when constructing each tree in the
Random Forest Ensemble) and trees (i.e. the number of trees generated and then averaged across, in essence, the forest that
is generated.) parameters, which determine the random number of variables that are selected when building each tree, and the
number of trees used to build each forest. We hold all other hyperparameters at their default values. We use the ranger package
using the R statistical programming language (Wright and Ziegler, 2017). We use 5 folds when generating the cross-validation
samples.
13 See Fisher et al. (2018) for more information on the permutation-based variable importance.
14multiple times, generating a distribution for every V Ij . Thus, we report the variable importance both as a
point estimate reflecting the average variable importance across all permutations, and an interval, reflecting
the 95% interval of the V Ij . Finally, we report the variables in terms of importance in decreasing order.
We innovate on the permutation-based variable importance technique by introducing the idea of a “clus-
ter” permutation. As noted previously, many of the managerial practices captured in the survey fall within
general categories, such as training, curriculum, budgeting, etc. These categories, or clusters, are not com-
posed of any one managerial practice, but rather many. To understand the importance of a specific managerial
practice, we propose permuting all variables associated with that strategy to assess its importance when
generating a prediction. If Xctrain ⊆ X train where c = 1, . . . , C and C is the total number of variable clusters,
then the cluster variable importance is determined by Equation 2.
V Ic = L(y train , fˆ(X train ) − L(y train , fˆ(Xc−permuted
train
) (2)
The key difference between Equation 1 and Equation 2 is that more than one variable is permuted at a time.
Likewise, we permute a cluster multiple times to generate an estimate of the variation in V Ic . We view the
cluster variable permutation (hereafter “CVI”) approach as being superior to standard dimension reduction
techniques as it (a) does not require us to discard information and (b) allows for interpretation by further
unpacking the variables contained within the cluster.
5 Results
Figure 3 shows the cluster variable importance for the socio-economic and management variables, as well
as variable importance of the 2012 average test scores. The R2 decreases by 0.1 when the managerial variables
are permuted, relative to a reduction of 0.23 and 0.16 respectively when the socio-economic variables or the
2012 test scores data are permuted. The management practices thus account for 10 percent of the variation
in test scores, even after accounting for the contribution of socio-economic characteristics and historical exam
performance of a LGA to current performance.
Figure 4 shows the cluster variable importance of the different managerial practices that are most pre-
dictive of performance. The three most important managerial practices are: (i) school visits, as reported by
the WEO, (ii) school and teacher incentives provided by the DEO, and (iii) performance review of the WEO.
It is noteworthy that two of the three most important practices are captured by the WEO survey, rather
than the DEO survey. These results highlight a methodological contribution of this study: the importance
interviewing managers’ staff, and not only the managers themselves, in order to capture relevant aspects of
managerial quality. Together, these results suggest that rewarding performance —either teachers, schools,
15Figure 3: Variable importance for the three main variable subsets
Socio−Economic ●
Necta (2012) ●
Management ●
0.0 0.1 0.2 0.3
Reduction in R−squared
The figure plots the cluster variable importance for the two main categories of variables —socio-economic factors and
management practces— and variable importance for LGA-level average performance in the 2012 NECTA standardized exam.
The points captures the average CVI for each cluster (or average VI for NECTA (2012), and the bars reflect the 95% interval
of the permuted distribution.
or WEOs— and monitoring of schools are two key ingredients to management practices that improve school
performance, at least in the Tanzanian context.
Figure 5 presents the partial dependencies for each composing variable for each of the three practices with
the highest CVI: the marginal effect of a variable on the predicted outcome (Zhao and Hastie, 2019). The bar
plots capture the predicted change in the outcome when changing the specific variable from the minimum to
the maximum value. The line plots capture the marginal predicted values for each variable. All features have
been transformed to have a minimum value of 0 and a maximum value of 1. In terms of school visits, the
number of times that a WEO has visited a school is the strongest predictor of performance. Moving from the
least to the most number of visits changes the predicted test score by of roughly 0.03 standard deviations. In
terms of performance review of the WEO, whether the DEO actually discussed the performance measures is
the strongest predictor for performance. Turning to incentives, whether performance incentives are based on
objective indicators is highly predictive, but whether the incentives are financial in nature or not, is not. The
relationships identified in Figure 5 are not causal, but they are intuitive and point to future experimental
work to test for causal relationships.
6 Discussion and conclusion
This study examines the contribution of mid-tier government education managers to the quality of ed-
ucation in their district. For this purpose, we conducted a detailed management survey on all DEOs in
16Figure 4: Cluster variable importance of DEO managerial practices and WEO activities
WEO visits ●
School and teacher incentives ●
WEO performance review ●
WEO targets ●
Setting targets ●
WEO incentives ●
Resource allocation ●
Training ●
Cluster
Performance reviewed by DED ●
WEO reporting ●
Monitoring ●
WEO meetings ●
Budgeting ●
Share performance indicators ●
Teacher allocation ●
Curriculum ●
WEO resources ●
0.00 0.01 0.02 0.03 0.04
Reduction in R−Squared
The figure plots the cluster variable importance for each management practice, including data from both the DEO and WEO
surveys. The points captures the average CVI for each cluster, and the bars reflect the 95% interval of the permuted
distribution. See Tables C.3 to C.9 for the indicators for each management practice.
Tanzania, as well as a random sample of key staff stationed close to schools— the WEOs. We then link this
with socio-economic attributes and exam performance data and use machine learning techniques to identify
the attributes that are the strongest predictors of performance. There are three main findings. First, we find
that the management practices explain 10 percent of the variation in academic performance. Second, we find
that behaviors measured in the WEO survey are most predictive of learning, especially the number of times
that WEOs visit a school. The other management practice that is highly predictive is the existence of a
robust reward system for well-performing schools, teachers, and WEOs. These results demonstrate the value
of surveying managers’ staff, as well as the managers themselves, in order to get a more accurate picture
of the quality of managerial practices. They also show the merits of using machine learning techniques in
observational data when the number of predictors is larger than number of observations.
Of course, all of the results of this study are from observational data and cannot have a causal interpreta-
tion. Yet, they are consistent with previous experimental or quasi-experimental studies on school and teacher
incentives. Previous studies have shown that increased monitoring of schools and teachers is associated with
improved school performance (Muralidharan et al., 2016), especially if combined with financial incentives
(Cilliers et al., 2018; Duflo et al., 2012). Similarly, rewarding well-performing schools have been shown to
17Figure 5: Partial dependencies of the top 3 managerial practices
(A) WEO Visits
●
●
Number of visits ● ● ● ● ●
0.02
Other activities
Report teacher attendance
Assess learning ● 0.00
● ● ●
Observe teaching ●
● ● ●
●
●
● ● ● ●● ● ●
● ● ● ●
● ● ● ● ●
●
Observe teaching
−0.02
Report teacher attendance
● ● Number
● of visits
0.00 0.02 0.04 0.06 0.00 0.25 0.50 0.75 1.00
(B) WEO Performance Review
● ●
Predicted standardized test scores
Discuss accomplishing assigned tasks
Discuss OPRAS 0.000
Reviewed on OPRAS Discuss exam performance
● ●
●
Reviewed on accomplishing assigned tasks ● ● −0.005
● ●
●
● ●
●
Performance was reviewed in 2019 Discuss
● accomplishing assigned tasks
● ●
● ●
● ●
Performance is reviewed
−0.010
Reviewed on exam performance
Discuss OPRAS
●
Discuss exam performance
●
−0.010 −0.005 0.000 0.005 0.010 0.00 0.25 0.50 0.75 1.00
(C) School and Teacher Incentives
Teacher award criteria based on data ●
●
Teachers receive awards ●
●
●
●
●
● ●
●
●
Teacher aware of criteria
●
●
Schools receive awards ●
● −0.01
Teacher award criteria based on >1 indicator ● Schools receive awards
Schools aware of criteria ● Teachers receive awards
Schools receive financial reward
School award criteria based on data
−0.02
Teachers receive financial award
Schools aware of rewards
School award criteria based on >1 indicator
Teachers aware of rewards ● Teacher award criteria based on data
−0.03
0.00 0.01 0.02 0.00 0.25 0.50 0.75 1.00
Change in predicted outcome when switching from min to max Feature range
The figure reports the partial dependencies (marginal effects) for each of the three practices with the highest CVI reported in
Figure 4. Each panel (A, B, and C) capture a different managerial strategy. The bar plots capture the predicted change in the
outcome when changing the specific variable from the minimum to the maximum value. The line plots capture the marginal
predicted values for each variable. All features have been transformed to have a minimum value of 0 and a maximum value of
1. For each panel, the variables with the largest net change are highlighted in both graphs. These variables reflect the tactics
that matter most for each strategy.
improve school performance in Tanzania, even if not combined with explicit financial incentives (Cilliers et
al., 2020); and teacher incentives have been shown to improve student learning in Tanzania (Mbiti et al.,
2019).
A key policy implication of this study is that Tanzania’s close-to-school district staff, the WEOs, are
an under-utilized resource, and there could be high returns to improved management and task assignment.
Their job description enables them to visit schools on a regular basis, and thus also monitor schools and
teachers during their visits. Similarly, the fact that school performance is higher in LGAs where there
is more substantive performance review suggests that a more succinct framework for which performance
measures to discuss and how to do so could yield gains in performance. Future experimental work can test
18if exogenous improvements in the management practices and WEO activities highlighted in this study can
improve student learning.
19References
Ahmad, Junaid, Stephen Commins, Shantayanan Devarajan, Deon Filmer, Jeffrey Hammer,
Lant Pritchett, Ritva Reinikka, Shekhar Shah, and Agnès Soucat, “World Development Report
2004: Making Services Work for Poor People,” World Development Report, World Bank 2003.
Banerjee, Abhijit, Esther Duflo, Clement Imbert, Santhosh Mathew, and Rohini Pande, “E-
governance, Accountability, and Leakage in Public Programs: Experimental Evidence from a Financial
Management Reform in India,” American Economic Journal: Applied Economics, 2020.
Bloom, Nicholas and John Van Reenen, “Measuring and Explaining Management Practices Across
Firms and Countries,” The Quarterly Journal of Economics, 2007, 122 (4), 1351–1408.
, Renata Lemos, Raffaella Sadun, and John Van Reenen, “Does Management Matter in Schools?,”
The Economic Journal, 2015, 125 (584), 647–674.
Cilliers, Jacobus, Ibrahim Kasirye, Clare Leaver, Pieter Serneels, and Andrew Zeitlin, “Pay for
locally monitored performance? A welfare analysis for teacher attendance in Ugandan primary schools,”
Journal of Public Economics, 2018, 167, 69–90.
, Isaac M Mbiti, and Andrew Zeitlin, “Can Public Rankings Improve School Performance? Evidence
from a Nationwide Reform in Tanzania,” Journal of Human Resources, 2020, pp. 0119–9969R1.
Crawfurd, Lee, “School management and public–private partnerships in Uganda,” Journal of African
Economies, 2017, 26 (5), 539–560.
Duflo, Esther, Rema Hanna, and Stephen P Ryan, “Incentives work: Getting teachers to come to
school,” American Economic Review, 2012, 102 (4), 1241–78.
Faguet, Jean-Paul and Caroline Pöschl, Is Decentralization Good for Development?: Perspectives from
Academics and Policy Makers, Oxford University Press, 2015.
Fenizia, Alessandra, “Managers and Productivity in the Public Sector,” Working Paper, 2019.
Fisher, Aaron, Cynthia Rudin, and Francesca Dominici, “All Models are Wrong but Many are
Useful: Variable Importance for Black-Box, Proprietary, or Misspecified Prediction Models, Using Model
Class Reliance,” arXiv preprint arXiv:1801.01489, 2018.
Galiani, Sebastian, Paul Gertler, and Ernesto Schargrodsky, “School Decentralization: Helping
the Good Get Better, but Leaving the Poor Behind,” Journal of Public Economics, 2008, 92 (10-11),
2106–2120.
20Gershberg, Alan I. and Don Winkler, “Education Decentralization in Africa: A Review of Recent Policy
and Practice,” in “Building State Capacity in Africa: New Approaches, Emerging Lessons,” Washington,
DC: World Bank, 2004.
Hanushek, Eric A, Susanne Link, and Ludger Woessmann, “Does School Autonomy Make Sense
Everywhere? Panel Estimates from PISA,” Journal of Development Economics, 2013, 104, 212–232.
Ivanyna, Maksym and Anwar Shah, “How Close Is Your Government to Its People? Worldwide Indi-
cators on Localization and Decentralization,” Policy Research Working Paper, World Bank, 2012.
Lavy, Victor and Adi Boiko, “Management quality in public education: Superintendent value-added,
student outcomes and mechanisms,” Technical Report, National Bureau of Economic Research 2017.
Leaver, Clare, Renata Lemos, and Daniela Scur, “Measuring and explaining management in schools:
New approaches using public data,” 2019.
Lemos, Renata and Daniela Scur, “Developing Management: An Expanded Evaluation Tool for Devel-
oping Countries,” Working Paper, RISE, 2016.
Liberto, Adriana Di, Fabiano Schivardi, and Giovanni Sulis, “Managerial Practices and Students’
Performance,” 2014.
Manor, James, “The Political Economy of Democratic Decentralization,” Directions in Development,
World Bank, 1999.
Mbiti, Isaac, Karthik Muralidharan, Mauricio Romero, Youdi Schipper, Constantine Manda,
and Rakesh Rajani, “Inputs, Incentives, and Complementarities in Education: Experimental Evidence
from Tanzania,” The Quarterly Journal of Economics, 2019, 134 (3), 1627–1673.
Meier, Kenneth J and Laurence J O’Toole Jr, “Public management and organizational performance:
The effect of managerial quality,” Journal of Policy Analysis and Management: The Journal of the Asso-
ciation for Public Policy Analysis and Management, 2002, 21 (4), 629–643.
Muralidharan, Karthik, Jishnu Das, Alaka Holla, and Aakash Mohpal, The fiscal cost of weak
governance: Evidence from teacher absence in India, The World Bank, 2016.
Oates, Wallace E., Fiscal Federalism, New York: Harcourt Brace Jovanovich, 1972.
Pepinsky, Thomas B, Jan H Pierskalla, and Audrey Sacks, “Bureaucracy and Service Delivery,”
Annual Review of Political Science, 2017, 20, 249–268.
21Rasul, Imran and Daniel Rogger, “Management of Bureaucrats and Public Service Delivery: Evidence
from the Nigerian Civil Service,” The Economic Journal, 2018, 128 (608), 413–446.
, , and Martin J Williams, “Management, Organizational Performance, and Task Clarity: Evidence
from Ghana’s Civil Service,” Journal of Public Administration Research and Theory, 2019.
Tiebout, Charles M, “A Pure Theory of Local Expenditures,” Journal of Political Economy, 1956, 64 (5),
416–424.
Walter, Torsten Figueiredo, “State Management of Education Systems and Educational Performance:
Evidence from a Management Survey at District Education Offices in Zambia,” Report No. S-89454-ZMB-
2, International Growth Centre, London 2018.
Wright, Marvin N. and Andreas Ziegler, “ranger: A Fast Implementation of Random Forests for High
Dimensional Data in C++ and R,” Journal of Statistical Software, 2017, 77 (1), 1–17.
Zhao, Qingyuan and Trevor Hastie, “Causal Interpretations of Black-Box Models,” Journal of Business
& Economic Statistics, 2019, pp. 1–10.
22ONLINE APPENDIX
Contents
A Context 2
B Additional Information on data collection 3
C Descriptive Statistics 6
D Management practices by donor presence 17
1Appendix A Context
Table A.1: Budget for the 2016/17 fiscal year (per school)
Tanzanian Shillings US Dollars
Other charges 381,815 166
Capitation 3,448,416 1,500
Special schools 1,003,520 436
Travel for leave 760,755 331
Moving expenses 1,022,973 445
Senior teacher allowance 429,984 187
Total 7,047,463 3,065
Note. Total per-school LGA budget in the 2016/17 fiscal year by line item. “Other charges” refers to discretionary budget
under the control of the DEO. The DEO does not have control over the dispersement of capitation grants.
Figure A.1: Reporting structures in each LGA
Note. WEOs and at least six additional staff members report directly to the DEO. The DEO, in turn, reports to the District
Executive Director.
2Appendix B Additional Information on data collection
Given the complexity of the DEO survey and its unique interviewing mode, we took special measures
to ensure data quality. The data quality assurance process began with enumerator selection. We hired
enumerators who had prior experience conducting a survey of public sector officials modeled on the D-WMS.
These enumerators helped implement the pilot and provided critical feedback to the research team on the
questionnaires and DEO survey protocol. They had the conceptual knowledge and relevant prior experience
to guide novice enumerators during the training and in the field.
Prior to field launch, we trained enumerators extensively on the instruments, with several days spent
exclusively on the DEO interview. For one training exercise, enumerators listened to and coded recordings
of DEO interviews conducted during the pilot. We reviewed these recordings to clarify complex or con-
fusing concepts in the DEO survey. These recordings were supplemented by frequent quizzes that tested
enumerator knowledge and assessed progress. In these quizzes, the research team would provide examples of
DEO responses and ask enumerators to classify or characterize those responses in the way that the survey
instrument required. We selected enumerators who displayed the best understanding on these quizzes as the
”recorders” for the DEO interview (the role on the team that required the most enumerator discretion). The
training included one day of fieldwork in education offices in Dar es Salaam and a debrief.
Beyond the measures outlined above, we implemented standard field data quality assurance measures
such as backchecks (shortened surveys) conducted on a randomly selected subsample of respondents and daily
high-frequency checks throughout collection. We used backcheck and high-frequency check discrepancies to
identify concepts or questions that needed further clarification and monitor the effectiveness of particular
enumerators. We shared the key findings of these checks with the team supervising enumerators on a daily
basis - and they in turn communicated feedback to individual enumerators (or the entire team for common
errors).
3You can also read


