COVID-19 Discourse on Twitter in Four Asian Countries: Case Study of Risk Communication
←
→
Page content transcription
If your browser does not render page correctly, please read the page content below
JOURNAL OF MEDICAL INTERNET RESEARCH                                                                                                   Park et al

     Original Paper

     COVID-19 Discourse on Twitter in Four Asian Countries: Case
     Study of Risk Communication

     Sungkyu Park1*, PhD; Sungwon Han2*, MSc; Jeongwook Kim2*, MSc; Mir Majid Molaie2, BSc; Hoang Dieu Vu3,
     MSc; Karandeep Singh1, PhD; Jiyoung Han2, PhD; Wonjae Lee2, PhD; Meeyoung Cha1,2, PhD
     1
      Data Science Group, Institute for Basic Science, Daejeon, Republic of Korea
     2
      Korea Advanced Institute of Science and Technology, Daejeon, Republic of Korea
     3
      Electrical and Electronic Engineering, Phenikaa University, Hanoi, Vietnam
     *
      these authors contributed equally

     Corresponding Author:
     Meeyoung Cha, PhD
     Data Science Group
     Institute for Basic Science
     55, Expo-ro, Yuseong-gu
     Daejeon, 34126
     Republic of Korea
     Phone: 82 428788114
     Fax: 82 428788079
     Email: meeyoung.cha@gmail.com

     Related Article:
     This is a corrected version. See correction statement in: https://www.jmir.org/2021/3/e28926

     Abstract
     Background: COVID-19, caused by SARS-CoV-2, has led to a global pandemic. The World Health Organization has also
     declared an infodemic (ie, a plethora of information regarding COVID-19 containing both false and accurate information circulated
     on the internet). Hence, it has become critical to test the veracity of information shared online and analyze the evolution of
     discussed topics among citizens related to the pandemic.
     Objective: This research analyzes the public discourse on COVID-19. It characterizes risk communication patterns in four
     Asian countries with outbreaks at varying degrees of severity: South Korea, Iran, Vietnam, and India.
     Methods: We collected tweets on COVID-19 from four Asian countries in the early phase of the disease outbreak from January
     to March 2020. The data set was collected by relevant keywords in each language, as suggested by locals. We present a method
     to automatically extract a time–topic cohesive relationship in an unsupervised fashion based on natural language processing. The
     extracted topics were evaluated qualitatively based on their semantic meanings.
     Results: This research found that each government’s official phases of the epidemic were not well aligned with the degree of
     public attention represented by the daily tweet counts. Inspired by the issue-attention cycle theory, the presented natural language
     processing model can identify meaningful transition phases in the discussed topics among citizens. The analysis revealed an
     inverse relationship between the tweet count and topic diversity.
     Conclusions: This paper compares similarities and differences of pandemic-related social media discourse in Asian countries.
     We observed multiple prominent peaks in the daily tweet counts across all countries, indicating multiple issue-attention cycles.
     Our analysis identified which topics the public concentrated on; some of these topics were related to misinformation and hate
     speech. These findings and the ability to quickly identify key topics can empower global efforts to fight against an infodemic
     during a pandemic.

     (J Med Internet Res 2021;23(3):e23272) doi: 10.2196/23272

     KEYWORDS
     COVID-19; coronavirus; infodemic; infodemiology; infoveillance; Twitter; topic phase detection; topic modeling; latent Dirichlet
     allocation; risk communication

     https://www.jmir.org/2021/3/e23272                                                          J Med Internet Res 2021 | vol. 23 | iss. 3 | e23272 | p. 1
                                                                                                               (page number not for citation purposes)
XSL• FO
RenderX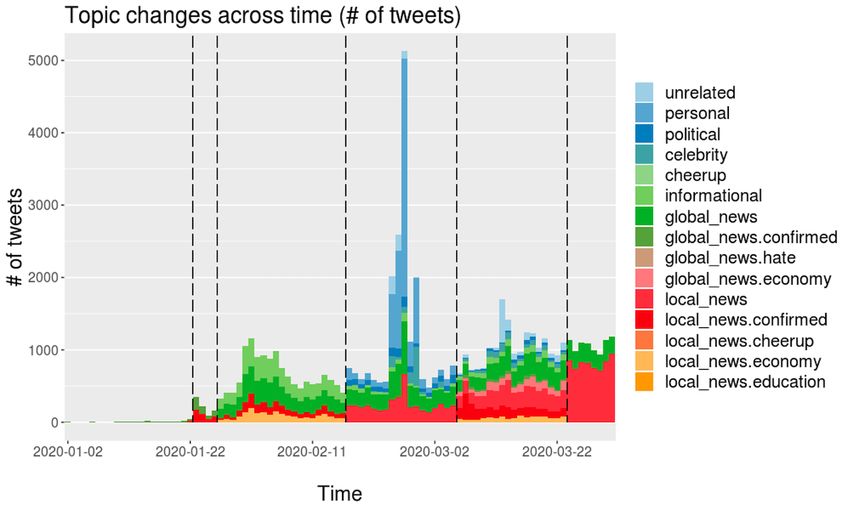
JOURNAL OF MEDICAL INTERNET RESEARCH                                                                                                     Park et al

                                                                          phases. However, government announcements do not necessarily
     Introduction                                                         match with the public interest. Following the issue-attention
     Background                                                           cycle theory [15], we leveraged drastic changes in the daily
                                                                          tweet volume to divide COVID-19 public discourse online in
     The COVID-19 pandemic has affected global health and the             finding temporal phases. We extracted topics corresponding to
     economy. The use of social media and the internet to seek and        the preset temporal phases based on a natural language
     share information about the virus has increased rapidly [1,2],       processing method.
     which makes them excellent media to examine for patterns of
     risk communication during a pandemic. During this time, one          We used a spatiotemporal approach and considered tweets from
     could observe how the intentional and unintentional spread of        different countries to provide more holistic views of risk
     misinformation (here defined as unconfirmed or false                 communication. We present views from four Asian countries.
     information) jeopardized public health on such platforms.            Such a multicountry view was used to explore possible
     Studies have shown that people tend to share misinformation          opportunities for joint efforts in managing risk communication.
     faster and more widely than real information [3-5]. The sheer        For example, early detection of misinformation can help social
     amount of data and the mixture of accurate and false information     media services, social media communicators, journalists, policy
     leaves people confused over which safety guidelines and health       makers, and medical professionals fight infodemics worldwide.
     tips to follow. This phenomenon has been called an infodemic         We ask the following research questions (RQs):
     [6]. Infodemics have become a real threat; misinformation on
     COVID-19 has shifted from focusing on false preventive               •   RQ1: Do the official epidemic phases announced by
     measures to antivaccination arguments [7] and vandalism toward           governments reflect online interaction patterns?
     telecommunication infrastructures [8].                               •   RQ2: Can topic phases be demarcated automatically based
                                                                              on a bottom-up approach?
     Analysis of risk communication is critical because it helps better   •   RQ3: What are the major topics corresponding to each topic
     understand how and why people propagate or consume certain               phase?
     information upon a threat to their health, economic, or social       •   RQ4: What are the unique traits of the topic trends by
     well-being. Such analysis helps stakeholders prepare and reach           country, and what are the distinguishing online
     informed conclusions about how their decisions affect                    communicative characteristics?
     individuals’ interests, values, and well-being [9]. In the context
     of COVID-19, which is our interest, analysis of risk                 By answering these RQs, this study makes four contributions.
     communication can find opportunities to mitigate the                 First, we propose an end-to-end method of extracting risk
     propagation of false claims that threaten public safety [10].        communication topics in a spatial–temporal fashion with less
                                                                          gatekeeping. Second, we provide a theoretical ground
     Studies have identified online risk communication topics by          (issue-attention cycle) to the framework and successfully assess
     collectively considering temporal tweet trends by adopting, for      its validity by observing multiple prominent peaks in the daily
     instance, a statistical clustering method that scans over time       conversation. Third, we demonstrate via a case study of four
     [11,12] or a deep learning–based embedding and clustering            countries a common risk communication trait. During the peak
     method [13]. One limitation of statistical approaches is that        moments of conversation, users on social media concentrate on
     inaccurate or incomplete input data can act as noise, resulting      a few topics. Finally, we show from the case study which topics
     in unstable clustering results [14]. Embedding approaches for        were directly linked to misinformation and hateful speech in
     topic modeling have also required that one specify the time          the studied data.
     duration (eg, monthly). However, such an arbitrary division
     hinders finding natural topical transitions and critical risk        The gathered data from Twitter and the codes (including
     communication topics. Therefore, flexible time durations are         language tokenizers and analysis codes) are accessible in
     preferable in identifying topical shifts.                            Multimedia Appendix 1 and on GitHub [16].

     This research used the data gathered from social media to            Related Research
     understand public discourse on COVID-19. Understanding
                                                                          Issue-Attention Cycle
     public concerns will help determine which unproven claims or
     pieces of misinformation need to be debunked first and will          The issue-attention cycle model [15] conceptualizes how an
     contribute to fighting the disease. Primarily, we aim to identify    issue rises into and fades away from the center of public
     what people say without gatekeeping. For instance, identifying       attention. In the first stage, labeled the preproblem stage, an
     new misinformation in countries that are experiencing a              undesirable social condition (eg, the appearance of COVID-19)
     pandemic at an early stage can buy time to debunk the same           emerges but does not yet draw much public attention. The
     piece of misinformation in other countries before it poses a         second stage, dubbed alarmed discovery and euphoric
     threat to public health [10].                                        enthusiasm, occurs when a triggering event (eg, the national
                                                                          spike of newly confirmed cases of COVID-19) heightens public
     To detect meaningful topical shifts of risk communication, one       awareness of the issue. In the third stage, called realizing the
     needs to demarcate temporal phases from the public discourse         cost of significant progress, people begin to recognize the
     that reflect prevailing circumstances in the real world. If social   hardship involved in restructuring society, and individuals must
     media conversations were to change by the epidemic phases            sacrifice to solve the problem. This causes a gradual decline of
     announced by local governments, one might use the same               intense public interest, the fourth stage. In the final postproblem

     https://www.jmir.org/2021/3/e23272                                                            J Med Internet Res 2021 | vol. 23 | iss. 3 | e23272 | p. 2
                                                                                                                 (page number not for citation purposes)
XSL• FO
RenderX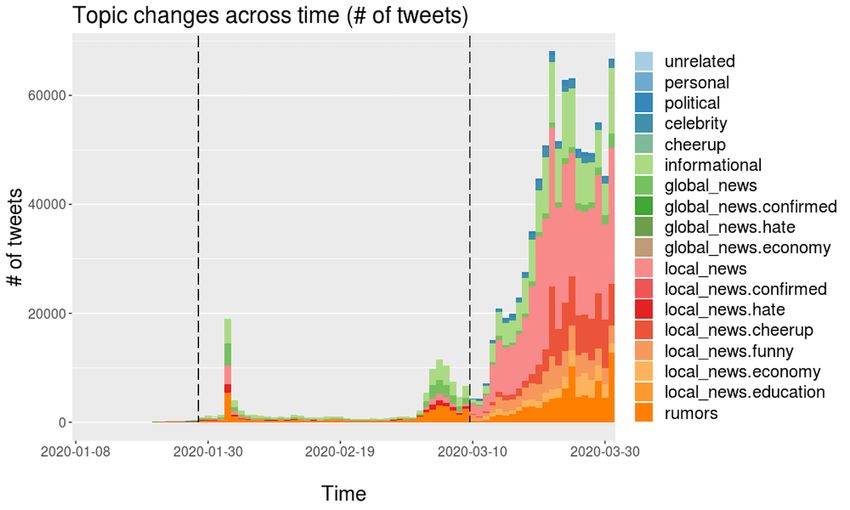
JOURNAL OF MEDICAL INTERNET RESEARCH                                                                                                     Park et al

     stage, the current issue is replaced by a new issue and moves        epidemic model to represent the spread of misinformation about
     into a twilight zone of reduced public attention.                    COVID-19 on various social media platforms such as Twitter,
                                                                          Instagram, YouTube, Reddit, and Gab; the study showed that
     Not all issues follow the five stages of the issue-attention cycle
                                                                          users interact and consume information differently on each
     [17]. As the cyclical patterns of public attention evolve, a wide
                                                                          platform [28]. In this regard, media platforms such as Facebook,
     array of public discourse has been found across multiple issues
                                                                          YouTube, and Twitter claim to attempt to redirect people to
     of climate change [18], emerging technologies [19,20], and
                                                                          reliable sources of medical information and, to this end, have
     public health risks [21,22]. There are also cultural differences
                                                                          established direct lines of communication with the Centers for
     in such discourse patterns. For example, concerning the H1N1
                                                                          Disease Control and Prevention and the World Health
     pandemic, South Korean news coverage showed five phases of
                                                                          Organization [29].
     increasing or decreasing attention. The corresponding US news
     coverage of the pandemic saw only two phases during the same         Among the regional research, one article argued that fake online
     7-month time period [23].                                            news in Japan has led to xenophobia toward patients and
                                                                          Chinese visitors [30]. Another study surveyed 300,000 online
     Despite these fragmented findings, the issue-attention cycle
                                                                          panel members in South Korea in 2015, when the Middle East
     framework provides insights into how public attention
                                                                          respiratory syndrome outbreak was prevalent in this country
     dramatically waxes and wanes. An issue that has gone through
                                                                          [31]. This work found that, if public health officials’ information
     the cycle is different from issues that have not gone through the
                                                                          is untrustworthy, people rely more on online news outlets and
     cycle in at least two ways. First, when an issue has achieved
                                                                          communicate more via social media.
     national prominence, new institutions, programs, and measures
     will have been developed to address the situation. These             More recently, a report showed that the public could not easily
     developments and their societal impacts are likely to persist        receive the information on COVID-19 shared by public health
     even after public attention has shifted elsewhere. Second, the       officials due to prevalent misinformation on fake cures and
     prolonged impacts of these developments are shaped by what           conspiracy theories [32]. This study showed that infodemics’
     was heavily discussed when the issue was of primary public           harm varied from country to country depending on public
     concern.                                                             confidence in authorities. One study compared trends in three
                                                                          countries (ie, the United States, the United Kingdom, and
     Although the issue-attention cycle was initially proposed to
                                                                          Canada) in terms of political bias and found that, although
     model traditional media such as newspapers and television,
                                                                          political polarization surrounding COVID-19 exists in the United
     there is a burgeoning literature applying the model to social
                                                                          States and Canada, individuals’ exact perspective on the
     media platforms. Among them, Twitter serves as a forum that
                                                                          pandemic is broadly related to the quality of their reasoning
     the public is increasingly turning toward to seek and share
                                                                          skills, regardless of political ideology [33].
     information that is not subjected to a gatekeeping process [24].
     It has become common for journalists to refer to tweets in their     Several studies have used data gathered from Twitter to analyze
     news stories. Research has also found that Twitter takes the         risk communication amid COVID-19. Some of them focus on
     lead in and exerts control over public discourse, particularly in    sentiment analysis based on conventional rule-based lexicon
     the early stages of an issue-attention cycle [20,25].                models [34] or deep learning classifiers [35]. These studies
                                                                          measured the degree of sentiment polarity, such as positive and
     Building on these prior studies, we analyzed Twitter
                                                                          negative, and provided insights from observing daily sentiment
     conversations about COVID-19 to examine social media’s
                                                                          changes.
     issue-attention cycle. We present how to build an end-to-end
     method of identifying meaningful topic phases dynamically.           Many types of data sets have been released to the public and
     This allows us to compare how issue-attention cycles appear in       research communities on COVID-19. One study crawled Twitter
     different countries on the same catastrophic event. To the best      for approximately 3 months and collected information on tweets
     of our knowledge, no study has applied dynamic topic modeling        with relevant keywords in 10 languages [36]. Another work
     in the context of risk communication.                                collated over 59,000 academic articles, including over 47,000
                                                                          research papers, on COVID-19, SARS-CoV-2, and
     COVID-19–Related Analyses                                            coronavirus-related issues [37] to conduct a comparison study.
     Studies have examined various impacts of the pandemic.
     Researchers have focused on predicting the transmissibility of       Topic Modeling–Based Natural Language Processing
     the virus. One study estimated the viral reproduction number         Natural language processing such as topic modeling is
     (R0) of SARS-CoV-2, which is known to be more substantial            increasingly used to process extensive documents and extract
     than that of severe acute respiratory syndrome (SARS)–related        hidden thematic patterns of textual information [38]. Many
     coronavirus, which was the cause of the SARS outbreak that           studies have explored the capability of topic modeling in
     first appeared in Guangdong Province in southern China in 2002       understanding the most important subjects of discussion on
     [26]. Another work based on a stochastic mathematical                social media during crises and global epidemics such as dengue
     prediction model of infection dynamics claimed that, by              [39], Sika virus [40], and Ebola virus [41]. Given the remarkable
     reducing worldwide travel by 90%, the epidemic’s spread could        performance of topic modeling in previous investigations, recent
     be significantly reduced [27].                                       studies on the COVID-19 outbreak have also applied topic
                                                                          modeling to documents collected from different social media
     Other studies have sought to understand the propagation of           sites such as Facebook [42], Weibo [43], and Twitter [44].
     misinformation related to COVID-19. One study used an
     https://www.jmir.org/2021/3/e23272                                                            J Med Internet Res 2021 | vol. 23 | iss. 3 | e23272 | p. 3
                                                                                                                 (page number not for citation purposes)
XSL• FO
RenderX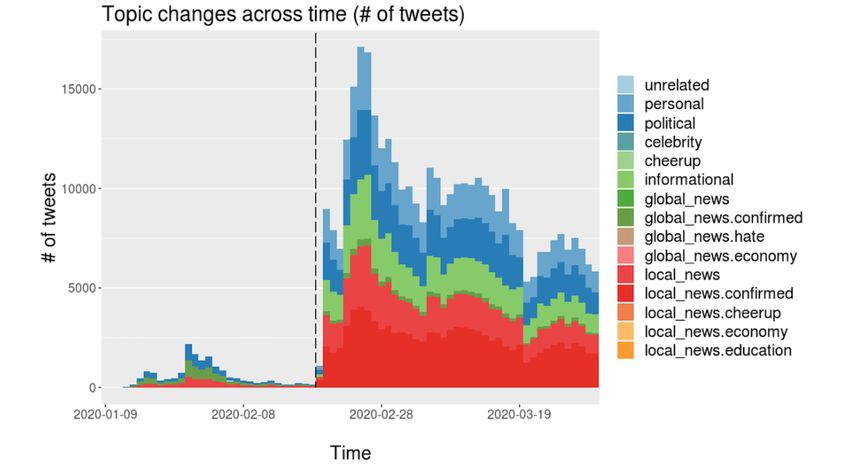
JOURNAL OF MEDICAL INTERNET RESEARCH                                                                                                               Park et al

     One work analyzed COVID-19–related tweets over 2 weeks to                   Our analyses focused on four Asian countries (ie, South Korea,
     study ongoing topics and found that Twitter can be considered               Iran, Vietnam, and India). We can ignore possible cultural
     a rich medium to understand public opinions in real time [45].              differences in social media behaviors between Western and
     Another work conducted topic modeling on tweets to discover                 Asian users [54,55]. A common platform, Twitter, was used to
     daily hot topics on the pandemic [46]. Furthermore, scholars                study public conversations in these countries. Although multiple
     leveraged Twitter to study the ecosystems of misinformation                 platforms exist, the open data access and global popularity make
     and conspiracy. One study has shown that users’ political                   Twitter an appropriate medium to conduct a cross-national
     orientation correlates to their contribution to the spread of               study.
     pandemic-related conspiracy [47]; another study demonstrates
                                                                                 The four countries were selected as a case study to demonstrate
     the link between fake news exposure and low trust in media
                                                                                 differences in their COVID-19 developments. In Iran, confirmed
     [48]. Several techniques have been developed to detect
                                                                                 cases have gradually increased. In contrast, the case count in
     conspiracy and misinformation on social media [49-51].
                                                                                 Vietnam has consistently stayed low. There was an abrupt
     Despite the growing literature on risk communication during                 increase in the numbers after the first confirmed case in South
     COVID-19, most studies that use topic modeling extract topics               Korea, but the rising curve of confirmed cases has since
     from either the entire studied period or manually segmented                 flattened, unlike other countries. In India, the situation was
     periods. This study considers time and topics jointly; we used              relatively mild until mid-March 2020, and since then, there has
     an algorithmic approach to identify topical phases that arise               been a drastic surge. Future research can replicate our
     naturally. Our goal is to observe changing risk communication               methodology in other countries.
     contexts (even when conversations contain similar keywords)
                                                                                 We set up two keywords, corona and Wuhan pneumonia, to
     from the issue-attention cycle perspective. We also chose to
                                                                                 crawl tweets and collected tweets for the 3 months from January
     study risk communication in Asian countries that have received
                                                                                 to March 2020. In the studied countries, any tweets containing
     relatively little attention. Our data method is not restricted to
                                                                                 the official term COVID-19 in local languages will be searched
     the studied countries; it can be applied to other languages and
                                                                                 with the word corona (eg, in Korean, it is called corona-19).
     countries.
                                                                                 We also added Wuhan to collect unofficial terms of the virus.
                                                                                 Table 1 lists the keywords used to collect data for each country.
     Methods                                                                     Keywords were decided after interviewing multiple local Twitter
     Data                                                                        users for each country.

     We crawled Twitter for messages by using the Twint Python
     library [52] and search application programming interfaces [53].

     Table 1. Statistics of the scraped tweets.

         Language                  Duration                              Keywordsa used                                              Tweets, n
         Korean                    January 1 to March 27, 2020           corona, Wuhan pneumonia                                     1,447,489
         Farsi                     January 1 to March 30, 2020           #corona, #coronavirus, #Wuhan, #pneumonia                   459,610
         Vietnamese                January 1 to March 31, 2020           corona, n-CoV, COVID, acute pneumonia                       87,763
         Hindi                     January 1 to March 27, 2020           corona, Wuhan pneumonia                                     1,373,333

     a
      Keywords were used to collect relevant data for each country. We used two kinds of keywords: one official naming of COVID-19 and Wuhan as an
     unofficial representative naming of the virus. Keywords listed here are translated in English from the actual local language (eg, “코로나” means “Corona”
     in Korean). The original keywords in local languages are listed in Table MA1 in Multimedia Appendix 1.

                                                                                 for certain phases. These steps were repeated for all four
     Demarcating Topic Phases and Extracting Topics                              countries.
     As shown in Figure 1, the data collection step was followed by
     the four modules for the extraction and labeling of major topics
     Figure 1. The pipeline structure of the topic analysis.

     https://www.jmir.org/2021/3/e23272                                                                      J Med Internet Res 2021 | vol. 23 | iss. 3 | e23272 | p. 4
                                                                                                                           (page number not for citation purposes)
XSL• FO
RenderX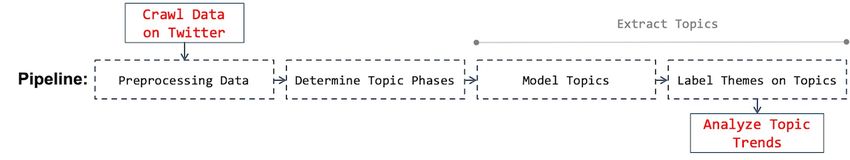
JOURNAL OF MEDICAL INTERNET RESEARCH                                                                                                      Park et al

     Step 1: Preprocessing Data                                            the first confirmed case by country and then detected other dates
     We first tokenized the data, a process that can be defined as         conjectured to be the start of forthcoming topic phases. When
     converting data to the smallest units that have meaning. We           learning these parameters, for velocity, we rounded down the
     filtered unnecessary textual information such as stop words,          velocityGT value and added 1, and for acceleration, we rounded
     special characters (nonletters), special commands, and emojis.        down accelerationGT, which is similar to the machine learning
     We then used existing Python tokenizer libraries corresponding        approach’s concept of loss minimization (ie, a learning process
     to each language. Detailed information about the                      is finished by one step).
     language-specific tokenizers is explained on GitHub [16].             We adopted a low-pass filter with 0.2 as the low-frequency
     Step 2: Determine Topic Phases                                        threshold to remove noisy signals and smooth the data. Finally,
                                                                           the temporal data are divided into topic phases (see Multimedia
     The next step is to demarcate specific phases divided by dates
                                                                           Appendix 1 to find the computed daily velocity and acceleration
     to extract topics. This is nontrivial since there are multiple
                                                                           trends and demarcated phases by country).
     fluctuations and changes in topics reflecting real events such
     as increased patients with COVID-19. Furthermore, we ruled            Step 3: Extract Topics—Model Topics
     out using the epidemic phases announced by each government            We used latent Dirichlet allocation (LDA) for the topic modeling
     because the offline epidemic phases do not seem to capture            task. LDA is a well-known machine learning method to extract
     actual online topic trends as explained in the forthcoming Basic      topics from given textual documents (ie, a collection of discrete
     Daily Trends section.                                                 data points) [56]. LDA generates and maximizes the joint
     The issue-attention cycle moderating public attention to a given      probability of the topics’ word distribution and the documents’
     issue can be measured in media attention, such as the number          topic distribution [38]. For short sentences, LDA-based methods
     of news stories [17-19,21-23] or tweets [20,25] on the topic.         may not work correctly due to sparse co-occurrences. However,
     We, therefore, isolated dates that show sudden increases in the       in our case, tweets were collected via specific keywords;
     daily tweet volume. We set up two learnable parameters of the         therefore, the topics were the focus, and the word co-occurrences
     first derivatives (hereafter velocity) and the second derivatives     among tweets were no longer sparse. Various studies have used
     (hereafter acceleration) of the daily tweet volumes, as illustrated   the same LDA method on short documents, including Twitter
     in the following equations, where D is a day, t is a target date,     [57-59].
     and t – 1 is 1 day past t:                                            The topic count for each phase is a hyperparameter. The topic
                                                                           count’s range is between 2 and 50. We calculated perplexity,
                                                                           that is, the probability of how many tokens might be placed in
                                                                           the next step (ie, indicating ambiguity over the next possible
                                                                           token). Perplexity is a metric that is often used to optimize
                                                                           language models [60]. The minimum required frequency of
                                                                           words for each phase in tweets was set to 20, and each phase’s
                                                                           epoch (ie, a number of iterations to train LDA) was set to 100.
     We set the velocity and acceleration values when the country          We then decided the optimum number of topics for each phase
     announced the first confirmed case as the ground truth (GT).          by choosing the minimum perplexity value. We further analyzed
     This approach’s intuition is that velocity and acceleration are       our modeling results’ reliability and confirmed that the results
     proxies for each country’s unique communication traits                were steady and dependable (see Multimedia Appendix 2 for
     regarding a specific subject (ie, COVID-19 in our case). Once         more details).
     these values were computed from the first confirmed date, they
     were set identically for the remaining periods.                       Table 2 shows how many prominent topical phases were found
                                                                           for each country. For each phase, we list the statistics of the
     We established joint thresholds for velocity and acceleration to      risk communication, including the period of the topical phase,
     find dates where velocity is still smaller than velocityGT, and       the total tweet count during the phase, the average user count
     acceleration becomes more substantial than accelerationGT             per day, the average original and retweet counts per day, the
     (0
JOURNAL OF MEDICAL INTERNET RESEARCH Park et al
Table 2. The optimal number of phases and topics by country.
Country Phase 0 Phase 1 Phase 2 Phase 3 Phase 4 Phase 5
South Korea N/Aa N/A
Time period Jan 1-19, 2020 Jan 20-Feb 12, Feb 13-Mar 9, Mar 10-27,
2020 2020 2020
Total tweets, n 507 161,790 672,080 366,073
Average users per day 14.06 2415.52 5376.77 5577.88
Average original tweets per day 28.17 5244.09 17,796.08 13,095.65
Average retweets per day 21.78 56,809.78 211,310.89 147,759.41
Tweet depthb 0.77 10.83 11.87 11.28
Topics determined by perplexity, n 2 41 15 43
c 1 18 6 14
75th percentile of topics , n
Final topicsd, n 1 8 5 11
Iran N/A N/A N/A N/A
Time period Jan 1-Feb 18, Feb 19-Mar 30,
2020 2020
Total tweets, n 15,473 437,176
Average users per day 245.34 1442.46
Average original tweets per day 385.63 5272.04
Average retweets per day 1315.13 22,128.76
Tweet depth 3.41 4.20
Topics determined by perplexity, n 3 5
75th percentile of topics, n 2 4
Final topics, n 3 6
Vietnam
Time period Jan 1-20, 2020 Jan 21-25, 2020 Jan 26-Feb 15, Feb 16-Mar 4, Mar 5-22, Mar 23-31,
2020 2020 2020 2020
Total tweets, n 140 1499 18,424 28,458 26,950 12,292
Average users per day 3.79 131.25 179.65 485.59 340.65 433.29
Average original tweets per day 7.37 218.50 686.60 1238.77 1089.94 1224.00
Average retweets per day 0.21 20.75 159.80 582.29 192.24 201.86
Tweet depth 0.03 0.09 0.23 0.47 0.18 0.16
Topics determined by perplexity, n 19 3 6 46 48 16
75th percentile of topics, n 1 1 3 22 19 4
Final topics, n 1 2 4 7 10 2
India N/A N/A N/A
Time period Jan 1-29, 2020 Jan 30-Mar 9, 2020 Mar 10-27, 2020
Total tweets, n 3088 151,210 1,219,030
Average users per day 107.41 1364.95 13,318.63
Average original tweets per day 269.72 4261.13 58,924.55
Average retweets per day 415.69 14,467.8 318,368.05
Tweet depth 1.54 3.40 5.40
Topics determined by perplexity, n 3 50 47
75th percentile of topics, n 2 22 20
https://www.jmir.org/2021/3/e23272 J Med Internet Res 2021 | vol. 23 | iss. 3 | e23272 | p. 6
(page number not for citation purposes)
XSL• FO
RenderXJOURNAL OF MEDICAL INTERNET RESEARCH Park et al
Country Phase 0 Phase 1 Phase 2 Phase 3 Phase 4 Phase 5
Final topics, n 3 5 9
a
N/A: not applicable.
b
Measured as the ratio of retweets to original tweets.
c
Major topics.
d
After human annotators merged similar themes.
validation and the list of topics and top-occurring words for
Step 4: Extract Topics—Label Topics each country). Our analysis objective was not to substitute
This step involves labeling the themes of the extracted topics human laborers on monitoring misinformation but to assist them
and allocating semantic meanings to each topic. We first sorted by grouping tweets into specific topics, including
all tweets with the identified topics in descending order (ie, misinformation.
tweets on the most prevalent topics listed first) and discarded
the minor topics that accounted for less than 25% of all tweets. Concerning the local and global news themes, we narrowed
down the labels since people talked about different news
We then extracted the top 1000 retweeted tweets and the 30 categories. We sublabeled tweets as “_confirmed” if it was
keywords with the highest probability of usage for each topic. about confirmed cases or deaths, “_hate” if it was about hate
We provided these data sets to local users from each country crimes toward individual races, “_economy” if it was about the
and asked them to label themes for each topic based on the given economic situation and economic policies, “_cheerup” if it was
data sets. Any similar or hierarchical topics were then merged about supporting each other, and “_education” if it was about
via qualitative coding into a higher category. If one topic when to reopen schools; finally, no sublabel was given to tweets
corresponded to several themes, then it was given multiple class about general information.
labels. The maximum number of multiple classes within topics
was two, and each class within a topic was weighted as 0.5 in Results
the plot of daily trends in the number of tweets.
Basic Daily Trends
Human annotators, who are familiar with the local language
and Twitter, qualitatively assessed the extracted topics. First Figure 2 shows trends of the daily tweet count; the same trend
was the intralevel, where annotators labeled each topic based is shown along with the number of confirmed COVID-19 cases
on the contents of the sampled top 1000 tweets and top 30 for each country in Figures 3-6. Adding to the two trends, we
words. The second was the interlevel, where the annotators included each government’s official epidemic phases as vertical
compared tweet contents and top-occurring words among topics lines. It is evident in the figures that the tweet trends are
regardless of the phase. Other annotators then cross-checked associated with the confirmed cases. However, the official
the assessment. epidemic phases do not accurately explain the tweet trends. We
examine trends for each country in the following sections.
The Cohen kappa coefficient to measure the intercoder reliability
was 0.766 (see Multimedia Appendix 2 for details on this
Figure 2. Daily trends in the four countries. The x-axis is dated, and the y-axis is the number of tweets with a log scale.
https://www.jmir.org/2021/3/e23272 J Med Internet Res 2021 | vol. 23 | iss. 3 | e23272 | p. 7
(page number not for citation purposes)
XSL• FO
RenderXJOURNAL OF MEDICAL INTERNET RESEARCH Park et al
Figure 3. Daily trends in South Korea. Start/end dates of the official epidemic phases (vertical dashed lines), trends in the number of tweets (blue lines),
and trends in the number of confirmed cases (red bars).
Figure 4. Daily trends in Iran. Start/end dates of the official epidemic phases (vertical dashed lines), trends in the number of tweets (blue lines), and
trends in the number of confirmed cases (red bars).
https://www.jmir.org/2021/3/e23272 J Med Internet Res 2021 | vol. 23 | iss. 3 | e23272 | p. 8
(page number not for citation purposes)
XSL• FO
RenderXJOURNAL OF MEDICAL INTERNET RESEARCH Park et al
Figure 5. Daily trends in Vietnam. Start/end dates of the official epidemic phases (vertical dashed lines), trends in the number of tweets (blue lines),
and trends in the number of confirmed cases (red bars).
Figure 6. Daily trends in India. Start/end dates of the official epidemic phases (vertical dashed lines), trends in the number of tweets (blue lines), and
trends in the number of confirmed cases (red bars).
quarantine authority began rigorous testing, focusing on Daegu,
South Korea and the number of confirmed cases increased drastically until
The first patient with COVID-19 was reported in South Korea mid-March. The tweet trends follow an identical pattern.
on January 20, 2020. This explains why the tweet count remains However, the official epidemic phases announced by the
relatively low during early January and mostly increases only government, represented by vertical dashed lines in the figure,
after late January (see Figure 3). On January 25, the Korean seem to lag behind the increases in the number of tweets. This
government issued a travel warning for Wuhan and Hubei pattern shows that the official epidemic phases do not align well
Province, and suggested that Korean citizens evacuate from with the amount of online attention.
those areas, which was heavily discussed on Twitter.
On February 18, 2020, the tweet numbers increased sharply due
to the 31st confirmed case related to a cult religious group
Shincheonji in Daegu City. After this case was confirmed, the
https://www.jmir.org/2021/3/e23272 J Med Internet Res 2021 | vol. 23 | iss. 3 | e23272 | p. 9
(page number not for citation purposes)
XSL• FO
RenderXJOURNAL OF MEDICAL INTERNET RESEARCH Park et al
Other Countries South Korea
We repeated the analysis with the other three countries, as shown The data yielded a total of four topic phases, which are used in
in Figures 4-6 (see Multimedia Appendix 3 for each country’s Figure 7. Phase 0 has no related topics. For phases 1, 2, and 3,
detailed explanation). the number of topics varies from 8, 5, and 11, respectively. In
phase 1, people talked a great deal about their personal thoughts
Extracted Topic Trends and opinions linked to the current outbreak, and they tried to
We used the daily theme labels acquired from the “Label cheer each other up. In phase 2, as the crisis peaked, people
Topics” module and analyzed the topic changes over time with talked less about personal issues and mainly about political and
plots for the four countries. One plot showed daily trends based celebrity issues. In Korea, political discussions revolved around
on the number of tweets, while another plot shows trends based closing the South Korean border with China and other countries.
on the number of tweets mentioning country names such as the In phase 3, as the daily number of tweets decreased relative to
United States. Overall, as people talked more about the that in phase 2, people talked about diverse topics, including
COVID-19 outbreak (ie, as the daily number of tweets local and global news. The major topics here included worries
increased), people’s topics became less diverse. about hate crimes directed toward Asians in Western countries.
Such diverse topics are likely shown when people think the
pandemic has just passed its peak.
Figure 7. Daily topic trends in South Korea. Trends based on number of tweets (top) and based on number of tweets mentioning country names (bottom).
https://www.jmir.org/2021/3/e23272 J Med Internet Res 2021 | vol. 23 | iss. 3 | e23272 | p. 10
(page number not for citation purposes)
XSL• FO
RenderXJOURNAL OF MEDICAL INTERNET RESEARCH Park et al
We portrayed daily trends of interest in other countries by Other Countries
counting the tweets mentioning other countries’ names in local We repeated the same analysis and interpreted the results for
languages or English. Korea, China, and Japan were mentioned the other cases (Iran, Vietnam, and India), as depicted in Figures
most frequently; we suspect that this was mainly triggered by 8-10 (see Multimedia Appendix 2 for the derived topic trend
political and diplomatic relationships. Meanwhile, the United and the mentioned country name trend graphs and detailed
States and Italy were both mentioned steadily across the 3 corresponding explanations by country).
months, with the media outlets broadcasting global news
affecting this phenomenon.
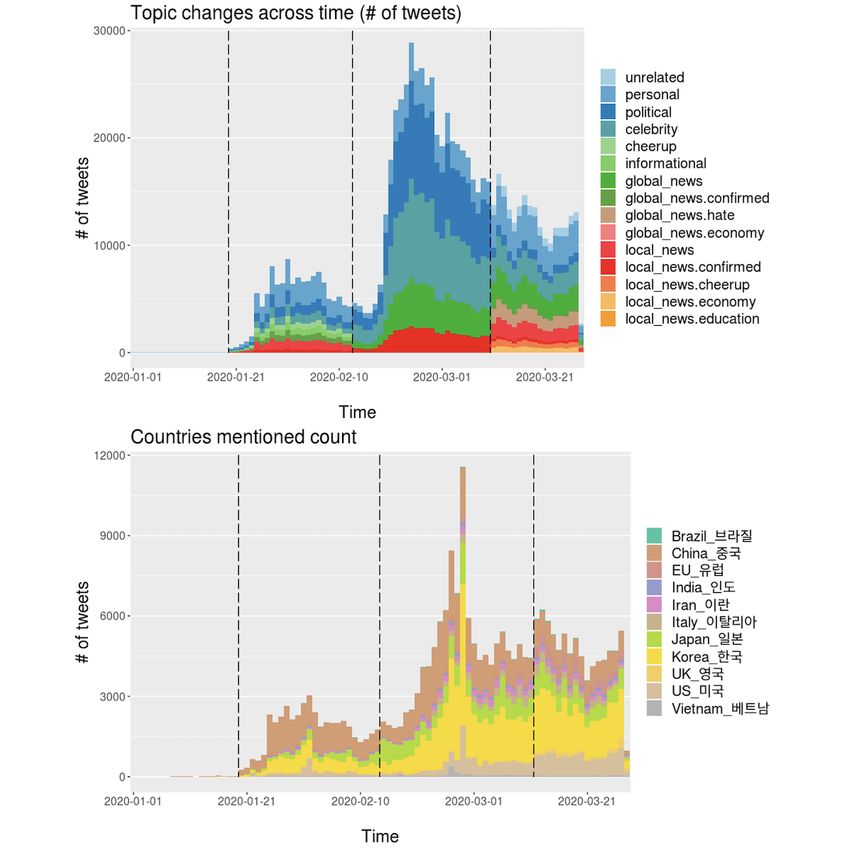
Figure 8. Daily topic trends in Iran based on the number of tweets.
Figure 9. Daily topic trends in Vietnam based on the number of tweets.
https://www.jmir.org/2021/3/e23272 J Med Internet Res 2021 | vol. 23 | iss. 3 | e23272 | p. 11
(page number not for citation purposes)
XSL• FO
RenderXJOURNAL OF MEDICAL INTERNET RESEARCH Park et al
Figure 10. Daily topic trends in India based on the number of tweets.
online coronavirus network’s diameter value was smaller than
Discussion that of other keyword networks [61].
RQ 1 and RQ 2: Explore an Automatic Way to Decide The topical phases with the most considerable tweet depth
Topic Phase and Model Topics appeared in the second stage of the issue-attention cycle, where
This paper analyzes tweets to understand the public discourse public awareness of an issue soars. In Iran and India, the number
on the COVID-19 pandemic. In South Korea, the daily numbers of phases might have been too small to discern any such trends.
of tweets reached their local maxima in tandem with major It is also worth noting that this pattern has no intercountry
offline events. However, in Iran and Vietnam, the tweet counts temporal dependence. In other words, even though the pandemic
did not synchronize well with offline events; this may be hit the countries at different times, our analysis shows that the
because of various reasons (eg, Twitter is only one of the tweet depth reached a maximum when the pandemic worsened
platforms used by citizens of this country). Overall, it is in that country. This observation could prove to be an effective
interesting to observe that the Twitter data peaks do not forewarning of upcoming misinformation cascades.
necessarily correlate with local governments’ announcements. Moreover, the daily tweet volume peaks reflected the daily
Social media attention can precede the official announcements, number of confirmed cases. In Iran, Vietnam, and India, the
while the official announcements can reinforce the attention. daily tweet volume peak anticipated the peak of the number of
RQ 3: Explore Common Traits Among Countries on daily confirmed cases by up to a few weeks. Although the two
peaks are close to each other for South Korea, it is worth noting
Risk Communication
that, around the time of their occurrence, South Korea was
Based on the topics labeled as people talked more about becoming the country most affected by COVID-19 outside
COVID-19, they tended to refer to a smaller number of topics. mainland China.
This was more apparent when the tweet depth value was used
for the phases, as presented in Table 2. Interestingly, as shown in Figures 3-6, a simultaneous upsurge
in the numbers of tweets occurred in South Korea, Iran, and
Tweet depth is defined as the number of retweets per day divided Vietnam (but not in India) at the end of February 2020, before
by the number of tweets per day. It can be deemed a measure the upsurge in numbers of locally confirmed cases. Given that
of standardized cascading depth, with a higher value signifying COVID-19 is a global issue, this suggests that the issue-attention
a greater depth for one tweet. The country-level sociopolitical cycle on a social media platform is more responsive to global
and cultural background, and Twitter popularity may lead to rather than local events. In this light, the COVID-19 pandemic
the observed differences in tweet depth. We verified that tweet offers a gripping opportunity for future researchers to theorize
depth tended to increase in South Korea and Vietnam cases the issue-attention cycle model on a global scale and see how
when people communicated more about COVID-19. This the cycle evolves in conjunction with location-specific topics
phenomenon reaffirms the finding in another study that the such as increasing or decreasing numbers of confirmed cases,
government measures, and social conflicts.
https://www.jmir.org/2021/3/e23272 J Med Internet Res 2021 | vol. 23 | iss. 3 | e23272 | p. 12
(page number not for citation purposes)
XSL• FO
RenderXJOURNAL OF MEDICAL INTERNET RESEARCH Park et al
RQ 4: Explore Unique Traits by Countries on Risk cautious about extrapolating explanations and insights generally.
Communication We plan to extend this study by including more countries.
Second, there are other ways to demarcate the topic phases. Our
We also observed a number of countrywise differences. One of
approach was informed by the issue-attention cycle framework,
them is the national versus international focus of South Korea
as we computed unique communication traits
and Vietnam during the initial phase. Phase 0 tweets in Korea
(ie, velocity and acceleration by country) that should be
were not directly related to COVID-19 but simply contained
relatively consistent across nations throughout the COVID-19
the word corona in a different context. This is because this time
pandemic.
period was before the first public announcement of the
confirmed patients in Korea. In contrast, in Vietnam, the first Last, there are also other methodologies to model topics. One
phase tweets were concerned with international updates on natural extension would be to use the external web links that
COVID-19. The difference is likely explained by the increasing are embedded in the relevant tweets. Scraping the content from
patient count worldwide. Note that South Korea was one of the external web pages could provide richer contexts in
first countries to experience the pandemic. We did not attempt understanding risk communication on social media. One recent
to draw any general conclusions from these findings due to the work used multilingual Bidirectional Encoder Representations
small tweet volumes in phase 0 for both countries. Nevertheless, from Transformers, a well-known transformer-based deep
Vietnamese users discussed the global epidemic more than embedding model, and fine-tuned it by considering topical and
Korean users from the outset. This tendency may have been temporal information to model topics of COVID-19 tweets [62].
associated with Vietnam’s successful defense against the On deciding topic phases via the data itself, one may use LDA
pandemic later on. and other embedding methods to model topics.
With specific reference to each country, in South Korea, when Concluding Remarks
the local (offline) pandemic situation became severe (phase 2), The current literature on the infodemic has emphasized the
the number of topics discussed on Twitter decreased, which social media platform’s content moderation efforts [63] and
means that people focused more on only a handful of issues. A fact-checking as a key risk communication strategy [64,65].
unique feature of phase 0 was that people sought to cheer each This study extends these scholarly endeavors. Predicated on an
other up and express solidarity in difficult times. In Iran’s case, issue-attention cycle framework, we analyzed public attention
the topic count was relatively steady over time. The significant on COVID-19–related topics in four Asian countries. We used
topics discussed were confined to news and information; we a time-topic cohesive approach to automatically identify
interpreted this as a sign that Iranian users tend to be cautious transitions in topical interests and qualitatively evaluated the
about using social media. topics found by local users.
For Vietnam, in phase 4, when tweet traffic was lower than in Our research found that when the tweet count on COVID-19
phase 3, the number of topics became more substantial, and the increased, it did not lead to an increased number of topics;
topic themes became less related to the numbers of confirmed regardless of the tweet count, much of the public attention
cases and death tolls. For instance, people talked more about remained focused on a limited set of topics. The early days of
the economy in phases 2 and 4. The Indian case also displayed the COVID-19 pandemic also involved various misinformation
a unique trait: many topics were related to misinformation, the and hateful speech in the studied countries; fake news was one
scale of which was much lower in the other countries. A large of the central topics discussed (not a peripheral topic). The
portion of the topics consisted of misinformation and hateful proposed steps could indicate the global effects of infodemics
content; this trend was observed throughout phases 2 and 3 (see during a pandemic and identify the emergence of misinformation
Multimedia Appendix 2). and its prevalence, which will help prioritize which
Limitations and Future Work misinformation to debunk.
There are several limitations to be considered. First, we analyzed
tweets from only four countries, and therefore, we need to be
Acknowledgments
The authors would like to thank Tae-Gwan Kang for his insightful comments. SP, SH, and MC were supported by the Institute
for Basic Science (IBS-R029-C2) and the Basic Science Research Program through the National Research Foundation of Korea
(No. NRF-2017R1E1A1A01076400).
Conflicts of Interest
None declared.
Multimedia Appendix 1
Data/code description, computed daily velocity/acceleration trends for each country, and derived temporal phases.
[PDF File (Adobe PDF File), 494 KB-Multimedia Appendix 1]
https://www.jmir.org/2021/3/e23272 J Med Internet Res 2021 | vol. 23 | iss. 3 | e23272 | p. 13
(page number not for citation purposes)
XSL• FO
RenderXJOURNAL OF MEDICAL INTERNET RESEARCH Park et al
Multimedia Appendix 2
Daily topic trends on social media, the reliability of the topic modeling results, intercoder reliability, and the labeled list of major
topics by country.
[PDF File (Adobe PDF File), 1904 KB-Multimedia Appendix 2]
Multimedia Appendix 3
Daily numbers of COVID-19 confirmed cases and tweet trends by country.
[PDF File (Adobe PDF File), 347 KB-Multimedia Appendix 3]
References
1. Ahmad AR, Murad HR. The impact of social media on panic during the COVID-19 pandemic in Iraqi Kurdistan: online
questionnaire study. J Med Internet Res 2020 May 19;22(5):e19556 [FREE Full text] [doi: 10.2196/19556] [Medline:
32369026]
2. Beaunoyer E, Dupéré S, Guitton M. COVID-19 and digital inequalities: reciprocal impacts and mitigation strategies. Comput
Human Behav 2020 Oct;111:106424 [FREE Full text] [doi: 10.1016/j.chb.2020.106424] [Medline: 32398890]
3. Lazer DMJ, Baum MA, Benkler Y, Berinsky AJ, Greenhill KM, Menczer F, et al. The science of fake news. Science 2018
Mar 09;359(6380):1094-1096. [doi: 10.1126/science.aao2998] [Medline: 29590025]
4. Vosoughi S, Roy D, Aral S. The spread of true and false news online. Science 2018 Mar 09;359(6380):1146-1151. [doi:
10.1126/science.aap9559] [Medline: 29590045]
5. Kwon S, Cha M, Jung K, Chen W, Wang Y. Prominent features of rumor propagation in online social media. 2013 Presented
at: 2013 IEEE 13th International Conference on Data Mining; December 7-10, 2013; Dallas, TX. [doi: 10.1109/icdm.2013.61]
6. Coronavirus disease 2019 (COVID-19): situation report – 86. World Health Organization. 2020. URL: https://bit.ly/2SKCl8X
[accessed 2020-08-27]
7. Stecula DA, Kuru O, Hall Jamieson K. How trust in experts and media use affect acceptance of common anti-vaccination
claims. Harvard Kennedy Sch Misinformation Rev 2020 Jan 14;1(1):1-11. [doi: 10.37016/mr-2020-007]
8. Ahmed W, Vidal-Alaball J, Downing J, López Seguí F. COVID-19 and the 5G conspiracy theory: social network analysis
of Twitter data. J Med Internet Res 2020 May 06;22(5):e19458 [FREE Full text] [doi: 10.2196/19458] [Medline: 32352383]
9. Renn O, Leiss W, Kastenholz H. OECD Guidance Document on Risk Communication for Chemical Product Risks. Paris:
OECD; 2002.
10. Cha M, Cha C, Singh K, Lima G, Ahn Y, Kulshrestha J, et al. Prevalence of misinformation and factchecks on the COVID-19
pandemic in 35 countries: observational infodemiology study. JMIR Hum Factors 2021 Feb 13;8(1):e23279 [FREE Full
text] [doi: 10.2196/23279] [Medline: 33395395]
11. Cheng T, Wicks T. Event detection using Twitter: a spatio-temporal approach. PLoS One 2014;9(6):e97807 [FREE Full
text] [doi: 10.1371/journal.pone.0097807] [Medline: 24893168]
12. Nagar R, Yuan Q, Freifeld CC, Santillana M, Nojima A, Chunara R, et al. A case study of the New York City 2012-2013
influenza season with daily geocoded Twitter data from temporal and spatiotemporal perspectives. J Med Internet Res 2014
Oct 20;16(10):e236 [FREE Full text] [doi: 10.2196/jmir.3416] [Medline: 25331122]
13. Farnaghi M, Ghaemi Z, Mansourian A. Dynamic spatio-temporal tweet mining for event detection: a case study of Hurricane
Florence. Int J Disaster Risk Sci 2020 May 26;11(3):378-393. [doi: 10.1007/s13753-020-00280-z]
14. Malizia N. Inaccuracy, uncertainty and the space-time permutation scan statistic. PLoS One 2013;8(2):e52034 [FREE Full
text] [doi: 10.1371/journal.pone.0052034] [Medline: 23408930]
15. Downs A. Up and down with ecology—the "issue-attention cycle". Public Interest 1972;28:38-51.
16. dscig / COVID19_tweetsTopic. GitHub. 2020. URL: https://github.com/dscig/COVID19_tweetsTopic [accessed 2021-03-12]
17. Nisbet MC, Huge M. Attention cycles and frames in the plant biotechnology debate: managing power and participation
through the press/policy connection. Int J Press/Politics 2016 Sep 14;11(2):3-40. [doi: 10.1177/1081180x06286701]
18. McComas K, Shanahan J. Telling stories about global climate change: measuring the impact of narratives on issue cycles.
Commun Res 2016 Jun 30;26(1):30-57. [doi: 10.1177/009365099026001003]
19. Anderson AA, Brossard D, Scheufele DA. News coverage of controversial emerging technologies. Evidence for the issue
attention cycle in print and online media. Politics Life Sci 2012;31(1-2):87-96. [doi: 10.2990/31_1-2_87] [Medline:
23379318]
20. Wang W, Guo L. Framing genetically modified mosquitoes in the online news and Twitter: intermedia frame setting in the
issue-attention cycle. Public Underst Sci 2018 Nov;27(8):937-951. [doi: 10.1177/0963662518799564] [Medline: 30198824]
21. Shih T, Wijaya R, Brossard D. Media coverage of public health epidemics: linking framing and issue attention cycle toward
an integrated theory of print news coverage of epidemics. Mass Commun Soc 2008 Apr 07;11(2):141-160. [doi:
10.1080/15205430701668121]
22. Arendt F, Scherr S. Investigating an issue-attention-action cycle: a case study on the chronology of media attention, public
attention, and actual vaccination behavior during the 2019 measles outbreak in Austria. J Health Commun
2019;24(7-8):654-662. [doi: 10.1080/10810730.2019.1652709] [Medline: 31423919]
https://www.jmir.org/2021/3/e23272 J Med Internet Res 2021 | vol. 23 | iss. 3 | e23272 | p. 14
(page number not for citation purposes)
XSL• FO
RenderXJOURNAL OF MEDICAL INTERNET RESEARCH Park et al
23. Jung Oh H, Hove T, Paek H, Lee B, Lee H, Kyu Song S. Attention cycles and the H1N1 pandemic: a cross-national study
of US and Korean newspaper coverage. Asian J Commun 2012 Apr;22(2):214-232. [doi: 10.1080/01292986.2011.642395]
24. David CC, Ong JC, Legara EFT. Tweeting Supertyphoon Haiyan: evolving functions of Twitter during and after a disaster
event. PLoS One 2016;11(3):e0150190 [FREE Full text] [doi: 10.1371/journal.pone.0150190] [Medline: 27019425]
25. Jang SM, Park YJ, Lee H. Round-trip agenda setting: tracking the intermedia process over time in the ice bucket challenge.
Journalism 2016 Aug 30;18(10):1292-1308. [doi: 10.1177/1464884916665405]
26. Liu Y, Gayle A, Wilder-Smith A, Rocklöv J. The reproductive number of COVID-19 is higher compared to SARS
coronavirus. J Travel Med 2020 Mar 13;27(2):taaa021 [FREE Full text] [doi: 10.1093/jtm/taaa021] [Medline: 32052846]
27. Chinazzi M, Davis JT, Ajelli M, Gioannini C, Litvinova M, Merler S, et al. The effect of travel restrictions on the spread
of the 2019 novel coronavirus (COVID-19) outbreak. Science 2020 Apr 24;368(6489):395-400 [FREE Full text] [doi:
10.1126/science.aba9757] [Medline: 32144116]
28. Cinelli M, Quattrociocchi W, Galeazzi A, Valensise CM, Brugnoli E, Schmidt AL, et al. The COVID-19 social media
infodemic. Sci Rep 2020 Oct 06;10(1):16598. [doi: 10.1038/s41598-020-73510-5] [Medline: 33024152]
29. Frenkel S, Alba D, Zhong R. Surge of virus misinformation stumps Facebook and Twitter. The New York Times. 2020
Mar 08. URL: https://nyti.ms/2AI5Ylw [accessed 2020-08-27]
30. Shimizu K. 2019-nCoV, fake news, and racism. Lancet 2020 Feb 29;395(10225):685-686 [FREE Full text] [doi:
10.1016/S0140-6736(20)30357-3] [Medline: 32059801]
31. Jang K, Baek YM. When information from public health officials is untrustworthy: the use of online news, interpersonal
networks, and social media during the MERS outbreak in South Korea. Health Commun 2019 Aug;34(9):991-998. [doi:
10.1080/10410236.2018.1449552] [Medline: 29558170]
32. Oxford Analytica. Misinformation will undermine coronavirus responses. Expert Briefings 2020:1. [doi:
10.1108/oxan-db250989]
33. Pennycook G, McPhetres J, Bago B, Rand DG. Predictors of attitudes and misperceptions about COVID-19 in Canada, the
UK, and the USA. psyArXiv. Preprint posted online April 14, 2020 [FREE Full text]
34. Zhou J, Yang S, Xiao C, Chen F. Examination of community sentiment dynamics due to Covid-19 pandemic: a case study
from Australia. arXiv. Preprint posted online June 22, 2020 [FREE Full text]
35. Imran AS, Daudpota SM, Kastrati Z, Batra R. Cross-cultural polarity and emotion detection using sentiment analysis and
deep learning on COVID-19 related tweets. IEEE Access 2020;8:181074-181090. [doi: 10.1109/access.2020.3027350]
36. Chen E, Lerman K, Ferrara E. Tracking Social Media Discourse About the COVID-19 Pandemic: Development of a Public
Coronavirus Twitter Data Set. JMIR Public Health Surveill 2020;6(2):e19273 [FREE Full text] [doi: 10.2196/19273]
[Medline: 32427106]
37. Wang LL, Lo K, Chandrasekhar Y, Reas R, Yang J, Eide D, et al. CORD-19: the Covid-19 Open Research Dataset. arXiv.
Preprint posted online April 22, 2020 [FREE Full text] [Medline: 32510522]
38. Blei DM, Ng AY, Jordan MI. Latent Dirichlet allocation. J Machine Learning Res 2003;3:993-1022.
39. Missier P, Romanovsky A, Miu T, Pal A, Daniilakis M, Garcia A, et al. Tracking dengue epidemics using Twitter content
classification and topic modelling. In: Casteleyn S, Dolog P, Pautasso C, editors. Current Trends in Web Engineering ICWE
2016 International Workshops, DUI, TELERISE, SoWeMine, and Liquid Web, Lugano, Switzerland, June 6-9, 2016.
Revised Selected Papers. Cham: Springer; 2016:80-92.
40. Miller M, Banerjee T, Muppalla R, Romine W, Sheth A. What are people tweeting about zika? An exploratory study
concerning its symptoms, treatment, transmission, and prevention. JMIR Public Health Surveill 2017 Jun 19;3(2):e38
[FREE Full text] [doi: 10.2196/publichealth.7157] [Medline: 28630032]
41. Lazard AJ, Scheinfeld E, Bernhardt JM, Wilcox GB, Suran M. Detecting themes of public concern: a text mining analysis
of the Centers for Disease Control and Prevention's Ebola live Twitter chat. Am J Infect Control 2015 Oct
01;43(10):1109-1111. [doi: 10.1016/j.ajic.2015.05.025] [Medline: 26138998]
42. Sesagiri Raamkumar A, Tan SG, Wee HL. Measuring the outreach efforts of public health authorities and the public response
on Facebook during the COVID-19 pandemic in early 2020: cross-country comparison. J Med Internet Res 2020 May
19;22(5):e19334 [FREE Full text] [doi: 10.2196/19334] [Medline: 32401219]
43. Han X, Wang J, Zhang M, Wang X. Using social media to mine and analyze public opinion related to COVID-19 in China.
Int J Environ Res Public Health 2020 Apr 17;17(8):2788 [FREE Full text] [doi: 10.3390/ijerph17082788] [Medline:
32316647]
44. Abd-Alrazaq A, Alhuwail D, Househ M, Hamdi M, Shah Z. Top concerns of tweeters during the COVID-19 pandemic:
infoveillance study. J Med Internet Res 2020 Apr 21;22(4):e19016 [FREE Full text] [doi: 10.2196/19016] [Medline:
32287039]
45. Medford RJ, Saleh SN, Sumarsono A, Perl TM, Lehmann CU. An “Infodemic”: leveraging high-volume Twitter data to
understand public sentiment for the COVID-19 outbreak. medRxiv. Preprint posted online April 7, 2020. [doi:
10.1101/2020.04.03.20052936]
46. Yin H, Yang S, Li J. Detecting topic and sentiment dynamics due to Covid-19 pandemic using social media. In: Yang X,
Wang CD, Islam MS, Zhang Z, editors. Advanced Data Mining and Applications. ADMA 2020. Lecture Notes in Computer
Science, vol 12447. Cham: Springer; 2021:610-623. [doi: 1007/978-3-030-65390-3_46]
https://www.jmir.org/2021/3/e23272 J Med Internet Res 2021 | vol. 23 | iss. 3 | e23272 | p. 15
(page number not for citation purposes)
XSL• FO
RenderXJOURNAL OF MEDICAL INTERNET RESEARCH Park et al
47. Shahrezaye M, Meckel M, Steinacker L, Suter V. COVID-19's (mis) information ecosystem on Twitter: how partisanship
boosts the spread of conspiracy narratives on German speaking Twitter. arXiv. Preprint posted online September 27, 2020
[FREE Full text]
48. Ognyanova K, Lazer D, Robertson RE, Wilson C. Misinformation in action: fake news exposureis linked to lower trust in
media, higher trust in government when your side is in power. Harvard Kennedy Sch Misinformation Rev 2020 Jun 2:1.
[doi: 10.37016/mr-2020-024]
49. Shahsavari S, Holur P, Wang T, Tangherlini T, Roychowdhury V. Conspiracy in the time of corona: automatic detection
of emerging COVID-19 conspiracy theories in social media and the news. J Comput Soc Sci 2020 Oct 28:1-39 [FREE Full
text] [doi: 10.1007/s42001-020-00086-5] [Medline: 33134595]
50. Tangherlini TR, Shahsavari S, Shahbazi B, Ebrahimzadeh E, Roychowdhury V. An automated pipeline for the discovery
of conspiracy and conspiracy theory narrative frameworks: Bridgegate, Pizzagate and storytelling on the web. PLoS One
2020;15(6):e0233879 [FREE Full text] [doi: 10.1371/journal.pone.0233879] [Medline: 32544200]
51. Hossain T, Logan IV RL, Ugarte A, Matsubara Y, Young S, Singh S. COVIDLies: detecting COVID-19 misinformation
on social media. 2020 Presented at: 1st Workshop on NLP for COVID-19 (Part 2) at EMNLP 2020; December 2020; Online.
[doi: 10.18653/v1/2020.nlpcovid19-2.11]
52. twintproject / twint. GitHub. URL: https://github.com/twintproject/twint [accessed 2020-08-27]
53. Search tweets. Twitter Developer. URL: https://developer.twitter.com/en/docs/tweets/search/ [accessed 2020-08-27]
54. Cho SE, Park HW. A qualitative analysis of cross-cultural new media research: SNS use in Asia and the West. Quality
Quantity 2012 Jan 10;47(4):2319-2330. [doi: 10.1007/s11135-011-9658-z]
55. Li Y, Wang X, Lin X, Hajli M. Seeking and sharing health information on social media: a net valence model and cross-cultural
comparison. Technological Forecasting Soc Change 2018 Jan;126:28-40. [doi: 10.1016/j.techfore.2016.07.021]
56. Ostrowski DA. Using latent Dirichlet allocation for topic modelling in Twitter. In: Proceedings of the 2015 IEEE 9th
International Conference on Semantic Computing. 2015 Presented at: IEEE ICSC 2015; February 7-9, 2015; Anaheim,
CA. [doi: 10.1109/icosc.2015.7050858]
57. Adiwardana D, Luong MT, So DR, Hall J, Fiedel N, Thoppilan R, et al. Towards a human-like open-domain chatbot. arXiv.
Preprint posted online January 27, 2020 [FREE Full text]
58. Park HW, Park S, Chong M. Conversations and medical news frames on Twitter: infodemiological study on COVID-19
in South Korea. J Med Internet Res 2020 May 05;22(5):e18897 [FREE Full text] [doi: 10.2196/18897] [Medline: 32325426]
59. Shin M, Han S, Park S, Cha M. A risk communication event detection model via contrastive learning. 2020 Presented at:
3rd NLP4IF Workshop on NLP for Internet Freedom: Censorship, Disinformation, and Propaganda; December 2020;
Barcelona, Spain.
60. Yin J, Wang J. A dirichlet multinomial mixture model-based approach for short text clustering. In: Proceedings of the 20th
ACM SIGKDD International Conference on Knowledge Discovery and Data Mining. 2014 Presented at: KDD '14; August
2014; New York, NY p. 233-242. [doi: 10.1145/2623330.2623715]
61. Zhao WX, Jiang J, Weng J, He J, Lim EP, Yan H, et al. Comparing Twitter and traditional media using topic models. In:
Clough P, Foley C, Gurrin C, Jones GJF, Kraaij W, Lee H, et al, editors. Advances in Information Retrieval 33rd European
Conference on IR Research, ECIR 2011, Dublin, Ireland, April 18-21, 2011. Proceedings. Berlin, Heidelberg: Springer;
2011:338-349.
62. Weng J, Lim EP, Jiang J, He Q. TwitterRank: finding topic-sensitive influential twitterers. In: Proceedings of the Third
ACM International Conference on Web Search and Data Mining. 2010 Presented at: WSDM '10; February 2010; New
York, NY p. 261-270. [doi: 10.1145/1718487.1718520]
63. Papakyriakopoulos O, Medina Serrano JC, Hegelich S. The spread of COVID-19 conspiracy theories on social media and
the effect of content moderation. Harvard Kennedy Sch Misinformation Rev 2020 Aug 17:1. [doi: 10.37016/mr-2020-034]
64. Krause NM, Freiling I, Beets B, Brossard D. Fact-checking as risk communication: the multi-layered risk of misinformation
in times of COVID-19. J Risk Res 2020 Apr 22;23(7-8):1052-1059. [doi: 10.1080/13669877.2020.1756385]
65. Kim H, Walker D. Leveraging volunteer fact checking to identify misinformation about COVID-19 in social media. Harvard
Kennedy Sch Misinformation Rev 2020 May 18:1. [doi: 10.37016/mr-2020-021]
Abbreviations
GT: ground truth
LDA: latent Dirichlet allocation
RQ: research question
SARS: severe acute respiratory syndrome
https://www.jmir.org/2021/3/e23272 J Med Internet Res 2021 | vol. 23 | iss. 3 | e23272 | p. 16
(page number not for citation purposes)
XSL• FO
RenderXYou can also read