Influence of Rearing Environment on Longitudinal Brain Development, Object Recognition Memory, and Exploratory Behaviors in the Domestic Pig Sus ...
←
→
Page content transcription
If your browser does not render page correctly, please read the page content below
ORIGINAL RESEARCH
                                                                                                                                                  published: 24 March 2021
                                                                                                                                            doi: 10.3389/fnins.2021.649536

                                            Influence of Rearing Environment on
                                            Longitudinal Brain Development,
                                            Object Recognition Memory, and
                                            Exploratory Behaviors in the
                                            Domestic Pig (Sus scrofa)
                                            Joanne E. Fil 1 , Sangyun Joung 1 , Courtney A. Hayes 2 and Ryan N. Dilger 1,3,4*
                                            1
                                              Neuroscience Program, University of Illinois, Urbana, IL, United States, 2 College of Veterinary Medicine, University
                                            of Illinois, Urbana, IL, United States, 3 Department of Animal Sciences, University of Illinois, Urbana, IL, United States,
                                            4
                                              Division of Nutritional Sciences, University of Illinois, Urbana, IL, United States

                                            Introduction: Over the last 40 years, the domestic pig has emerged as a prominent
                                            preclinical model as this species shares similarities with humans with regard to immunity,
                                            gastrointestinal physiology, and neurodevelopment. Artificial rearing of pigs provides a
                           Edited by:       number of advantages over conventional rearing (i.e., true maternal care), including
                    Anthony LaMantia,       careful control of nutrient intake and environment conditions. Yet there remains a
          Virginia Tech, United States
                                            gap in knowledge when comparing brain development between sow-reared and
                       Reviewed by:
                   Erik Sean Carlson,       artificially reared domestic pigs. Thus, our research sought to model brain development
           University of Washington,        and assess recognition memory in a longitudinal manner by directly comparing
                        United States
                       Sofia Lizarraga,
                                            rearing environments.
         University of South Carolina,
                                            Methods: Forty-four intact (i.e., not castrated) male pigs were artificially reared or
                        United States
                                            sow-reared from postnatal day 2 until postnatal week 4. After postnatal week 4, all
                  *Correspondence:
                         Ryan N. Dilger     pigs were housed in a group setting within the same environment until postnatal
                   rdilger2@illinois.edu    week 24. Magnetic resonance imaging was conducted on pigs at 8 longitudinal time-
                                            points to model developmental trajectories of brain macrostructural and microstructural
                   Specialty section:
         This article was submitted to      outcomes. Additionally, pigs behavior were tested using the novel object recognition
                   Neurodevelopment,        task at postnatal weeks 4 and 8.
               a section of the journal
            Frontiers in Neuroscience       Results: Throughout the 24-week study, no differences between rearing groups were
         Received: 05 January 2021          noted in weekly body weights, average growth and feed intake patterns, or feed
          Accepted: 04 March 2021
         Published: 24 March 2021
                                            efficiency. Whole brain, gray matter, white matter, and cerebrospinal fluid growth
                              Citation:
                                            patterns also did not differ between pigs assigned to different early-life rearing
        Fil JE, Joung S, Hayes CA and       environments. Moreover, minimal differences in regional absolute volumes and fractional
 Dilger RN (2021) Influence of Rearing
                                            anisotropy developmental trajectories were identified, though artificially reared pigs
    Environment on Longitudinal Brain
     Development, Object Recognition        exhibited higher initial rates of myelination in multiple brain regions compared with sow-
  Memory, and Exploratory Behaviors         reared pigs. Furthermore, behavioral assessment at both PNW 4 and 8 suggested little
      in the Domestic Pig (Sus scrofa).
           Front. Neurosci. 15:649536.
                                            influence of rearing environment on recognition memory, however, an age-dependent
      doi: 10.3389/fnins.2021.649536        increase in object recognition memory was observed in the sow-reared group.

Frontiers in Neuroscience | www.frontiersin.org                                      1                                             March 2021 | Volume 15 | Article 649536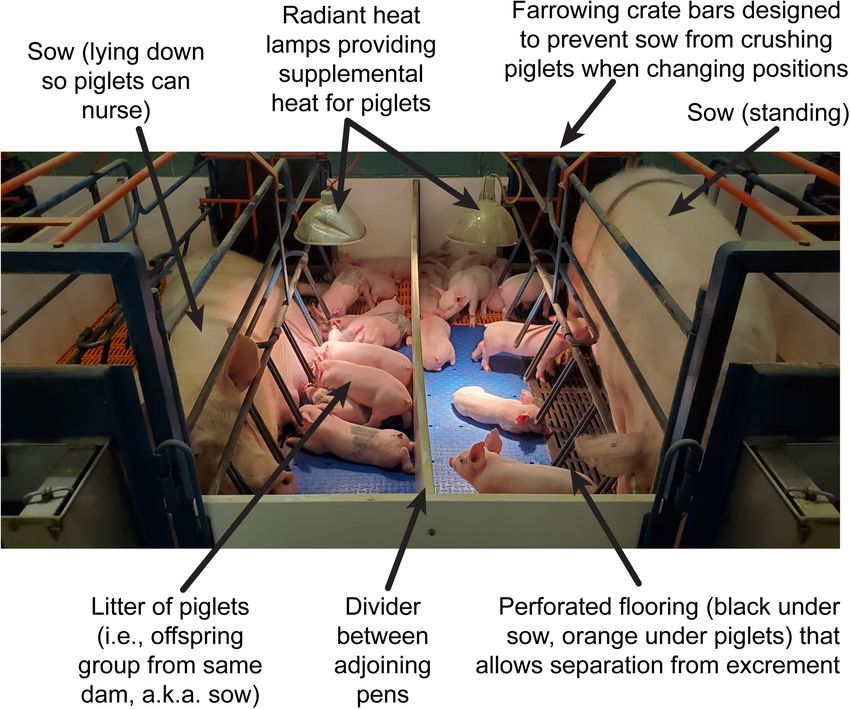
Fil et al.                                                                                                                  Brain Development of Domestic Pigs

                                            Conclusion: Our findings suggest that early-life rearing environment influences the rate
                                            of development in some brain regions but has little influence on overall brain growth
                                            and object recognition memory and exploratory behaviors in the domestic pig. Artificial
                                            rearing may promote maturation in certain brain areas but does not appear to elicit
                                            long-term effects in outcomes including brain structure or object recognition memory.
                                            Keywords: pig, brain, neurodevelopment, behavior, magnetic resonance imaging, modeling, Gompertz,
                                            longitudinal

INTRODUCTION                                                                              Changes in social and physical environments induce stress
                                                                                       in any species, including the pig, and studies have been
Preclinical animal models are crucial for addressing biological                        conducted to evaluate whether artificial rearing influences pig
processes occurring in humans and provide an advantage in                              development and behavior. Most studies focus on pig health
enabling invasive techniques to be used for investigating tissue                       and performance, as artificial rearing has become a strategy to
development. The pig is a noteworthy preclinical model in                              manage large litters that are beyond the rearing capacity of
a variety of fields, including those related to nutrition and                          a sow (Baxter et al., 2013). Behavioral analyses have revealed
development, as they resemble humans in morphology and                                 greater incidence of belly nosing (Rzezniczek et al., 2015;
functionality of multiple biological processes (Swindle et al.,                        Schmitt et al., 2019) in AR pigs compared with SR pigs, in
1994; Sciascia et al., 2016; Mudd and Dilger, 2017). Similarly                         addition to other negative behaviors, some of which include
to humans, the pig brain develops perinatally and exhibits                             aggression toward other pigs (Rzezniczek et al., 2015) and
a peak growth rate around the time of birth (Dobbing and                               more frequent oral manipulation of conspecific tails and ears
Sands, 1979; Pond et al., 2000). Additionally, macrostructure                          (Schmitt et al., 2019).
of the pig brain resembles human brain morphology in gyral                                As pigs continue to be an important preclinical model for
patterning (Dickerson and Dobbing, 1967; Lind et al., 2007),                           neuroscience-related research, we aimed to evaluate the influence
brain regions (Saikali et al., 2010), and distribution of gray                         of early-life rearing environment on longitudinal brain structural
matter (GM) and white matter (WM) (Dickerson and Dobbing,                              development and behavior. Our null hypothesis was that no
1967; Lind et al., 2007), thereby reinforcing the pig as an ideal                      differences in brain development would exist between AR and SR
model for neuroscience-related studies. Indeed, pigs have been                         pigs. To test this hypothesis, the brain developmental patterns of
used to model traumatic brain injury (Kinder et al., 2019),                            absolute volume and myelination were evaluated longitudinally
stroke (Wagner et al., 1999), and the influence of nutrition on                        utilizing various magnetic resonance imaging (MRI) sequences
neurodevelopment (Mudd et al., 2018; Fil et al., 2019).                                and novel object recognition task was preformed to evaluate
   Artificial rearing is a useful method to implement for                              recognition memory.
interventions that require careful monitoring of the subject’s
dietary intake or control of environment without sibling and
maternal influence. This rearing environment involves raising                          MATERIALS AND METHODS
animals in specialized enclosures that provide ready access to
resources meeting nutritional, physiological, environmental, and                       Animals
social needs of the pig. By maintaining close control over                             Pregnant sows were obtained from a commercial swine farm
the environment and contact with other subjects, researchers                           (Carthage Veterinary Services, Carthage, IL) and transferred to
utilizing artificially reared (AR) animals can reduce variability                      the Veterinary Medicine Research Farm located at the University
within the research population, thereby providing greater                              of Illinois at Urbana-Champaign 1 week prior to the farrowing
statistical power in experiments. Moreover, the pig is an ideal                        (i.e., pig-specific term for giving birth). Sows were provided
animal model to artificially rear because they can be maintained                       15 mg of Matrix (Merck Animal Health/Intervet Inc., Madison,
starting at birth and exhibit growth rates comparable to sow-                          NJ) daily per os for 2–4 days prior to the expected farrowing
reared (SR) pigs (Braude et al., 1983; Cabrera et al., 2010). This is                  date and injected with 0.7 mL of Estrumate (250 µg/ml; Merck
unlike rodents, which experience higher rates of mortality when                        Animal Health/Intervet Inc., Madison, NJ) one day before the
reared artificially (Henare et al., 2008), potentially due to multiple                 expected farrowing date to synchronize farrowing events between
factors, including any invasive surgery and the associated                             sows. Once sows farrowed, pigs were provided with a single
stress and anxiety experienced while in those environments                             dose of prophylactic antibiotic [5.0 mg/kg body weight (BW);
(Yasuda et al., 2016).                                                                 Excede, Zoetis, Kalamazoo, MI] and iron dextran (200 mg per
                                                                                       pig; Uniferon 200, Pharmacosmos, Inc., Watchung, NJ) within
Abbreviations: AR, Artificially reared; BIC, Bayesian information criterion; BW,       the first 24 h of birth.
body weight; DTI, diffusion tensor imaging; TE, echo time; FA, fractional                  Pigs were allowed access to colostrum for up to 48 h and before
anisotropy; GM, gray matter; MRI, magnetic resonance imaging; MWF, myelin
                                                                                       being assigned to either SR or AR treatment groups, representing
water fraction; NOR, novel object recognition; PND, postnatal day; PNW,
postnatal week; TR, repetition time; SR, sow-reared; SSFP, steady-state free           the two rearing environments tested in this study. From postnatal
precession; WM, white matter.                                                          day (PND) 2 to 28, pigs either remained with their littermates

Frontiers in Neuroscience | www.frontiersin.org                                    2                                    March 2021 | Volume 15 | Article 649536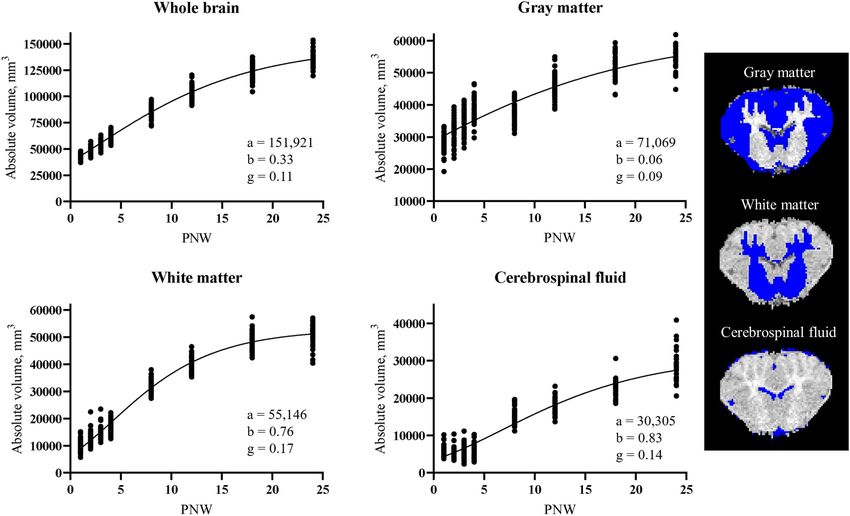
Fil et al. Brain Development of Domestic Pigs
and dam (i.e., the sow; SR group) or were transported to the access to liquid milk replacer using an automated delivery system
Piglet Nutrition and Cognition Laboratory and artificially reared that dispensed milk from 1000 h to 0600 h the next day (20-
(AR group). Regardless of early-life rearing environment, all pigs h daily feeding cycle). Milk replacer was reconstituted fresh
received two doses of Clostridium perfringens antitoxins C and D daily at 200 g of dry powder per 800 g of tap water. Daily
(one 5 mL dose given subcutaneously and one 3 mL dose given weights of individual pigs and their respective milk reservoirs
orally; Colorado Serum Company, Denver, CO) as a prophylactic were recorded. The remaining volume of milk was subtracted
measure on PND 2 to avoid incidence of enterotoxemia that from the initial volume provided to quantify milk disappearance
sometimes occurs in young pigs. The experiment was completed over the 20-h feeding period, which will henceforth be referred
at postnatal week (PNW) 24 (i.e., approximate age of sexual to as milk intake. SR pigs (n = 13) only had access to maternal
maturity for pigs; Reiland, 1978) using 4 cohorts of pigs selected milk (i.e., no other sources of nutrition were accessible) through
from 15 total litters (i.e., 3 or 4 sows per cohort) to control for PNW 4. Once all animals were transitioned to group-housing
initial BW and genetics for a total of 44 pigs completing the at the Veterinary Medicine Research Farm after PNW 4, both
study. All animals and experimental procedures were conducted AR and SR pigs were maintained on a common series of
in accordance with the National Research Council Guide for industry-standard, nutritionally adequate diets through PNW
the Care and Use of Laboratory Animals and approved by the 24 (i.e., study conclusion). Thus, the only difference between
University of Illinois at Urbana-Champaign Institutional Animal AR and SR pigs was that the rearing environment (including
Care and Use Committee. diet) differed from PND 2 to PNW 4, with all factors being
equalized thereafter.
Housing
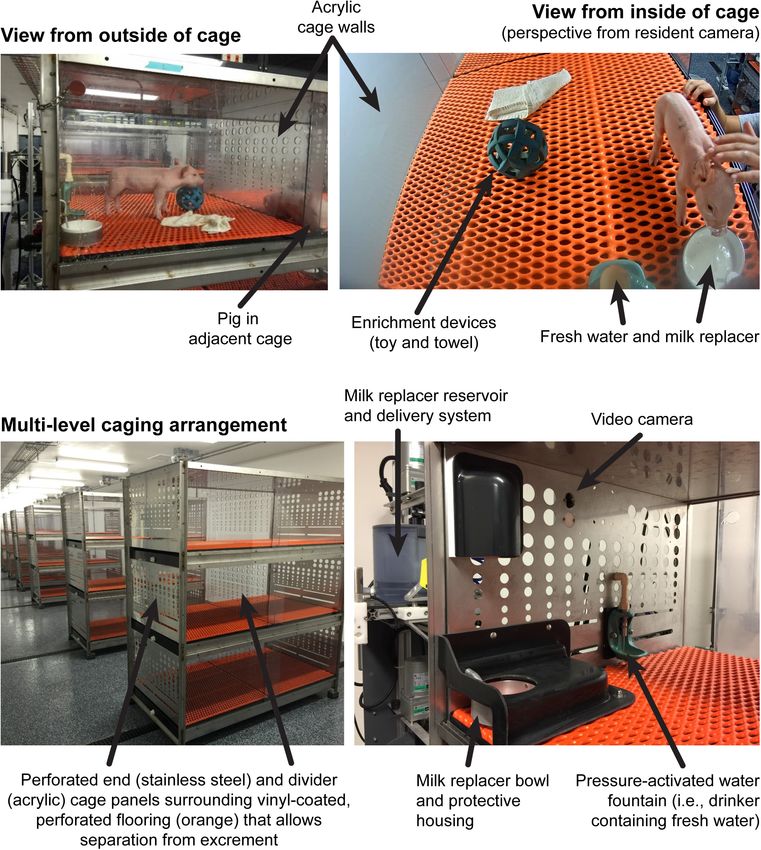
Through PNW 4, AR pigs were housed individually in custom Magnetic Resonance Imaging
rearing units (87.6 cm long, 88.9 cm wide, 50.8 cm high), which Pigs underwent MRI procedures at 1, 2, 3, 4, 8, 12, 18,
were composed of three acrylic walls, one stainless steel wall, and and 24 weeks of age at the Beckman Institute for Advanced
vinyl-coated, expanded-metal flooring. This caging environment Science and Technology (University of Illinois, Urbana, IL)
allowed pigs to see, hear, and smell, but not touch, neighboring Biomedical Imaging Center using a MAGNETOM Prisma 3T
pigs (Figure 1). Each pig was provided a toy for enrichment MRI scanner (Siemens; Munich, Germany). A custom 8-channel
in their home-cage and were allowed to physically interact with head coil designed for young pigs was used through PNW 4
one another for approximately 15 min each day. Lights were (Rapid Biomedical; Rimpar, Germany) and 32-channel spine
automatically controlled (12-h cycle, on from 0800 h to 2000 h) and 18-channel flex coils (Siemens; Munich, Germany) were
with ambient temperature set at 26.6◦ C for the first 21 days of used for scans occurring from PNW 8–24. Upon arrival to the
the study and gradually lowered to 22◦ C during the last 7 days of imaging facility, pigs were anesthetized using a combination of
housing at the Piglet Nutrition and Cognition Laboratory. telazol:ketamine:xylazine [50.0 mg tiletamine plus 50.0 mg of
All SR pigs remained with their respective dam and littermates zolazepam reconstituted with 2.50 mL ketamine (100 g/L) and
in farrowing crates at the Veterinary Medicine Research Farm 2.50 mL xylazine (100 g/L); Fort Dodge Animal Health, Overland
through PNW 4, per standard agricultural practices (Figure 2). Park, KS] by i.m. injection at 0.03 mL/kg BW. Once anesthetized,
This rearing environment (i.e., a university-owned swine facility) pigs were placed in a supine position in the MRI machine and
was maintained at a constant 22◦ C with a light cycle identical to kept under sedation by inhalation of isoflurane (0.6–2.0% using
that of AR pigs (12-h cycle, on from 0800 h to 2000 h). Daily a progressive dosing regimen based on pig BW) with the balance
health assessments of all AR and SR pigs were recorded through as pure oxygen throughout the entire procedure (total scan time
PNW 4 to track incidence of diarrhea, lethargy, weight loss, was approximately 75-min per session).
or vomiting as clinical indicators. After PNW 4, AR pigs were Oxygen saturation levels and heart rate were monitored using
transported back to the originating farm (Veterinary Medicine two pulse oximeters (LifeWindow LW9x, Boynton Beach, FL
Research Farm) and were group-housed with SR pigs (3–4 pigs and MEDRAD Veris 8600, Indianola, PA) each with an infrared
per pen) until PNW 8 in age-appropriate, raised deck pens (1.219 sensor that was clipped on the pig’s tail and/or left-hind hoof.
m × 1.219 m; vinyl-coated, expanded metal flooring, with one Observational records of heart rate, partial pressure of oxygen,
nipple drinker and 4-hole feeder per pen; ad libitum access to and percent of isoflurane were recorded every 5 min after
feed). After PNW 8, all pigs were moved to larger pens (1.676 anesthetic induction. The pig neuroimaging protocol included
m × 3.658 m; solid concrete floors with one nipple drinker and a magnetization prepared rapid gradient-echo sequence and
feed provided twice-daily per pen (feed amount based on pig age diffusion tensor imaging (DTI) to assess brain macrostructure
and pen group weight), with pigs remaining in the same group as and microstructure, respectively. The multicomponent driven
beginning at PNW 4. equilibrium single pulse observation of T1 and T2 technique
was used to measure myelin-associated water fraction (MWF).
Feeding Procedures Imaging techniques are described in greater detail below.
All AR pigs (n = 31) received a custom bovine milk-based milk
replacer formula (TestDiet, Richmond, IN) formulated to meet Structural MRI Acquisition and Analysis
all nutritional requirements for the young pig (National Research A T1-weighted a magnetization prepared rapid gradient-echo
Council, 2012) from PND 2 to PNW 4 (see Table 1 for nutrient sequence was used to obtain anatomic images of the pig brain
composition of milk replacer). As such, AR pigs had ad libitum throughout the 24-wk study. The following sequence-specific
Frontiers in Neuroscience | www.frontiersin.org 3 March 2021 | Volume 15 | Article 649536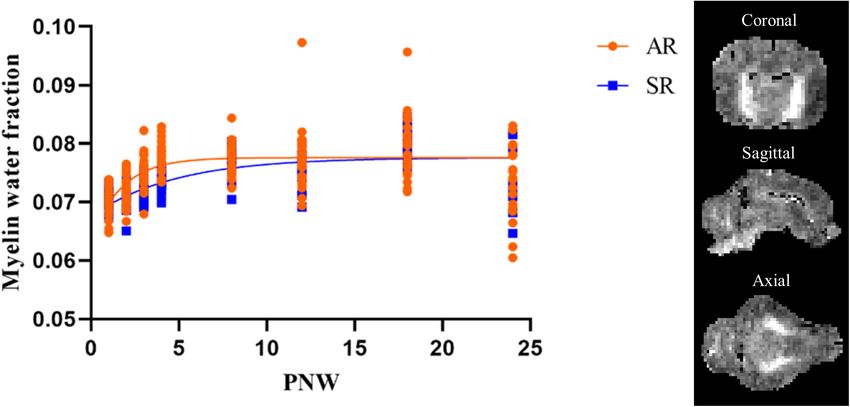
Fil et al.                                                                                                                           Brain Development of Domestic Pigs

  FIGURE 1 | Visual description of the artificial rearing (AR) environment. This context includes individual pigs each housed in a dedicated cage with ad libitum access
  to fresh water and milk replacer and no competition for resources. Pigs are able to see, hear, and smell, but not directly touch, neighboring pigs through the clear,
  acrylic divider between cages on the same vertical level, as well as other pigs in adjacent caging units. Whereas, young pigs have difficulty with thermoregulation due
  to low body fat stores, the ambient AR environment is maintained at optimal temperatures and relatively humidity levels for each age of pig. Pigs raised in the AR
  environment are handled by human caretakers at least twice daily, which is why AR pigs appear less anxious relative to SR pigs when exposed to experimental
  procedures. Whereas, AR pigs are technically raised in their own space, their ability to engage with other pigs both in their home-cage and during daily communal
  activity periods mean they are not socially isolated and still receive attention from caregivers in the absence of natural maternal care.

parameters were used to acquire T1-weighted a magnetization                             of the snout to the cervical/thoracic spinal cord junction in pigs
prepared rapid gradient-echo data through PNW 4: repetition                             through PNW 4, and was 1.0 mm isotropic in pigs from PNW
time = 2000.0 ms; echo time = 2.05 ms; inversion time = 1,060 ms,                       8–24. Detailed image processing and volume estimation methods
flip angle = 9◦ , matrix = 288; slice thickness = 0.6 mm.                               has been previously described (Fil et al., 2021).
Parameters for pigs from PNW 8–24 were as follows: repetition
time = 2060.0 ms; echo time = 1.71 ms; inversion time = 1,060 ms,                       Myelin Water Fraction Acquisition and Analysis
flip angle = 9◦ , matrix = 256; slice thickness = 1.0 mm The final                      The multicomponent driven equilibrium single pulse observation
voxel size was 0.6 mm isotropic across the entire head from the tip                     of T1 and T2 technique was used to measure myelin-associated

Frontiers in Neuroscience | www.frontiersin.org                                     4                                            March 2021 | Volume 15 | Article 649536
Fil et al. Brain Development of Domestic Pigs
TABLE 1 | Nutrient composition of milk replacer.
Nutrient Value
Energy and macronutrients
Energy, kcal/g 4.26
Carbohydrate, % 34.30
Fat, % 39.10
Protein, % 26.60
Minerals
Ash, % 6.50
Calcium, % 1.68
Phosphorus, % 0.78
Phosphorus (available), % 0.76
Potassium, % 0.95
Magnesium, % 0.09
Sulfur, % 0.24
Sodium, % 0.76
Chloride, % 1.00
Fluorine, ppm 12.30
FIGURE 2 | Visual description of the sow-reared (SR) environment. This
context includes an individual dam (i.e., sow) housed within a farrowing (i.e., Iron, ppm 142.00
porcine-specific term for giving birth) crate that is designed to prevent the sow Zinc, ppm 103.00
from crushing piglets when changing to a lying position. Within the outer area Manganese, ppm 47.00
of the pen, all pigs within a litter (i.e., group of piglets all born to the same Copper, ppm 19.00
dam) engage directly with each other and with the dam, including competition
Cobalt, ppm 0.62
between littermates for access to teats when obtaining milk as the sole source
of nutrition, including water. Pigs in this rearing environment are also exposed Iodine, ppm 1.18
to excrement and bodily fluids from both the dam and littermates, which has Chromium (added), ppm 0.02
implications on development of the microbiota. In this context, it is impossible Selenium, ppm 0.30
to discern how a dietary intervention will individual piglets as there is no Vitamins
control over access to milk availability or a way for development of
Vitamin A, IU/g 3.00
heterogeneous microbiota. Additionally, the phenotypic behavioral traits of SR
pigs include a clear tendency to run away from human caregivers (i.e., Vitamin D-2 (added), IU/g 6.70
relatively high apparent anxiety compared with artificially reared pigs) as there Vitamin E, IU/kg 330.00
is limited human interaction on a routine basis. Vitamin K, ppm 5.00
Thiamin, ppm 3.00
Riboflavin, ppm 13.20
Niacin, ppm 60.00
water fraction throughout the brain of pigs to provide insight
Pantothenic acid, ppm 30.00
into brain myelination patterns. For pigs 4 weeks and younger,
Folic acid, ppm 0.90
a constant 7.0 × 10.8 × 14.7 mm3 sagittally oriented field of
Pyridoxine, ppm 3.00
view with 160 × 160 × 125 imaging matrix was used, providing
Biotin, ppm 0.30
a voxel volume of 1.7 × 1.7 × 2.6 mm3 . The spoiled gradient
Vitamin B-12, mcg/kg 110.00
echo and T2 /T1 – weighted balanced steady-state free precession
Choline chloride, ppm 1700.00
(SSFP) data were acquired with the following sequence-specific
Ascorbic acid, ppm 49.20
parameters: spoiled gradient echo, echo time (TE)/repetition
time (TR) = 2.7 ms/5.6 ms; receiver bandwidth = 350 Hz/voxel;
and SSFP, TE/TR flip angles = 2.6 ms/5.3 ms; receiver
bandwidth = 350 Hz/voxel. For pigs older than 4 weeks, including a change in the threshold used for imaging data
a constant 4.1 × 5.4 × 31.5 mm3 sagittally oriented field collected for the pig.
of view with 260 × 260 × 240 imaging matrix was used,
providing a voxel volume of 2.7 × 2.7 × 3.0 mm3 . The Diffusion Tensor Imaging Acquisition and Analysis
spoiled gradient echo and SSFP data were acquired with the DTI was used to assess WM maturation and axonal tract integrity
following sequence-specific parameters: spoiled gradient echo, using a diffusion-weighted echo planar imaging sequence with
TE/ TR = 2.7 ms/5.6 ms; receiver bandwidth = 350 Hz/voxel; and the following parameters for pigs aged 4 weeks and younger:
SSFP, TE/TR = 2.6 ms/5.3 ms; receiver bandwidth = 350 Hz/voxel. repetition time = 5,100 ms; echo time = 70 ms; generalized auto-
Two sets of SSFP data were acquired with phase-cycling calibrating partially parallel acquisitions accelerated by a factor
increments of both 0◦ and 180◦ to allow for correction of of 2 in the phase encode direction; diffusion weightings = 1,000
main magnetic field (i.e., off-resonance) artifacts. Processing of and 2,000 s/mm2 across 30 directions; 1 image with a b-value of 0
MWF data was performed using methods described previously s/mm2 . Fifty slices with a 1.6 mm thickness were collected with a
(Deoni et al., 2011) with modifications to the sequence only matrix size of 100 × 100 for a final voxel size of 1.6 mm isotropic.
Frontiers in Neuroscience | www.frontiersin.org 5 March 2021 | Volume 15 | Article 649536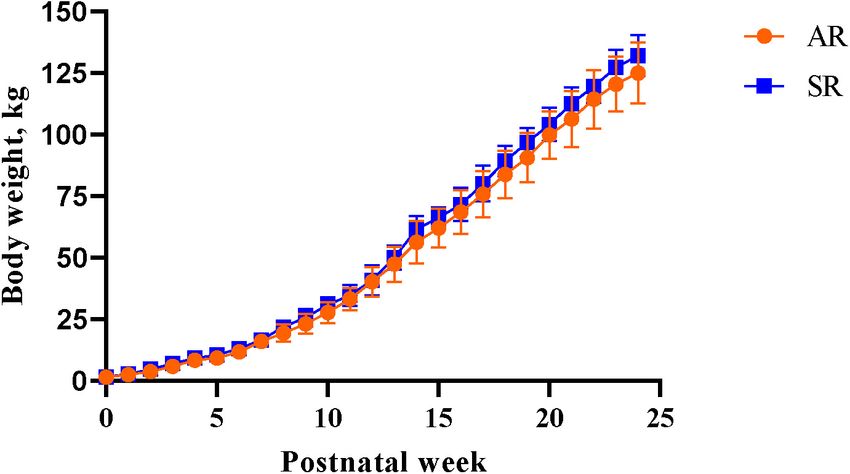
Fil et al.                                                                                                              Brain Development of Domestic Pigs

In pigs older than 4 weeks, the parameters were as follows:               Statistical Analysis
repetition time = 5,600 ms; echo time = 70 ms; generalized auto-          All statistical models included replicate and litter as random
calibrating partially parallel acquisitions accelerated by a factor       effects and the level of significance was set at P < 0.05. Growth
of 2 in the phase encode direction; diffusion weightings = 1,000          and milk intake data for each individual pig was subjected to an
and 2,000 s/mm2 across 30 directions; 1 image with a b-value              Analysis of Variance using SAS 9.3 (SAS Inst. Inc., Cary, NC).
of 0 s/mm2 . Fifty-four slices with a 2.0 mm thickness was                Data for growth and milk intake was analyzed as a repeated-
collected with a matrix size of 130 × 130 for a final voxel size          measures Analysis of Variance also using the MIXED procedure,
of 2.0 mm isotropic.                                                      and exploratory behavior was analyzed as a two-way Analysis
    Diffusion-weighted echo planar imaging images were assessed           of Variance with the age and rearing system as main effects. To
in the FMRIB Software library (Jenkinson et al., 2012) to generate        assess recognition memory, the recognition index was compared
values of fractional anisotropy (FA) using methods previously             to a chance performance value of 0.50 using a one-sample t-test.
described (Fil et al., 2021). Assessment was performed over
the following regions of interest: both caudate nuclei, corpus            Brain Macrostructure and Microstructure Modeling
callosum, cerebellum, both hippocampi, both internal capsules,            Absolute volume, FA, and MWF developmental models were
left and right sides of the brain, thalamus, DTI-generated WM,            constructed for each brain area in each pig using the
and atlas-generated WM. This assessment was performed using a             NLMIXED method in SAS 9.3. Parameter estimations were
customized analysis pipeline designed for the pig and the FMRIB           computed for nine different sigmoid-type models. The growth
Software library package described in Fil et al. (2021). In the           models of Gompertz (Gompertz, 1825), Bleasdale and Nelder
corresponding results, atlas-generated WM indicated the use of            (Bleasdale and Nelder, 1960), Richards (Richards, 1959),
WM prior probability maps from the pig brain atlas that were              Stannard (Stannard et al., 1985), a modified Gompertz from Dean
used as a region of interest mask. Likewise, DTI-generated WM             et al. (Dean et al., 2014), two different logistic functions (Conrad
indicated a threshold of 0.2 should be applied to FA values, thus         et al., 2012; Dean et al., 2014), the generalized logistic, and the
restricting analysis to WM tracts only.                                   hyperbolic tangent were all fitted. The Bayesian information
                                                                          criterion (BIC) was measured for each model in each ROI. The
Behavioral Testing                                                        BIC is a criterion for model selection where the lowest BIC
Novel object recognition (NOR), described in detail previously            is preferred because unexplained variation in the dependent
(Fleming and Dilger, 2017), was used to assess recognition                variable and the number of explanatory variables increase the
memory as a primary indicator of cognitive behavior of the                value of BIC (Schwarz, 1978). The Gompertz (Figure 3) was
pig. Testing consisted of a habituation phase, a sample phase,            chosen as the best model to use for absolute volume, MWF, and
and a test phase. During the habituation phase, each pig was              FA data because it had the best BIC value across all brain regions
placed in an empty testing arena for 10 min for 2 days                    using the highest ranked sum (Supplementary Tables 1–3).
leading up to the sample phase. In the sample phase, two                      The Gompertz model was parameterized as follows:
identical objects were placed in the arena and pigs were given
5 min for exploration. After a delay of 48 h, the test phase                       Outcome = a ∗ exp(−1 ∗ exp(b − g ∗ PNW))
as conducted where pigs were returned to the arena, which                 where the outcome was either absolute volume, MWF, or FA, and
contained one object from the sample phase as well as a novel             PNW indicated postnatal week (i.e., age of the pig). Parameter
object. Between trials, objects were removed, immersed in hot             estimations for each outcome were computed for maximum
water with detergent, and rubbed with a towel to mitigate                 absolute (i.e., plateau) value (a), onset of initial developmental
odor while the arena was sprayed with water to remove urine
and feces. Objects chosen had a range of characteristics (i.e.,
color, texture, shape, and size), however, the novel and sample
objects only differed in shape and size. Only objects previously
shown to elicit a null preference were used for testing. The
NOR task was completed at two different time-points, PNW
4 and 8. At PNW 4, the habituation trial began at PND
24, and the testing trial at PND 28. At PNW 8, habituation
trials began at PND 52, and the testing trial began at PND
56. However, not all pigs that completed the NOR task at
PNW 4 were able to complete the task at PNW 8, due to
failure to thrive. The object set used for each time-point
was different and counterbalanced. Recognition index, or the
proportion of time spent investigating the novel object compared
with the total exploration time of both objects, was compared
to a chance performance value of 0.50 to assess recognition
                                                                           FIGURE 3 | Properties of the Gompertz model. Parameters indicate
memory. Values greater than 0.50 were interpreted as being
                                                                           maximum (i.e., plateau) value (a), age at initial onset of tissue development (b),
indicative of a novelty preference, thus suggesting pigs exhibited         and overall rate of tissue development (g).
recognition memory.

Frontiers in Neuroscience | www.frontiersin.org                       6                                             March 2021 | Volume 15 | Article 649536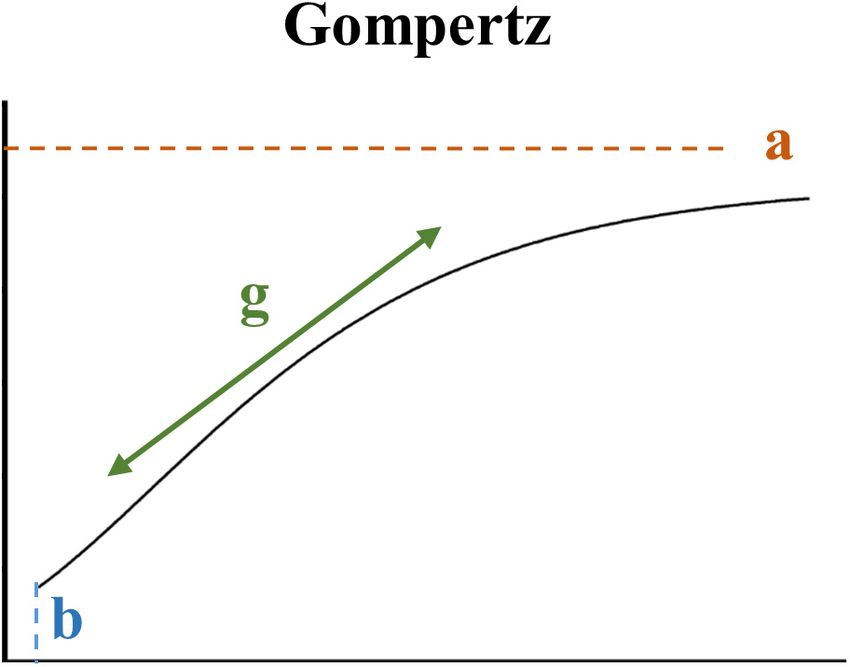
Fil et al.                                                                                                                              Brain Development of Domestic Pigs

increase (b), and overall rate of development (g). A two-sample                          TABLE 2 | Growth and feeding performance on milk replacer (PND 3–28) and feed
                                                                                         (PNW 5–24)a .
t-test was conducted in SAS 9.3 to compare individual modeled
parameter estimates between SR and AR pigs.                                                                                             Diet                   Pooled

                                                                                         Measure                                  AR            SR      SEM        P-valueb
RESULTS                                                                                  PNW 1–4
                                                                                         ADG, kg/day                            0.257          0.276   0.015         0.167
Growth Performance and Feed Intake                                                       ADFI, kg liquid milk replacer/day      1.377            –        –             –
Body Weight and Feed Intake                                                              G:F, kg BW:kg liquid milk replacer     0.187            –        –             –
A main effect of PND was observed for daily BW (P < 0.001),                              PNW 5–24
meaning that there was an active growth phase over the study                             ADG, kg/day                            0.811          0.913   0.059         0.153
period. There was no main effect of rearing environment on                               ADFI, kg solids/day                    4.323          4.492   0.187         0.368
BW (P > 0.05) indicating that all pigs gained a similar amount                           G:F, kg BW:kg solids                   0.175          0.204   0.016         0.127
of weight over time, regardless of the rearing environment                               a ADG,  average daily gain; ADFI, average daily feed intake; AR, artificially reared
(Figure 4). A main effect of PNW on feed intake was observed,                            pigs; BW, body weight; G:F, gain to feed; PND, postnatal day; PNW, postnatal
where pigs consumed more feed (P < 0.001) as the study                                   week; SEM, standard error of the mean; SR, sow-reared pigs.
                                                                                         b P-values derived from a repeated-measures mixed model ANOVA comparing pigs
progressed. Regardless of early-life rearing environment, all pigs
consumed the same amount of feed (P > 0.05) over the latter                              raised in different early-life rearing environments.

part of the study.

Growth and Feed Performance                                                              in the pons occurred earlier (P < 0.05) in SR pigs than AR
Effects of rearing environment on average daily gain, average                            pigs. AR pigs had higher (P < 0.05) overall rate of MWF
daily feed intake, and gain-to-feed ratio are presented in Table 2.                      development in the cerebellum, combined cortex, left internal
No differences between rearing environments were observed                                capsule, left putamen-globus pallidus, midbrain, pons, right
for any measure.                                                                         cortex, right hemisphere, thalamus, and whole brain. Figure 6
                                                                                         presents the slight variation in the developmental curve of
                                                                                         the whole brain when overall rate of MWF development
Brain Analysis
                                                                                         differs. The parameter estimates for all regions are presented
Absolute Volumes
                                                                                         in Table 4.
Most absolute volume parameter estimates were not different
due to rearing environment, including whole brain, GM, WM,
and cerebrospinal fluid volumes (Figure 5). The only significant                         Fractional Anisotropy
differences observed was a higher (P < 0.05) overall rate of                             All pigs had similar estimates for maximum FA values and onset
development in the left olfactory bulb and right and left cortex                         of initial developmental increase, but SR pigs had a higher overall
of SR pigs than AR pigs. Parameter estimates for all regions can                         rate of increase of FA in the right internal capsule compared with
be found in Table 3.                                                                     AR pigs (P < 0.05). Parameter estimates for all regions can be
                                                                                         found in Table 5.
Myelin Water Fraction
Rearing environment did not influence maximum mean MWF
for pigs in either rearing environment, but the onset of MWF                             Behavioral Outcomes
                                                                                         Overall, neither AR nor SR pigs at PNW 4 exhibited novelty
                                                                                         preference (P > 0.05). At PNW 8, only SR pigs demonstrated
                                                                                         a novelty preference, (P < 0.05) whereas AR pigs did not
                                                                                         (P > 0.05; Figure 7). Pig exploratory behavior of all objects
                                                                                         during the test trial of the novel object recognition task can
                                                                                         be found in Table 6, while exploratory behavior of just the
                                                                                         novel object and sample object is presented in Supplementary
                                                                                         Tables 4, 5, respectively. While there was no rearing and age
                                                                                         interaction effect observed for recognition index, SR pigs at
                                                                                         PNW 8 exhibited higher recognition index compared with SR
                                                                                         pigs at PNW 4, illustrating better recognition memory at PNW
                                                                                         8 (Figure 8). Age and interaction effects were observed for
                                                                                         the total time spent exploring the novel object (P < 0.05;
                                                                                         Supplementary Table 4). The SR pigs at PNW 8 spent
                                                                                         more time (P < 0.05) exploring the novel object compared
  FIGURE 4 | Weekly body weights of artificially reared pigs and sow-reared
                                                                                         with other treatment groups. No other exploratory behavior
  pigs from postnatal day 2 until postnatal week 24. AR, artificially reared pigs;
  BW, body weight; PNW, postnatal week; SR, sow-reared pigs.
                                                                                         measurements were dissimilar between the four treatment groups
                                                                                         (P > 0.05).

Frontiers in Neuroscience | www.frontiersin.org                                      7                                             March 2021 | Volume 15 | Article 649536
Fil et al. Brain Development of Domestic Pigs
FIGURE 5 | Developmental patterns of absolute volume in (A) whole brain, (B) gray matter, (C) white matter, and (D) cerebrospinal fluid in pigs. Parameters indicate
maximum (i.e., plateau) value (a), age at initial onset of tissue development (b), and overall rate of tissue development (g). Rearing environment did not influence
developmental patterns, therefore data from artificially reared pigs and sow-reared pigs were combined. Coronal brain slices displaying gray matter, white matter,
and cerebrospinal fluid tissue in blue. PNW, postnatal week.
DISCUSSION pigs. Furthermore, early-life rearing environment minimally
influenced the patterns of FA development. Aside from SR pigs
Artificially rearing pigs is a proven technique for investigations illustrating better recognition memory at PNW 8 than PNW
requiring precise control over environmental factors, including 4, there were also minimal differences in behavioral outcomes
dietary interventions. However, scientific evidence is needed to between the two rearing groups.
determine the extent of influence exerted by early-life rearing
environment on growth, behavior, and overall development of Brain Macrostructural Assessment
the pig. Therefore, we aimed to evaluate developmental patterns The pig is known to be one of the most appropriate regularly
of brain macrostructure and microstructure, as well as functional used preclinical models for human infants regarding brain
capacity measured using recognition memory, to examine the development because its brain growth spurt, the period of growth
influence of early-life rearing environment. The artificial rearing when the brain is growing most rapidly, extends from the late
environment utilized in the current study involved individually prenatal to early postnatal period (Dobbing and Sands, 1979).
housing pigs comfortably in custom rearing units with unlimited Specifically, the most rapid period of brain growth (in terms of
access to milk replacer and allowed pigs to see, hear, and smell brain weight) for the pig was noted to occur from about 50 days
neighboring pigs from PND 2 to PNW 4. Thus, resulting in a before birth to about 40 days after birth (Dickerson and Dobbing,
physical but not social isolation. Pigs that were reared by the 1967). Comparably, the whole brain’s absolute volume for AR
sow remained in farrowing crates with their respective dam and and SR pigs continually increased throughout the 24 week study
littermates through PNW 4, per standard agricultural practices. period, but, in agreement with the aforementioned study, a rapid
Overall, no differences in longitudinal growth performance period of growth, indicated by a steep slope of the developmental
outcomes were noted between SR and AR pigs. The absolute curve, was present during the first 5 weeks of age (i.e., 35 days)
volume developmental patterns for whole brain, GM, WM, and (Figure 3A). Early-life rearing environment did not influence
cerebrospinal fluid also did not differ due to early-life rearing the development of major tissue types within the brain, as
environment and few differences in regional macrostructure were whole brain, GM, WM, and cerebrospinal fluid absolute volume
observed between the two groups. Maximum MWF did not developmental patterns did not differ between AR and SR pigs.
differ between AR and SR pigs, but some regions exhibited The maximum whole brain volume for the pig was estimated
higher overall rates of MWF development in AR than SR to be around 152,000 mm3 (Table 3), indicating a 3.5-fold
Frontiers in Neuroscience | www.frontiersin.org 8 March 2021 | Volume 15 | Article 649536Fil et al. Brain Development of Domestic Pigs
TABLE 3 | Brain region-specific parameter estimates for absolute volumes generated using the Gompertz modela .
AR SR Pooled SEM P-valueb
ROI Parameterc a b g a b g a b g a b g
Whole brain 151089.61 0.34 0.11 153903.08 0.32 0.11 4997.735 0.015 0.007 0.576 0.059 0.667
Gray matter 69604.52 0.08 0.11 72534.30 0.04 0.07 8589.139 0.180 0.045 0.733 0.805 0.315
White matter 53922.68 0.77 0.17 56369.77 0.74 0.17 1392.552 0.033 0.009 0.116 0.355 0.985
Cerebrospinal fluid 30667.48 0.86 0.13 29942.62 0.80 0.14 2884.166 0.040 0.015 0.782 0.132 0.308
Cerebral aqueduct 80.68 0.03 0.10 73.15 −0.09 0.08 12.047 0.135 0.051 0.536 0.380 0.479
Corpus callosum 1505.90 0.42 0.08 1625.90 0.41 0.10 333.400 0.068 0.016 0.721 0.906 0.226
Cerebellum 26643.50 0.47 0.09 23953.70 0.51 0.10 6700.800 0.092 0.018 0.690 0.651 0.626
Fourth ventricle 211.60 −0.05 0.06 176.80 −0.05 0.07 42.549 0.166 0.009 0.279 0.986 0.245
Hypothalamus 389.00 0.36 0.10 434.80 0.43 0.11 42.842 0.040 0.013 0.292 0.106 0.491
Left caudate 1095.20 0.27 0.06 1263.80 0.28 0.08 258.000 0.105 0.013 0.599 0.939 0.421
Left cortex 45716.40 0.40 0.10 45043.70 0.37 0.14 2781.800 0.116 0.013 0.764 0.704 0.013
Left hippocampus 1458.70 0.44 0.08 1315.20 0.43 0.10 227.700 0.060 0.014 0.439 0.843 0.279
Left inferior colliculus 382.30 0.48 0.07 424.20 0.46 0.08 59.245 0.091 0.014 0.484 0.796 0.420
Left internal capsule 2246.40 0.33 0.08 2336.10 1.30 −0.01 414.200 0.641 0.078 0.868 0.349 0.471
Left olfactory bulb 3805.20 0.43 0.11 3721.50 0.43 0.14 388.700 0.097 0.015 0.775 0.980 0.011
Left putamen-globus pallidus 759.80 0.33 0.06 679.10 0.31 0.08 154.400 0.106 0.015 0.604 0.839 0.189
Left superior colliculus 898.20 0.46 0.07 941.30 0.45 0.08 163.100 0.080 0.013 0.793 0.975 0.276
Lateral ventricle 2030.70 0.36 0.07 2088.50 2.73 2.06 409.400 1.531 1.256 0.888 0.343 0.333
Medulla 6267.00 0.63 0.09 5610.70 0.72 0.10 1324.200 0.136 0.017 0.476 0.620 0.584
Midbrain 6118.80 0.34 0.09 6499.20 0.37 0.10 258.400 0.038 0.009 0.149 0.471 0.711
Pons 4101.10 0.51 0.09 5598.90 0.49 0.11 991.600 0.098 0.013 0.322 0.824 0.153
Right caudate 1485.60 0.38 0.06 1159.10 0.28 0.07 424.000 0.111 0.015 0.318 0.384 0.384
Right cortex 44509.30 0.40 0.10 45076.90 0.35 0.13 2725.700 0.118 0.013 0.836 0.481 0.019
Right hippocampus 1372.30 0.50 0.08 1458.40 0.41 0.09 281.000 0.114 0.013 0.761 0.343 0.191
Right inferior colliculus 476.20 0.53 0.06 491.50 0.45 0.08 95.504 0.093 0.015 0.902 0.357 0.165
Right internal capsule 2107.90 0.32 0.08 1981.60 0.26 0.10 234.100 0.056 0.013 0.593 0.281 0.086
Right olfactory bulb 3663.90 0.37 0.13 3755.30 0.45 0.13 499.800 0.100 0.065 0.856 0.468 0.978
Right putamen-globus pallidus 576.30 0.26 0.07 535.10 0.26 0.09 74.025 0.091 0.012 0.581 0.97 0.138
Right superior colliculus 840.50 0.41 0.08 788.50 0.42 0.08 143.500 0.083 0.015 0.719 0.899 0.772
Thalamus 3474.80 0.33 0.06 3631.40 0.36 0.06 347.000 0.145 0.010 0.655 0.833 0.749
a AR, artificially reared pigs; ROI, region of interest; SEM, standard error of the mean; SR, sow-reared pigs.
b P-values derived from two-sample t-test comparing pigs raised in different early-life environments and group-housed in a common setting starting at postnatal week 4.
Significant P-values are shown in bold text for emphasis.
c Parameter estimations for each outcome were computed for maximum absolute (i.e., plateau) value (a), onset of initial developmental increase (b), and overall rate of
development (g).
increase in whole brain volume from the 44,000 mm3 volume 24 (Figure 5B) while WM almost reaches its estimated maximum
at PNW 1 (Figure 5A). Accordingly, pig whole brain absolute volume at PNW 24 (Figure 5C). This suggests that GM continues
volume at birth was around 28% of the adult volume. This to increase through sexual maturity (i.e., approximately 24-weeks
coincides with conclusions from previous work that stated the of age; Reiland, 1978), whereas WM is fully developed around
brain weight of the pig at birth to be 25% of its adult brain weight sexual maturity in the pig.
(Dobbing and Sands, 1979). However, the current estimated Regional absolute volume developmental trajectories were
maximum volume is larger than previous estimates of maximum similar between AR and SR pigs, with the exception of the left
whole brain volume of the pig (Conrad et al., 2012). The olfactory bulb and the left and right cortex that displayed a
discrepancy in estimates is most likely due to the combination higher overall rate of development in SR pigs than AR pigs.
of utilizing different models to estimate the parameters, with a Thus, indicating that the rate of reaching the mature volume
Gompertz model being applied in the current study and a logistic of the left olfactory bulb and left and right cortex was faster
model utilized previously (Conrad et al., 2012) and from using an in SR pigs than AR pigs. The faster rate of absolute volume
updated pig brain atlas in the current study (Fil et al., 2021). The development of the olfactory bulb may indicate more use of
estimated maximum volume of GM and WM was around 71,000 olfaction by SR pigs than AR pigs. In the Y-maze paradigm,
and 55,000 mm3 , respectively (Table 3). Interestingly, GM is pigs were found to be most attracted to the odors specific to
around three-fourths of the estimated maximum volume at PNW their mother (i.e., skin secretions and maternal feces) while
Frontiers in Neuroscience | www.frontiersin.org 9 March 2021 | Volume 15 | Article 649536Fil et al. Brain Development of Domestic Pigs
FIGURE 6 | Myelin water fraction developmental pattern for the whole brain in artificially reared and sow-reared pigs. A distinct increase in myelin water fraction is
evident during PNW 1–4 indicating a high period of myelination during early-life. Artificially reared pigs exhibited higher rates of myelin water fraction development
than sow-reared pigs, however, that did not influence long-term development as plateau myelin water fraction estimates were similar between both groups. Myelin
water fraction brain slices from one pig are presented in three different orthogonal views. AR, artificially reared pigs; PNW, postnatal week; SR, sow-reared pigs.
milk and colostrum were found to be neutral olfactory stimuli throughout 120–140 days post-conception, or 1–3 weeks after
(Morrow-Tesch and McGlone, 1990b). Moreover, when pigs birth (Pond et al., 2000). Likewise, Sweasey et al. (1976)
experienced olfactory deprivation by anesthetization of the observed biphasic myelination of the pig brain, where myelin was
olfactory epithelium, complete disruption of nipple attachment estimated by daily increases in tissue cerebroside concentrations.
of baby pigs was observed (Morrow-Tesch and McGlone, 1990a). They observed myelination peaks at two occurrences, 2 weeks
The SR pigs live in a competitive environment, where they must before birth and 3 weeks after birth (Sweasey et al., 1976).
find and defend access to a preferential teat before a stable MWF developmental patterns for AR and SR pigs from the
teat order is formed (De Passille et al., 1988). Thus, specific current study presented comparable outcomes, as there was
compounds produced by the sow modulate nipple attachment a distinct increase in whole brain MWF from PNW 1–4, as
and may indicate which teats have been used most and therefore is visually evident from the increased slope in Figure 6. The
contain the most milk and nutrition. AR pigs had unlimited whole brain, along with several other ROI, exhibited higher
access to milk and may not have utilized the olfactory system as rates of MWF development in AR pigs than SR pigs (Table 4).
greatly as SR pigs, therefore resulting in a slower rate of absolute Indeed, AR pigs had a faster rate of MWF development than
volume development of the left olfactory bulb. Although the rate SR pigs in the cerebellum, left putamen and globus-pallidus,
of development differed between groups in the three regions, and midbrain, regions responsible for motor movement (Llinás
overall volume growth did not differ as the maximum absolute and Welsh, 1993; Marchand et al., 2008; Hosp et al., 2011;
volumes of all regions were the same. Thus, higher growth rate Hegeman et al., 2016). Moreover, the left internal capsule,
did not necessarily influence absolute volume later in life. thalamus, and the pons, brain areas responsible for relaying
sensory and motor signals (Basso et al., 2005; Brodal, 2014;
Brain Microstructural Assessment Emos and Agarwal, 2020), had accelerated MWF development
Brain microstructure developmental patterns were assessed in AR pigs than SR pigs. Myelin formation can be regulated
utilizing MWF and FA outcomes. The brain parenchyma has two by activity to help adapt brain function to an environmental
micro-anatomical water pools, one that is associated with the stimuli (Mount and Monje, 2017; Bechler et al., 2018). Thus,
water bound within the myelin sheath lipid bilayers and one that the increased rate of MWF development suggests that the
is associated with the water inside and outside the myelinated observed regions were more active in the AR environment
axon. MWF is the quantified myelin-bound water signal and its than the SR environment. A direct cause of the observed
trends correlate to histological patterns of myelination (Deoni accelerated rates of MWF development cannot be determined,
et al., 2011, 2012). Therefore, MWF is a surrogate measure of as early-life rearing environment differed in more than one
myelin and assists in providing insight into myelination patterns. factor including nutritional composition, ad libitum milk access
Moreover, it most accurately represents myelin trends in areas through an automatic feeding system, and human-based care.
with high volumes of white matter. Previous work by Pond However, we speculate that the faster maturation of myelin
et al. (2000) had evaluated myelin development in the pig by development in regions responsible for motor movement and
examining cholesterol accretion. They observed a curvilinear relaying sensory and motor signals may be related to differences
increase in cholesterol accretion from 70 to 140 days post- in oral feeding or management paradigms. The sucking reflex
conception, with a rapid rise in velocity of cholesterol accretion is an innate behavior expressed by mammals immediately after
Frontiers in Neuroscience | www.frontiersin.org 10 March 2021 | Volume 15 | Article 649536Fil et al. Brain Development of Domestic Pigs
TABLE 4 | Brain region-specific parameter estimates for myelin water fraction generated using the Gompertz modela .
AR SR Pooled SEM P-valueb
ROI Parameterc a b g a b g a b g a b g
Corpus callosum 0.24 −0.36 0.29 0.12 −0.57 0.26 0.107 0.281 0.099 0.072 0.280 0.827
Cerebellum 2.64 5.97 2.77 0.16 −3.85 1.04 4.097 12.513 1.186 0.333 0.222 0.039
Combined cortex 0.17 −1.02 0.31 0.12 −0.98 0.15 0.116 0.269 0.056 0.523 0.892 0.001
Combined hippocampus 0.10 −0.73 0.33 0.12 −0.67 0.27 0.033 0.147 0.056 0.554 0.711 0.346
Combined internal capsule 0.57 −0.35 0.28 0.36 −0.42 0.16 0.391 0.331 0.115 0.458 0.842 0.173
Hypothalamus 2.04 1.98 0.46 0.21 −0.45 0.54 3.031 3.018 0.324 0.334 0.205 0.849
Left cortex 0.21 −0.57 0.34 0.10 −0.86 0.13 0.144 0.811 0.169 0.206 0.573 0.062
Left hemisphere 0.12 −6.06 1.27 0.09 −1.34 0.15 0.040 8.875 1.250 0.245 0.393 0.159
Left hippocampus 0.31 −0.30 0.30 0.16 −0.72 0.27 0.173 0.332 0.095 0.212 0.110 0.623
Left inferior colliculus 2.15 14.72 8.01 0.14 −2.83 1.28 3.136 25.488 7.454 0.306 0.272 0.153
Left internal capsule 0.26 −0.28 0.41 0.60 −0.03 0.13 0.160 0.380 0.178 0.109 0.436 0.024
Left olfactory bulb 0.10 −3.93 8.93 0.09 5.34 5.95 0.057 6.651 3.883 0.853 0.254 0.447
Left putamen globus-pallidus 2.77 6.60 0.32 0.49 −0.01 0.13 4.082 11.219 0.122 0.369 0.344 0.028
Left superior colliculus 0.19 15.3 1.49 0.10 −0.67 0.59 0.098 24.494 0.908 0.108 0.296 0.134
Medulla 2.41 14.97 7.56 0.09 −1.86 5.40 3.790 29.193 1.734 0.326 0.357 0.118
Midbrain 0.13 −0.01 1.10 0.20 −1.00 0.44 0.063 1.017 0.399 0.462 0.145 0.024
Pons 2.69 15.90 12.12 0.08 −16.41 3.03 3.614 24.413 4.958 0.250 0.040 0.008
Right cortex 0.07 −4.12 0.35 0.14 −0.93 0.17 0.051 4.924 0.058 0.260 0.300 0.004
Right hemisphere 0.09 −1.19 0.53 0.21 −1.04 0.23 0.058 0.244 0.110 0.222 0.619 0.008
Right hippo 0.10 −0.76 0.32 0.09 −0.74 0.30 0.021 0.116 0.052 0.624 0.816 0.633
Right inferior colliculus 0.17 0.19 2.88 0.12 1.77 3.09 0.096 3.336 1.090 0.379 0.460 0.846
Right internal capsule 0.42 −0.19 0.20 0.34 −0.64 0.26 0.176 0.270 0.087 0.663 0.105 0.485
Right olfactory bulb 0.10 −2.62 6.53 0.10 101.90 4.89 0.048 60.775 2.337 0.899 0.317 0.486
Right putamen globus-pallidus 0.41 −0.10 0.21 0.24 −0.47 0.14 0.151 0.277 0.089 0.159 0.190 0.312
Right superior colliculus 0.11 −0.41 0.59 0.94 −0.48 0.33 0.502 0.392 0.179 0.333 0.832 0.054
Thalamus 0.19 −0.64 0.25 0.15 −0.62 0.14 0.100 0.186 0.054 0.594 0.930 0.012
Whole brain 0.13 −0.39 0.56 0.15 −2.55 0.10 0.065 2.257 0.167 0.852 0.343 0.001
a AR, artificially reared pigs; ROI, region of interest; SEM, standard error of the mean; SR, sow-reared pigs.
b P-values derived from two-sample t-test comparing pigs raised in different early-life environments and group-housed in a common setting starting at postnatal week 4.
Significant P-values are shown in bold text for emphasis.
c Parameter estimations for each outcome were computed for maximum absolute (i.e., plateau) value (a), onset of initial developmental increase (b), and overall rate of
development (g).
birth. However, AR pigs had to learn to drink milk from patterns of FA in all regions except a slightly higher rate of
bowls rather than suckling on their mother staring on PND 2. FA increase in the right internal capsule of SR pigs compared
Thus, AR pigs may have experienced differential development with AR pigs. These outcomes contrast a previous study
of specific brain regions to permit development of new ingestive performed by our laboratory that had observed higher average
behaviors. Although AR pigs exhibited an increased myelination WM, left cortex, right cortex, and combined internal capsule
rate during the first few weeks of life, these changes did not FA values in SR pigs compared with AR pigs (Jacob et al.,
influence long-term development because no differences were 2016). The previous cross-sectional study was performed to
observed between AR and SR pigs in terms of the plateau MWF compare MRI outcomes on AR and SR pigs at PNW 3, while
parameter estimate. the current study examined development longitudinally from
Diffusion tensor imaging was performed to generate FA values birth and through sexual maturity, which provides a more
as a measure for microstructural assessment. Similarly to what accurate representation of developmental changes. Thus, the FA
has been observed in domestic pigs previously, FA for all pigs outcomes from the current study suggest that early-life rearing
and regions increased over time, spanning from 0.2 to 0.5 environment might influence some orientation-dependent aspect
(Winter et al., 2011). The WM mask and FA mask estimates, of the microstructure in the right internal capsule that may be
which identified WM by using the WM probability map from due to changes in axon diameter and/or density, membrane
the pig brain atlas and DTI-generated WM, respectively, were permeability, and/or myelination (Beaulieu, 2002; Jones et al.,
similar for AR and SR pigs. Thus, early-life rearing environment 2013). However, this difference in FA was not a lasting effect that
did not influence the overall microstructural developmental could be observed into adulthood, as there were no differences
patterns of WM. AR and SR pigs exhibited similar developmental observed in maximum FA values.
Frontiers in Neuroscience | www.frontiersin.org 11 March 2021 | Volume 15 | Article 649536Fil et al. Brain Development of Domestic Pigs
TABLE 5 | Brain region-specific parameter estimates for fractional anisotropy generated using the Gompertz modela .
AR SR Pooled SEM P-valueb
ROI parameterc a b g a b g a b g a b g
Corpus callosum 0.30 −1.00 1.00 0.30 −1.00 1.00 0.001 0.002 0.001 0.449 0.405 0.748
Cerebellum 0.31 −1.00 1.00 0.31 −1.00 1.00 0.002 0.001 0.001 0.167 0.557 0.745
Left caudate 0.31 −1.00 1.00 0.30 −1.00 1.00 0.002 0.000 0.000 0.858 0.340 0.584
Left hippocampus 0.36 −1.08 1.04 0.37 −1.13 1.12 0.005 0.040 0.042 0.213 0.181 0.160
Left internal capsule 0.31 −1.00 1.00 0.32 −1.01 1.01 0.005 0.001 0.001 0.513 0.405 0.326
Left side 0.52 −1.61 1.75 0.53 −1.37 2.09 0.008 0.294 0.263 0.050 0.287 0.106
Right caudate 0.34 −1.00 1.00 0.35 −1.00 1.00 0.006 0.001 0.002 0.799 0.139 0.355
Right hippocampus 0.30 −1.00 1.00 0.30 −1.00 1.00 0.002 0.000 0.000 0.235 0.093 0.093
Right internal capsule 0.32 −1.00 1.00 0.33 −1.00 1.01 0.008 0.001 0.002 0.081 0.687 0.013
Right side 0.51 −1.52 1.51 0.53 −1.35 2.23 0.008 0.377 0.289 0.090 0.374 0.639
Thalamus 0.37 −1.06 0.98 0.38 −1.04 0.99 0.005 0.024 0.020 0.253 0.150 0.142
FA mask 0.31 −1.00 0.99 0.32 −1.01 1.01 0.003 0.011 0.012 0.052 0.353 0.347
White matter mask 0.37 −1.16 1.12 0.37 −1.23 1.24 0.003 0.069 0.065 0.743 0.266 0.061
a AR, artificially reared pigs; ROI, region of interest; SEM, standard error of the mean; SR, sow-reared pigs.
b P-values derived from two-sample t-test comparing pigs raised in different early-life environments and group-housed in a common setting starting at postnatal week 4.
Significant P-values are shown in bold text for emphasis.
c Parameter estimations for each outcome were computed for maximum absolute (i.e., plateau) value (a), onset of initial developmental increase (b), and overall rate of
development (g).
TABLE 6 | Exploratory behavior of all objects during the test trial of the NOR task1 .
Measurements RI Total object visit Number of all Mean object visit Latency to first Latency to last
time, s object visits, n time, s/visit object visit, s object visit, s
Effect of rearing
AR 0.55 55.1 11.7 4.4 12.8 245.3
SR 0.55 75.8 13.9 5.0 7.7 273.0
SEM 0.050 10.45 1.14 0.73 4.00 13.98
Effect of age
Week 4 0.47 58.9 12.1 4.2 11.3 254.2
Week 8 0.63 71.9 13.4 5.1 9.3 264.1
SEM 0.045 9.49 1.03 0.68 3.70 12.95
Interaction means
AR:Week 4 0.52ab 58.3 11.7 4.4 13.9 235.0
AR:Week 8 0.57ab 51.9 11.6 4.3 11.7 255.6
SR:Week 4 0.42a 59.6 12.5 4.0 8.6 273.4
SR:Week 8 0.68b 92.0 15.3 5.9 6.8 272.7
SEM 0.074 15.74 1.73 1.07 5.76 20.06
P-value2
Rearing 0.949 0.102 0.105 0.475 0.261 0.081
Age 0.010 0.299 0.348 0.277 0.649 0.518
Rearing:Age 0.095 0.122 0.297 0.208 0.968 0.484
ab Superscript letters denote differences between treatment means (P < 0.05).
1 Pigs were reared in an artificial rearing system or with sows for the first 4 weeks of age. After the first 4 weeks of age, both groups were housed together in nursery pens.
AR, artificially reared pigs; RI, recognition index; SEM, standard error of mean; SR, sow-reared pigs.
2 P-values derived from repeated-measures ANOVA for the main effects and the interaction. Significant P-values are shown in bold text for emphasis.
Behavior different time-points using the NOR task. It is important to
NOR is a well-established cognitive task that has been validated consider the relationship between the recognition index and the
in several species including pigs (Fleming and Dilger, 2017) novel object exploration time in order to appropriately interpret
and measures recognition memory as an indicator of cognitive the exploratory behavior outcomes. Recognition index is the
development. In the present study, the effects of early-life rearing proportion of time spent investigating the novel object compared
environment on cognitive development was examined at two to the total exploration time of both objects. Thus, the recognition
Frontiers in Neuroscience | www.frontiersin.org 12 March 2021 | Volume 15 | Article 649536Fil et al. Brain Development of Domestic Pigs
rearing environment. The relationship between latency and time
spent visiting objects to anxiety-related exploratory behavior
in pigs has been speculated previously (Joung et al., 2020),
suggesting that rearing environment had no influence on
anxiety-related behaviors. However, due to the limited NOR
arena size, the current study was restricted to utilize pigs
up to PNW 8. Therefore, further investigations should be
conducted in pigs closer to the age of sexual maturity to
better understand the long-term impact of early-life rearing
environment on the onset of recognition memory improvement
and exploratory behaviors.
Despite a lack of interaction effect between age and
FIGURE 7 | Recognition index during the test trial of the novel object rearing system in recognition memory and minimal differences
recognition task as a measure of recognition memory. The dotted line at 0.50
indicates the chance performance value, and the recognition index greater
in exploratory behaviors, there are some factors that are
than 0.50 indicates a novelty preference, and thus recognition memory. Note inevitably different between artificial rearing and sow-rearing
that an asterisk (*) on the PNW 8 sow-reared group denotes recognition environment. One aspect of the sow-rearing environment is the
memory as the recognition index was greater (P = 0.003) than the chance constant opportunities to exhibit social play, especially between
level (0.50 value). Other groups lacking an asterisk did not exhibit recognition
littermates. Peer play, especially during first weeks of a pig’s life,
memory (P > 0.05). AR, artificially reared pigs; PNW, postnatal week; SR,
sow-reared pigs.
can be very important for behavioral and cognitive development
(Telkänranta and Edwards, 2018). Early-life peer play can help
develop a broad skill set including fine motor and social skills
necessary for behavioral adaptability (Bekoff, 1984). In the
index is highly correlated, but not equal to, the total time spent current study, SR pigs had more opportunities to interact with
exploring the novel object. peers including both littermates and non-littermates, while AR
SR pigs at PNW 8 exhibited more time spent investigating pigs inevitably had limited exposure to their peers by only having
the novel object that translated into expression of novelty sensory but no physical access to neighbor pigs in their home-
preference, which is demonstrated by a recognition index cage environment, and a daily direct and communal playtime of
higher than the chance value of 0.5. Similar findings had been 15 min. Indeed, peer play in pigs begins about 3–5 days old and
observed previously where older pigs exhibited higher novel peaks at 2–6 weeks old, followed by a gradual decrease through
object exploration time and greater exploratory behavior than sexual maturity (Newberry et al., 1988), and pigs that were
younger pigs (Fleming and Dilger, 2017), which indicates that repeatedly separated from the dam and littermates during the first
the NOR performance is age-dependent. Although only SR pigs 2 weeks of life displayed a significant decrease in locomotion and
in the current study exhibited increase in recognition memory, increase in inactivity compared with pigs that were not isolated
the age-dependent rearing effect on recognition memory was (Kanitz et al., 2004). While these findings support that early-
not observed. Most measures of exploratory behaviors such life peer play is important for motor, behavioral, and cognitive
as latency to visit the object, number of object visits, and development, the early-life artificial rearing environment in the
average time visiting objects were not influenced by early-life current study did not include complete social isolation. Although
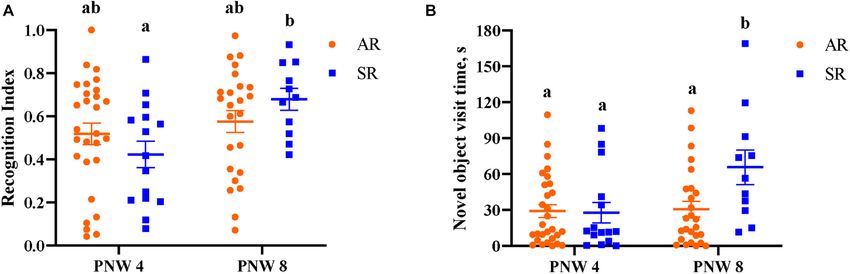
FIGURE 8 | (A) Sow-reared pigs at PNW 4 and PNW 8 displayed difference in recognition index. Eight-week-old sow-reared pigs exhibited higher recognition index
(P = 0.01) than 4-week-old sow-reared pigs, and similar effect of age was not evident in artificially reared pigs. (B) Total novel object visit time was significantly
greater (P = 0.02) in the 8-week-old sow-reared group than other groups. Superscript letters (ab ) denote differences (P < 0.05) between treatment means. AR;
artificially reared pigs; PNW, postnatal week; SR, sow-reared pigs.
Frontiers in Neuroscience | www.frontiersin.org 13 March 2021 | Volume 15 | Article 649536You can also read