NDVI time series analysis for desert locust outbreak detection and quantification analysis of its impact on vegetation productivity of Sahel
←
→
Page content transcription
If your browser does not render page correctly, please read the page content below
Lund University GEM thesis series INES nr 29

 NDVI time series analysis for desert
 locust outbreak detection and
 quantification analysis of its impact
 on vegetation productivity of Sahel

Evangelos Oikonomopoulos

2020
Department of
Physical Geography and Ecosystem Science
Lund University
Sölvegatan 12
S-223 62 Lund
Sweden
ii
NDVI time series analysis for desert locust outbreak
 detection and quantification analysis of its impact on
 vegetation productivity of Sahel

 Evangelos Oikonomopoulos

 Thesis submitted to the department of Physical Geography and Ecosystem
Science, Lund University, in partial fulfilment of the requirements for the degree
 of Master of Science in Geo-information Science and Earth Observation for
 Environmental Modelling and Management (GEM)

 Thesis assessment board:

 Per-Ola Olsson
 Researcher
 &
 Torbern Tagesson
 Researcher

 Exam committee:
 Abdulhakim M. Abdi, Researcher
 Jonas Ardö, Professor

 iii
Disclaimer

This document describes work undertaken as part of a program of study at the University of
Lund. All views and opinions expressed herein remain the sole responsibility of the author and
do not necessarily represent those of the institute.

Course title:
Geo-Information Science and Earth Observation for Environmental Modelling and
Management (Erasmus Mundus: GEM)

Level:
Master of Science (MSc)

Course duration:
January 2019 until June 2019

Consortium partners:

The GEM master program is a cooperation of departments at 5 different universities:
University of Twente, ITC (The Netherlands)
University of Lund (Sweden)
University of Southampton (UK)
University of Warsaw (Poland)
University of Iceland (Iceland)

 iv
Abstract

 It has been shown that the semi-arid environment of the Sahelian belt plays an important
role in the global carbon uptake as the fluctuation of its primary productivity can be determinant
for the global carbon uptake. The insect Schistocerca gregaria commonly known as the desert
locust is a disturbance factor that can affect the vegetation productivity for consecutive seasons.
In this study the detection of the desert locust outbreaks during the 2003-2005 upsurge was
attempted through a Time Series Analysis of seasonal NDVI (small integral) coupled with
detailed field observations. In cases of severely infested pixels the seasonal greenness could
appear to be lower during the suffering season of 2004 compared to the 14-year interannual
average of the pixel examined, indicating that the pixel is infested. At the same time Sahel’s
gross primary productivity (GPP) loss due to the locust outbreak was specified by comparing
modeled gross primary productivity estimations between the outbreak and the non-outbreak
years. The negative impact on primary productivity was also analyzed for the various stages of
locust infestations. The process was based on a z-score statistical analysis while the index of
Rain Use Efficiency was introduced in order to optimize the method. The outcome of the study
showed that the decrease of seasonal NDVI in the infested pixels during the year of the upsurge
is not statistically significant and consequently a relationship between greenness and locust
infestations cannot be established for the development of a detection tool. Secondly, a
significant negative impact on vegetation productivity due to locust outbreaks cannot be
confirmed by analyzing the negative divergence from its interannual average. Furthermore, the
claim that NDVI and GPP would indicate exceptionally low productivity performance during
the year of the upsurge is disproved by the fact that also in years in which the studied pixels
were not infested, those measures demonstrate similarly low behavior. The addition of the RUE
index was not proven successful as it was shown that the RUE was highly regulated by the
fraction’s denominator fluctuation, precipitation. Finally, it has been shown that the negative
impact on productivity and seasonal greenness slightly variates between the different stages of
infestations. The inadequacy to establish relationship between the field observations and the
greenness can be attributed to various factors such as the spatial resolution, the heterogenous
nature of vegetation and the field observation selection criteria and treatment.

 v
vi
Table of Content
List of Abbreviations ................................................................................................................. ix
List of Tables ............................................................................................................................. xi
List of Figures ..........................................................................................................................xiii
1 Introduction ............................................................................................................................. 1
 1.1 General.............................................................................................................................. 1
 1.2 Aims of the study.............................................................................................................. 2
 1.3 Research questions ........................................................................................................... 2
2 Background .............................................................................................................................. 3
 2.1 Sahel’s vegetation productivity ........................................................................................ 3
 2.2 Insect outbreaks disturbances ........................................................................................... 4
 2.3 Desert locust in Sahel ....................................................................................................... 4
 2.3.1 The desert locust ........................................................................................................ 4
 2.3.2 The 2003-2005 locust upsurge in Sahel .................................................................... 5
 2.3.3 Infestation stages ....................................................................................................... 6
 2.4 Remote sensing tools ........................................................................................................ 6
 2.4.1 Insect disturbance monitoring and remote sensing.................................................... 6
3 Materials and Methods ............................................................................................................ 9
 3.1 Introduction ...................................................................................................................... 9
 3.2 Study area ....................................................................................................................... 10
 3.3 Data................................................................................................................................. 11
 3.3.1 Locust field observations ......................................................................................... 11
 3.3.2 Remotely sensed data .............................................................................................. 12
 3.4 Methodology................................................................................................................... 15
 3.4.1 Field data processing ............................................................................................... 15
 3.4.2 Time Series Analysis of NDVI pixel profiles ......................................................... 18
 3.4.3 Rain Use Efficiency Index ....................................................................................... 19
 3.4.4 Pre-processing of gridded data ................................................................................ 20
 3.4.5 Statistical decision criteria (z-score)........................................................................ 21
 3.4.6 NDVI seasonal dynamics ........................................................................................ 23
 3.4.7 Locust infestation stages .......................................................................................... 24
4 Results ................................................................................................................................... 25
 4.1 Impact of the 2004 infestation on the NDVI Small Integral .......................................... 25
 4.2 Impact of the 2004 infestation on the annual GPP ......................................................... 26
 4.3 Impact of the 2004 infestation on the Rain Use Efficiency Index.................................. 29

 vii
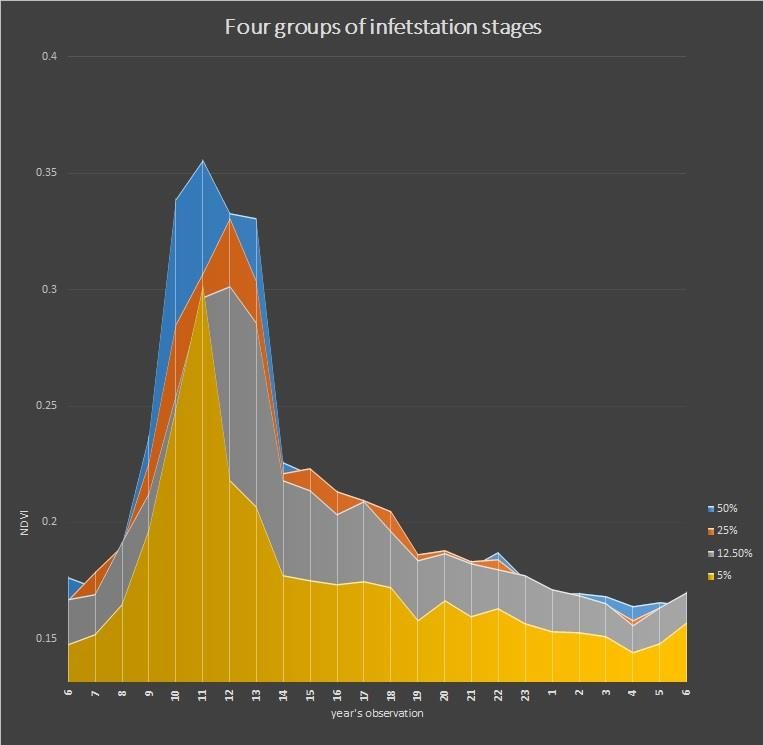
4.4 NDVI seasonal dynamics analysis ................................................................................. 30
 4.5 Locust infestation stages and impact on productivity .................................................... 33
5 Discussion ............................................................................................................................. 35
 5.1 The main findings .......................................................................................................... 35
 5.2 Limitations ..................................................................................................................... 37
6 Conclusions ........................................................................................................................... 39
References ................................................................................................................................ 41

 viii
List of Abbreviations

CHIRPS Climate Hazards Group InfraRed Precipitation with Station data

DS Desert Locust

FAO Food and Agriculture Organization of the United Nations

GPP Gross Primary Production

IS Infestation Stages

MODIS MODerate resolution Imaging Spectroradiometer

NDVI Normalized Difference Vegetation Index

NDVI_SI Normalized Difference Vegetation Index Small Integral

RS Remote Sensing

RUE Rain Use Efficiency Index

RUEGPP GPP-based RUE

RUENDVI NDVI-based RUE

TSA Time Series Analysis

 ix
x
List of Tables

Table 1: Information included into each locust presence field observation report (FAO, 2004)
.................................................................................................................................................. 11

Table 2: Vegetation characteristics expressing productivity and their corresponding statistical
measure (mean annual z-score) ................................................................................................ 22

Table 3: NDVI small integral, GPP, RUENDVI and RUEGPP z-scores in 2004 ........................ 26

Table 4: Impact on vegetation chacteristics per infestatopn stage .......................................... 34

 xi
xii
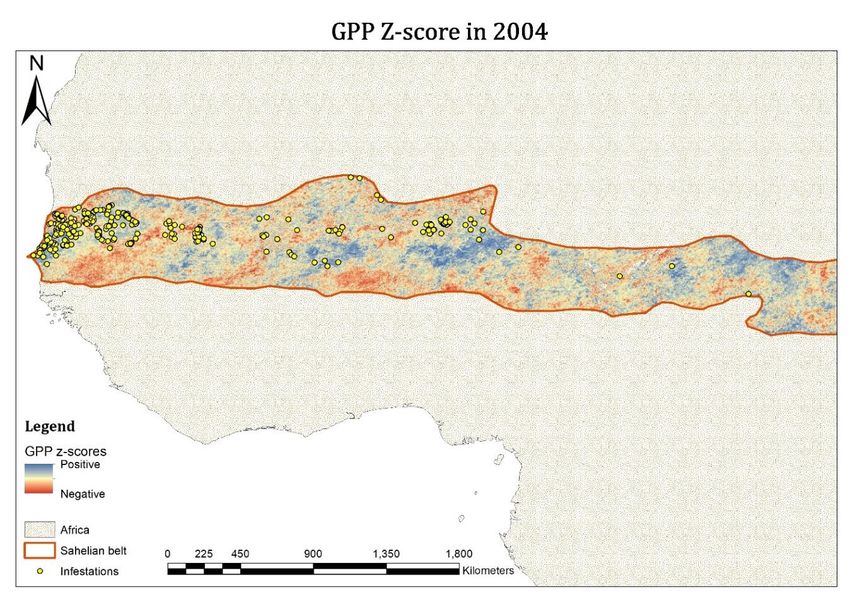
List of Figures

Figure 1: Methodological flow ................................................................................................ 10

Figure 2: Mean gross primary production (GPP) in Sahel and locust infestation distribution in
2004 .......................................................................................................................................... 13

Figure 3: Mean precipitation in Sahel and infestation distribution in 2004 ............................ 14

Figure 4: Z-score and absolute value sequence of NDVI small integral for the 611 infested
pixels......................................................................................................................................... 25

Figure 5: Z-score and absolute GPP sequence for the 611 infested pixels .............................. 27

Figure 6: Map of GPP z-scores in 2004 across the Sahel ........................................................ 28

Figure 7: Z-score sequence of annual RUENDVI and RUEGPP for the 611 infested pixels ....... 29

Figure 8: NDVI seasonal dynamics for (a) the 50% group (b) the 25% group ....................... 30

Figure 9: NDVI seasonal dynamics for (a) the 12.5% group (b) the 5% group ...................... 31

Figure 10: NDVI small integral in 2004 for four stages of infestation (50%, 25%, 12.5% and
5% groups)................................................................................................................................ 32

 xiii
1 Introduction

1.1 General

 The desert locust has been considered a plague since the times of the agricultural
revolution, and it was already mentioned millennia ago in sacred books of civilizations that
flourished around the areas of the Middle East, Africa and Southwestern Asia
(Latchininsky, 2013). In those early agricultural communities, desert locust plagues could
break down the food supply and eliminate their populations, a threat which even today in
the 21st century carries on bringing out the risk of famine. Locust invasions have put in risk
food security in more than sixty countries, from northern Africa to the Arabian Peninsula
covering more than 30 million km2 (Renier et al., 2015). Apart from the crops, it is also the
sparse vegetation that suffered the attacks of folivorous insects affecting its productivity.
The sparse vegetation in these semi-arid environments is one of the planet’s carbon sinks
which serve as important determinants for the inter-annual variability of the global carbon
uptake according to recent studies (Poulter et al., 2014), and it is also shown that they
contribute up to 60% of the long-term trend in the global terrestrial carbon sink (Ahlström
et al., 2015). Thus they play a particularly important role within the dynamics of the global
carbon cycle.
 At the same time, the fact that extensive outbreaks can overwhelm for long time
periods large areas of these ecosystems problematizes the extent of insect disturbances’
influential role in carbon dynamics. This stems from the locust’s ability to affect negatively
the carbon dioxide uptake by destroying the foliage and degrading vegetation’s biomass
productivity during the growing season when the majority of carbon accumulation takes
place (Clark, Skowronski, & Hom, 2010).
 Having an overview of the damage is a challenging task and difficult to achieve by
using only conventional field observation means. Remote sensing is the only feasible tool
for large scale environmental monitoring since it provides spatially explicit observations
collected over large areas at various levels of resolution. Regarding the desert locust,
different methodological approaches have been used, focusing mainly on the insect’s

 1
habitat characteristics and the landscape’s structure but not for assessing an upsurge’s
extent by detecting the damage caused on vegetation (Despland, Rosenberg, & Simpson,
2004; Latchininsky & Sivanpillai, 2010; Pekel et al., 2011; Renier et al., 2015). An
infestation detecting tool for the vast area of the Sahelian belt would allow monitoring of
this major insect disturbance factor, enlightening how such phenomena spread an evolve
(Senf, Seidl, & Hostert, 2017). Furthermore, developing methods for outbreak detection
through remotely sensed vegetation characteristics could lead to the quantification of the
negative impact which they cause on primary productivity, enabling a deeper
understanding of the influences that insect disturbances have on the carbon cycle (P.-O.
Olsson, Heliasz, Jin, & Eklundh, 2017).

1.2 Aims of the study

 This study firstly aims to investigate the potential of time series analysis on remote
sensing imagery for the detection of desert locust outbreaks on the Sahelian belt. Secondly,
it aims to specify any significant vegetation productivity loss by using the most
contemporary GPP product of the region. Finally, to study the impact’s variability on
vegetation productivity caused by different stages of locust infestation development.

1.3 Research questions

The research questions were formulated as follows:
 I. Is it possible to define a relationship between field observed locust infestations and
 remotely sensed vegetation characteristics expressing vegetation productivity?
 II. Does the desert locust have a significant impact on Sahel’s annual gross primary
 production?
III. Do infestations at different stages of development affect vegetation productivity in
 different ways?

 2
2 Background

2.1 Sahel’s vegetation productivity

 Gross Primary Production (GPP) is a measure of vegetation productivity and is
defined as the atmospheric CO2 captured by vegetation at ecosystem scale (Ardo,
Tagesson, Jamali, & Khatir, 2018). It is one of the main drivers of ecosystem services, such
as climate regulation, carbon sequestration and carbon storage (Torbern Tagesson et al.,
2017); therefore, GPP monitoring is crucial for both resource and carbon cycle assessments
(Ardo et al., 2018). Monitoring GPP in semi-arid regions is particularly important, as they
constitute important sinks for fossil fuel emissions and their inter-annual variation impact
the global carbon cycle dynamics (Ahlström et al., 2015; Aredehey, Mezgebu, & Girma,
2018; Le Quere et al., 2018). An improved understanding of how vegetation productivity
relates to the effects of climate change is important in order to explain the global carbon
uptake fluctuation in response to altering environmental conditions (Hickler et al., 2005;
Torbern Tagesson et al., 2017). Consequently, a better understanding of the mechanisms
that regulate this variation would enable the construction of improved and more accurate
models (Senf et al., 2017).
 On a regional scale, the Sahelian ecosystem also provides absolute food dependence
for its inhabitants, whose possibility to import resources is generally limited (L. Olsson,
1993). Around 95% of the food produced in the Sahel is for domestic consumption (Abdi,
Seaquist, Tenenbaum, Eklundh, & Ardo, 2014), sustaining local communities in many
countries, and reaching a population larger than 80 million (Sallaba et al., 2017). Famine
events have emerged in periods of low primary productivity caused either by severe
drought periods (Ibrahim, 1988) or locust plagues (Waldner, Ebbe, Cressman, & Defourny,
2015).

 3
2.2 Insect outbreaks disturbances

 Disturbances are destructive processes that can alter an ecosystem’s condition.
They are considered integral drivers of ecosystem dynamics accelerating natural
regeneration. According to McDowell et al. (2015), “disturbance events occur at a range
of spatial and temporal scales and include wind, fire, drought, floods, insects and
pathogens, harvest, ice, hail, avalanches, and landslides [...] and can occur instantaneously
or over years” (p.115).
Insect outbreaks might particularly occur in different types of biomes, from boreal forests
to semi-arid lands, having a traceable impact on the biogeochemical cycles (Edburg et al.,
2012) and particularly on the carbon cycle (Kurz, Stinson, & Rampley, 2008). Their
quantitative effects on the carbon balance are not, however, well known (Clark et al., 2010;
Hicke et al., 2012; Schafer, Clark, Skowronski, & Hamerlynck, 2010), and so their
potential presence generate an uncertainty in ecosystems’ ability to act as carbon sinks
(Hicke et al., 2012; Kurz et al., 2008).

2.3 Desert locust in Sahel

2.3.1 The desert locust

 The desert locust (Schistocerca Gregaria, Forskål) is considered to be among the
insect species with the greatest impact on the primary productivity of vegetation. Its
frequent outbreaks could escalate to upsurges or plagues that invade large areas. The desert
locust is a short-horned grasshopper of the insect order Orthoptera. It is a defoliator that
feeds on the leaves of any kind of vegetation, and considered one of the most dangerous
migratory insects in the world due to its ability to cross continents and seas and destroy
also the crops (Cressman, 2016; Latchininsky, 2013; Senf et al., 2017; Steedman, 1990).
This is the outcome of a complicated lifestyle strategy related to food availability and
environmental conditions of its habitat. Its major characteristic is that it exhibits a phase
polyphenism in which behavioural, physiological and morphological traits change, due to
variations in the local population density (Uvarov, 1966). Specifically, Cressman (2016)
mentions that “it has the ability to change its behaviour and physiology, in particular its
appearance, in response to environmental conditions, and transform itself from a harmless

 4
solitarious individual to part of a collective mass of insects that form a cohesive swarm”
(p.87). This means that where low population density conditions apply, the individuals
behave solitariously, tending to avoid each other. In cases where the available food is
provided in patches and insects attracted to these localized green areas form dense
populations, they start to behave as a unit and after some time they change also their
morphology. This phenomenon of behavioural and morphological change is described by
the term gregarization (Despland et al., 2004). According to Roffey and Popov (1968),
“the marked increase in locust numbers on a local scale due to concentration,
multiplication, and gregarization, which unless checked, can lead to the formation of
hopper bands and swarms is called an outbreak” (p. 448). In cases of contemporaneous
outbreaks, able to produce two or more generations of gregarious breeding, the
phenomenon escalades to constitute an upsurge (Cressman, 2016).
 Apart from the behavioral phases, desert locust as a grasshopper passes through
various development phases during its life cycle before it becomes fully mature. After the
egg hatching, six larvae or hopper levels follow before fledging, after which the insect is
considered as an adult (Symmons & Cressman, 2001). However adults, the insects in this
level are not biologically fully mature since it takes some time until they become able to
fly and after that some more time in order to be reproductively mature. This entire sequence
of maturity levels can last between 75 and 150 days (Symmons & Cressman, 2001)

2.3.2 The 2003-2005 locust upsurge in Sahel

 When a gregarization level is reached and insects are concentrated in areas where
food becomes limited, mature and able to fly insects migrate looking for more favourable
conditions to feed and breed (Ceccato, Cressman, Giannini, & Trzaska, 2007; Cressman,
2016). This happened during the upsurge of 2003-2005 when swarms of insects moved
between the winter breeding areas in north-western Africa (Marocco, Algeria, Mauritania)
and the summer breeding areas in Sahel (Senegal, Mali, Niger, Sudan). The upsurge started
after abnormally heavy rains in remote areas of the Sahel, where locusts fed in patches of
rising fresh vegetation quickly congregated to form swarms (Cressman, 2016). In October
2003, outbreaks were confirmed and evolved rapidly to deteriorate the situation by the end
of the year and reach an upsurge level (Ceccato et al., 2007). From June to August 2004,
swarms arriving in the summer breeding areas invaded the Sahel in massive numbers,
coming from northwest Africa and feeding on vegetation growing after the seasonal

 5
rainfalls (Brader et al., 2006). According to numerous infestation reports, more than one
breeding cycle occurred, maximizing defoliation damages on vegetation at the heart of the
growing season. Infested pastures and croplands affected eight million people and damages
diminished harvest from 80%–100% (Brader et al., 2006; Waldner et al., 2015).

2.3.3 Infestation stages

 A desert locust infestation can be characterized regarding its defoliating potential
in relation to the behavioral and developmental phases of the insects composing it. For
example, a populous infestation with mature insects in the gregarious phase is assumed to
cause more damage to vegetation compared to infestations where groups of immature
insects dominate or insects in the solitarious phase are scattered throughout the area
(Symmons & Cressman, 2001). According to this logic, the reported infestations in this
study were organized into stages in which the severity of their impact is assumed to have a
direct relation to those behavioral and maturity factors. The used data contained
information about both factors, the combination of which yielded in many stages that could
be studied. However, the attention was focused on six combinations that could cause the
most severe damage to vegetation. In those six infestation stages, the insects have passed
through the fledging point, meaning that they are adults and at the same time they exhibit
gregarious behavior being part of populous groups.

2.4 Remote sensing tools

2.4.1 Insect disturbance monitoring and remote sensing

 Defoliator insect outbreaks can spread in wide areas and change vegetation
phenology by stripping it from its green leaves (McDowell et al., 2015). Those changes
can evolve in remote areas far from human supervision, affecting ecosystems’ carbon
accumulation without being possible to record this effect. In order to study those large-
scale processes, data that are spatially explicit while at the same time cover large
geographic extents are required. Furthermore, data should deliver a temporal resolution
that fits the insect’s life-cycle, and allow the assessment of long time series in order to
capture natural fluctuations of the insect dynamics (Senf et al., 2017). Remote sensing

 6
fulfils the above-mentioned criteria and can serve as a powerful tool for the study of insect
outbreaks across large areas at fine spatial and temporal scale (McDowell et al., 2015).
Especially, applying time series analysis (TSA) on frequent observations of vegetation
traits, allows monitoring, which is temporally accurate, spatially explicit, and can record
reliably the consecutive movements of locust swarms across the vast Sahelian area.
 After decades of developing remote sensing technologies and methodologies for
detection of defoliator insects, the scientific community can now benefit from long series
of densely sampled datasets which offer improved detectability (Fraser & Latifovic, 2005)
and have the potential for accurate estimates of defoliation severity (Senf et al., 2017). The
combination of field observations and TSA could be used to model the relation between
insect extensive presence and remotely observed vegetation attributes. In recent years, this
approach has been followed by various researchers to provide outbreak mapping or near
real-time monitoring tools (P.-O. Olsson et al., 2017; P. O. Olsson, Kantola, Lyytikainen-
Saarenmaa, Jonsson, & Eklundh, 2016; Pekel et al., 2011; Renier et al., 2015; Senf et al.,
2017). In the study of P. O. Olsson et al. (2016), in particular, a time series methodology
based on z-score analysis was attempted for monitoring defoliator insects in boreal forests
of Fennoscandia, yielding in dual results related to the characteristics of the landscape.
 Analogously, the potential application of time series analysis to detect foliage
damage caused by swarms of voracious locusts in Sahel is challenging since the region
hosts an inhomogeneous landscape (Karlson & Ostwald, 2016) where the annual greenness
fluctuation is regulated by the levels of annual rainfall received which does not follow an
exactly recurrent spatiotemporal pattern from year to year. However, the fact that those
data are now widely available and provide sufficient temporal depth, makes the approach
attractive for investigating the possibility of a monitoring mechanism development.

 7
8
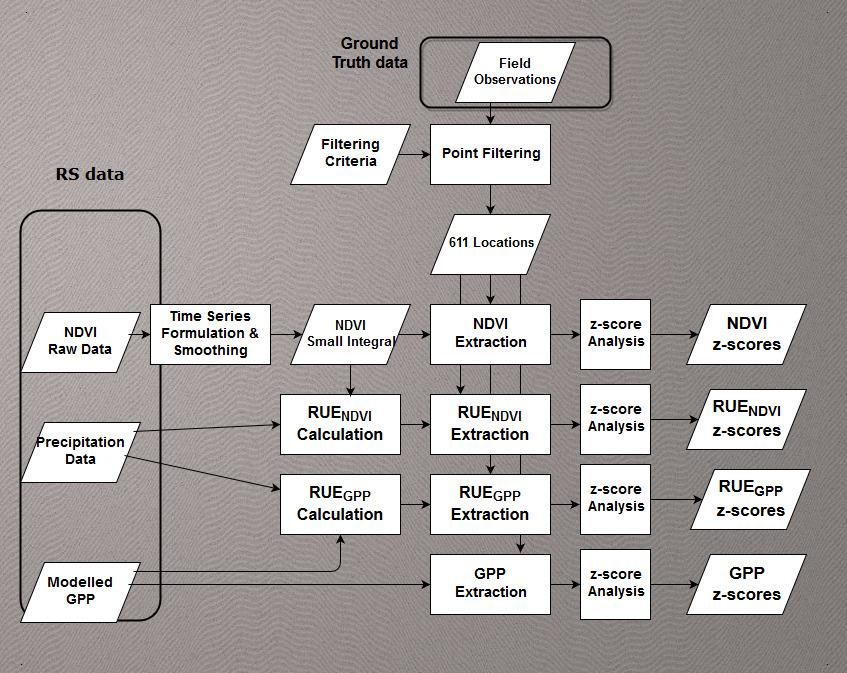
3 Materials and Methods

3.1 Introduction

 The current study attempted to create an empirical model for studying the
relationship between field observed locust infestations and remotely sensed vegetation
characteristics represented by four series of 14-year long data; 1) the NDVI small integral
(a seasonal measure of greenness), 2) the annual GPP 3) the NDVI-based annual rain use
efficiency (RUENDVI) and 4) the GPP-based annual rain use efficiency (RUEGPP). For each
of these four MODIS-origin datasets, pixels suffering from extensive locust presence
during the growing season of the year 2004 were extracted, and then tested for probable
discrepancies from the 14-year norm through a z-score statistical analysis. Furthermore,
the NDVI annual profiles of these infested pixels were plotted and visually analyzed in
order to reveal any characteristics that could be related to the locust activity. Finally, the
magnitude of the locust impact was analyzed for six different stages of locust infestation.
 Starting by preprocessing the point data which represent the field observations and
the remote sensing data independently, the methodology proceeds to focus on infested
areas by extracting the corresponding pixels from the raster datasets based on the field
observations. Statistical analysis was then carried out by calculating z-scores for each pixel
and then grouping those z-score for each year (mean annual z-score) to create a measure of
comparison between the years and draw a conclusion on vegetation’s productivity between
the infested year and the non-infested ones (Fig. 1).

 9
Figure 1: Methodological flow

3.2 Study area

 The Sahelian zone forms a belt across Africa, extending from the Atlantic Ocean to
the west, to the Red Sea towards the east and bordering the Sahara Desert to the north and
the humid savannas of the Sudanian zone to the south (Karlson & Ostwald, 2016).
Coincides with the area receiving annual precipitation between 150 and 700 mm increasing
southwards (Ardo et al., 2018; Karlson & Ostwald, 2016; Prince et al., 1995) and
vegetation productivity follows the precipitation gradient (Herrmann, Anyamba, & Tucker,
2005). Annual grasslands and sparse drought-tolerant woody shrubs are found in the dry
areas (Hiernaux et al., 2009), while moving towards higher isohyets more trees and
perennial grasses occur. Vegetation phenology follows rainfall seasonality and has one
growing season per year which normally lasts from June to October (Abdi et al., 2014).
 10
3.3 Data

3.3.1 Locust field observations

Table 1: Information included into each locust presence field observation report (FAO, 2004)

 Field Observation

 Observation ID

 Location

 Date

 Infestation

 Insect behavior (gregarious/solitarious)

 Insect maturity (immature/mature)

 Estimated population density (bands/groups/swarms)

 Estimated spatial extent (in ha)

 Ecology

 Vegetation greenness (dry/drying/greening/green)

 Vegetation density (sparse/dense)

 Soil dryness (dry/wet)

 The field data originate from survey operations made by the Food and Agriculture
Organization of the United Nations (FAO) for the detection and control of the locust spread
and description of its situation and habitat conditions. They were collected across the Sahel
following FAO’s guidelines (Symmons & Cressman, 2001) under the responsibility of
local locust field officers and focus around areas and time periods in which the insects are
most likely to be present, according to vegetation conditions, past observations or
neighboring important areas, such as highly valuable crops. Those digitized observations

 11
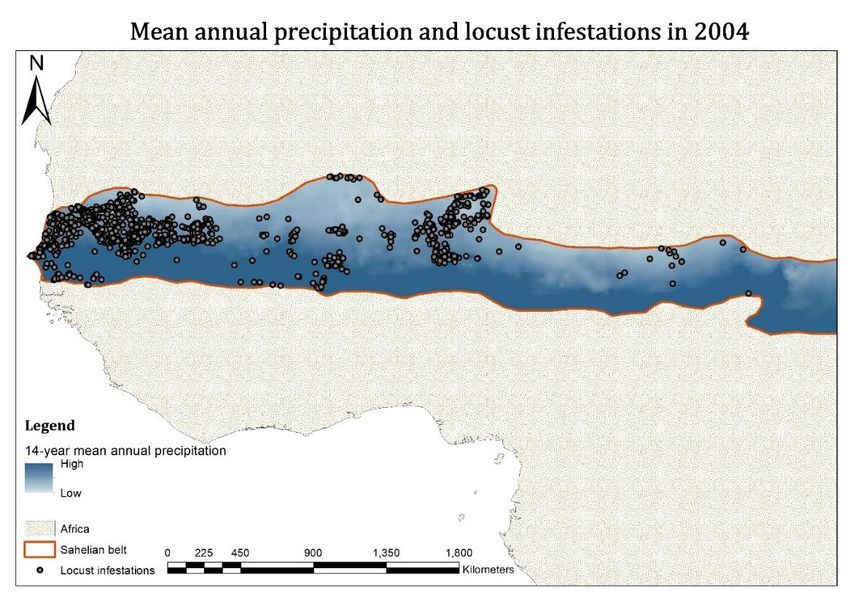
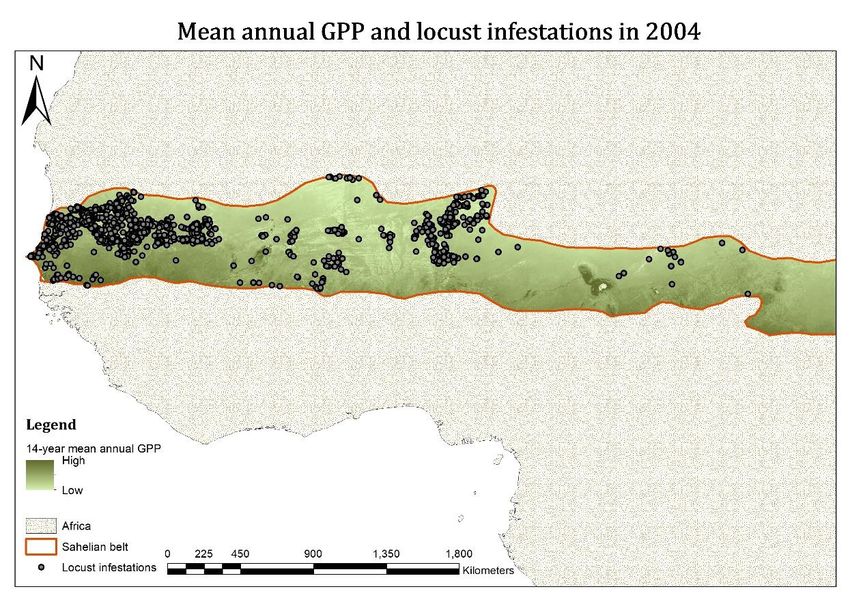
are part of a dataset on locust presence and include, apart from locations and dates,
information on the behavior and maturity characteristics of the insects, an estimate of their
population density and the areal extent of each infestation, a short description of
vegetation’s condition (density and greenness), and information about soil’s dryness (Table
1). Regarding the studied 2003 – 2005 upsurge, the reported location coordinates are
considered reliable since it was the first extensive upsurge event when GPS devices were
used for verifying locations.

3.3.2 Remotely sensed data

 Remotely sensed vegetation characteristics in this study originate from the
MODerate resolution Imaging Spectroradiometer (MODIS) data which were processed to
form series of frequent estimates of Normalized Difference Vegetation Index (NDVI) and
annual estimates of Gross Primary Productivity (GPP) for the entire Sahelian belt.
Regarding the NDVI, Terra/MODIS 250m2 spatial resolution, 16-day composites were
downloaded (16 -day composites; MOD13Q1; collection 6; 250mx250m spatial resolution)
for the period between January 2001 and December 2014 (LPDAAC, 2016), while the
annual estimates of GPP were retrieved from an earth observation-based modelled GPP
product developed based on the light response function, using remotely sensed vegetation
indices and incoming photosynthetic active radiation (PAR) as input data (Torbern
Tagesson et al., 2017). The output provides spatially explicit GPP estimates across the
Sahel at 250x250m spatial resolution. For further information regarding the GPP data, see
(Torbern Tagesson et al., 2017). For the calculation of the annual index of rain use
efficiency, the necessary rainfall data were provided by the CHIRPS (v2.0) project datasets
at a 0.05°x0.05° spatial resolution, based on a conjunction geostationary infrared satellite
rainfall estimates and rain gauge observations that are interpolated to produce precipitation
grids (Funk et al., 2015). Monthly grids over the 2001-2014 study period were downloaded
(http://chg.geog.ucsb.edu/data/chirps/) and then summed on an annual basis to create the
annual precipitation estimations.

 12
13
 Figure 2: Mean gross primary production (GPP) in Sahel and locust infestation distribution in 2004
14
Figure 3: Mean precipitation in Sahel and infestation distribution in 2004
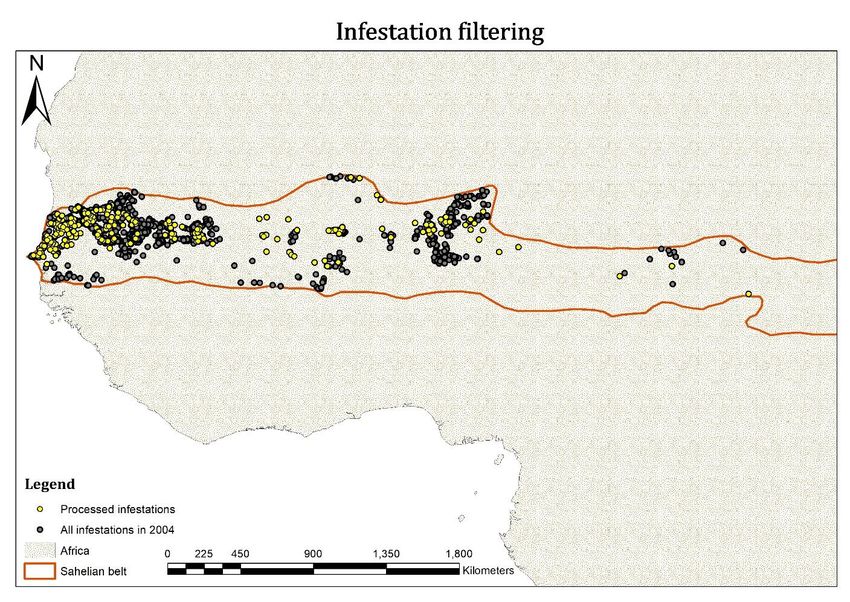
3.4 Methodology

3.4.1 Field data processing

 Starting from an extensive dataset covering the entire period of the upsurge, the
study’s methodological approach attempted to make optimal use of the information
available, by focusing on infestation cases where characteristics were assumed to allow
high detectability margins. From all field observations of locust infestations between 2003
and 2005, only a part was finally used where infestations were considered to have great
catastrophic potential. The filtering was carried out according to infestation reported
characteristics related to locusts’ behavior and maturity, and also the timing they were
observed in relation to vegetation’s annual development.
 Firstly, the insect maturity (non-adults / adults) was considered as an important
criterion, in order to exclude less destructive cases. And secondly, the information on their
behavioral phase (gregarious/solitarious) was used to focus on the cases where insects are
populous and act as coherent groups. The infestation timing regarding vegetation’s growth
was also considered as an important factor, assuming that plants under defoliating pressure
during the growing season would have a less productive year and this difference would be
more observable in the NDVI profile attributes and GPP annual estimates. Furthermore,
the study was centered around the growing season of 2004, since during this year the
upsurge was in full swing and the areas in the Sahel received many large groups of mature
insects migrating from the winter breeding areas in northern Africa to the summer breeding
areas across the Sahelian belt.

The five criteria according to which the filtering was carried out:
 A. Regarding the insect characteristics and infestation timing
 1) Locust level of maturity. In the adult stages, the insects are considered to have
 the strongest impact on vegetation due to their size and mobility needs. All
 points referring to non-adults were excluded from the study.
 2) Behavioural phase. When locusts exhibit gregarious behavior, they form dense
 groups of insects that act coherently, with daily patterns of feeding and moving
 (Cressman, 2016; Symmons & Cressman, 2001). The points referring to groups
 or swarms of insects were taken into account while those referring to the
 solitarious phase were excluded from the study.

 15
3) Infestation timing. A major part of vegetation’s annual development takes
 place during the start of the growing season which for most parts of the Sahel
 takes place between June and August (T. Tagesson et al., 2016). In June of
 2004, swarms of mature locusts started to arrive in parts of the Sahel looking
 for favourable conditions to feed and breed (Brader et al., 2006; Food and
 Agriculture Organization of the United Nations, 2018, May 18). Those groups
 of mature insects attack the fresh vegetation which grows after the recent
 rainfalls. Only the observations made during the period between the beginning
 of June and the end of August of 2004 were included in the study.
 B. Regarding methodological optimization
 4) Areas infested only in 2004. To avoid an analysis of pixels that have been
 infested many times in years other than 2004, which might lead to confusion in
 the statistical analysis of the time series, the study included pixels where
 infestations were confirmed only for the year 2004. Consequently, if
 observations from other years than 2004 were found within a zone of 10km
 around a 2004 observation, they were excluded from the analysis. In this way,
 the risk of performing time series analysis in pixels which were infested many
 times during the 2001-2014 period will be avoided and the results would be thus
 easier to interpret.
 5) Pixels completely affected. Finally, in order to reassure that each examined
 pixel depicts an area that is infested in the whole of its surface, the points
 referring to infestations smaller than an area equivalent to four pixels (25ha)
 have been excluded from the process.

 Finally, among 4918 points representing locust presence, according to field
observation reports for the year of 2004, 611 points were finally used to select the
corresponding pixels on vegetation characteristics’ datasets and extract their annual
attributes for the period 2001-2014 (Fig. 6).

 16
17
 Figure 4: Locust field observations during 2004 upsurge in total and the 611 selected ones for the study
3.4.2 Time Series Analysis of NDVI pixel profiles

 A Time Series Analysis (TSA) is depending on the availability of long and dense
sequences of data. The long series of frequently gathered remote sensing data make the
TSA a useful tool for monitoring important environmental traits of earth’s surface like
vegetation. It has been showed that the advantages of TSA for vegetation monitoring rely
on the ability to sense subtle fluctuations in growth characteristics (Ali et al., 2013) and the
identification of vegetation trends analysing its behaviour over sequences of years.
Vegetation greenness is a widely used trait for such analysis, since it can be easily estimated
by the means of remote sensing.
 The most widely used measure of vegetation greenness is the Normalized
Differential Vegetation Index (NDVI), a vegetation index calculated based on the spectral
response of the photosynthetically active green vegetation, as this is recorded by sensors
operating on red (λ = [620nm,700nm]) and near-infrared (λ = [700nm,1100nm]) bands of
the electromagnetic spectrum. Since the red band is part of photosynthetically active
radiation, it is highly absorbed by the leaves and a small amount of red radiation is recorded
by the sensor (Tucker, 1979). On the other hand, in order to avoid overheating, radiation
in frequencies of near infrared are highly reflected by the leaves and consequently, high
values are recorded in this part of the spectrum.

 −
 = (Eq. 1)
 +

 The fraction of the difference of spectral responses to their sum results in a range
of values between -1 and 1 (Eq.1). Healthy and dense vegetation are represented by high
positive values (>0.5) while moderate positive values [0.2, 0.5] indicate altering patches of
vegetation and bare soil. After all, in case of unhealthy vegetation and given an area of
specific plant composition, NDVI appears in lower values compared to the unaffected
period. Consequently, NDVI’s ability to discern healthy and non-healthy vegetation makes
it appropriate for defoliator infestations (Fraser & Latifovic, 2005; Senf et al., 2017;
Waldner et al., 2015).
 Furthermore, it is showed that the NDVI can serve as a productivity indicator in
areas covered by sparse vegetation or grasslands, where a linear relationship between
vegetation productivity and NDVI seems to exist (Paruelo, Epstein, Lauenroth, & Burke,

 18
1997; Prince, De Colstoun, & Kravitz, 1998). Among the attributes of an NDVI profile
representing vegetation’s seasonal growth cycle, the small integral is suitable for
representing seasonal productivity in Sahel (Fensholt et al., 2013). Small integral refers to
the area under the smoothed NDVI seasonal curve excluding the period of the year when
vegetation does not appear particularly green (Fig. 5). Consequently, it represents
vegetation’s main seasonal productivity and is appropriate for its inter-annual comparison
of a certain place.

3.4.3 Rain Use Efficiency Index

 In semi-arid ecosystems, the relationship between rainfall and vegetation has
received a great deal of interest since water availability is considered the most important
determinant for vegetation growth in such environments (Fensholt & Rasmussen, 2011;
Hickler et al., 2005; Prince et al., 1998; Wessels et al., 2007). Given the light availability
and the soil fertility, water is the resource leading to high or low productivity performance
as it is the main limiting development factor (Karlson & Ostwald, 2016; Paruelo,
Lauenroth, Burke, & Sala, 1999). This is apparent especially in Sahel, where interannual
variability in precipitation patterns is observed, in both quantitative and spatial terms
(Fensholt & Rasmussen, 2011; Prince et al., 1998). Furthermore, it has been shown that a
near-linear relationship between rainfall and vegetation productivity exists in Sahel
underlining the importance of water availability as a determinant growth factor there
(Fensholt & Rasmussen, 2011; Fensholt et al., 2013; Fensholt, Sandholt, Rasmussen,
Stisen, & Diouf, 2006; Lehouerou, Bingham, & Skerbek, 1988; Prince et al., 1998;
Rasmussen, 1998). The admission that vegetation development is linearly proportional to
the amount of precipitation received is a necessary precondition for the use of the concept
of rain use efficiency index.
 According to Paruelo et al. (1999), Rain Use Efficiency (RUE) is a measure of the
response of plant production to variation in precipitation patterns. Technically, RUE is a
synthetic normalization index used for masking out the effect of rainfall variation on
productivity and is calculated as the ratio between the expression of productivity and
precipitation (Prince et al., 1998).
 The use of RUE allows normalization of primary productivity for rainfall variability
and so enables the study of various factors’ impact on vegetation productivity which are
not related to water availability, such as insect disturbances or anthropogenic-induced land

 19
degradation (Evans & Geerken, 2004; Fensholt & Rasmussen, 2011). For semi-arid
ecosystems, the applicability of RUE is driven by the assumption that the ratio between
productivity and rainfall is a conservative value (Lehouerou, 1984; Lehouerou et al., 1988)
and the fact that water availability is crucial for photosynthetic performance (Prince et al.,
1998). RUE has been a subject of study for diagnosing human-induced land degradation
on vegetation in the Sahel under the pressure of climate change (Evans & Geerken, 2004;
Fensholt & Rasmussen, 2011; Fensholt et al., 2013; Paruelo et al., 1999; Prince et al., 1998;
Wessels et al., 2007). However, it has not been used to detect productivity anomalies
caused by insect disturbances.
 Since RUE is defined as a measure of productivity divided by the amount of rainfall
received (Lehouerou, 1984) and the study makes use of two productivity proxies,
correspondingly two versions of RUE were constructed; one based on annual GPP
(RUEGPP) and one based on the NDVI seasonal small integral (RUENDVI) (Eq. 2 and 3).
However, Both RUEGPP and RUENDVI suffer from spatial resolution inconsistency between
their constituent elements since GPP and NDVI on the numerators are given in 250×250m
pixel size, while precipitation on the denominators is given in coarser, 0.5°×0.5° spatial
resolution. Eventually, the two indices have a pixel size of 250m, but they lack precision
due to local variations in rainfall.

 = (Eq. 2)

 = (Eq. 3)

3.4.4 Pre-processing of gridded data

 Starting from three series of remote sensing data to represent vegetation
characteristics (NDVI full-series, GPP annual estimates, and rainfall monthly estimates)
and intersecting with 611 selected infestations, statistical analysis was performed for the
corresponding to those areas MODIS grid pixels. For the case of NDVI time-series, a pre-
processing was necessary in order to smoothen the profiles before the extraction of the
seasonal attribute of the small integral. This processing was done in TIMESAT time series

 20
analysis software (Eklundh & Jönsson, 2015; Jonsson & Eklundh, 2002, 2004) under the
following parameter choices: NDVI data range = 0.1-1.0, seasonal parameter = 0.5,
Number of envelope iterations = 3, adaptation strength = 1, Savitzky–Golay window size
= 3, and amplitude season start and end = 0.2 (Jonsson & Eklundh, 2004). Then the small
integral was extracted for each growing season yielding in 14 values for each of the 611
infested pixels. Regarding GPP, 14 annual estimates per pixel were retrieved from the
source model’s output database and finally by combining NDVI and GPP with the
downloaded rainfall annual estimates, two rain use efficiency indices were formulated,
RUEGPP and RUENDVI characterizing those pixels for each of the 14 years.

3.4.5 Statistical decision criteria (z-score)

 To answer whether discrepancies on vegetation annual characteristics can be
observed through statistical testing, a z-score analysis was followed for each of the four
14-year long vegetation characteristics’ datasets (NDVI, GPP, RUENDVI, RUEGPP). Having
a measure of vegetation behaviour for fourteen years, this approach allowed the analysis
and comparison between those years and particularly 2004 with the rest, “locust free” ones.
The z-score or standard score expresses the distance between a given value and the mean
of a group of values from which the given value is part. This distance is measured in units
of group’s standard deviations and it is assumed that the group values follow a standard
distribution (Eq.4).

 −
 _ = (Eq. 4)

 The approach’s advantage relies on taking into account the natural variability of
each examined pixel’s values allowing comparability between the years. It has been
implemented similarly for monitoring disturbances in Fennoscandian boreal forest by P.
O. Olsson et al. (2016).
 In order to define by statistical measure the point on which locusts’ impact on
vegetation is traceable according to the z-score logic, a threshold of two standard deviations
lower than the interannual average was chosen. This means that in cases where pixels score
less than two negative standard deviations (z-score ≤ -2), the discrepancy cannot be
explained by the normal variation of the 14 years, indicating an abnormal event causing

 21
low productivity which in the case of the year 2004 is assumed to be the locust defoliating
activity. In such case, the differentiation could be considered as significant, and the
research question on whether a relationship exists between the infestation and remotely
sensed vegetation characteristics examined (NDVI, GPP RUE, RUE) can be answered
positively, and for GPP in particular, indicating also that the upsurge caused a significant
impact on Sahel’s productivity as a response to the second research question. Finally and
regarding the third research question, z-score annual values were grouped the six most
damaging infestation stages to indicate any differences in severity between them. Those
differences would be specified by comparing the negative magnitude of each stage’s z-
score.
 The z-score was calculated for each of the parameters representing vegetation
(NDVI small integral, GPP, RUENDVI, RUEGPP) for the 611 selected sites with infestations
in 2004. In order to compare the year of the upsurge with the rest locust-free years, the
mean annual z-score was used after averaging the 611 z-scores, to express each year’s the
mean deviation from the inter-annual average for the sum of the 611 pixels of interest (Eq.5
and Table 2)

 1 + 2 +⋯+ 611

 = (Eq.5)
 611

Table 2: Vegetation characteristics expressing productivity and their corresponding statistical
measure (mean annual z-score)

 Remotely sensed vegetation Produced annual z-scores for the 2001-
 characteristics 2014 time period

 NDVI small integral

 Gross Primary Productivity

 Rain use efficiency based on the NDVI

 seasonal small integral

 Rain Use Efficiency based on the annual GPP

 22
Where:
 is the mean z-score of the year ,

 1 is the z-score of pixel 1 in year ,

3.4.6 NDVI seasonal dynamics

 Since the available NDVI data allowed the construction of entire time series
between 2001 and 2014, by analyzing the seasonal dynamics of NDVI for the affected
pixels visually, would give further information on how the infestation is manifested on
NDVI that cannot be observed through the z-score analysis of the small integral. By
plotting the annual NDVI profiles of affected pixels and comparing the annual shape of
2004 with the rest of the years could reveal profile characteristics which can relate to the
locust presence. For example, a short tail of the seasonal NDVI could be a characteristic
indication for the locust presence which could not be captured by the z-score analysis of
the small integral. Additionally, by focusing on the year of the upsurge and comparing
among infested pixels which have been grouped into four levels of affection, fruitful
outcomes could be drawn regarding how the locust activity is imprinted on the seasonal
NDVI.
 In order to do so, the infested pixels were sorted according to their NDVI small
integral negative z-score in the year 2004 from lower to higher, so that the severely affected
cases appear first. Only the pixels having negative values were taken into account since the
cases with positive z-score in 2004 are not in the interest. After this sorting, four groups of
ten pixels each were created to represent four cases of infested pixels in four different levels
of locust affection. For example, for the group which represents the most severely affected
pixel case, ten pixels were randomly selected from the part of the sorted list which contains
5% of the worst cases. That means 5% of the pixels with the most negative z-score values
in 2004. Then, the NDVI profiles of those ten pixels were averaged for the 2001-2014
period, to represent the case of the most severe affection. This group was called the 5%
group. Similarly, another three groups were formed by pixels which are in the 12,5%, 25%
and 50% of the cases with low z-score values (groups of 12,5%, 25%, and 50%
respectively).

 23
The visual comparison of the shape of the annual NDVI was carried out firstly
between the year 2004 and the rest and then between the four groups during only 2004.
The comparison included the length of the growing season and the slope characteristics
before and after the maximum seasonal value.

3.4.7 Locust infestation stages

 Each field observation report includes an indication of the maturity and behavior of
the insects dominating. In order to study any differences in the impact on vegetation caused
by different stages of locust infestation development, the six final stages of maturity were
selected since these are the cases having the most severe impact on vegetation (Symmons
& Cressman, 2001). The 611 selected plots representing infestations were grouped
according to the insects’ maturity and behavior, and following a severity order, from most
to least severe (most sever at the top).

The six maturity stages impact comparison
 ▪ Mature swarms. Very populous groups of completely mature insects which are
 copulating or laying eggs.
 ▪ Maturing swarms. Very populous groups of both immature and mature adult
 insects.
 ▪ Immature swarms. Very populous groups of adult insects which have not reached
 their final stage of development and are not able to fly yet.
 ▪ Mature adult groups. Groups of completely mature insects which are copulating
 or laying eggs.
 ▪ Maturing adult groups. Groups of both immature and mature adult insects.
 ▪ Immature adult groups. Groups of adult insects which have not reached their final
 stage of development and are not able to fly yet.

 Every group got a z-score for 2004 for both NDVI small integral and annual GPP which
served as the measure of comparison between the six groups as the method attempted to
reveal the magnitude of the damage they caused.

 24
4 Results

4.1 Impact of the 2004 infestation on the NDVI Small
Integral

 The assessment of NDVI small integral for severely infested areas in 2004 shows
that z-score is lower than the average by 0.65 standard deviations (ZNDVI04 = -0.65). This
indicates that the annual greenness for pixels infested in 2004 was lower than the time
series’ average. However, it was still not the lowest since in the year 2002, when no locust
outbreaks were reported, NDVI deviation reaches its negative maximum at -1.06 standard
deviations from the average, while in years 2011 and 2008 the score is close to the year of
the upsurge with -0.47 and -0.39 respectively (Fig. 6).

 18000
 The NDVI small integral across the years

 16000

 14000

 12000
 Z-score
Absolute value

 10000

 8000

 6000

 4000

 2000

 0
 2001 2002 2003 2004 2005 2006 2007 2008 2009 2010 2011 2012 2013 2014
 YEAR Absolute NDVI NDVI z-score

Figure 4: Z-score and absolute value sequence of NDVI small integral for the 611 infested pixels

 25
Furthermore, out of 611 sites examined, in 229 cases (37%) the NDVI small
integral was lower than the inter-annual average by more than one standard deviation and
only in 14 cases (2%) lower than two standard deviations (Table 3).

Table 3: NDVI small integral, GPP, RUENDVI and RUEGPP z-scores in 2004

 Average z-score in Percentage of pixels Percentage of pixels
 2004 below 1 standard below 2 standard
 (standard deviation) deviation deviations
 (#absolute number) (#absolute number)

 NDVI -0.65 37% 2%
 (±0.83) (#229)
 (#14)

 GPP -0.44 24% 2%
 (±1.13) (#146)
 (#14)

 RUENDVI 0.49 2% 0.3%
 (±0.79)
 (#12) (#2)

 RUEGPP 0.35 2% 0.6%
 (±0.99)
 (#11) (#4)

 Precipitation -0.72

 (±1.13)

4.2 Impact of the 2004 infestation on the annual GPP

 Regarding the magnitude of the locust impact on vegetation productivity, the
upsurge year show a decrease over the inter-annual average GPP since it scores -0.44
standard deviations, but again not exceeding the threshold of -2 (Fig. 7). Similarly to the

 26
finding of NDVI, it is ranked third after years 2002 with -0.87 and 2014 -0.75 and only 2%
of the pixels score more than two standard deviations lower than the time series’ average
(Table 3).

 900
 The annual GPP across the years

 800

 700

 600

 500 Z-score
 g C / m2 / yr

 400

 300

 200

 100

 0
 2001 2002 2003 2004 2005 2006 2007 2008 2009 2010 2011 2012 2013 2014
 YEAR Absolute GPP GPP z-score

Figure 5: Z-score and absolute GPP sequence for the 611 infested pixels

 27
Figure 8: Map of GPP z-scores in 2004 across the Sahel

 Figure 6: Map of GPP z-scores in 2004 across the Sahel

 28
4.3 Impact of the 2004 infestation on the Rain Use Efficiency
Index

 Even though the 611 points were infested, for both RUENDVI and RUEGPP, the year
2004 appears as a productive year with RUENDVI and RUEGPP z-scores of 0.49 and 0.38
standard deviations above the average, respectively. This indicates that the infested year
had a higher productivity per amount of rainfall than the rest of the time series. According
to the precipitation data, it was not a wet nor an exceptionally dry year (Fig.9). In both
cases, almost no pixels (0.3 and 0.6%, respectively) score lower than -2 standard deviations
from the average (Table 3).

 The annual RUENDVI RUEGPP across the years
 2

 1.5

 1

 0.5

 0
 2001 2002 2003 2004 2005 2006 2007 2008 2009 2010 2011 2012 2013 2014

 -0.5

 -1

 -1.5

 Annual RUEGPP z-score Annual RUENDVI Z-score Annual Precipitation Ζ-score

Figure 7: Z-score sequence of annual RUENDVI and RUEGPP for the 611 infested pixels

 29
You can also read