LIVING ON WITH A COVID19 HUM - Global Economic Outlook September 2020 - Euler Hermes

Page created by Willard Pratt
 
CONTINUE READING
LIVING ON WITH A COVID19 HUM - Global Economic Outlook September 2020 - Euler Hermes
LIVING ON
WITH A
COVID19 HUM

Allianz Research

Global Economic Outlook
September 2020

© Copyright Allianz
LIVING ON WITH A COVID19 HUM - Global Economic Outlook September 2020 - Euler Hermes
WHAT CHANGED, WHAT’S NEXT (1/2)
                          What was in line with                             What surprised                              What to expect next (2021 and
                             expectations                                                                                         beyond)
 Covid-19             Renewed infection waves requiring          Slow rise in cases in intensive care which        Stop-and-go approach from governments.
 sanitary             tighter   sanitary  restrictions and       could suggest that future waves could be          Vaccine available in Sept 2021, but 6 months
 restrictions         targeted lockdowns.                        more contained.                                   needed for campaign. Return to normal in 2022.

 Economic             Less open economies, less reliant on       Stronger than expected catch-up effects for       Divergence in pace of recovery due to (i) structure
 activity             services and benefitting from short-       retail sales, residential market and exports of   (manufacturing economies likely to benefit more the
                      term demand stimulus packages have         goods.                                            recovery); (ii) composition of stimulus packages
                      registered stronger acceleration                                                             (demand/supply) + speed of disbursements; (iii)
                                                                                                                   confidence effects.

 Global               Low consumer confidence amid rising        Rapidly improving business confidence in          Busy political calendar (US elections and Brexit
 confidence and       concerns on unemployment and               contrast with still weak fundamentals.            outcome in 2020, Germany and the Netherlands
 political risk       financial, keeping excess savings at a     Political uncertainty increased in UK as          in 2021, France in 2022) will shape future fiscal
                      high level.                                probability of Hard Brexit now 45%.               stimuli. Expectations: last minute (partial) agreement
                                                                                                                   on Brexit. Joe Biden victory. More redistributive
                                                                                                                   policies towards households.

 Investment           No acceleration in investment in the       Confidence in the manufacturing sector            K     shape     recovery     in    investment    to
 cycle                manufacturing sector as long as: (i) the   improved strongly during summer on the            prevail. Investments, notably in the manufacturing
                      sanitary crisis is not (close) to be       back of above-expectations catch-up effects.      sector, to accelerate more visibly in H2 2021 as
                      solved and (ii) uncertainty on demand      Recovery in residential investment was            confidence effects improve and stimulus packages
                      remains high.                              stronger than expected.                           materialize.

  Global Trade,       Services lagging behind goods in           Stronger than expected recovery in goods          No full de-globalization: some reshoring but mostly
  protectionism,      recovery. US-China trade tensions          trade during the summer (currently 3%             diversification (multi-shoring). Goods back to pre-
  globalization       contained, but cold "tech" war to          below last August)                                crisis level in 2022, services in 2023.
© Copyright Allianz                                                                                                                                                   2
                      continue.
LIVING ON WITH A COVID19 HUM - Global Economic Outlook September 2020 - Euler Hermes
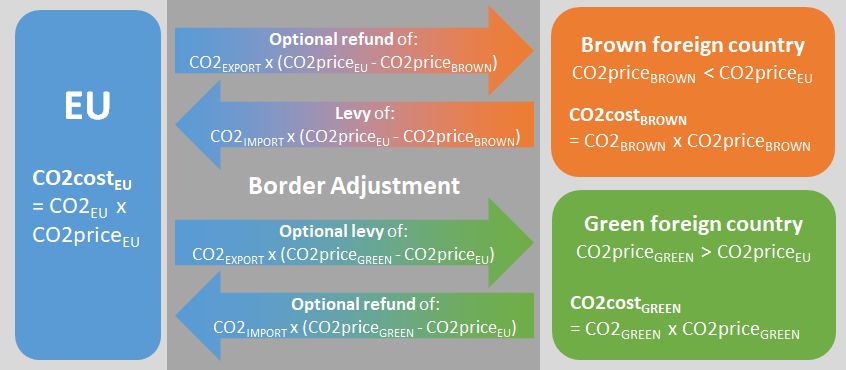
WHAT CHANGED, WHAT’S NEXT (2/2)
                              What was in line with                            What surprised                         What to expect next (2021 and
                                 expectations                                                                                   beyond)
 Global prices        Disinflationary pressures confirmed due to      Record high levels in gold price during      +0.3% inflation in 2020 in EZ and +1.1% in the
                      temp. factors (tax cuts, delayed summer         summer suggest increased worries             US; progressive reflation in 2021 (+0.9% and
                      sales), negative output gaps + falling money    about stagflation. Markets are actually      +1.6% respectively). Expect >2% US inflation
                      velocity.                                       ambivalent about the long-term inflation     from 2022. Higher inflationary pressures in EM
                                                                      outlook       (fixed income      pricing     starting end-2021. Oil prices up at 51 bbl/USD
                                                                      stagflation).                                2021.
 Monetary             Global liquidity reached record high levels     Fed introduced new monetary policy           Fed QE tapering in late 2022. No rate hike by
 policy               during summer, but transmission is not          target=> comfortable with temporary          Fed before Q3 2023. ECB is likely to announce
                      efficient given the lack of confidence of the   inflation overshoot; no normalization        EUR500bn in QE in Dec. 2020. BoE likely to
                      private sector                                  before unemployment reaches 4 to 5%          increase QE size by GBP100bn in 2021.
 Fiscal policy        Large phase II fiscal stimulus packages have    Some countries continued to lag in           Size + spending calendar of stimulus matter for
                      been announced, notably in Europe, along        terms of size of stimulus (Spain, Italy,     countries. Focusing on supply = more time
                      with the reduction in relief measures           UK). Higher risks of a fiscal cliff in the   before reaching pre-crisis levels.
                                                                      US.                                          Fiscal consolidation efforts will start in EM in
                                                                                                                   2022 as debt sustainability worries increase.
 Currencies and       Depreciations in EM currencies eased during     Stronger than expected EUR                   Moderate depreciation of the USD: -2.5% in 2021
 capital flows to     summer. Negative real rates continues to                                                     (1.22) followed by an appreciation +3% end-2022
                      support risk appetite. Weaker EM (TRY,                                                       (1.18). As long as USD depreciates, positive
 EM
                      ZAF) still on watchlist.                                                                     capital flows in the EM.

 Financial            It can still get worse before it gets better.   Technology sector driven equity market       Equity and Corp. markets set to remain under
 markets                                                              correction due to extreme options            pressure due to extreme valuations. Gvt bond
                                                                      market positioning.                          markets to remain anchored at low levels.

© Copyright Allianz                                                                                                                                                   3
LIVING ON WITH A COVID19 HUM - Global Economic Outlook September 2020 - Euler Hermes
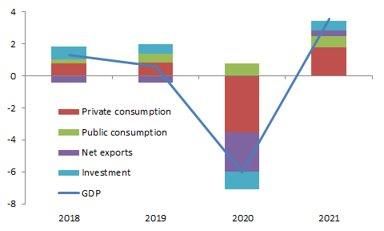
GLOBAL OUTLOOK: LIVING
WITH UNCERTAINTY

01
© Copyright Allianz
LIVING ON WITH A COVID19 HUM - Global Economic Outlook September 2020 - Euler Hermes
COVID-19: LIVING WITH THE VIRUS AND 194 STOP-
 AND-GO STRATEGIES
     Daily number of new Covid-19 cases                        Global stringency indices                                           Stringency index
                                                         (weighted by GDP and travel services                     100 = maximum stringency/lockdowns, 0 = no distancing
100,000          Europe
                                                                       imports)
                 Africa                                                                                    80.0    •   ​Starting from Q3 2020 and until Q4 2021, no
                                                      2.5
                 Middle-East                                                                                            sanitary “normalization” but a stop-and-go
                                                                                                           70.0
                 APAC (excluding India)                                                                                 strategy on distancing measures, alternating
                                                      2.0                                                  60.0         between
                 North America
                                                                                                                              1. Targeted lockdowns (Spain, Israel)
                 Latin America                                                                             50.0
 50,000                                               1.5                                                                         or more stringent distancing
                 India                                                                                     40.0                   measures (UK, France, US...) every
                                                                                                                                  time cases rise
                                                      1.0                           International travel   30.0
                                                                                                                              2. Relaxed measures every time cases
                                                                                    restrictions (lhs)
                                                                                                           20.0                   are controlled again
                                                      0.5                           Overall stringency
                                                                                    index (rhs)            10.0    Hiccups in economic activity due to alternation of
      0                                                                                                            higher and lower stringencies of sanitary
                                                      0.0                                                  0.0
      01/20        03/20         05/20      07/20                                                                  restrictions
                                                        01-20        03-20       05-20       07-20
 Sources: John Hopkins University, Allianz Research   Sources: Oxford University, Allianz Research                 •   Stringency indices to end 2021 between 10
                                                                                                                       and 20 in most countries, levels similar to the
 Waves of reinfections to be increasingly             Reinfections will push for a stop-and-go                         start of the sanitary crisis
 more visible in countries which relaxed              strategy. International travel to remain
 sanitary restrictions: after Europe, Africa          restricted until 2022 when we expect                         •   Return to ~0 stringency by end of Q1 2022
                                                                                                                       after a 6-months vaccination campaign
 + Latin America should follow. APAC to               the end of the sanitary crisis
                                                                                                                       starting in Q4 2021​
 remain
 ©              under control.
   Copyright Allianz                                                                                                                                               5
LIVING ON WITH A COVID19 HUM - Global Economic Outlook September 2020 - Euler Hermes
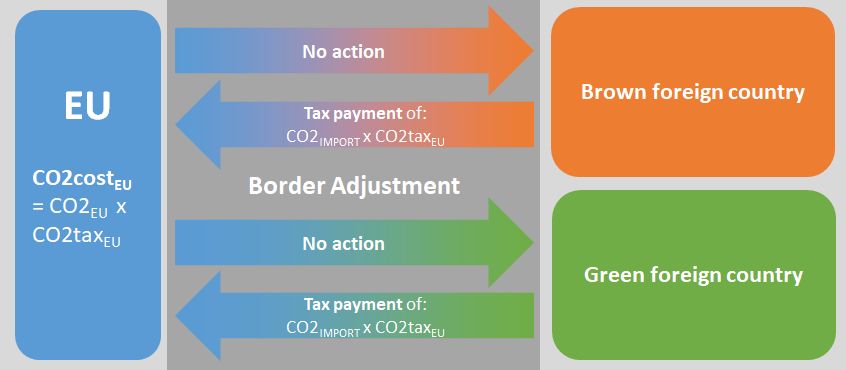
COVID-19 TWILIGHT ZONE: DIVERGING WHILE
PLATEAUING
           Daily activity index (mobility, jobs and retail)                   70
                                                                                                              Manufacturing PMI
                                                                              65
   120
                                                                              60
                                                                              55
   100
                                                                              50
    80
                                                                              45
                                                                              40
    60
                                                                              35
                                                                              30

                                                                                    09/18

                                                                                            11/18

                                                                                                    01/19

                                                                                                            03/19

                                                                                                                    05/19

                                                                                                                            07/19

                                                                                                                                    09/19

                                                                                                                                            11/19

                                                                                                                                                    01/20

                                                                                                                                                            03/20

                                                                                                                                                                    05/20

                                                                                                                                                                            07/20
    40
                                                   US               China
                                                   Germany          France
    20                                             Italy            Spain                    United States                    Germany                           Italy
                                                   UK               Brazil
                                                                                             UK                               Mexico                            China
                                                   Mexico
     0
     Jan-20   Feb-20   Mar-20   Apr-20   May-20   Jun-20   Jul-20   Aug-20
                                                                                             France                           Spain                             Brazil

  Sources: Bloomberg, Allianz Research                                       Sources: Markit, Allianz Research

We see the recovery in daily activity rates plateauing in                     Activity expectations in the manufacturing sector are
most countries and even changing course in Spain, in                          likely to plateau at current levels post-summer catch-
line with stringency indices stabilizing and new                              up effects. In countries where sanitary restrictions
outbreaks
© Copyright Allianz
                                                                              tightened (Spain, France), the index is back in                                                       6
                                                                              contractionary territory
COVID19+: POLITICAL RISK IS BACK LIKE A
    BOOMERANG                                                Brexit: 55% probability for a very last minute
                                                                                                                        Key Summits
                                                                                                                        G20: November 21-22, 2020
                                                             agreement with FTA implementation by mid-
                                                             2021                                                                                            Elections in Europe
                                                             45% probability for a no deal with early                                                        Sept/Oct 2021: Germany (CDU/Greens coalition expected to win with higher
                                                             elections and a comeback to the negotiating                                                     public investment for greening the economy)
                                                             table in 2021                                                                                   Sep 2021: Russia Duma (United Russia expected to win). Tensions with US
                                                                                                                                                             on the rise
                                                                                                                                                             Oct 2021: Czechia (ANO expected to win without a majority)
                                                                                                                                                             Nov 2021: Bulgaria (GERB expected to win)

                                                                                                                                             Asia-Pacific (geo)political risks to watch
                                                                                                                                             Hong Kong: legislative council election postponed by one
 U.S.-China tensionstensions                                                                                                                 year to September 2021. New protests are possible.
 China/US                                                                                                                                    Taiwan: cross-strait relations still tense, with possible
 Technology cold war to intensify                                                                                                            interventionism of the U.S.
 whatever the outcome of US                                                                                                                  Japan: potential snap elections in Q4 2020.
 elections                                                                                                                                   Thailand: anti-government protests to be closely monitored
                                                                                                                                             India: potential boomerang effect related to the Citizenship
                                                                                                                                             Amendment Act.
         November 03, 2020                                                                                                                   China: long-term trend of isolation of China on the
         US presidential election                                                                                                            international stage could continue. Australia, India, Japan
         Predicted outcome:                                                                                                                  and Taiwan have been putting policies in place.
         60% Democrats win                                                                                                                   Other elections: New Zealand (Oct 2020), Myanmar (Nov
         40% Republicans win                                                                                                                 2020), Vietnam (May 2021)
         High probability of a close race with
         disputed result leading to high market’s
                                                                Elections in Africa
         volatility and Supreme Court’s final say
                                                                Oct 2020: Morocco (PJD expected status-quo with
                                                                poor majority and delayed entry into office)                                               Middle East main tension points
                                                                Oct 2020: Ivory Coast (Ouattara expected to be re-                                         Large scale anti-government protests in Lebanon, Iraq and Iran
                                                                elected but with political instability)                                                    -   Iran: impact of US withdrawal from JCPOA and new US sanctions, as
Latin America unrests                                           Nov 2020: Burkina Faso (Kaboré expected to be re-                                              well as potential counter measures. Parliamentary election in February
-    Brazil: October 2020 local elections (challenging for      elected but with period of political paralysis)                                                as a potential source of geopolitical tension
     Bolsonaro’s new party), risk of social tensions with       Nov 2020: Egypt (status quo to be expected)                                                -   Lebanon: political uncertainties and potential new proxy war between
     public sector reform                                       Mali: Ghana (either incumbent Nana Akufo-Addo or                                               Saudi and Iran
                                                                former president John Mahama to win)                                                       -   Yemen: Sunni v. Shia
                                                                Other Elections : Tanzania, Liberia, Central African                                       -   Saudi vs. Iran, incl. Straits of Hormuz, revisited
                                                                Republic, Seychelles, Guinea, Somalia, Chad, lybia,                                        -   Qatar vs. Saudi Arabia, UAE, Bahrain, Egypt (blockade)
                                                                Soudan, Niger                                                                              -   Israel: impact of Jerusalem recognition by the US
                                                                Tunisia: new government formation may create                                               -   Turkey: Tensions with Greece
                                                                instability

       © Copyright Allianz                                                                                                                                                                                                              7
                                                                                                Source: Euler Hermes, Allianz Research
MONETARY POLICY: LOWER-FOR-MUCH-LONGER,
 WATCH CURRENCY CONSEQUENCES
     Central Banks Balance Sheets (% of GDP)        Key interest rates vs 10-year yields                               EUR to USD

    Sources: national sources, Allianz Research       Sources: national sources, Allianz Research    Sources: Refinitiv, Allianz Research

Global liquidity is at a record high level and should continue to           We expect a start of tightening in monetary and financial
increase. The ECB is expected to announce EUR500bn                          conditions in 2022, as markets anticipate the Fed will
additional QE purchases in December. The Fed is likely to                   hike interest rates in H2 2023. We expect the USD to
continue to expand its balance sheet to USD7.7tn end of 2021,               depreciate by -2.5% in 2021 (to 1.22) followed by an
before
  © Copyrighta  progressive tapering starting in H2 2022.
             Allianz                                                        appreciation of +3.0% in 2022 (1.18)                    8
FISCAL POLICY: MORE THAN A QUICK FIX BUT
BEWARE OF EXECUTION RISKS
         Expected impact on GDP growth from fiscal stimulus                        Distribution of average interest paid on debt (% of total
                           packages, pp                                                        countries, advanced economies)
   4.5                                                                     100
   4.0
   3.5                                                                      80
   3.0
   2.5
   2.0                                                                      60
   1.5
   1.0                                                                      40
   0.5
   0.0                                                                      20

                                                                  France
                      US

                               Germany

                                         UK

                                                  Italy

                                                          Spain
             China

                                                                             0
                                                                                 00 01 02 03 04 05 06 07 08 09 10 11 12 13 14 15 16 17 18 19
                           2020            2021           2022                                             0–2%      2–5%      >5%
   Sources: national sources, Allianz Research                                   Sources: national sources, Allianz Research

Spending paths matter even more than size: supply side stimulus packages (e.g. France) will need more time to see positive
impact on growth (vs. Germany, UK which focused on short-term measures). China will focus on avoiding excessive private
debt while the US should push public debt into new highs post elections. Fiscal status quo in Germany post 2021 elections.
Risks to the implementation of the EU Recovery Fund by mid-2021 remain high. Debt sustainability insured by prolonged
accommodative
© Copyright Allianz monetary policies and longer average-time to maturities.                                            9
FORECASTS: THE LAST MILE IS THE HARDEST
                                       Real GDP, Q4 2019 = 100                                                                                                                 Real GDP growth forecasts, %
                                                                                                                                                                                 2017      2018   2019    2020       2021
110
                                                                                                                                          World GDP growth                         3.3     3.1    2.5         -4.7   4.6
105                                                                                                                                       United States                            2.4     2.9    2.3         -5.3   3.7

                                                                                                                                          Latin America                            1.0     1.0    0.1         -7.9   3.3
100                                                                                                                                       Brazil                                   1.3     1.3    1.1         -6.5   2.5
                                                                                                                                          United Kingdom                           1.8     1.3    1.5     -11.8      2.5
 95                                                                                                                                       Eurozone members                         2.7     1.9    1.3      -7.9      4.8
                                                                                                                                          Germany                                  2.8     1.5    0.6      -6.0      3.5
 90                                                                         United States                                                 France                                   2.4     1.8    1.5      -9.8      6.9
                                                                                                                                          Italy                                    1.7     0.7    0.3     -10.1      4.2
                                                                            Eurozone
                                                                                                                                          Spain                                    2.9     2.4    2.0     -11.8      6.4
 85                                                                         China
                                                                            pre-Covid-19 World GDP path                                   Russia                                   1.8     2.5    1.3         -5.1   2.9
                                                                                                                                          Turkey                                   7.5     3.0    0.9         -4.7   4.0
 80
                                                                                                                                          Asia-Pacific                             5.2     4.7    4.2         -1.5   6.2
      2019-10

                2019-12

                          2020-02

                                    2020-04

                                              2020-06

                                                        2020-08

                                                                  2020-10

                                                                              2020-12

                                                                                        2021-02

                                                                                                  2021-04

                                                                                                            2021-06

                                                                                                                      2021-08

                                                                                                                                2021-10
                                                                                                                                          China                                    6.9     6.7    6.1         2.0    8.4
                                                                                                                                          Japan                                    2.2     0.3    0.7         -5.5   2.5
                                                                                                                                          India                                    7.0     6.1    4.2         -7.2   6.5
  Sources: national sources, Allianz Research                                                                                             Middle East                             1.4      0.9    0.3         -7.1   2.3
                                                                                                                                          Saudi Arabia                            -0.7     2.4    0.3         -5.1   2.0
China should continue to lead the way in the recovery
                                                                                                                                          Africa                                   3.1     2.7    1.9         -4.3   3.4
while the US should reach its pre-crisis GDP levels                                                                                       South Africa                             1.4     0.8    0.3         -8.2   2.7
end-2021. Europe will remain the laggard until 2022                                                                                       * Weights in glob al GDP at market price, 2019
even if divergence prevails (Germany and the                                                                                              NB: fiscal year for India

Netherlands
© Copyright Allianz recover faster than Spain, Italy, UK)                                                                                 Sources: national sources, Allianz Research                                       10
FISCAL IMPULSE: FOR CONSUMERS OR VOTERS?
                      Policy interventions to protect household purchasing power (in red countries with elections in 2020-21)
                                                 AUS    BEL      DEU       PER        CHL       ISR       FRA       GBR         ITA

 Expansionary monetary policy
 Temporary debt relief
 Targeted interventions
 Expansion of existing programmes
 Wage subsidies
 Temporary tax relief

                                                BRA     IND      PHI       SWE       HUN        JPN       S-KR       NTL        USA

 Expansionary monetary policy
 Temporary debt relief
  Targeted interventions
 Expansion of existing programmes
 Wage subsidies
  Temporary tax relief
    Sources BIS, IMF Policy Tracker, Allianz Research
© Copyright Allianz                                                                                                                   11
INVESTMENT: WITHOUT CONFIDENCE, CASH AND
      DEBT MAY PILE UP - FOR NOTHING
                          Non-financial corporations’                                                                       Credits (y/y) – Deposits (y/y)                      Unemployment rate, %
                         gross operating surplus, q/q*
                                                                                                               15%                                           14.0                          2019    2020            2021
30                                                                                                                            Eurozone             US                   12.5
                                                                                                                              UK                   China     12.0
20                                                                                                             10%

10                                                                                                              5%                                           10.0
                                                                                                                                                                                     8.5
 0                                                                                                                                                            8.0
                                                                                                                0%                                                                           6.5
                                                                                                                                                                                                             5.8
-10                                                                                                                                                           6.0
                                                                                                               -5%                                                                                                      4.2
-20                                                                                                                                                           4.0
-30                                                                                                            -10%
                                                                                                                                                              2.0
      01/07
              02/08
                       03/09
                               04/10
                                       05/11
                                               06/12
                                                       07/13
                                                               08/14
                                                                       09/15
                                                                               10/16
                                                                                       11/17
                                                                                               12/18
                                                                                                       01/20

                                                                                                               -15%
                                                                                                                                                              0.0

                                                                                                                                                                       France

                                                                                                                                                                                    UK

                                                                                                                                                                                            US

                                                                                                                                                                                                         Germany

                                                                                                                                                                                                                     China
                      US                           China                         UK                            -20%
                                                                                                                      01/04
                                                                                                                      02/05
                                                                                                                      03/06
                                                                                                                      04/07
                                                                                                                      05/08
                                                                                                                      06/09
                                                                                                                      07/10
                                                                                                                      08/11
                                                                                                                      09/12
                                                                                                                      10/13
                                                                                                                      11/14
                                                                                                                      12/15
                                                                                                                      01/17
                                                                                                                      02/18
                                                                                                                      03/19
                                                                                                                      04/20
                      France                       Germany

 Sources: Macrobond, Allianz Research; *for China: industrial profits                                             Sources: Macrobond, Allianz Research       Sources: Markit, Caixin, Allianz Research

      The Covid-19 profitability shock will                                                                      Cash hoarding from the private sector is    Deteriorating labor markets will
      weigh on companies’ investment future                                                                      a sign of lack of confidence and            continue to weigh on consumers
      intentions, notably as a majority of                                                                       suggests a difficult start for a new        confidence and keep precautionary
      State support schemes arrive at                                                                            investment cycle                            savings high
      maturity end of 2020
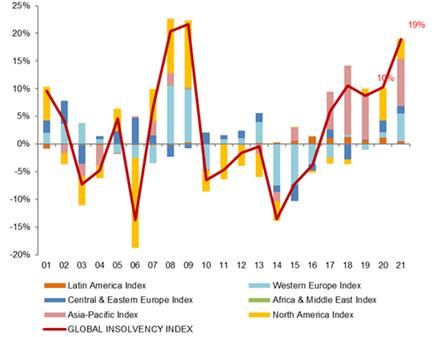
      © Copyright Allianz                                                                                                                                                                                            12
INSOLVENCIES: +31% BY END-2021 AS TEMPORARY
SUPPORT SCHEMES END
                             Insolvency figures and forecasts                                                     EH Global Insolvency Index (yearly changes in %)
                                   (selected countries)                                                                 and contribution of regional indices
                                         2020                                 Forecasts
                            Last point   3m y/y   Ytd y/y   2020     2021     2020 y/y 2021 y/y 2021/2019

      U.S.                 June           -11%     -3%      31 500   37 500     39%        19%    65%
      Canada               July           -26%    -30%       2 850    3 450      4%        21%    26%
      Brazil               June           -26%    -16%       3 450    3 800     20%        10%    32%
      Germany              June            -9%     -6%      19 350   20 850      3%         8%    11%
      France               August         -37%    -36%      46 800   62 000     -9%        32%    21%
      United Kingdom       June           -31%    -20%      22 929   30 072      4%        31%    36%
      Italy                                                 11 660   14 039      6%        20%    28%
      Spain                August          13%     -1%       4 600    5 600     11%        22%    35%
      The Netherlands      August         -23%     -7%       4 000    5 000      5%        25%    32%
      Russia               June           -25%     -4%      13 800   14 500     18%         5%    23%
      Turkey               July             8%      4%      17 200   18 400     22%         7%    31%
      Poland               July            32%      3%       1 100    1 210     13%        10%    24%
      South Africa         July            -7%    -20%       2 280    2 450     12%         7%    20%
      Morocco              June           -87%    -38%       8 861   10 456      5%        18%    24%
      China                August           1%      7%      13 500   14 700     14%         9%    24%
      Japan                August           1%      0%       8 600    9 400      3%         9%    12%
      India                June           -75%    -25%         750    2 100    -60%       180%    11%
      Australia            July           -51%    -34%       6 150    7 150     -4%        16%    12%
      South Korea          August         -34%    -41%         400      470     -3%        18%    14%
            GLOBAL INDEX                                                       10%        19%     31%

   Sources: Euler Hermes, Allianz Research                                                                   Sources: Euler Hermes, Allianz Research

Our EH Global insolvency index posted a -13% y/y decline in                                                 The ending of temporary factors will lead to a trend
Q2 and -7% y/y for H1. This drop in official registrations of                                               reversal starting end of Q3 or Q4 depending on countries
insolvencies continued in most countries during the summer,                                                 and accelerating in H1 2021. Our global insolvency index
due to (i) policy measures designed to avoid liquidity and (ii)                                             would surge by +31% by end of 2021, with all regions
changes in insolvency frameworks designed to give time and                                                  contributing to the rise. Should the recovery switch to L-
flexibility to companies before they resort to filing for                                                   shape the rises will be +50 to +60pp higher.
  © Copyright Allianz                                                                                                                                                13
bankruptcy.
TRADE: RECOVERY FOR TRADE IN GOODS, BUT
REMEMBER IT’S A SERVICE CRISIS
 Global merchandise trade in volume (100 =           Consumption components (% total, Europe)     Global trade growth, in volume terms and
            Sept. 2008 and 100 = Feb. 2020)                                                                     value (%, y/y)
 105                                                                                              15%
                                                                                                                    Volume             Price                13.0%
                                                                                                                                       10.2%
                    September 2008 /                                                              10%          4.0%
                                                                                                        3.3%                                9.7%            5.0%
 100                February 2020
                                                                                                   5%   2.8%1.9%3.0%
                                                                                                                    2.5%                              7.0%
                                                                                                                                  5.6% 4.3% 1.3%          3.5%
   95                                                                                              0%
                    June 2020                                                                                                     -2.0%
                                                                                                  -5%                                     -1.6%
   90
                                                                                                                                                   -13.0%
                                                                                                 -10%                     -10.8%
   85
            May 2020          May 2009                                                           -15%
                                                                                                                                                   -16.0%
   80                                                                                            -20%
        1      6       11   16     21    26   31
                   2020          2008-2009                                                       -25%
                                                                                                         13    14    15      16   17      18 19e 20f 21f 22f
Sources: CPB, Kiel, Allianz Research                Sources: Refinitiv, Allianz Research         Sources: Bloomberg, Euler Hermes, Allianz Research

Rebound is stronger than 2009. Yet                 Recession victims (cyclical durables,         Trade should contract -13% in 2020 (vs
transport & travel services will only              clothing & footwear etc.) are joined by       -15% previously). Oil + commodity price
recover in 2023 (2022 for goods).:                 “social   expenditure”     (transportation,   shock = negative price effect in 2020.
Reduced US - China uncertainty,                    restaurants & hotels, recreation & culture    2021 = return to 51 after ~44 in 2020, +
some
©               reshoring but no full de-
  Copyright Allianz                                services) which makes up 23% of private       lower USD boosting value of trade.     14
globalization.                                     consumption.
GLOBAL SECTORS: A MAJORITY OF SECTORS WILL
COME BACK TO PRE-CRISIS LEVELS POST 2021
•       (Food) Retail                                                                                          •   (Non-food) Retail
•       Pharmaceuticals                                                                                        •   Transportation (air)
•       Agrifood (food)
                                •   Electronics
                                •   Agrifood (farming)
                                •   Telecoms
                                •   Transportation (rail)
                                                            •   Household equipment
                                •   Machinery
                                                            •   Transportation (sea, road)
                                •   Construction                                                           •
                                                            •   Paper                                          Textiles
                                                            •   Transport equipment (ship, truck, train)   •   Transport equipment (aircraft)
    •    IT (services)                                      •   Metals                                     •   Automotive manufacturers
    •    Agrifood (beverages)                                                                              •   Automotive suppliers
    •    Chemicals                                                                                         •   Energy

© Copyright Allianz
GLOBALIZATION: NOT IMMUNE TO COVID19

         Number of investment projects*/M&A, growth, monthly                                                      Potential trajectories for international production and
                    average, Q2 2020 vs. all 2019                                                                                       global trade
             Textiles, clothing and leather -54                    -24                                                       RE-                  DIVERSIFICATION              REGIONALIZA              REPLICAT
                          Pharmaceuticals -51                                                       13                       SHORING                                           TION                     ION
      Accommodation and food services           -49                          -11
                                                                                                          IMPACT ON         Shorter, less        Continued fragmentation of   Shorter physical         Much shorter
    Motor vehicles, transport equipment             -41           -25
                                                                                                          INTERNATIONAL     fragmented value     supply chains.               supply chains, but       and less
                            Basic materials            -38              -18                                                 chains.                                           not less fragmented.     fragmented
                                                                                                          PRODUCTION                             Increased platform-based
                                     Trade                 -33               -11                                                                                                                       value chains,
                                                                                                                            Rebundling of        supply chain governance      Decentralized
     Computer, electronic, and electrical…           -40 -31
                                                                                                                            supply chain                                      governance,              Higher
                                                                                -9                                                               + concentrated VA
                                   Primary                    -29                          Crossborder                                                                        outsourcing              geographical
                                                                                                                            + concentrated VA    Increased offshoring and
                Machinery and equipment                        -28
                                                                 -26                       M&A deals                                                                                                   distribution of
                                                                                                                            Less offshoring/     outsourcing of services.     More geographically
               Transportation and storage                         -25 -18                                                                                                     distributed value        activities, but +
                                                                                                                            outsourcing                                                                concentrated
          Information and communication                       -29 -22                                                                                                         added.
                                                         -35                                                                                                                                           VA.
            Food, beverages and tobacco                              -21
                        Business activities                           -20 -12              Greenfield                                                                                                  + outsourcing
                              Construction                            -20-17               projects
                                                                                                          SECTORS THAT      High technology      Medium-low technology        Extractive industries,   Global hub and
       Financial and insurance activities                  -33           -17                              WOULD BENEFIT     intensity            intensity (textiles and      agro-based               spokes
  Electricity, gas, water and waste mgmt                          -25                      2              THE MOST          (automotive,         apparel)                                              (pharmaceutica
                                                                                                                                                                              High technology
                                                                                                                            machinery and        Financial services, business intensity                ls)
                                            -60    -50     -40    -30     -20    -10   0       10    20
                                                                                                                            equipment,           services
Sources: UNCTAD, Allianz Research                                                                                           electronics)                                      Regional processing
*With greenfield investing, a company will build its own, brand new facilities from the                                                                                       (food and beverage,
                                                                                                                            Wholesale and                                     chemicals
ground up. Different from brownfield investment happens when a company purchases                                            retail trade,
or leases an existing facility                                                                                              transportation and
                                                                                                                            logistics
# of announced greenfield projects and cross-border
M&As have seen a sharp decline. While some sectors
                                                                                                          Sources: UNCTAD, Allianz Research
could      benefit from “reshoring”, others could win from
  © Copyright Allianz                                                                                                                                                                                          16
diversification or regionalization.
SCARRING EFFECTS: 2021 INITIAL CONDITIONS ARE
DIFFERENT
           Strong state, redux                     Cold war, reloaded                          Zero interest rates, for longer
           State everywhere in life of business:   • Geopolitical rivalry between China        Monetary policy as backstop for
           • More public-private partnerships        and the US has increased                  banana markets and excessive risk-
           • Assertive and interventionist                                                     taking by debtors and investors
              governments and regulators, also     • Weaponizing of technology, trade,
              in social security                     currencies, payments etc.                 • New wealth inequalities (access to
           • Fiscal politics: threat of            • EU alone in pursuit of principled           property, savings opportunities)
              zombification                          recovery (green, equitable)               • Faustian fiscal-monetary bargain

           Agility+                                Consuming (risks) differently               Work from home anyone?
           Record-fast adaption to lockdowns       More demand for risk cover, including       Lockdowns have changed the way
           unleashed new pioneering spirit         tail risks but unsure about price of risk   we work for good
           • Change becomes much faster,           • Different consumption patterns and        • More flexible and innovative team
             including digital leapfrogging          Covid19-induced behaviors in                structures
           • Reset mentality v. sticky               services                                  • Risks to commercial real estate
             economics                             • Climate risk sensitivity up                 and productivity

© Copyright Allianz 30-Sep-20                                                                                                         17
CAPITAL MARKETS: IS THERE
A PRICE?

02
© Copyright Allianz
CAPITAL MARKETS: NOT THE TIME TO TAKE RISKS
1.   There is greater economic uncertainty than at the beginning of the year
                                                                                                    year-end figures                        Latest Value        Unit     2020        2021
     despite the current monetary and fiscal policy mix.
2.   There is more geopolitical risks than at the beginning of the year.             Eurozone
                                                                                     Sovereign Rates
3.   Valuations are tighter than at the beginning of the year.
                                                                                     10y yield “risk-free” sovereign (Bunds)                     -0.5            %       -0.5        -0.3
Sovereign Rates                                                                      10y Swap Rate                                               -0.2            %        0.0         0.3
With the short-end of most developed countries’ yield curves anchored by             Italy - Germany spread (10y)                                148            bps    175 (220)   160 (170)
their respective central banks, we expect a timid curve steepening towards           France - Germany spread (10y)                                27            bps     40 (90)     30 (40)
                                                                                     Spain - Germany spread (10y)                                 75            bps    90 (110)     80 (70)
the end of 2020 and 2021. This gradual increase in term premium will occur
                                                                                     Corporate Credit Spreads
on the back of higher inflation expectations and a halt in the recent decline
                                                                                     Investment grade credit spreads                             113            bps      180         150
of real yields.
                                                                                     High yield credit spreads                                   438            bps      750         600
On the other hand, long-term emerging market sovereign spreads look                  Equities
overbought. The combination of this extreme bullish positioning and the              MSCI EMU: total return p.a                                   -9             %       -22          10
current market fragility is a perfect combination for EM assets to become a
                                                                                     United States
victim of a second “risk-off” rotation in the wake of a second risky-assets
                                                                                     Sovereign Rates
market correction.
                                                                                     10y yield “risk-free” sovereign (Treasuries)                 0.7            %        1.0        1.4
Corporate Credit                                                                     Corporate Credit Spreads
                                                                                     Investment grade credit spreads                             136            bps      230         180
As of today, both investment grade and high yield corporate spreads look
                                                                                     High yield credit spreads                                   514            bps      800         650
too tight. Corporate credit markets remain detached from fundamentals on
                                                                                     Equities
the back of the central banks’ perpetual put option. We expect corporate
                                                                                     MSCI USA: total return p.a. in USD                            3             %       -20          15
spreads to converge towards higher values on the back of higher than                 Emerging Markets
expected market volatility and defaults.                                             Sovereign Rates
                                                                                     Hard Currency Spread (USD)                                  341            bps      450         370
Equities                                                                             Equities
                                                                                     MSCI EM: total return p.a. in USD                            -4             %       -24          20
Due to the persistent detachment from its fundamental determinants, the
recent global equity market rally is hardly justifiable. Because of that, we still       * Old forecasts in parenthesis
expect EQ market to underperform in 2020 and to start a muted rally in                   ** We have reviewed our EUR spreads down
   © Copyright Allianz                                                                   as the ECB impact on peripheral spreads was larger than anticipated.                               19
2021.
BOND MARKETS: PRICING STAGFLATION!
                       US – 10y Nominal Yield Breakdown                                 EMU – 10y Nominal Yield Breakdown
   5%              10Y market inflation expectations                  2%
                   Real 10y UST yield
   4%              Nominal 10Y UST yield
                                                                      1%
   3%

   2%
                                                                      0%
   1%

   0%
                                                                      -1%
                                                                                           Real 10Y EUR Swap
   -1%
                                                                                           10Y market inflation expectations
   -2%                                                                                     Nominal 10Y EUR Swap
                                                                      -2%
      2015              2016              2017   2018   2019   2020      2014            2015           2016   2017      2018   2019   2020
    Source: Refinitiv, Allianz Research                                Sources: Refinitiv, Allianz Research

Despite the recent repricing of long-term inflation expectations,      As in the US, long-term inflation expectations in the EMU
nominal yields have barely bulged thanks to a fall in real yields.     have been rising while real yields remain at historical lows.
To put current levels into perspective, at -1.1% real yields, are      All in all, US and EUR government bond markets are
now at the lowest point in recorded history. The current bearish       unwilling to believe in a rapid economic recovery scenario
growth positioning within the US government bond market                and are rather positioned for a stagflation scenario.
contrasts with the recent equity market exuberance, fuelling
doubts about the short- to mid-term equity market rally
sustainability.
 © Copyright Allianz                                                                                                                          20
INFLATION EXPECTATIONS: BACK TO SQUARE ONE!
               US – 10y Market-based Inflation Expectations                                          EMU – 10y Market-based Inflation Expectations
     %                                                                                      %
     3.0                                                                                    3.0

     2.5                                                                                    2.5

     2.0                                                                                    2.0

     1.5                                                                                    1.5

     1.0                                                                                    1.0
                                                 10-Year US TIPS breakeven inflation rate                            10-Year EUR breakeven inflation rate
                                                 In sample estimation                                                In sample estimation
     0.5                                                                                    0.5
                                                 Out-of-sample forecast                                              Out-of-sample forecast
                                                 +/- 1 std-deviation                                                 +/- 1 std-deviation
     0.0                                                                                    0.0
        2004          2006    2008        2010    2012     2014    2016    2018     2020       2008           2010           2012    2014       2016        2018   2020
    Source: Refinitiv, Allianz Research                                                     Sources: Refinitiv, Allianz Research
    The recent in crease in Oil and employment has led US                                   In contrast to the US case, EUR long-term inflation
    long-term inflation expectations to follow a V-shaped                                   expectations are nowhere near their “fair value”, as
    trajectory around their March low. Since the trough, inflation                          monetary stimulus has not convinced market participants.
    expectations are on an upward trajectory exacerbated by the                             According to our model, EUR inflation expectations could
    recent Fed’s decision to target an average inflation rate of                            still move closer to 1.5% in the near future, but any
    2%, (i.e. allowing some overshooting above 2%). According                               overshoot beyond that level would not be sustainable.
    to our “fair value” estimation, inflation expectations are
    unlikely to substantially overshoot the 2% upper limit.
© Copyright Allianz                                                                                                                                                       21
PRICES: DISINFLATION BEFORE MODERATE AND
 TEMPORARY OVERSHOOT STARTING IN 2022
                               Inflation rates, %                      Correlation between US inflation rates and equity
                        2020          2021          2022   2023

  Eurozone

  Central                0.3           0.9          1.2    1.4
  scenario

  Protracted            -0.1          -1.5          -1.2   -1.1
  crisis

  United States

  Central                1.1           1.6          2.1    2.7
  scenario

  Protracted             0.5          -0.4          0/7    0.7
  crisis
 Sources: Allianz Research                                        Sources: Allianz Research

In the short-term we expect disinflationary pressures to          Historically, US inflation levels persistently higher
prevail as supply recovers faster than demand. A                  than 3% or lower than 0% tend to go in sync with a
temporary and moderate overshoot is expected in the               substantial equity market correction.
US as soon as mid-2022 as the economy returns to pre-
crisis    levels
  © Copyright Allianz end-2021                                                                                             22
INVESTMENT POSITIONING: WHERE ARE THE BULLS?
        US – Mutual Funds & ETF Weekly Investment Flows                              EMU – Mutual Funds & ETF Weekly Investment Flows
USD Bn                                                        100 = 31.12.2019
                                                                                                                                                100 = 31.12.2019
                                                                                 USD Bn
 300                                                                     110     150                                                                       110
 250                                                                     105     100
 200                                                                                                                                                       100
                                                                         100
 150                                                                              50
                                                                         95
 100                                                                                0                                                                      90
                                                                         90
  50                                                                              -50
                                                                         85                                                                                80
   0
                                                                         80      -100
 -50                                                                                                                                                       70
-100                                                                     75      -150
-150                                                                  70         -200                                                                   60
   Dec-19                Feb-20        Apr-20     Jun-20         Aug-20             Dec-19              Feb-20           Apr-20      Jun-20        Aug-20
            Equity                              Bond                                       Equity                                 Bond
            Money Market                        Mixed Assets                               Money Market                           Mixed Assets
            Others                              S&P500 (RHS)                               Others                                 Stoxx 600 (RHS)
            Bond Index (RHS)                    Money Market Index (RHS)                   Bond Index (RHS)                       Money Market Index (RHS)
 Source: Refinitiv, Allianz Research                                              Sources: Refinitiv, Allianz Research

The recent US equity market frothiness is relatively hard to                      Differently, the Eurozone equity market does not show any
explain as both mutual fund and ETF flows show persistent                         signs of market exuberance (yet) as most EUR equity
transfers from Equity funds towards Fixed Income and                              indices have settled around -10%ytd. Nevertheless, looking
Money Market funds. This is a symptom of the current                              at fund flow data, one can see a small acceleration in the
market fragility as structural long-term investors seem                           inflows into EUR EQ funds, with Germany and France
unwilling to participate in the market, thus leaving the floor to                 leading the pack.
© Copyright Allianz                                                                                                                                                23
stock pickers and option traders.
CORPORATE CREDIT: HARD TO KEEP A PROMISE
                           US – Fed Corporate Purchases                                  US IG Issuance – Use of Proceeds

   50            Commercial Paper                               1400   100%
                 Corporate Credit                                                                               17%
   45                                                                             27%       27%                         24%           24%
                 Investment Grade Spread (RHS)                  1200                                  30%                       30%
                                                                       80%                                                                   38%    42%
   40            High Yield Spread (RHS)
                                                                                                                25%
   35                                                           1000              14%       13%                         22%
                                                                                                      11%                             25%
                                                                       60%                                                      17%
   30                                                                                                                                        19%    7%
                                                                800
   25
                                                                       40%
                                                                600                                             49%
   20                                                                             56%       56%       54%                       46%
                                                                                                                        50%           48%           48%
   15                                                                                                                                        40%
                                                                400    20%
   10
                                                                200                          5%        5%        9%     4%      7%
    5                                                                    0%        3%                                                  3%    3%     3%
                                                                                2012 2023 2014                  2015    2016    2017 2018 2019 2020
    0                                                            0
    Dec-19              Feb-20            Apr-20   Jun-20   Aug-20            Recapitalization                                 General Corporate Purpose
                                                                              Acquisition-related                              Refinancing
    Source: Refinitiv, Allianz Research                                Sources: S&P, Morgan Stanley, Allianz Research

Since April, the US Federal Reserve has bought up to ~45Bn             The $1.919tn Us corporate credit issuance in the first 9
worth of corporate credit. However, since the beginning of July,       months of 2020 has already surpassed the historical record
the Fed has significantly reduced its weekly purchases as credit       of $1.916tn set during the 12 months of 2017. Interestingly,
markets are once again extremely tight. Yet, credit markets            most of that fresh money will most likely not be invested into
spreads have not reversed back to pre-Covid19 levels and remain        the issuing companies as 42% of all new issuances are
10 to 20% above pre-pandemic levels.                                   expected to be dedicated to debt refinancing purposes.
© Copyright Allianz                                                                                                                                        24
EQUITY: TECH DOMINANT CLUSTER
                           US EQ – Sector Weightings                    30%                    EMU EQ – Sector Weightings
   35%
                                                                        25%
   30%
   25%                                                                  20%
   20%
                                                                        15%
   15%
                                                                        10%
   10%
    5%                                                                    5%

    0%                                                                    0%
      1975 1980 1985 1990 1995 2000 2005 2010 2015 2020                     1975 1980 1985 1990 1995 2000 2005 2010 2015 2020
             Recession               Technology                                   Recession                 Technology
             Health Care             Financials                                   Telecom                   Health Care
             Industrials             Ind. Goods & Svs                             Financials                Insurance
             Energy                                                               Consumer Staples
 Source: Refinitiv, Allianz Research (Only sectors with +10% weight*)   Source: Refinitiv, Allianz Research (Only sectors with +5% weight)

Historically, each financial cycle has been led by a limited group of   In the case of the Eurozone, the Equity market has been
companies usually clustered around one industry group / economic        permanently dominated, in terms of weight, by the financial
sector. These days, the technology sector accounts for more than        sector. Nevertheless, this dominance is starting to be
25% of the US EQ market capitalization** . Additionally, the            questioned by the technology and health care sector, as their
concentration risk is higher since, not only the sector accounts for    respective weights within the market have increased since the
more than one fourth of the index, but the number of companies          2008 Great Financial Crisis.
within the sector itself has been reduced by 20 to 40% since the                               * Sudden jumps in weightings are due to sector reclassification.
© Copyright Allianz                                                                                                                                                      25
Dot-com bubble.                                                                                ** Weights are based on the Datastream-Refinitiv Equity sector indices.
EQUITY EXUBERANCE: HIGH EXPECTATIONS!
                               Apple – Return expectations                                                      Market Expectations
                                                                                                                                                           Relevant past data
 90                                                            1,000.00                                                                                    for current return
                                                                                                                                 Expected annual rate of     determination
 80                                                                                              02.09.2020            Price           return (%)               (in years)
 70                                                            100.00
 60                                                                                           Alphabet-Google        1,717.39            21.5                    3.62
                                                                                                  Amazon             3,531.45             56.0                    1.66

                                                                       Log scale
 50                                                            10.00
                                                                                                   Apple               131.40             56.7                    1.58
 40
                                                                                                   Bitcoin           11,398.44            46.1                    1.79
 30                                                            1.00                               Oil Brent             44.51             -0.8                   24.21
 20                                                                                              Facebook              302.50             20.9                    3.64
 10                                                            0.10                                 Gold              1,940.23            7.6                     7.27
                                                                                                 Microsoft             231.65             33.3                    2.50
   0
                                                                                                   Netflix             552.84            46.7                     1.86
-10                                                             0.01                                Tesla              447.37            228.2                    0.60
       1980 1985 1990 1995 2000 2005 2010 2015 2020
                                                                                                TRY to 1 USD            7.38             18.4                     3.92
               Apple-Perceived return at annual rate in % (L.H.S)
                                                                                             Zoom Video Comm.          423.56            38.7                     1.97
               Apple (R.H.S)
  Source: Refinitiv, Allianz Research                                              Sources: Allianz Research

  The equity market is falling prey to a positive feedback loop                    As this expectation disproportionately depends on recent price
  whereby rising equity prices increase the demand for                             movements (the ones observed during only the last 1.6 years), it is
  equities, which in turn fosters further rises in prices. We                      inherently unstable. Furthermore, as the Apple stock is already trading at
  estimate, for example, that the recent performance of Apple                      a multiple of 40, little appreciation is to be expected from further PE
  leads market participants to expect a 56.7% annual return                        expansion; EPS growth will be the main driver of its future return, but a
  from Apple. In the past, this perceived return has been                          50%+ earnings growth looks ambitious and unsustainable.
  higher in only 1.2% of observations (i.e. 6 days out of 500).
© Copyright Allianz                                                                                                                                                      26
THE U.S. PIVOT, CHINA RELOADED,
AND THE ALMOST UNITED STATES
OF EUROPE

03
© Copyright Allianz
US ELECTIONS: 4 SCENARIOS

© Copyright Allianz 30-Sep-20   28
US ELECTIONS: SMALLER GOV. VS. BIG SPENDING
                                                                                                      U.S. public debt, % of GDP
             TRUMP                               BIDEN
   SPENDING, $bn (-2965)              SPENDING, $bn (+6435.85)                155%

1275        Infrastructure          970        Infrastructure (not            145%
                                               elsewhere)
-125        Higher education
                                    2000       Climate change                 135%
-280        Reform welfare
            programs & increase     750        Student loans
            parental leave                                                    125%
                                    1650       Health
-1550       Discretionary, non-                                               115%
            defense                 128.2      Schools

-400        Discretionary,          23.6       Defense                        105%
            defense                 240.5      Public-private investment              19    20   21   22   23   24   25   26    27   28   29   30
-1630       Health                  640        Housing plan                                           Biden      Trump         CBO
-255        Other spending cuts     33.55      Other spending
                                                                           President Trump’s intentions point   Both candidates have no real
   REVENUE, $bn (-1085)                        increases
                                                                           towards a supply-side oriented       intention to reduce the level of
-1370       Tax decrease                   REVENUE, $bn (+3686)            policy. Joe Biden's economic         public debt. We expect them to
                                    3746       Tax increases               platform gives more weight to        make public debt significantly
185         Reduce tax incentives
            & raise fees                                                   higher redistribution, but won't     increase above 150% of GDP by
                                     -60       Increase tax incentives
                                                                           stand as the most leftist aspects    2030, which should cause a
                                                                           of his entire platform.              negative    impact  on    growth
                                                                                                                                             29

 © Copyright Allianz                                                                                            potential.
AVERAGE INFLATION TARGETING: BUYING TWO
YEARS FOR THE US ECONOMY
     Average performance of the Fed in terms of inflation (%)                             Fed's Taylor function

    Sources: Wall Street Journal, Euler Hermes, Allianz Research   Sources: Euler Hermes, Allianz Research

    Since adoption of its 2% inflation target, the Fed has         For every quarter when 4-year average inflation is
    constantly failed in reaching it. In order to be credible,     below 2%, we incrementally rebalance the Taylor
    the Fed had no choice than rebalancing in favor of its         function in favor of job market stabilization. In this
    full employment mandate.                                       case, the first hike of the Fed is expected in Q3 2023
© Copyright Allianz                                                only.                                                    30
CHINA’S RECOVERY: UNEVEN BUT RESILIENT

     GDP growth (%) and contributions (pp)                                                     Activity indicators growth, %y/y                     Fiscal support & infrastructure investment
                                          Net exports                                   35                                                           35
14
                                          Gross Capital Formation                                                                                                                                     110
                                          Government Consumption                                                                                     25
                                          Private Consumption                           25
                                          GDP %y/y                                                                                                                                                    60
                                                                8.4                                                                                  15
 9                                                                                      15
                                                                                                                                                                                                      10
                                                                                                                                                      5
                                                                                         5
                                                                       2.0                                                                          (5)                                               (40)
 4
                                                                                        -5                                                                      Infrastructure investment,
                                                                                                                                                   (15)         ytd %y/y                              (90)
                                                                                                    Real industrial production %y/y
                                                                                       -15                                                         (25)         Local government                      (140)
                                                                                                  Nominal urban fixed assets
-1                                                                                                                                                              finances*, ytd %y/y, 4-
                                                                                                  Investment YTD, %y/y
                                                                       2020E
                                                                               2021E

                                                                                                                                                                month lead (rhs)
       2011
              2012
                     2013
                            2014
                                   2015
                                           2016
                                                  2017
                                                         2018
                                                                2019

                                                                                       -25        Nominal retail sales %y/y                        (35)                                               (190)
                                                                                           07 08 09 10 11 12 13 14 15 16 17 18 19 20                      12 13 14 15 16 17 18 19 20 21
Sources: National sources, Euler Hermes, Allianz Research                              Sources: National sources, Euler Hermes, Allianz Research   Sources: National sources, Euler Hermes, Allianz Research

After the initial Covid-19 related shock                                               The recovery has been uneven so far,                        The recovery is mostly policy-driven,
in Q1, the Chinese economy has                                                         being largely driven by the production                      with in particular infrastructure and real
surprised on the upside – in part thanks                                               side, against consumers still showing                       estate investment outperforming. We
to resilient exports. We expect the                                                    low confidence and a hit to disposable                      estimate fiscal support at 7.1% of GDP
recovery
© Copyright Allianzto extend into 2021.                                                income.                                                     in 2020. We expect smaller but still    31
                                                                                                                                                   large support in 2021 (c.5.5%).
CHINA’S POLICY EASING IS PEAKING

  Private non-financial sector debt service                   Credit impulse & manufacturing PMI                                           FX rates
                  ratio (%)
 25                                                      56                   Official Manufacturing PMI       25                                                         20
                                                                                                                     7.2
                                                         55                                                    20                                                         15
                                                                              Credit impulse, 12-month
 20                                                                           lead, rhs                                7                                                  10
                                                         54                                                    15
                                                                                                                     6.8                                                  5
                                                         53                                                    10                                                         0
 15                                                                                                 Forecast         6.6
                                                         52                                                    5                                                          -5
                                                                                                                     6.4
 10                                                                                                                                                                       -10
                                                         51                                                    0
                                                                                                                     6.2                                                  -15
                           China                         50                                                    -5
   5                                                                                                                   6                                                  -20
                           U.S.
                           Japan                         49                                                    -10         11 12 13 14 15 16 17 18 19 20
                           Germany                                                                                                 Spread (bp), rhs
   0                                                     48                                                    -15                 USDCNH rate
       04   06   08   10   12    14   16       18   20        09 10 11 12 13 14 15 16 17 18 19 20 21 22 23                         USDCNY central parity rate
Sources: BIS, Euler Hermes, Allianz Research             Sources: National sources, Euler Hermes, Allianz Research   Sources: Macrobond, Euler Hermes, Allianz Research

China’s debt service ratio had increased                 As the economic recovery is well                            In a context of China leading the global
rapidly following the GFC, before                        underway, the PBOC’s focus could                            recovery, and policy easing peaking, we
stabilizing from 2016 thanks to supply                   gradually turn to structural issues again.                  expect further room for appreciation for
side reforms. The Covid-19 crisis is                     We thus expect the peak of monetary                         the CNY vs. the USD, by c.3% over the
putting
©               upside pressures on the ratio
  Copyright Allianz                                      easing to be reached in coming months.                      coming year (USDCNY towards 6.6). 32
again.
BREXIT: A LAST-MINUTE COMPROMISE
                               Soft Brexit with very-last minute compromise and FTA         Hard Brexit on Jan 1st, 2021 with likely comeback into
                                         implementation by mid-2021 (55%)                    negotiations during 2021 after early elections (45%)

                                         2020                             2021                      2020                             2021

GDP growth, %                            -11.8                            +2.5                      -10.9                             -4.8

Consumer spending, %                     -13.3                             5.9                      -12.0                             0.7

Total investment, %                      -26.8                            -15.1                     -26.8                            -25.8

Exports, %                               -13.7                             1.8                      -13.7                            -13.0

Inflation                                 0.7                              1.5                       0.7                              4.5

Unemployment rate                         7.0                              8.5                       7.0                              10.0

GBP/EUR, annual change                    -2.0                            -3.0                       -2.0                            -10.0

Business insolvencies, %                  4.0                             31.0                       4.0                              53.0

Monetary policy                  QE increased by 5% of GDP (around GBP100bn) and              Rates cut into negative territory and QE increased by
                                 implemented until mid-2021, rates unchanged at 0.1%           GBP250-300bn, similar to the Covid-19 package

Fiscal policy                        2% of GDP in 2021 (after only 1.5% in 2020)          4% of GDP in 2021 mainly focused on infrastructure spending
                                 mainly focused on infrastructure spending and tax cuts   and measures to protect consumers purchasing power. State
                                                                                                  guaranteed loans prolonged until end-2021.

Gilt expectations and equity     10y GILT at 0.4%(eoy)          10y GILT at 0.6%(eoy)       10y GILT at -0.2%(eoy)          10y GILT at 0.1%(eoy)
strategy                       FTSE 100 at -22%yoy (eoy)      FTSE 100 at +10%yoy(eoy)    FTSE 100 at -50%yoy (eoy)       FTSE 100 at -10%yoy(eoy)
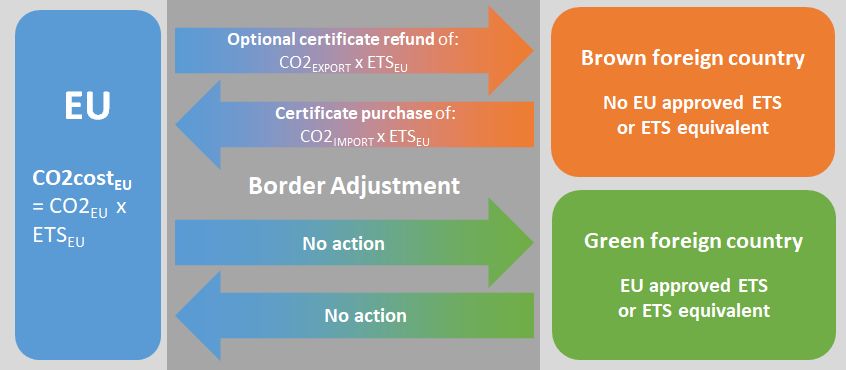
 © Copyright Allianz                                                                                                                                    33
EUROPE: A CARBON TAX FOR A PRINCIPLED
RECOVERY?
         Option 1: Carbon tariff on imports     Option 2: Extension of EU ETS to imports      Option 3: Tax on product’s CO2 content

Source: Allianz Research                      Source: Allianz Research                      Source: Allianz Research

• Tariff on implicit CO2 content of traded    • Purchase of certificates for implicit CO2   • Tax on implicit CO2 content of specific
  intermediates and final goods                 content of traded intermediates and final     goods
                                                goods
• WTO conformity requires comparable          • WTO conformity requires abandoning          • WTO conform
  pricing of domestic goods                     EU free allocation practice
• Possibility to “subsidize” exports to       • Possibility to “subsidize” exports to       • Not possibility to subsidize exports to
  brown countries                               brown countries                               brown countries
• Other carbon payments can be deducted       • Other carbon payments can be deducted
• Improves competitiveness of EU industry     • Improves competitiveness, endorsed by       • Basically just a carbon tax on some
                                                French government                             output goods
© Copyright Allianz                                                                                                                     34
CHINA: DUAL CIRCULATION IS ON

      High-tech exports from domestic                 U.S. companies’ investment plans in China China’s repackaged strategy: “dual circulation”
          companies (% of total)
                                                      100           Planning to increase investment                              •   Reroute some Chinese exports
                           2005      2012      2015                                                                                  domestically, given the crisis
                                                                                                                                 • Redirect                     consumers’

                                                                                                                 circulation
                                                                    No investment expansion planned /                                              Chinese

                                                                                                                 Domestic
 All products               8%       12%       19%     80           Planning to decrease investment                                  overseas spending domestically.
                                                                                                                                 • Encourage firms to become less
 Medical equipment         14%       34%       41%                                                                                   dependent on foreign supplies.
                                                       60                                                                         Further investment and supportive
 Telecoms equipment        11%       26%       26%                                                                               policies for strategic high-tech sectors.
                                                                                                          37                     Domestic circulation does not mean
 Electronic appliances      7%        6%       16%     40                        32                32
                                                                           31          31
                                                                    27                       26                                  closing its doors to foreign firms. As of

                                                                                                                 International
                                                                                                                  circulation
                                                                                                                                 August 2020, more measures to
 Semiconductors            14%       13%       14%            16
                                                       20                                                                        support foreign companies have been
                                                                                                                                 put in place than over all 2019.
 Integrated circuits        2%        5%       12%
                                                                                                                                  More reforms to liberalize the capital
                                                        0                                                                        account, support foreign investment
 Computers                  1%        1%        3%          2013 2014 2015 2016 2017 2018 2019 2020                              (especially in the services sector).
Source: Kennedy, The Fat Tech Dragon (CSIS, 2017)     Source: 2020 China Business Climate Survey Report        Source: Euler Hermes, Allianz Research

In the long run, China still aims to climb            Foreign cooperation and investment                       In May, China rebranded its long-term
up the global value chain. While there                should help in the path of technological                 strategy of industrial upgrade and
have been significant improvements in                 upgrade. However, the loosening U.S.-                    self-sufficiency into the expression
the past years, there is still large room             China relations could mean slowing                       “dual circulation”. The focus is still on
for
©    catching-up
  Copyright Allianz in high-tech sectors.             foreign direct investment into China.                    domestic high-tech and foreign 35
                                                                                                               investment.
EUROZONE: LABOR MARKET FAR FROM OUT OF THE
 WOODS, EU FUNDS COULD CUSHION PAIN
    Number of furloughed workers, increase in unemployment                EU support funds (% of 2019 national GDP)
            & inactive population and zombie jobs

   Sources: Eurostat, Allianz Research                           Sources: EU Commission, Allianz Research

In many large EU countries furlough schemes have been            The great equalizer? EU funds could provide
extended until 2021. While this is good news for the short-      important economic tailwind in the most impacted
term economic outlook, policymakers are not yet doing            economies, but implementation risk remains a key
enough to mitigate the risk of zombie jobs (reskilling, hiring   downside risk.
incentives
  © Copyright Allianzetc.).                                                                                           36
EUROZONE: INVESTMENT, THE LAST MAN RISING IN
THE RECOVERY
                      NPL loss simulations (2019-2021)          Eurozone: Fixed investment vs. Industrial confidence

    Sources: Allianz Research.                               Sources: Refinitiv, Allianz Research.

  Rising credit risk ( we expect NPLs to rise from 3.1% in   Heightened uncertainty around the economic outlook
  Q4 2019 to 4.7%-5.4% by end 2021) together with the        together with depressed margins will keep a lid on
  phasing out of public loan guarantees will weigh on        corporate investment in the coming months. In 2022,
  banks' readiness to extent credit to the private sector.   investment will still be 5% below pre-crisis levels.
© Copyright Allianz                                                                                                    37
GERMANY: MIND COMPLACENCY

         Germany: Real GDP (%) & its                       Key fiscal support measures (EUR bn)                    Germany: Industrial production
             components (pp)                                                                                         (change vs. Jan 2020, %)

 Sources: Refinitiv, Allianz Research.                 Sources: German Ministry of Finance, Allianz Research   Sources: Refinitiv, Allianz Research.

Germany's relatively resilient consumer -           No quick return to the black zero: Given the               The industrial rebound has been propped
  in part thanks to fiscal policy's focus           looming fiscal cliff in 2022 as most                       up by the automobile sector, but the
on stimulating demand at the expense of             measures     boosting     consumption      &               uneven global recovery, the strong EUR
the supply side - will drive the partial            income expire, expect the next government                  and high uncertainty won't allow for a full
rebound          in GDP in 2021, while trade will
 © Copyright Allianz                                to cushion the impact with fresh easing                    recovery before 2022.                38
                                                                                                                                                     3

remain muted.                                       measures.
FRANCE: GROWING CONCERNS FOR JOBS

          Consumer confidence survey                                        Outstanding bank deposits                                                                                                     Announced Phase II stimulus (EURbn)
                                                                             (index, Jan 2018=100)
          Major purchases intentions, next 12 months                                                                                                                            Covid-19-adjusted
                                                                                                                                                     Type of measure                                           France               Germany       Italy*
          Unemployment, next 12 months                         135                                                                                                               fiscal multiplier
                                                                                                                                                  Consumption taxes /
100       Savings intentions, next 12 months                   130                 US                           UK                                subsidies
                                                                                                                                                                                         0.10                      0                       31       1

80                                                             125                 France                       Germany                           Transfers                              0.10                     10                       14       3
                                                                                                                                                  Corporate taxes &
                                                                                                                                                                                         0.50                     30                       13       1
60                                                             120                                                                                competitiveness
                                                                                                                                                  Labor support (incl.
                                                                                                                                                                                         0.50                     20                       10      12
                                                                                                                                                  partial unemployment)
40                                                             115
                                                                                                                                                  Public consumption                     0.50                     15                       25       3
20                                                             110
                                                                                                                                                  Public investment                      0.85                     25                       50       2
  0                                                            105
                                                                                                                                                                                       TOTAL                     100                    143        31
-20                                                            100                                                                                                                  Share of GDP                4.3%                   3.8%       1.5%
-40                                                             95                                                                                                              Country-wide fiscal
                                                                                                                                                                                    multiplier                   0.55                      0.50   0.48
-60                                                             90
      01-04
      01-05
      01-06
      01-07
      01-08
      01-09
      01-10
      01-11
      01-12
      01-13
      01-14
      01-15
      01-16
      01-17
      01-18
      01-19
      01-20

                                                                                                                                                                                Impact of stimulus
                                                                     2018
                                                                            2018
                                                                                   2018
                                                                                          2018
                                                                                                 2019
                                                                                                        2019
                                                                                                               2019
                                                                                                                      2019
                                                                                                                             2020
                                                                                                                                    2020
                                                                                                                                           2020
                                                                                                                                                                                                                2.4pp                      2pp    0.7pp
                                                                                                                                                                                   on growth

                                                                                                                                                  *not all measures have been detailed, only partial categories. Totals might not add up

  Sources: INSEE, Allianz Research; Latest data: August 2020     Sources: Banque de France, Allianz Research                                        Sources: Euler Hermes, Allianz Research, IMF

   The household confidence indicator                           The EUR110bn emergency package                                                      The French structural reforms are
   (long term average =100) decreased                           from March 2020 helped to absorb                                                    good news for potential growth. But
   in July to 94 (from 96 in June) and                          the Covid-19 shock but also fueled                                                  in the short-term, we see the largest
   remained stable in August.
  © Copyright Allianz
                                                                cash hoardings of household and                                                     deterioration in merchandise trade 393
                                                                companies.                                                                          deficit (-EUR12bn over 2021-22).
ITALY: WORST-CASE SCENARIO AVOIDED
                                          GDP by component, %                                Evolution of public finances (in EUR mn)
       10.00
                            Households          GFCF              Government      80,000
         5.00               Stocks              Net Trade         real GDP        60,000
                                                                                  40,000
         0.00
                                                                                  20,000
                                                                                        0
        -5.00
                                                                                  -20,000

      -10.00                                                                      -40,000
                                                                                             01/20 02/20 03/20 04/20 05/20 06/20 07/20 08/20 09/20

      -15.00                                                                                Gov. net issuance               Gov. expenditures
                       12    13      14    15   16   17     18   19   20f   21f             Gov. balance

     Sources: Refinitiv, Allianz Research                                         Sources: Refinitiv, Allianz Research

Decline in real GDP smaller than previously expected (-10.1%).                    Additional EUR25bn fiscal package and EU RF (~200bn in
Robust manufacturing recovery with good start into Q3.                            loans and grants) mostly effective in 2021. Balance
Challenges: Tourism (-70% international arrivals), reversing                      between maintaining short term stimulus and returning to
stocks, difficult transmission of guaranteed loans to SME due to                  longer term fiscal prudence as public debt will soar to
banking sector weakness. In 2021, rebound of +4.3%.                               160% of GDP and primary balance remains a signal to
 © Copyright Allianz                                                              markets. Risk of fiscal inaction in H2.             40
SPAIN: THE COST OF INACTION

    Recession & Covid-19 sensitive consumption components   GDP growth forecast and potential impulse from stimulus
                         in % of GDP
                                                              10.0
                                                                                                                           7.4

                                                                5.0                                                  6.4              4.5
                                                                                                                                               3.5

                                                                                                                                2.5     1.5
                                                                0.0

                                                                          Impulse from fiscal stimulus, if
                                                               -5.0       fully implemented
                                                                          Baseline GDP growth and
                                                             -10.0        forecast
                                                                          Total GDP growth, boosted by         -11.8
                                                             -15.0        EU recovery fund
                                                                       14     15     16     17    18     19     20         21     22          23
    Sources: Refinitiv, Allianz Research                    Sources: National Statistics, IHS Data Insight, Allianz Research

    In Spain, among worst hit, % of consumption at risk     Spain could receive EUR140bn from the EU recovery
    (hotels, culture…) is among the highest (25%). Bad      fund in 2021. Yet continued political fragmentation
    omen for recovery. Seasonality of activity means the    (no 2021 budget voted) should delay the “relaunch”
    disappointing summer will also weigh on recovery.       stimulus. This could result in a shortfall of a
© Copyright Allianz                                         cumulated ~5pp of GDP growth during the recovery.                                        41
EMERGING MARKETS:
EXTERNAL TAILWINDS

04
© Copyright Allianz
EMERGING MARKETS: V-SHAPED RECOVERY IN
‘CHINA WORLD’, W-SHAPED ELSEWHERE
   Composite Manufacturing PMIs of ‘China-dependent’ and                         Net non-resident portfolio flows to EMs by region (USD bn)
       ‘non-China-dependent’ EMs vs. China’s PMI
  55                                                                 53.1       100            Africa & Middle East               Emerging Europe
                                                                                 80            Latin America                      Emerging Asia ex China
                                                                        51.0                   China
  50                                                                             60
                                                                       49.8
                                                                                 40
  45                                                                             20
                                                                                   0
  40                                                                             -20
                   China PMI
                                                                                 -40
                   'China world' EM Composite PMI
  35                                                                             -60
                   'Non-China world' EM Composite PMI
                                                                                 -80
  30                                                                           -100
       15        16         17          18         19         20                   18-01         18-07       19-01       19-07       20-01     20-07
  NB: ‘China world’ includes Taiwan, Hong Kong, Singapore, Indonesia, South    Sources: National statistics, IIF, Allianz Research estimates
  Korea, Brazil, Russia, South Africa.
  Sources: National statistics, IIF, Allianz Research estimates                Negative real interest rates should support risk appetite in
                                                                               the EM if no negative surprise on monetary policy or political
    EMs highly dependent on exports to China follow the
                                                                               risk. In addition, the USD depreciation (-2.5% end of 2021)
    latter’s business cycle with a lag. Other EMs
                                                                               and China’s recovery should also be positive.
    experienced a deeper recession and will see a slower
© Copyright Allianz                                                                                                                                        43
    recovery.
EMERGING MARKETS: TOO LITTLE OR TOO MUCH
   EMs pursuing government bond purchases (“’QE”) face                                                                                                   Sustainability of fiscal stimulus depends on interest rate-
          debt sustainability and inflationary risk                                                                                                             growth spread and debt maturity structure
                                                                                                                                                                   Emerging Asia
          Low                 Brazil                                                           High                                                                                                                      Egypt
                                                                                                                                                                   Emerging Europe
   inflationary risk                                                                    inflationary risk                                               25         Middle East
       High debt                                                                            High debt
                                                                                                                                                                   Africa
    sustainability                                                                       sustainability
          risk                          Costa Rica                                             risk                                                                Latin America

                                                         India                                                                                          20
                                                                                                                                                                                                   Hungary

                                                                                                            Debt to Average Maturity, 2020 (% of GDP)
                          Colombia                                                          Turkey
                                           Croatia
                                                                  Romania                                                                                                                                                            Croatia
                       Indonesia                                                  Hungary                                                                                                                      Sri Lanka
                                                  South Africa
                                   Philippines                                                                                                                                                                                        Brazil
                                                                         Poland                                                                         15
                               Malaysia
                                       Thailand                              Czechia                                                                                                                                 Morocco
                                                                                                                                                                     Angola
          Low                                                                                  High                                                                                                Belarus
                                                                 Chile                                                                                                                                                                             Ecuador
   inflationary risk                                                                    inflationary risk                                                                                                     Poland
       Low debt                                                                             Low debt                                                    10
    sustainability                                                                       sustainability                                                                                                      Dominican R.                                  Oman
                                                                                                                                                                                              Malaysia
          risk                                                                                 risk                                                                                                                  Ukraine
                                                                                                                                                                                                                                 Mexico                    Kuwait
                                                                                                                                                                                           India                        Colombia
                                                                                                                                                                                                    Turkey                                                      Qatar
                                                                                                                                                                                                             Romania Thailand              South Africa
  Sources: National statistics, IMF, IIF, Bloomberg, IHS Markit, Allianz Research                                                                                      Uruguay       Philippines
                                                                                                                                                        5
                                                                                                                                                                                                                                                      Saudi Arabia
16 EMs have announced and 13 of them have actually                                                                                                                                        Indonesia
                                                                                                                                                                                                             Chile
                                                                                                                                                                                                                     Kazakhstan
                                                                                                                                                                                                                            Peru
                                                                                                                                                                                                                                                           Azerbaijan
embarked on ‘QE’-like monetary stimulus in the wake of                                                                                                                                                                                         Russia

Covid-19. Some of them could see rising inflation                                                                                                       0
                                                                                                                                                             -10     -8       -6     -4        -2        0           2           4        6       8       10         12
and/or difficulties to roll over peaking maturing public                                                                                                           Projected Interest Rate–Growth Differential, 2020–21 (%)
debt
©        inAllianz
  Copyright  2021-2022. Paucity of policy mix is an issue.                                                  Sources: IMF, Allianz Research                                                                                                                                44
ASIA-PACIFIC: BENEFITTING FROM CHINA’S EARLY
RECOVERY CANNOT BE THE FULL STORY
   Drivers of growth: domestic (horizontal                                      External drivers: trade openness &                           Domestic drivers: monetary impulse and
       axis) vs. external (vertical axis)                                             exposure to reshoring                                               policy leeway
                                                                                                   Trade openness (% of GDP)                             Monetary impulse change (pt)
                                                                                                                                           10
                VNM                                                                            0         0.5         1         1.5     2                 NPL ratio (%)
                  TWN                            HKG                                     0.0
                                                                                                                                            8
                                        SGP                                                              JPN

                                                           More restrictive to foreign
                                   CHN                                                   0.1
                      KOR                                                                                                                   6
                                                                                                    KOR                  TWN     VNM

                                                                  investment
                  MYS             AUS           JPN
                                                                                         0.2                                                4
    IND                     THA         NZL                                                              IND
                                                                                                                               MYS
                                                                                                               THA                          2
               IDN                                                                       0.3
                                PHL                                                                      IDN
                                                                                                                                            0

                                                                                                                                                 MYS
                                                                                                                                                  JPN

                                                                                                                                                 TWN
                                                                                                                                                 HKG

                                                                                                                                                  IDN
                                                                                                                                                  IND
                                                                                                                                                 THA
                                                                                                                                                 AUS

                                                                                                                                                  NZL
                                                                                                                                                  PHL

                                                                                                                                                 VNM
                                                                                                                                                 CHN

                                                                                                                                                 SGP

                                                                                                                                                 KOR
                                                                                                   PHL
                                                                                         0.4
Size of bubble represents Covid-19 situation and shock.
Sources: Various, Euler Hermes, Allianz Research          Sources: Various, Euler Hermes, Allianz Research                                 Sources: Various, Euler Hermes, Allianz Research

The recovery path is determined by the                    South Korea, Taiwan, Vietnam, HK and                                             On top of that, their policy response has
epidemic situation, the size of the shock                 Singapore could benefit from China’s                                             been comparatively more restrained.
in H1 2020, exposure to external drivers                  early recovery. India, Indonesia and the                                         The policy leeway is smaller, due to
of growth, and the strength of domestic                   Philippines are comparatively less                                               structural issues.
drivers.
© Copyright Allianz                                       open, and could struggle more to attract                                                                                            45
                                                          foreign investment.
EMERGING EUROPE: FROM SUPPORTIVE TO
OVERHEATING?
       Monetary policy accommodation                                                                                           M2 growth (% y/y)                      Public debt (% of GDP)
    Rate cuts since March                                           Rate cuts in Jan-Feb                                             Czechia                                                72%          2021f
                                                                                                                                                          Hungary
    Current policy rate (rhs)                                       Gov. bond purchases                                              Hungary
                                                                                                                    25%                             50%                                                  2019
                                                                    (% of GDP; rhs)                                                  Poland               Slovakia                     56%
-900                                                                                                          9%                     Romania
-800                                                                                                          8%                                    45%
                                                                                                                                     Croatia               Poland                      55%
-700                                                                                                          7%    20%              Turkey (rhs)   40%
-600                                                                                                          6%                                    35%   Romania                     50%
-500                                                                                                          5%
-400                                                                                                          4%    15%                             30%
                                                                                                                                                          Czechia               39%
-300                                                                                                          3%                                    25%
-200                                                                                                          2%    10%                             20%   Bulgaria        25%
-100                                                                                                          1%
   0                                                                                                          0%                                    15%
                                                                                                                                                           Turkey                42%
 100                                                                                                          -1%    5%                             10%
           Ukraine
                     Turkey

                                       Czechia

                                                                                                   Slovakia
                                                 Poland
                                                          Romania

                                                                              Bulgaria
                              Russia

                                                                                         Croatia
                                                                    Hungary

                                                                                                                                                    5%     Russia         23%
                                                                                                                     0%                             0%
                                                                                                                       18-01    19-01      20-01                     0%    20%    40%        60%   80%   100%
Sources:                                                                                                            Sources:

CEE countries do not have much room for interest rate cuts anymore.                                                                                       Cyclical revenue weakness along with
Poland, Croatia and Turkey need monitoring with regard to government bond                                                                                 fiscal stimulus will widen fiscal deficits
purchases by the CBs. M2 growth has already accelerated in these countries.                                                                               and increase public debt-to-GDP ratios.
Looking ahead, this could raise inflationary pressures in 2021-2022.                                                                                      Yet, those ratios should remain in
InCopyright
©   Hungary Allianz and Romania, QE-like stimulus has been small so far.                                                                                  check, except for Hungary.           46 46
EMERGING EUROPE: WITH EUROPE OR AGAINST IT?
                 Unemployment rate (%)                  Russia: Isolated in the long run?               Turkey: Continued BOP crisis
20                Poland     Czechia     Hungary   Potential new / intensified Western           15%       Net ext. bank borrowing
                  Turkey     Russia      Croatia   sanctions, with firms linked to the Kremlin             Net portfolio inv. inflows
                                                   being the most likely targets, due to:                  Net FDI inflows
                                                                                                 10%
                                                                                                           Current account balance
15                                                 1. Alleged poisoning of Alexei Navalny
                                                       (most prominent leader of Russia’s         5%
                                                       independent opposition).
10                                                                                                0%
                                                   2. Involvement in Belarus crisis – events
                                                       that resemble those that occurred in
                                                       Ukraine in 2013-2014. Like then,           -5%
 5
                                                       Russia will not back down on its
                                                       interests.                                -10%

 0                                                                                               -15%
        2016 2017 2018 2019 2020 2021                                                                   00 02 04 06 08 10 12 14 16 18 20
                                                   Re-balancing of trade and investment
Sources:
                                                   flows to Russia away from Western
                                                                                                 Soft FX controls already in place, but no
Diverging paths depending on virus                 countries towards China will continue in
                                                                                                 excessive capital controls expected.
development and responsiveness to                  the next years. Such a shift was already
Europe’s recovery and policy activism.             strong in the wake of the 2014 sanctions,     Instead the policy interest rate should
Unemployment and inequality to rise in             softened a bit from 2018, but is likely to    eventually be hiked again by the end of
most vulnerable countries could cause              intensify again in the next years (also       2020 to reign in the sliding TRY exchange
social unrest                                      because of the China-U.S. tensions).          rate.                                  47
 © Copyright Allianz
You can also read