Aerial drone observations identified a multilevel society in feral horses - Nature
←
→
Page content transcription
If your browser does not render page correctly, please read the page content below
www.nature.com/scientificreports
OPEN Aerial drone observations
identified a multilevel society
in feral horses
Tamao Maeda1*, Sakiho Ochi1, Monamie Ringhofer2, Sebastian Sosa3, Cédric Sueur3,4,
Satoshi Hirata1 & Shinya Yamamoto2*
The study of non-human multilevel societies can give us insights into how group-level relationships
function and are maintained in a social system, but their mechanisms are still poorly understood. The
aim of this study was to apply spatial association data obtained from drones to verify the presence of a
multilevel structure in a feral horse society. We took aerial photos of individuals that appeared in pre-
fixed areas and collected positional data. The threshold distance of the association was defined based
on the distribution pattern of the inter-individual distance. The association rates of individuals showed
bimodality, suggesting the presence of small social organizations or “units”. Inter-unit distances
were significantly smaller than those in randomly replaced data, which showed that units associate
to form a higher-level social organization or “herd”. Moreover, this herd had a structure where large
mixed-sex units were more likely to occupy the center than small mixed-sex units and all-male-units,
which were instead on the periphery. These three pieces of evidence regarding the existence of
units, unit association, and stable positioning among units strongly indicated a multilevel structure
in horse society. The present study contributes to understanding the functions and mechanisms of
multilevel societies through comparisons with other social indices and models as well as cross-species
comparisons in future studies.
A multilevel society is a social structure with nested levels of social organization. Individuals are structured in
stable unit groups that preferentially associate with other units to form a higher level of social organization1–5.
Humans, for example, live in a multilevel society where families gather to form a local community, families
further combine to form higher social organization levels such as suburbs, cities, states, and countries. As a
multilevel society is characterized by polyadic interactions among units, it is important to understand how such
group-level relationships have evolved and been maintained. Multilevel societies occur in various taxonomic
groups of mammals, such as primates6,7, cetaceans8 and equines9–11, and have recently been found in one avian
species4. Previous studies have revealed that multilevel societies occurred sporadically via different evolutionary
processes, resulting in a large structural variety among various t axa12. The association pattern is different at each
social level in each species, even if the name given to that level of social organization is the same2,5,7,12,13. For
example, the third-level organization of hamadryas baboons (Papio hamadryas), i.e. “band”, shows consistent
association throughout a year12, while the third-level organization of sperm whales (Physeter macrocephalus),
i.e. “clan” (as a side note, “clan” refers to the second-level group in hamadryas baboons), is much more unstable,
and often lasts for a few d ays8. This makes it difficult to compare species and p opulations7.
In order to gain a better understanding of multilevel societies, quantitative evaluations at different organi-
zational levels and detailed comparisons among different species and populations are n ecessary2. Recently, an
increasing number of studies have applied numerical methods to evaluate the association patterns and social
structures of a multilevel society. The most frequently used index for quantifying social relationships is the asso-
ciation index (AI)7,9,14–18. It measures the portion of time individuals spend together in every dyad. Clustering
techniques or community detection algorithms are applied based on the AI scores to detect the stratification
of associations. It is concerning that some studies have arbitrarily decided the distance that suggests that two
individuals are “together” without examining whether it actually implies intimacy of the animals (c.f. 9,17,19, but
see 18). If the threshold distance is too small, it may miss the interactions at higher levels of social organization,
while if it is too large, it may not be able to detect the units. This causes difficulty when conducting a meta-analysis
1
Wildlife Research Centre, Kyoto University, 2‑24 Tanaka‑Sekiden‑cho, Sakyo, Kyoto, Japan. 2Institute for
Advanced Study, Kyoto University, Yoshida Ushinomiya‑cho, Sakyo, Kyoto, Japan. 3Université de Strasbourg,
CNRS, IPHC, UMR 7178, Strasbourg, France. 4Institut Universitaire de France, Paris, France. *email: tamao@
powarch.com; shinyayamamoto1981@gmail.com
Scientific Reports | (2021) 11:71 | https://doi.org/10.1038/s41598-020-79790-1 1
Vol.:(0123456789)
www.nature.com/scientificreports/
Figure 1. (a) The prediction on the histogram of inter-individual distances. When the group contains more
than two-levels of social organization with different sets of parameters for the attraction–repulsion model, the
histogram should be multi-modal. The distance of the first peak and the second peak are referred to as p1 and
p2, and the valley between p1 and p2 is v12. p1, and p2 could be considered as the most frequent value of inter-
individual distances within a unit and between units, respectively. v12 represents the threshold that divides the
intra- and inter-unit association. (b) The prediction on the inter-unit association. If units just coincide in the
same field (null model), units just spread in the foraging area. However, in multilevel society, units preferentially
associate and forage together. Thus, the inter-unit distance in a multilevel society should be smaller and have
steeper distribution than that of null model. The graphs were created using Microsoft Power Point for Mac
16.16.25 (https://office.live.com/start/powerpoint.aspx).
because each study determines the threshold individually, so the investigation of associations occurs at different
resolutions.
The aim of the current study was to use actual distances between individuals to develop more rigorous
methods for detecting a multilevel society and to evaluate their association patterns. The spatial aggregation of
animal groups is often explained using a repulsion and attraction model20,21. According to the model, animals
are likely to be within a certain distance from their neighbours when a kinetic equilibrium occurs. In a multilevel
society, animals should know the unit to which they belong and identify their own unit members, while also
allowing other units to stay together at a higher-level22,23. We assumed that different levels of social organizations
had different levels of equilibrium. In other words, when animal groups consist of two or more levels of social
organization, a histogram of inter-individual distances should be multi-modal (c.f. 24). In the case of a two-level
multilevel society, the most frequent values of inter-individual distances are within a unit and between units,
respectively (Fig. 1a). Units could be identified using an association index with a threshold around the first peak
because the same unit members should maintain the distance around it, while those from different units are
likely to avoid approaching that close.
In addition, each peak of the histogram should be centred around a lower value than the null-model when
animals are in fact gathering, not just when they coincide in the same place without any social drivers (i.e., null
model/random associations among units; Fig. 1b)25. It is highly likely that units have heterogeneous association
patterns and positional tendencies when units have non-random social relationships. When units prefer or avoid
certain units, such units would maintain a smaller or greater distance compared to the other units, which would
result in greater variations in association rates compared to the null model. The dominance hierarchy can also
affect the spatial positioning among units because at an individual level, it is known that dominant individuals
tend to occupy the centre of a group in various t axa26. Such positional and association patterns can also reinforce
the prediction of unit social aggregation, which would help understand the function of the multilevel society.
Equines are one taxon that exhibits a multilevel society. Most equine studies have focused on plains zebras
(Equus quagga)9, but multilevel societies have also been reported for the Przewalski’s horse (Equus ferus przew-
alskii)11, one subspecies of Asian wild ass (Equus hemionus luteus)10, and one population of feral horses (Equus
caballus)27,28. The societies of these species are two-tiered. In the current paper, we refer to the lowest level of
organization as a “unit” and the association of units as a “herd”. Units contain two types of social organization:
a harem composed of one or two adult males, several females and immature individuals, or an all-male unit
(AMU) or bachelor group, which is composed of adult males that could not attract any f emales29. Unlike harems,
whose memberships are usually stable for a few years or more30, herds show a fission–fusion structure and can
sometimes contain hundreds of individuals. According to studies on feral horses in Wyoming’s Red D esert27,28,
harems that share a foraging area follow similar seasonal movements and have a hierarchical relationship when
using a waterhole; thus, it can be argued that those harems form a herd. This synchronization of seasonal migra-
tion is also observed in studies of other feral p opulations13, indicating that herd formation is rather common,
and not specific to Wyoming’s Red Desert. However, the presence of multilevel societies in feral horses is still
questionable, as no study has examined whether the units gather to form a social organization or if they are
simply together because of the abundance of r esources13. To verify the presence of the herd, comparison with a
null model that takes into account the effect of the environment is necessary.
Scientific Reports | (2021) 11:71 | https://doi.org/10.1038/s41598-020-79790-1 2
Vol:.(1234567890)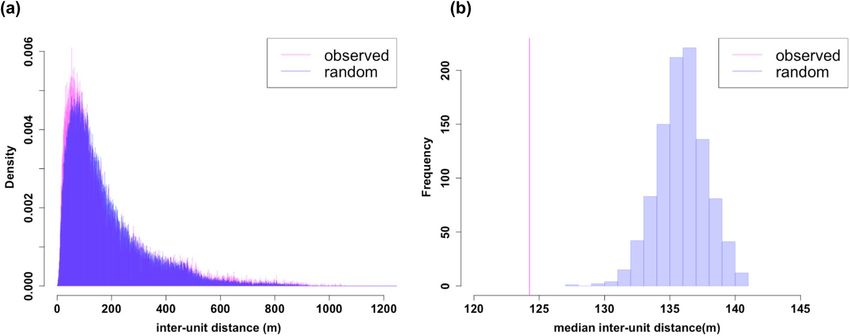
www.nature.com/scientificreports/
Figure 2. (a) Histogram of inter-individual distances showing clear bimodality. (b) The inter-individual
distance was converted to logarithmic scale and then fitted to Gaussian mixture model. The green and the red
lines represent the two estimated Gaussian distributions. (c) The unit-level association rate also showed bimodal
structure. We later examined the histogram of (c) to investigate how the association pattern was distributed
according to the individual’s belonging. The y axis of (c) is on a logarithmic scale. The graphs were created using
the statistical software R49.
Using distance metrics requires accurate spatial positioning of a focal group’s members. The recent develop-
ment of remote sensing techniques using unmanned aerial vehicles (UAVs, drones) enabled us to acquire spatial
patterns and record movements of large groups more easily and accurately than before. Feral horses show great
potential for studying multilevel societies. They live in an open habitat and there are many populations habitu-
ated to humans, which makes them a perfect research subject to test this new methodology using drones. In
addition, horses have the potential for cross-population and cross-species comparisons, as feral populations
exist worldwide. Our team has already applied these drone techniques for the observation of feral horses liv-
ing in Serra D’Arga, a mountain located in the north of P ortugal31, successfully identified individuals at an
intra-harem level, and analysed their positioning p atterns32–35. During the breeding season, multiple harems
and bachelors gather in the same field site and seem to form a large structure (i.e., a herd) without losing unit
structure, suggesting the presence of a multilevel society in the feral horses. In this study, we further developed
an identification method for a large number of horses to investigate how spatial data can be used to define and
evaluate the horse society in Portugal.
Our study tested whether the horse society had a multilevel structure using positional data in three steps: (1)
we examined them for the presence of unit groups, (2) we tested whether units were aggregating to form a herd,
and (3) we determined whether units have stable positional patterns within the herd by using social network
analysis. We hypothesized that (1) the distribution of inter-individual distances should be multi-modal if units
exist, (2) observed inter-unit distances should be smaller than randomized data, and (3) association rates and
centrality are significantly different among units.
Results
Presence of units. The histogram of the inter-individual distances showed two peaks (Fig. 2a). The Expec-
tation–Maximization (EM) algorithm36 fitted the inter-individual distance distribution to the Gaussian mix-
ture model (Fig. 2b). The estimated parameters were (wi , µi , σi) = (0.0879, 1.0212, 0.5560) and (0.9121, 2.0866,
0.3819). The two peaks were p1 = 101.0212 = 10.5 m and p2 = 102.0866 = 122.1 m. These two Gaussian distributions
intersected at x = 1.18921. Thus, v12 was defined as 101.18921 = 15.5 m. We used this distance as the threshold
that separated intra- and inter-unit associations in the following analysis. The histogram of the intra-unit-level
association rate (the ratio of the observation that each dyad was observed closer than v12) also showed a clear
bimodal structure (Fig. 2c). There was a large gap in the intra-unit-level association around 0.15–0.70. We con-
sidered dyads with intra-unit-level association rates larger than 0.70 as the same unit members, given that one
member of the pair was seen.
Our analysis identified 23 units (21 harems and 2 AMUs), and 5 solitary males. The mean ± SD of the intra-
unit-level associations were 0.91 ± 0.05 between individuals in the same unit and 0.009 ± 0.013 between those
Scientific Reports | (2021) 11:71 | https://doi.org/10.1038/s41598-020-79790-1 3
Vol.:(0123456789)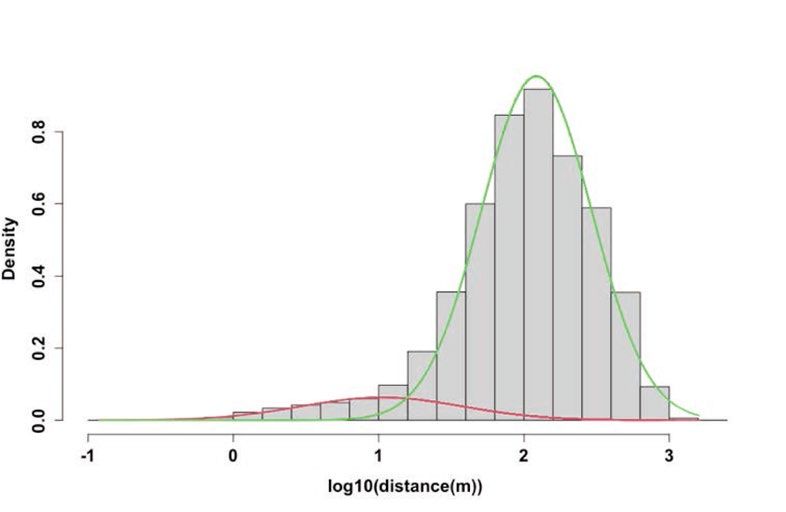
www.nature.com/scientificreports/
Figure 3. Observed horse position and the convex hulls that surrounds all of the observed positions of each
unit. Each unit has different colour dots and convex hulls. The image was created under QGIS 3.6 environment
(https://qgis.org/ja/site/index.html).
in different units. The mean ± SD distance of nearest-individuals within and between units were 3.2 ± 7.7 and
39.3 ± 56.1 m, respectively, and the mean ± SD inter-individual distances within and between units were 6.9 ± 7.5
and 170.5 ± 157.1 m, respectively.
This perfectly matched with the division we made based on manual group partitioning from the ground
observations. One male, Hirosaki, had one connection (association rate: 1.0) with one of the males in a harem
with two males, Takaoka and Uozu, but not with other members (0.57–0.69). Thus, we categorized this male as
solitary. In fact, we often observed fighting between Uozu and Hirosaki, which rarely occurred between Uozu
and Takaoka, and males in other multi-male harems. From this, we presumed that Hirosaki stalked the harem
to gain females. Among the other four solitary males, two were completely solitary as they moved within 15.5 m
of other individuals only once and twice, respectively. The other two showed flexible associations (they occa-
sionally were alone farther from the other horses, they sometimes followed AMUs and at other times they were
stalking a harem). The size of the harems ranged from 2 to 9 horses (average 5.3): 1–2 adult males, 1–7 adult
females, and 1–2 young individuals (Supplementary Table S1). Four harems were multi-male and the other 17
were single-male. Horses in the same unit always appeared in the field site together, with a single exception that
a female named Machida from Harajuku group, did not appear in the field on June 20th, although the other
unit members did.
Association of units. A total of 17.9 ± 4 harems (85.2 ± 19.2% of 21 harems) and 1.5 ± 0.5 AMUs
(75.0 ± 25.6% of 2 AMUs) were observed at the observation site each day on average (see Supplementary Fig. S4
for more detailed daily availability). UDOI was 1.10 ± 0.34 (mean ± SD); UDOI > 1 indicates that two home
ranges are associated with a high degree of overlap37. Each unit had 13.21 ± 5.1 others (out of 22 units) whose
UDOI was larger than 1. Until July 4th, the units foraged in Zone 2 and the horses were rarely observed in Zone
1. However, from July 5th to 10th, horses were also observed in Zone 1 and sometimes split between Zone 1 and
Zone 2 (Fig. 3). The association networks of these two periods had a high correlation, with r = 0.99 (Mantel test,
p < 0.001; Supplementary Appendix). In addition, the distance to the nearest unit was significantly smaller until
July 4th (mean ± SD: 35.0 ± 32.3 m) than after (54.4 ± 100.8 m; t (980.53) = 5.77, p < 0.001) according to Welch’s
test (Supplementary Appendix).
Scientific Reports | (2021) 11:71 | https://doi.org/10.1038/s41598-020-79790-1 4
Vol:.(1234567890)www.nature.com/scientificreports/
Figure 4. Histogram of (a) interunit distances and (b) the maximum interunit distances at each observation
49.
time and Zone. The graphs were created using the statistical software R
Figure 5. The social network based on the association matrix. The edge thickness represents the value of the
simple ratio index. It was created with ForceAtlas algorithm under Gephi0.92 e nvironment63. Nodes represent
units, where the pink one represents a multi-male harem, the light pink represents a single-male harem, and the
green represents an AMU. The names of the harems were based on the names of the adult male/s.
The permuted inter-unit distance and observed distance differed significantly according to the Kolmogo-
rov–Smirnov test (p < 0.001, Fig. 4a). Observed median inter-unit distances (median [1st, 3rd quantile] = 124.3
[66.9, 240.2] m) were significantly smaller than that of any randomized data (p < 0.0001, Fig. 4b).
Unit‑level social network analysis. The network of inter-unit association was shown in Fig. 5. In unit-
level social network analysis, we assumed that two units were preferentially associated when they were within
p2. The networks based on the average inter-unit distance had a significant positive correlation with this network
(r = 0.78, p < 0.001) according to the Mantel test.
The results of the regression analysis on the unit-level network are shown in Tables 1, 2 and 3. The associa-
tion rate among units correlated with the unit type similarity (coefficient: − 0.0685, p (|β| ≦ |r|) = 0.0001), but
Scientific Reports | (2021) 11:71 | https://doi.org/10.1038/s41598-020-79790-1 5
Vol.:(0123456789)www.nature.com/scientificreports/
Partial correlation p(β≧r) p(β≦r) p(|β|≦|r|)
(Intercept) 0.07088396 0.9951 0.0049 0.0087
|Sizei − sizej| − 0.0045139 0.0308 0.9692 0.061
Type similarity − 0.0685101 0.0001 0.9999 0.0001
|centralityi − centralityj| − 0.0029437 0.1027 0.8973 0.1988
Location overlap 0.51052251 >0.9999www.nature.com/scientificreports/
Secondly, further analysis showed that the assembly of units formed a herd not just because units occupied
the same location. Their foraging areas largely overlapped; thus, they did not have a territory. Moreover, the
observed inter-unit distances were smaller than the randomized data, which suggested attraction among units.
We observed an increase in the nearest-unit distance after units started to forage in Zone 1 from June 5th, which
may be because units were starting to disperse, losing the herd structure at the end of the breeding season. In
addition, the network analysis suggested that units were not just randomly associated with others, or that they
were associated with certain units. The regression analysis showed a correlation between unit type similarity
and the association rate, although the effect size was not very large. As we started our observations from 2016,
we still did not know about their detailed genealogy and life history (e.g., where they were born and how they
transferred from the units that they belonged to), which is highly likely to have considerable effects on inter-unit
social relationships9. A long-term accumulation of observation would be needed to further investigate the factors
that determine the inter-unit association patterns.
Finally, network analysis revealed the spatial structure of the herd, where larger harems occupied the centre
and AMUs tended to be at the periphery of the herd. In many social animals, dominant individuals often occupy
the centre, forcing subordinates to the p eriphery26. Applying the dominant-centre rule to group-level social
relationships, our data suggests that the hierarchical relationship is between units and correlates with harem
size. For many group-living animals, including social insects, wolves, hyenas, lions, humans, and other primates
39
, the ability to infer social dominance by assessing the numerical size of one’s own group relative to another
has evolved to reduce aggressiveness between groups. It has also been reported that larger feral horse harems
have priority access to water resources 28,40. However, inter-unit hierarchy has rarely been reported in multilevel
societies (but s ee11,15,41,42) because of the difficulty in measuring it due to few aggressive behaviours among units
43
. Spatial positioning could be a good parameter for measuring the dominance rank among units.
AMUs were often found to be at the most peripheral zone of the herd. Bachelor’s threat hypothesis argues
that harems assemble to form coalitions to decrease the risk of harassment, especially infanticide, and harem
takeover by bachelors, which is presumed to be the most plausible scenario for multilevel society evolution in
plains zebras44 and Asian c olobines45. Infanticide has been witnessed in both feral and captive horses, and foreign
males are involved in most c ases46,47. Our previous study by Inoue et al. (2019)32 found that harem males tended to
locate themselves in the outer area of units. This is supposedly because harem males are protecting their females
and foals from bachelors. Our discoveries on the positional differences between harems and AMUs among units,
and females and males among harem members support the assumption that herd formation benefits harems via
more effective protection from bachelors. This is also consistent with the fact that this association of the units
occurs only during the breeding/birth season.
These three results strongly indicate a multilevel structure in feral horse society. Our method of investigating
multimodal inter-individual distance distributions and the subsequent null-model analysis could be applied
to other populations and taxonomic groups to detect modular group structures with a minimum arbitrary
definition.
It has been reported that the association pattern of multilevel society changes dynamically10,18 and differs
among species1,17 because of various environmental and social factors. Adding information on group spatial
structure may facilitate further understanding of the functions and mechanisms underlying the formation of
multilevel social groups. For example, if herd formation benefits harems by providing effective protection from
bachelors, it is highly probable that the preference and cohesiveness of harems toward the centre of the herd may
change in response to the number of bachelors nearby. These spatial data could be used as an index to conduct
cross-species comparisons. For example, comparing our data with the study by Ozogany and V icsek11 showed
that units of the Przewalski’s horse appeared much more aggregated than those of the feral horse. Their study
suggested the pyramid-like structure of a herd, where the leader harem initiates the movement from the front.
We have never noticed such behaviour in the feral horse population we observed. Although the social structure
and reproductive strategy of these two species are quite s imilar13,30, the spatial dynamics of their herds seemed
considerably different. Further investigation of the spatial structure of various multilevel societies may reveal
new aspects to us.
In conclusion, our study described an innovative methodology that enabled the quantitative definition and
evaluation of multilevel societies using drones. More long-term observations, including collecting other social
indices such as genetic relatedness and social interactions (e.g., fighting), are needed to investigate the repeat-
ability of the method and to fully understand the dynamics of feral horse group structure, since this study only
dealt with spatial data over a short period of time. Interpopulation and interspecific comparisons of multilevel
societies have never been conducted with a non-primate species2. If our method is applied to other species, espe-
cially other equines, including feral horse populations, it would enable a meta-analysis based on inter-individual
distance distributions and network metrics, which may cast new light on multilevel societies. Further studies on
horses and other species are necessary to optimize this method and to explore a way to conduct cross-population
and cross-species comparisons.
Methods
Data collection. We conducted observations from June 6 to July 10, 2018 in Serra D’Arga Portugal, where
approximately 200 feral horses were living without human care31 (see Supplementary Appendix for detailed
information of the site). The observation period corresponded with the breeding and birth season of the horses.
The field site had two large flat areas, Zone 1 and 2, which were separated by rocky hills. We used drones (Mavic
Pro: DJI, China) to measure accurate distances between all individuals in the observation area. The flights were
performed under clear sky conditions at an altitude of 30–50 m from the ground, and we took successive aerial
photographs of the horses present at the site at 30-min intervals from 9:00–18:00. The average duration of each
Scientific Reports | (2021) 11:71 | https://doi.org/10.1038/s41598-020-79790-1 7
Vol.:(0123456789)www.nature.com/scientificreports/
Figure 6. (a) An example of the orthomosaic created from the successive aerial images from a drone. Each
brown dot on the field is a horse. Circles and arrows represent the units and solitary males partitioned based on
the distance distribution (see the results for details). White dots are free-ranging cows. (b) The enlarged view of
an orthomosaic. It captured an upright image of a harem named Kitakami. All horses on the orthomosaics were
identified. The points and labels represent the positions and IDs of each horse. Infants were named as “mother’s
name”_18. Both of the images were created using AgiSoft Photoscan professional 1.4.3 (https://www.agiso
ft.com).
flight was 4 min 27 s ± 3 min 5 s. As we had been using drones on this site since 201631,32, the horses were accli-
mated to the drones and did not show any behavioural response to UAV operations at this distance (see Sup-
plementary Appendix for a more detailed explanation of the drone operation). All procedures performed in the
studies followed international, national, and institutional guidelines for the care and use of animals. The field
observations complied with the guidelines for animal studies in the wild issued by the Wildlife Research Center
of Kyoto University, Japan (https://www.wrc.kyoto-u.ac.jp/guidelines/wild.html; in Japanese), and we signed a
Memorandum of Understanding with the Viana Do Castelo municipality, which governs the study area and our
field station. No further formal permission was required prior to conducting our research.
Orthomosaic imaging was conducted using AgiSoft PhotoScan Professional software version 1.4.3 (currently
referred to as AgiSoft Metashape). The software connected successive photos and created orthophotographs in the
GeoTIFF format under the WGS 84 geographic coordinate system. We first identified all horses from the ground
and made an identification sheet for all individuals, recording their physical characteristics such as colour, body
shape, and white marks on the face and feet. All horses in the orthophotographs were identified accordingly. We
estimated their age class as either adult, young, or infant. The adults were individuals who experienced dispersal
from their natal group, the young were those who were born in or before 2017 and still belonged to their natal
group, and the infants were individuals born in 2018. We excluded infants from subsequent analyses because
their position seemed highly dependent on their mothers. An orthomosaic corresponds to the coordinate sys-
tem at a pixel level; thus, it can be handled as a raster data structure in a QGIS environment. We positioned the
heads of the horses, and all locations were stored in shapefile formats (Fig. 6). Horses sometimes rested under
trees and were not visible from drones. In these cases, we identified the horses from the ground using binoculars
and recorded the position of the tree. We did not record the inter-individual distance in this case, but when
we calculated the average position of the units, we used the centre of the tree as a representative of their posi-
tions. We considered that the horses under the same tree were associated at the unit-level while calculating the
intra-unit-level association rate because the diameter of the trees was less than v12 (15.5 m). When there were
other horses closer than 15.5 m from the centre of the tree, we also counted them as associated. In addition,
we sometimes missed recording the horses. We eliminated the data with more than 30% of the available horses
located outside of the orthomosaic.
The coordinate system was converted to a rectangular plain WGS 84 / UTM Zone 29 N, and the distances
between all pairs of individuals in the same zone were calculated. In total, 238 orthomosaics were obtained in
19 days, and 21,445 non-infant individual positions were obtained. A total of 126 non-infant horses (119 adults:
82 females and 37 males, 7 young individuals: 6 females and 1 male) and 19 infants (11 females and 8 males) were
successfully identified. One adult female, named Oyama from Kanuma harem, disappeared sometime between
the evening of June 15th and morning of June 16th, probably predated by wolves. We observed 97 ± 28 individu-
als (mean ± SD: 77.0 ± 22.3%) in each observation, and we recorded 90 ± 28 individual locations (71.5 ± 22.3%).
We found that 473 horses had become invisible to drones and 1172 available horses were located outside of the
Scientific Reports | (2021) 11:71 | https://doi.org/10.1038/s41598-020-79790-1 8
Vol:.(1234567890)www.nature.com/scientificreports/
orthomosaic in total. In each observation, 92.8 ± 9.1% of the horses in the observation site were successfully
recorded. We considered each observation to be independent because at the unit-level, 8 min were enough for
them to change the a ssociation48, and horses moved 44.1 [30.5, 93.7] m (median [1st, 3rd quartile]) in 30 min,
which should be enough to change unit-level association as well.
Investigation into the presence of units and their definition. The rest of the analysis was performed
using the statistical software R 4.0.049. We first examined whether the histogram of inter-individual distances was
single- or multi-modal. We referred to the distance at the first and second peaks as p1 and p2, respectively, and
the distance at the valley between the first and second peaks as v12 (Fig. 1a). We referred to associations less than
v12 as intra-unit-level association specifically.
We fitted the inter-individual distance distribution to Gaussian mixture modelling with the Expectation–Max-
imization algorithm using the R package ‘mixtools’36. The distance data was transformed to a natural logarithmic
scale and then fitted to a Gaussian mixture model, i.e., ki=1 wk × N(µk , σk2 ), where k is the number of com-
ponents. We compared the Bayesian Information Criterion (BIC) of k = 1, 2, …, 20. BIC almost converged to
the same value when k ≧ 2, therefore, we decided to use k as 2 (Supplementary Fig. S5). We defined p1 and p2 as
10µ1 and 10µ2 and log10 (v12) as the intersection values of the two Gaussian functions. A network was generated
from an association matrix. We first set v12 as the threshold of intra-unit level association. Horses from the same
unit are likely to keep distance smaller than the threshold, and those from different units avoid getting closer
than that threshold. Thus, we also examined whether the intra-unit-level association rate also showed a bimodal
structure. We calculated the association rate using a simple ratio index (SRI, the probability of observing both
individuals together given that one has been seen). We chose SRI as an index according to the recommendation
of Hoppit and Farine50.
We examined each unit to ensure that individuals were connected to all the other unit members. If not, we
excluded those individuals from the unit and considered them as solitary. Some solitary males were also detected,
but we did not count them as units because they did not regularly show up in the observation sites, and even
when they appeared (Supplementary Fig. S4), they were mostly located in the peripheral area or they followed
a certain harem or AMU. To test the validity of this method, we also manually grouped individuals into groups,
where two observers decided units intuitively based on direct observations from the ground. We compared this
with partitions based on distance data.
Investigation of inter‑unit association. The bimodal histogram of association rates may occur even
without any multilevel social structure; for example, when each unit has its own territories or they overlap in a
site without any social interaction. To exclude these alternatives, we examined whether their foraging area dur-
ing observation periods overlapped and whether the inter-unit distances were smaller than randomized data
(Fig. 1b).
Firstly, we examined the home range overlaps of the units. We determined the central position of a unit as the
mean position of non-infant members, and the utilization distribution overlap index (UDOI)37 was calculated
for all pairs of units using the R package ‘adehabitatHR’51.
Secondly, we defined inter-unit distance as the distance between the center of the units. We then conducted a
randomization to test if the observed inter-unit distance was smaller than the randomized data. We only shifted
the observation time of horses, so that the dates of observation and the trajectories of horses were maintained.
This constraint eliminates the possibility that the spatial selectivity of horses drove the unit aggregation with-
out invoking any social mechanisms and to maintain the natural movements of horses. Observation time was
randomly assigned from three choices -30, 0, or + 30 min for each unit daily. The permutation was conducted
for 1000 repetitions for all data. The observed median inter-unit distances were compared to those calculated
from permuted datasets.
Creating unit‑level social network. We conducted a social network analysis to reveal the association
pattern and spatial structure of the multi-unit group. Social interactions of the horses were likely to occur mainly
with individuals in close proximity. The global structure of a group emerges from local interactions in many
animals52–54. Thus, we rearranged the distance data to association data by applying a method similar to that used
for defining units.
Networks were generated for each sampling period (i.e., each flight of drones), where nodes were defined as
each unit, and edges were scaled to 1 when the inter-unit distance was smaller than p2 (the second peak; Fig. 1a),
or otherwise scaled to 0 (the validity of this threshold value was examined in Supplementary Appendix). When a
pair of units were connected with each other either directly or indirectly via another unit, they were considered
to be associated. Solitary bachelors were excluded from the analysis. A unit-level association matrix was created
from this co-membership data using the SRI55.
We assumed that the network represented the actual spatial structure of the units. To confirm our assump-
tion, we compared it with a network created from the average distance matrix between all dyads of individuals.
The distance matrix was converted to an association matrix by taking the inverse of the squared average inter-
individual distance. We tested the correlation between these two networks by a Mantel test with 9999 randomi-
zations using the R package ‘ade4′56.
Social network analysis based on permutation. For the network based on the association (e.g., inter-
individual distance), it has been recommended to use data stream (pre-network) permutation, which swaps
pairs of nodes to obtain randomized networks from shuffled group affiliations57. The advantage of the data
stream permutation compared to post-network analysis is that it can control the confounding effects, for exam-
Scientific Reports | (2021) 11:71 | https://doi.org/10.1038/s41598-020-79790-1 9
Vol.:(0123456789)www.nature.com/scientificreports/
ple, sampling bias and location preferences, by constraining swaps to occur only within the same time period
or location57,58. However, a recent study pointed out that data stream permutation could cause high type I (false
positive) error in regression analysis when the society structure is non-random because the permutation proce-
dure could decrease the variance of the network variables59.
We first carried out data-stream permutations using the R package ‘ANTs’60. In total, 10,000 random networks
were created. The swaps were constrained by the sampling period and zones to control the units entering and
leaving the observation sites. The edge weight of the observed network was 0.375 ± 0.099 (mean ± SD). The SD
of the network was significantly higher than that of the permuted network (pright = 0.003).
Franks et al.58 provided a possible solution to control the confounding effects using post-network analysis
by importing their covariates into the regression analysis. For example, they added the location overlap into
the model as a covariate in dyadic analysis because associations could be affected by the preferences for the
locations. In the analysis of strength centrality, the sum of weights attached to edges belonging to a n ode61, they
recommended placing variables representing the sampling bias because oversampling may cause the excess
value of strength .
We conducted a regression analysis with the DSP procedure following the method explained by Franks et al.58.
We first developed a model to investigate whether the associations (edge weights) of each dyad could be explained
by coincidence in unit type (AMU or harem) and similarity in unit size. To eliminate the effect of location prefer-
ences, we used the ratio of two units that appeared in the same field on the same day. On a smaller scale, the unit
positional centrality could also affect the association; for example, the units in the central position are more likely
to be closer to the units in the center, rather than those in the periphery, as a natural consequence. Our analysis
revealed that the strength centrality correlated with the positional centrality (see Supplementary Appendix), so
we also added the difference in the strength as a covariate in the model. Multiple regression quadratic assign-
ment procedures (MRQAP) with DSP with 10,000 permutations were performed with ‘asnipe’ package in R 62.
The other model was built to investigate how strength centrality differed between harems and AMUs and
according to the harem characteristics, i.e., size and stallion number (either 1 or 2). We also included the mean-
centred number of observations as a covariate to control for sampling bias. We used the R code provided by
Franks et al.58 and conducted the DSP with 10,000 permutations of the residuals. The significance level was set
at 0.05 for all tests.
Received: 23 April 2020; Accepted: 14 December 2020
References
1. Grueter, C. C., Qi, X., Li, B. & Li, M. Multilevel societies. Curr. Biol. 27, 984–986 (2017).
2. Grueter, C. C., Matsuda, I., Zhang, P. & Zinner, D. Multilevel societies in primates and other mammals: Introduction to the special
issue. Int. J. Primatol. 33, 993–1001 (2012).
3. Matsuda, I. et al. Comparisons of intraunit relationships in nonhuman primates living in multilevel social systems. Int. J. Primatol.
33, 1038–1053 (2012).
4. Papageorgiou, D. et al. The multilevel society of a small-brained bird. Curr. Biol. 29, R1120–R1121 (2019).
5. Grueter, C. C. et al. Multilevel Organisation of Animal Sociality. Trends Ecol. Evol. https: //doi.org/10.1016/j.tree.2020.05.003 (2020).
6. Schreier, A. L. & Swedell, L. The fourth level of social structure in a multi-level society: ecological and social functions of clans in
Hamadryas Baboons. Am. J. Primatol. 71, 948–955 (2009).
7. Snyder-Mackler, N., Beehner, J. C. & Bergman, T. J. Defining higher levels in the multilevel societies of Geladas (Theropithecus
gelada). Int. J. Primatol. 33, 1054–1068 (2012).
8. Whitehead, H. et al. Multilevel societies of female sperm whales (Physeter macrocephalus) in the Atlantic and Pacific: Why are
they so different?. Int. J. Primatol. 33, 1142–1164 (2012).
9. Tong, W., Shapiro, B. & Rubenstein, D. I. Genetic relatedness in two-tiered plains zebra societies suggests that females choose to
associate with kin. Behaviour 152, 2059–2078 (2015).
10. Rubenstein, D. I. & Hack, M. Ecology and social structure of the Gobi khulan Equus hemionus subsp. in the Gobi B National Park,
Mongolia. In Sexual Selection in Primates: New and Comparative Perspectives 266–279 (2004). https://doi.org/10.1017/CBO97
80511542459.017.
11. Ozogany, K. & Vicsek, T. Modeling leadership hierarchy in multilevel animal societies. Cornell Univ. Libr. Phys. arXiv :1403.0260
(2014).
12. Swedell, L. & Plummer, T. A papionin multilevel society as a model for hominin social evolution. Int. J. Primatol. 33, 1165–1193
(2012).
13. Linklater, W. L. Adaptive explanation in socio-ecology: Lessons from the equidae. Biol. Rev. 75, 1–20 (2000).
14. Forcina, G. et al. From groups to communities in western lowland gorillas. Proc. R. Soc. B Biol. Sci. https://doi.org/10.1098/
rspb.2018.2019 (2019).
15. Zhang, P., Li, B., Qi, X., MacIntosh, A. J. J. & Watanabe, K. A proximity-based social network of a group of Sichuan snub-nosed
monkeys (Rhinopithecus roxellana). Int. J. Primatol. 33, 1081–1095 (2012).
16. de Silva, S., Schmid, V. & Wittemyer, G. Fission–fusion processes weaken dominance networks of female Asian elephants in a
productive habitat. Behav. Ecol. 28, 243–252 (2016).
17. Wittemyer, G., Douglas-Hamilton, I. & Getz, W. M. The socioecology of elephants: Analysis of the processes creating multitiered
social structures. Anim. Behav. 69, 1357–1371 (2005).
18. Qi, X. G. et al. Satellite telemetry and social modeling offer new insights into the origin of primate multilevel societies. Nat. Com-
mun. https://doi.org/10.1038/ncomms6296 (2014).
19. Stead, S. M. & Teichroeb, J. A. A multi-level society comprised of one-male and multi-male core units in an African colobine
(Colobus angolensis ruwenzorii). PLoS ONE 14, e0217666 (2019).
20. Ward, A. & Webster, M. Attraction, Alignment and repulsion: how groups form and how they function. In Sociality: The Behaviour
of Group-Living Animals 29–54 (Springer, Cham, 2016). https://doi.org/10.1007/978-3-319-28585-6_3.
21. Aureli, F., Schaffner, C. M., Asensio, N. & Lusseau, D. What is a subgroup? How socioecological factors influence interindividual
distance. Behav. Ecol. 23, 1308–1315 (2012).
Scientific Reports | (2021) 11:71 | https://doi.org/10.1038/s41598-020-79790-1 10
Vol:.(1234567890)www.nature.com/scientificreports/
22. Maciej, P., Patzelt, A., Ndao, I., Hammerschmidt, K. & Fischer, J. Social monitoring in a multilevel society: A playback study with
male Guinea baboons. Behav. Ecol. Sociobiol. 67, 61–68 (2013).
23. Bergman, T. J. Experimental evidence for limited vocal recognition in a wild primate: Implications for the social complexity
hypothesis. In Proceedings of the Royal Society B: Biological Sciences 277, 3045–3053 (Royal Society, London, 2010).
24. Bowler, M., Knogge, C., Heymann, E. W. & Zinner, D. Multilevel societies in new world primates? Flexibility may characterize the
organization of Peruvian red uakaris (Cacajao calvus ucayalii). Int. J. Primatol. 33, 1110–1124 (2012).
25. Farine, D. R. & Whitehead, H. Constructing, conducting and interpreting animal social network analysis. J. Anim. Ecol. 84,
1144–1163 (2015).
26. Hemelrijk, C. K. Towards the integration of social dominance and spatial structure. Anim. Behav. 59, 1035–1048 (2000).
27. Miller, R. Seasonal movements and home ranges of feral horse bands in Wyoming’s Red Desert. J. Range Manag. 36, 199 (1983).
28. Miller, R. & Dennisto, R. H. I. Interband dominance in feral horses. Z. Tierpsychol. 51, 41–47 (1979).
29. Feh, C. Relationships and communication in socially natural horse herds. In The Domestic Horse: The Origins, Development and
Management of its Behaviour (eds Mills, D. S. & McDonnell, S. M.) 83–93 (Cambridge University Press, Cambridge, 2005).
30. Boyd, L., Scorolli, A., Nowzari, H. & Bouskila, A. Social organization of wild equids. In Wild Equids: Ecology, Management, and
Conservation (eds Ransom, J. I. & Kaczensky, P.) 7–22 (Johns Hopkins University Press, Baltimore, 2016).
31. Ringhofer, M. et al. Comparison of the social systems of primates and feral horses: Data from a newly established horse research
site on Serra D’Arga, northern Portugal. Primates 58, 479–484 (2017).
32. Inoue, S. et al. Spatial positioning of individuals in a group of feral horses: A case study using drone technology. Mammal Res. 64,
249–259 (2019).
33. Inoue, S., Yamamoto, S., Ringhofer, M., Mendonça, R. S. & Hirata, S. Lateral position preference in grazing feral horses. Ethology
00, 1–9 (2019).
34. Ringhofer, M. et al. Herding mechanisms to maintain the cohesion of a harem group: two interaction phases during herding. J.
Ethol. 38, 71–77. https://doi.org/10.1007/s10164-019-00622-5 (2019).
35. Go, C. K. et al. A mathematical model of herding in horse-harem group. J. Ethol. https://doi.org/10.1007/s10164-020-00656-0
(2020).
36. Young, D. et al. Package ‘Mixtools’ Title Tools for Analyzing Finite Mixture Models. J Stat Software. 32(6), 1–29. https://doi.
org/10.18637/jss.v032.i06 (2009).
37. Fieberg, J. & Kochanny, C. O. Quantifying home-range overlap: The importance of the utilization distribution. J. Wildl. Manag.
69, 1346–1359 (2005).
38. Torney, C. J. et al. Inferring the rules of social interaction in migrating caribou. Philos. Trans. R. Soc. B Biol. Sci. 373, 20170385
(2018).
39. Pun, A., Birch, S. A. J. & Baron, A. S. Infants use relative numerical group size to infer social dominance. Proc. Natl. Acad. Sci. 113,
2376–2381 (2016).
40. Berger, J. Organizational systems and dominance in feral horses in the Grand Canyon. Behav. Ecol. Sociobiol. 2, 131–146 (1977).
41. de Silva, S. & Wittemyer, G. A comparison of social organization in Asian elephants and African savannah elephants. Int. J. Primatol.
33, 1125–1141 (2012).
42. Zhang, P., Watanabe, K., Li, B. & Qi, X. Dominance relationships among one-male units in a provisioned free-ranging band of the
Sichuan snub-nosed monkeys (Rhinopithecus roxellana) in the Qinling Mountains, China. Am. J. Primatol. 70, 634–641 (2008).
43. Grueter, C. & Zinner, D. Nested societies. Convergent adaptations of baboons and snub-nosed monkeys? Primate Rep. 70, 1–98
(2004).
44. Rubenstein, D. I. & Hack, M. Natural and sexual selection and the evolution of multi-level societies: Insights from zebras with com-
parisons to primates. In Sexual Selection in Primates: New and Comparative Perspectives 266–279 (2004). https://doi.org/10.1017/
CBO9780511542459.017.
45. Grueter, C. C. & Van Schaik, C. P. Evolutionary determinants of modular societies in colobines. Behav. Ecol. 21, 63–71 (2010).
46. Gray, M. E. An infanticide attempt by a free-roaming feral stallion (Equus caballus). Biol. Lett. 5, 23–25 (2009).
47. Boyd, L. & Keiper, R. Behavioural ecology of feral horses. In The Domestic Horse: The Origins, Development and Management of
its Behaviour (eds Mills, D. S. & McDonnell, S. M.) 55–82 (Cambridge University Press, Cambridge, 2005).
48. Christensen, J. W., Ladewig, J., Søndergaard, E. & Malmkvist, J. Effects of individual versus group stabling on social behaviour in
domestic stallions. Appl. Anim. Behav. Sci. 75, 233–248 (2002).
49. R Core Team. R: A Language and Environment for Statistical Computing (R Foundation for Statistical Computing, Vienna, 2019).
50. Hoppitt, W. J. E. & Farine, D. R. Association indices for quantifying social relationships: How to deal with missing observations
of individuals or groups. Anim. Behav. 136, 227–238 (2018).
51. Calenge, C. & Fortmann-Roe, S. Package ‘ adehabitatHR ’ v0.4.18. R CRAN Repos. (2020).
52. Couzin, I. D., Krause, J., James, R., Ruxton, G. D. & Franks, N. R. Collective memory and spatial sorting in animal groups. J. Theor.
Biol. 218, 1–11 (2002).
53. Hinde, R. A. Interactions, relationships and social structure. Man New Ser. 11, 1–17 (1976).
54. King, A. J., Sueur, C., Huchard, E. & Cowlishaw, G. A rule-of-thumb based on social affiliation explains collective movements in
desert baboons. Anim. Behav. 82, 1337–1345 (2011).
55. Cairns, S. J. & Schwager, S. J. A comparison of association indices. Anim. Behav. 35, 1454–1469 (1987).
56. Dray, S. & Dufour, A. B. The ade4 package: Implementing the duality diagram for ecologists. J Stat Software https: //doi.org/10.18637
/jss.v022.i0 (2007).
57. Croft, D. P., Madden, J. R., Franks, D. W. & James, R. Hypothesis testing in animal social networks. Trends Ecol. Evol. 26, 502–507
(2011).
58. Franks, D. W., Weiss, M. N., Silk, M. J., Perryman, R. J. Y. & Croft, D. P. Calculating effect sizes in animal social network analysis.
Methods Ecol. Evol. https://doi.org/10.1111/2041-210X.13429 (2020).
59. Weiss, M. N. et al. Common permutations of animal social network data are not appropriate for hypothesis testing using linear
models. bioRxiv 1–26 (2020). https://doi.org/10.1101/2020.04.29.068056.
60. Sosa, S. et al. A multilevel statistical toolkit to study animal social networks: Animal Network Toolkit ( ANT ) R package. bioRxiv
347005 (2018). https://doi.org/10.1101/347005
61. Sosa, S. Social network analysis. In International Encyclopedia of the Social & Behavioral Sciences 2nd Edn, 1–18 (eds Vonk, J. &
Shackleford, T. K.) (Springer, Berlin, 2018). https://doi.org/10.1016/B978-0-08-097086-8.10563-X.
62. Damien Farine. Animal Social Network Inference and Permutations for Ecologists in R using asnipe. Methods in Ecology and
Evolution. 4(12), 1187–1194. https://doi.org/10.1111/2041-210X.12121 (2014).
63. Bastian, M., Heymann, S. & Jacomy, M. Gephi: An open source software for exploring and manipulating networks. In International
AAAI Conference on Weblogs and Social Media 361–362 (2009).
Acknowledgements
The authors are grateful to Viana do Castelo city and the villagers in Montaria for supporting us and providing
hospitality during our stay. We thank Pandora Pinto, Renata Mendonça, Sota Inoue, Carlos Pereira, and Tetsuro
Matsuzawa for their great help with this project. CS is a junior member of the Academic Institute of France.
Scientific Reports | (2021) 11:71 | https://doi.org/10.1038/s41598-020-79790-1 11
Vol.:(0123456789)www.nature.com/scientificreports/
This study was supported by KAKENHI (No. 20J20702 to Tamao Maeda, No. 15H05309, 17H0582, 19H00629
to Shinya Yamamoto, No. 18K18342 to Monamie Ringhofer, No. 18H05524 to Satoshi Hirata, 16H06283 to Tet-
suro Matsuzawa), JSPS LGP-U04 to Tamao Maeda and Sakiho Ochi, and Kyoto University SPIRITS to Shinya
Yamamoto.
Author contributions
M.R., S.H., and S.Y. designed the concept and managed the project. T.M., S.O., M.R., S.H., and S.Y. established
the data collection method and T.M. and S.O. collected data. T.M., S.S., and C.S. conducted the analysis and
interpreted the results. T.M. wrote the manuscript with help from S.S., C.S., S.H., S.S., and S.Y.. All authors have
approved the final version of the manuscript and agree to be accountable for all aspects of the work related to
the accuracy and integrity of any part of the work.
Competing interests
The authors declare no competing interests.
Additional information
Supplementary Information The online version contains supplementary material available at https://doi.
org/10.1038/s41598-020-79790-1.
Correspondence and requests for materials should be addressed to T.M. or S.Y.
Reprints and permissions information is available at www.nature.com/reprints.
Publisher’s note Springer Nature remains neutral with regard to jurisdictional claims in published maps and
institutional affiliations.
Open Access This article is licensed under a Creative Commons Attribution 4.0 International
License, which permits use, sharing, adaptation, distribution and reproduction in any medium or
format, as long as you give appropriate credit to the original author(s) and the source, provide a link to the
Creative Commons licence, and indicate if changes were made. The images or other third party material in this
article are included in the article’s Creative Commons licence, unless indicated otherwise in a credit line to the
material. If material is not included in the article’s Creative Commons licence and your intended use is not
permitted by statutory regulation or exceeds the permitted use, you will need to obtain permission directly from
the copyright holder. To view a copy of this licence, visit http://creativecommons.org/licenses/by/4.0/.
© The Author(s) 2021
Scientific Reports | (2021) 11:71 | https://doi.org/10.1038/s41598-020-79790-1 12
Vol:.(1234567890)You can also read