Contribution to unravel variability in bowhead whale songs and better understand its ecological significance - Nature
←
→
Page content transcription
If your browser does not render page correctly, please read the page content below
www.nature.com/scientificreports
OPEN Contribution to unravel variability
in bowhead whale songs and better
understand its ecological
significance
F. Erbs1, M. van der Schaar1, J. Weissenberger2, S. Zaugg1 & M. André1*
Since the first studies on bowhead whale singing behaviour, song variations have been consistently
reported. However, there has been little discussion regarding variability in bowhead whale singing
display and its ecological significance. Unlike the better studied humpback whales, bowhead
whales do not appear to share songs at population level, but several studies have reported song
sharing within clusters of animals. Over the winter season 2013–2014, in an unstudied wintering
ground off Northeast Greenland, 13 song groups sharing similar hierarchical structure and units
were identified. Unit types were assessed through multidimensional maps, showing well separated
clusters corresponding to manually labelled units, and revealing the presence of unit subtypes. Units
presented contrasting levels of variability over their acoustic parameters, suggesting that bowhead
whales keep consistency in some units while using a continuum in values of frequency, duration
and modulation parameters for other unit types. Those findings emphasise the need to account for
variability in song analysis to better understand the behavioural ecology of this endangered species.
Additionally, shifting from song toward units or phrase-based analysis, as it has been suggested for
humpback whales, offers the opportunity to identify and track similarities in songs over temporal and
geographical scales relevant to population monitoring.
Bowhead whales (Balaena mysticetus) are highly vocal animals and during the coldest and darkest Arctic winter
months they exhibit an elaborated acoustic display that rivals the complexity of the better known humpback
whale songs1. Although the sex of the singers and the song function in bowhead whales are still unknown, it has
been hypothesised that singing behaviour plays a major role in mediating sexual i nteractions1–5 in a way similar
to humpback whales and s ongbirds6,7.
Bowhead whale songs have been described following the same hierarchical framework established to study
humpback whales, with sequences of repeated units composing phrases, phrases composing themes, and themes
composing a song1. Contrarily to humpback whales that share song within the same population, bowhead whales
appear to share songs within a limited cluster of a nimals5,8. In the first review of the earliest acoustic researches
on bowhead whales Würsig and Clark1 described a ‘great deal of intra and inter individual song variation’ and
the following studies have consistently reported song variability. The study of the variation in behavioural traits
such as the acoustic repertoire can provide insights on how sexual selection acts, at individual, group, popula-
tion or species levels, and shape acoustic phenotypes (i.e. songs). For example, song variations in humpback
whales have been used to investigate the function of song components in the context of inter- and intrasexual
selection9,10, to examine population connectivity or group dynamics (e.g.11–13), and to investigate mechanisms
underpinning gradual song evolution and cultural revolution (e.g.14–16).
In bowhead whales, variability is similarly present at different levels of the hierarchical song structure. At
the unit level, the unit contour shape can change through splitting, missing components, frequency shifts, or
modification in the number of inflection and modulation points2,3,17. Unfortunately, there are currently no clear
criteria establishing the acceptable level of variability within a unit type and the classification procedure remains
highly subjective. Manual or automated categorisation into unit types can be furthermore complicated by the
graded nature of the bowhead whale repertoire. For example, Johnson et al.8 described ‘subnotes’ (subtypes of
units) along a graded unit sequence (similar to gradual changes in units described in humpback whale shifting
themes18,19), where both unit duration and frequency parameters evolved along the song. The authors eventually
1
Laboratory of Applied Bioacoustics, Technical University of Catalonia, BarcelonaTech (UPC), Barcelona, Spain. 2FT
SST ERO, Equinor ASA, Oslo, Norway. *email: michel.andre@upc.edu
Scientific Reports | (2021) 11:168 | https://doi.org/10.1038/s41598-020-80220-5 1
Vol.:(0123456789)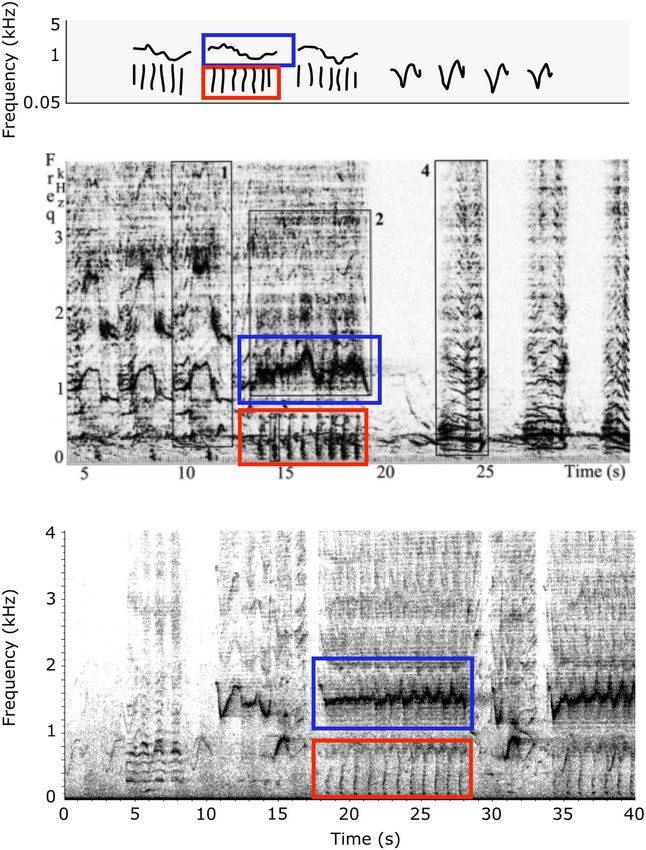
www.nature.com/scientificreports/
assigned the last units of the sequence to a different type, based on “trend of frequency”, a criterion that has
not been reported in other song studies. At the song level, one of the most variable components appears to be
the number of repetition of units per phrase. All studies describing song acoustic and structural parameters
report on a high level of variation, with repetition rates ranging from one to tens of times, and some units being
sometimes entirely omitted or rarely present in the s ong3,8. Directly linked to unit repetition, variability across
renditions of the same song have been previously reported including variability in song duration along a song
bout2 and the occurrence of ‘primitive versions’ during the initial development of a song as well as song variants
based on unit or phrase repetition, order or absence3,8. Similar variants have been recently identified as “song
fragments” in humpback whales songs20. Collectively, the bowhead whale acoustic studies indicate that variability
at multiples levels is an important part of the bowhead whale singing behaviour. Although this variability has
been consistently reported either as a qualitative descriptor of songs1,21 or with a statistical measure of disper-
sion in previous publications2,3,8,17, the study of variability itself has never been the central subject of bowhead
whale acoustic research.
Research challenges related to the bowhead whale Arctic distribution have constrained the advances of acous-
tic studies and although the first reports of bowhead whale songs date back to the early 1980s there have only
been a handful of publications since then describing their songs. Many of those studies have focused on song
diversity using the number of different songs as a single m etric2,3,5,8,21,22. At first glance, counting songs might
seem straightforward, but defining at which point a song is different enough to be considered new represents a
delicate problem when the signals to be categorised display high variability. Furthermore, integrating variability
in the definition of what is new or different is essential to delve into the potential functions of a song and advances
our understanding of singing behaviour in bowhead whales.
Here we used a one-year dataset that sampled bowhead whales from the critically endangered Spitsbergen
population in a previously undescribed overwintering area in Northeast Greenland coastal waters to examine
song variability. We selected songs shared by multiple individuals as a basis to focus on inter and intra individual
aspects of variability. The shared songs, displaying comparable song structure and unit acoustic characteristics,
were used to identify patterns of variations using semi-automated methods. We explored the potential ecological
and behavioural significance of this song variability within the bowhead whale mating context.
Methods
Study site and data collection. Acoustic data were collected in coastal waters of Northeast Greenland
(78°30′N and 10°0′W) on the continental shelf about 170 km offshore, close to the Northeast Water (NEW) pol-
ynya (Fig. 1). The NEW is an area of major interest as a summering ground for the Spitsbergen bowhead whale
population23.
The recording equipment was deployed during the Oden Artic Technology Research Cruise 2013 on the
23th of August 2013 and retrieved on the 17th of September 2014. The hydrophone, an AGUAtech Low-Power
Scientific Measurement Hydrophone (sensitivity -160 dB re 1 V/μPa), was directly connected to the acoustic
recorder, an RTSys EA SDA14 (RTsys, Caudan, France). The system was suspended a few tens of metres above
the sea floor using a subsurface float, in a water depth of 227 m. The recording was set on a duty cycle of 2 min
on and 30 min off, at a sampling frequency of 39,062 Hz in 24 bits. The data was hosted in the LIDO (http://liste
ntothedeep.com) framework and software package24.
Data annotation and measurements. The dataset was first subsampled to 25% (one out of four 2-min
files) and then explored to detect the occurrence of shared songs. Files were aurally and visually analysed by an
expert in Adobe Audition (Adobe Systems Inc., San José, CA, USA). Each 2-min file was displayed as a spec-
trogram (2048 point FFT, 75% overlap, Hann window for a frequency resolution of 19 Hz and a time resolution
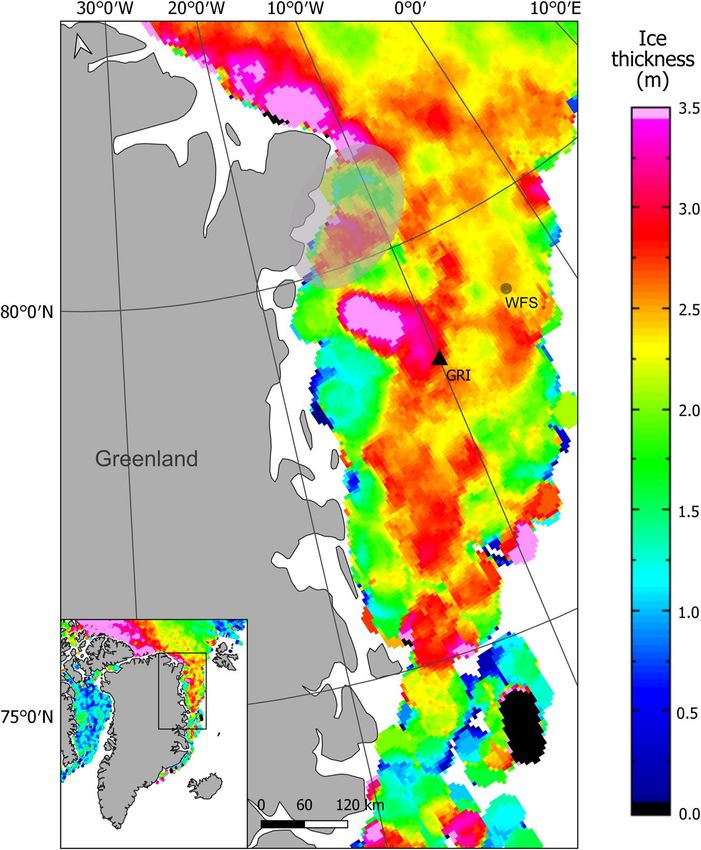
of 52 ms). The songs shared by multiple animals were identified based on two criteria: the songs overlapped in
time and contained similar unit types temporally arranged in similar phrases. Figure 2 shows an example of
three units with similar acoustic characteristics (frequency contour shape, medium frequency) overlapping in
time with each other (i.e. a second unit starts while a first unit has not ended yet), and associated with lower
frequency units also sharing between them similar acoustic characteristics. This indicates that three individuals
are sharing similar songs.
Two unit types were consistently present in most of the detected shared songs: a long whistle-like unit display-
ing multiple inflections (thereafter referred to as M unit type) and a short whistle-like unit usually containing
one inflection (S unit type). M and S units were temporally associated in a phrase, that was usually repeated
multiple times. Subsequently, the analysis was focused only on the songs containing M and S units. All the song
occurrences containing the M and S units were identified from the subsampled dataset. Songs were manually
classified into song groups. Song groups were defined as songs presenting a high level of similarity on the fol-
lowing aspects of the song characteristics and structure: overall similarity of the frequency contours of the units
M and S, presence of others unit types, order of units, and biphonation characteristics if present (overview given
in Table 1). The units were named after the overall shape of the frequency contours, and units belonging to a
particular song group were designed by adding the song group to their name (e.g. MSG11 refer to the units M
from the song group SG11).
Manual analysis was then conducted on all files from the same days where the songs were initially identified
to obtain more occurrences of these song groups. All occurrences, except the ones with a poor signal-to-noise
ratio, were selected for further analysis. The minimum number of occurrences for a song group was three, the
maximum was eight.
Scientific Reports | (2021) 11:168 | https://doi.org/10.1038/s41598-020-80220-5 2
Vol:.(1234567890)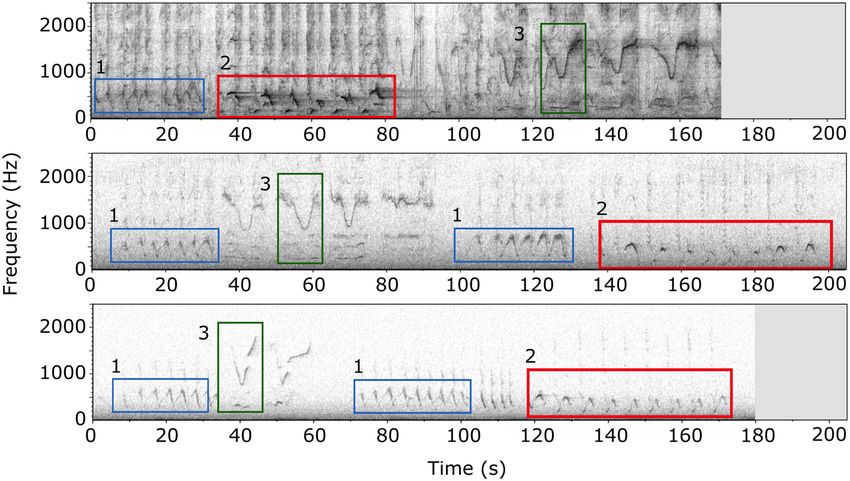
www.nature.com/scientificreports/
Figure 1. Map of the North East Greenland coast showing the Greenland I (GRI) recording location. Colours
as shown in legend represent sea ice thickness values for December 2013 (data from CryoSat-268). The grey dot
is the location of the Western Fram Strait recording location from previous studies mentioned in the t ext22,33.
The grey ellipse represents the position and extent of the Northeast Water polynya. (Map created using QGIS
v.3.8.3, https://www.qgis.org/).
Figure 2. Spectrogram screenshot of an example of 3 bowhead whales sharing similar songs, recorded on the
10th of December 2013. The 3 Units M are shown in colour to highlight their overlap in time.
Scientific Reports | (2021) 11:168 | https://doi.org/10.1038/s41598-020-80220-5 3
Vol.:(0123456789)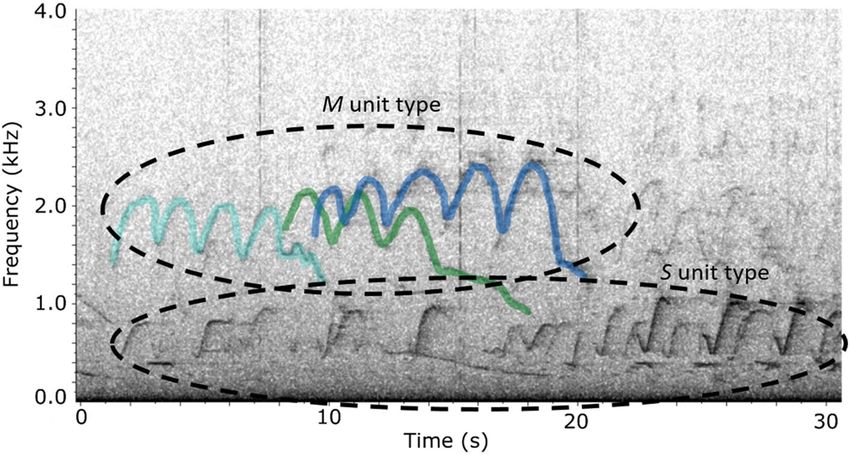
www.nature.com/scientificreports/
Nb. of M sLF sLF sLF
Song group distinct units rumble M inter S Vhigh down const const2 sup
SG1 2 X X
SG5 2 X X
SG9 3 X X X
SG12 3 X X X
SG2 4 X X X X
SG4 4 X X X X
SG11 4 X X X X
SG7 5 X X X X X
SG3 5 X X X X X
SG13 6 X X X X X X
SG6 6 X X X X X X
SG8 6 X X X X X X
SG10 6 X X X X X X
Table 1. Presence of unit types per song group. The order of the units in the table reflects the temporal
arrangement of units composing the song groups. Presence marked with an x, absence with an empty cell.
Measurement of unit’s parameters. In order to reduce subjectivity inherent to human observer cat-
egorisation, we investigated unit classification and variability using a semi-automated procedure based on unit
frequency, modulation and duration measurements. For each song group, all units occurring in a song were
assessed for inclusion in further analysis. A unit was selected if it was complete without overlap with other
signals. Spectrogram measurements of units comprising the songs were performed in Raven (version 1.5.0,
Bioacoustics Research Program25). Some of the measured units displayed biphonation, a nonlinear phenom-
enon consisting of the simultaneous production of two independent frequencies26. Due to degraded signal to
noise ratio in the lower frequencies, biphonated components were not measured in Raven, but an estimation
of their frequency bandwidth and duration were noted to allow comparison and define biphonation types. The
unit measurements consisted of frequency, modulation and duration parameters that are commonly used in
literature describing or classifying animal vocalisations. These parameters included minimum frequency (1),
maximum frequency (2), frequency bandwidth (3), frequency bandwidth 90% (4), and duration (5). Unit con-
tours were extracted using the Frequency Contour Measurements tool in Raven. The extracted contours were
imported in Matlab v.R2017a (MathWorks, Inc., Natick, MA, USA) and a custom-made smoothing function
(moving average) was applied to remove noise. Additional parameters (frequency start (6) and frequency end
(7), number of inflections (8), median frequency (9)) were automatically extracted in Matlab from the smoothed
contours. To describe the distribution of the parameters in each unit, the mean, standard deviation (sd) and
coefficient of quartile variation (cqv) were used. The cqv was preferred over the coefficient of variation to take
into account that some distributions were leptokurtic27.
Data analysis. After a normalisation process (centre by median, scale by range), the nine parameters
described above were used as features (Orange data mining toolbox version 3.18.0,28). Multidimensional scaling
maps (MDS), based on pairwise similarities, were produced to examine the pattern of acoustic variation in units.
MDS was used to provide an automatic way of investigating visually the grouping of units into clusters and to
determine whether unit types fell into distinct subtypes without stipulating a priori categories. MDS analysis
allows to view the clustering tendency of the data in a few dimensions, without forcing a certain number of
clusters as is needed for many clustering algorithms. Unit clusters from the manual analysis were plotted against
the MDS map to explore further the acoustic similarity/dissimilarity patterns. Kruskall stress and R-squared
values were used to assess the quality of the MDS m odel29,30. Higher R-squared values indicate that the distances
between points in the high dimensional feature space correlate well with the distances between the same points
in the MDS projection. Similarly, a stress value inferior to 0.05 suggest that the goodness of fit of the MDS dis-
tance model can be considered as good29. Correlation between the selected features and the MDS dimensions
was used to provide an interpretation of the MDS dimension.
In order to compare the results to a fully automated clustering method, a hierarchical clustering (average
linkage, based on Euclidean distances) was performed on the dataset. To take into account the higher variability
regarding the M units, the dataset was split into two subsets, the M units and all the other units (named Except-
M). The hierarchical clustering algorithm was run on each dataset. Cluster solutions from the semi-automated
(MDS map) and fully automated method (hierarchical clustering) were assessed for performance using a cluster
validity measurement, the Silhouette index. This index is an indication of clustering quality and takes values
between -1 and 1. The higher the silhouette value is, the better is the quality of clustering, i.e. the intra-cluster
issimilarities31,32.
dissimilarities are small compared to the inter-cluster d
Scientific Reports | (2021) 11:168 | https://doi.org/10.1038/s41598-020-80220-5 4
Vol:.(1234567890)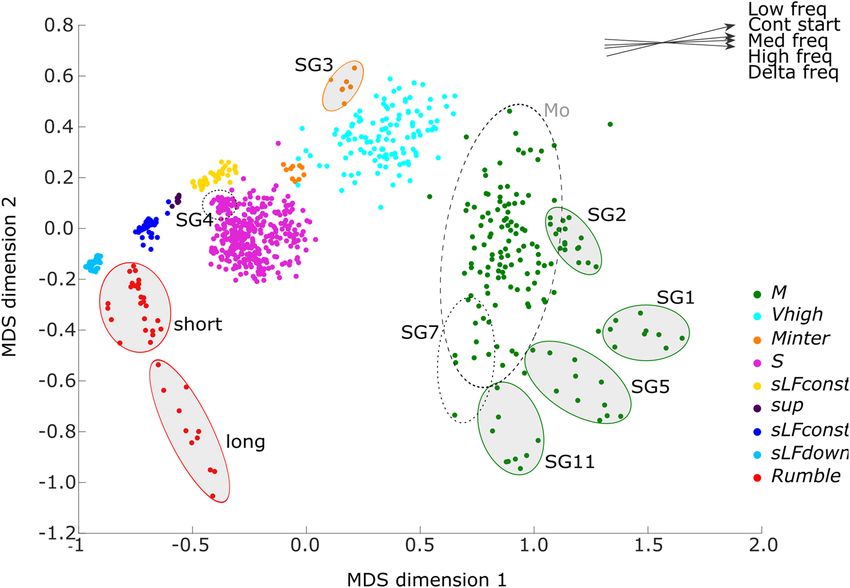
Scientific Reports |
                    (2021) 11:168 |
                                                                                                                                                                                                                                                               www.nature.com/scientificreports/

                    https://doi.org/10.1038/s41598-020-80220-5
                                                                 Figure 3.  Examples of each of the 13 bowhead whale song groups recorded during December 2019 and January 2014. (a) SG1, (b) SG2, (c) SG3, (d) SG4, (e) SG5, (f) SG6, (g) SG7, (h) SG8, (i)
                                                                 SG9, (j) SG10, (k) SG11, (l) SG12, (m) SG13. Square boxes show an example of unit types present in each song. (Spectrogram parameters: 1024 pts FFT, 50% overlap, Hann window).

                    5

Vol.:(0123456789)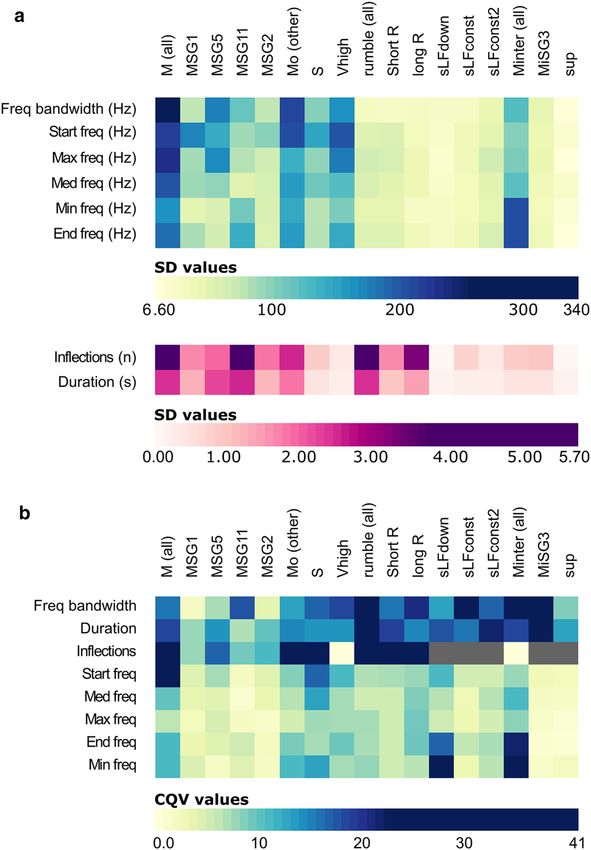
www.nature.com/scientificreports/
Unit Min freq (Hz) Max freq (Hz) Median freq
Unit type sub-type n low freq high freq Delta freq (Hz) Start freq (Hz) End freq(Hz) (Hz) Delta time (s) Inflections
M 158 1055 ± 165 (11) 2160 ± 237 (6.1) 1105 ± 340 (16) 1724 ± 222 (25) 1142 ± 187 (11) 1672 ± 204 (10) 8.46 ± 2.4 (19) 8.8 ± 4.0 (25)
2012 ± 88.1
MSG1 9 1077 ± 46.6 (4.4) 2069 ± 85.3 (1.7) 1532 ± 74.3 (1.7) 2002 ± 174 (4.0) 1122 ± 83.5 (3.1) 14.1 ± 1.2 (7.6) 13 ± 1.6 (7.7)
(3.4)
762.4 ± 55.3 820.2 ± 60.1 1894 ± 94.2
MSG5 12 2586 ± 168 (4.7) 1823 ± 176 (6.9) 1817 ± 143 (7.1) 10.5 ± 2.2 (14) 9.1 ± 1.9 (17)
(1.6) (4.1) (3.9)
1512 ± 48.5
MSG11 12 1271 ± 109 (4.2) 1771 ± 77.9 (1.7) 501.0 ± 114 (18) 1722 ± 87.7 (1.7) 1438 ± 141 (5.4) 9.09 ± 2.5 (6.7) 17 ± 5.7 (9.1)
(0.9)
1923 ± 58.5
MSG2 17 1163 ± 55.5 (1.7) 2246 ± 62.3 (1.3) 1083 ± 72.8 (3.5) 1962 ± 98.5 (3.9) 1225 ± 53.2 (1.9) 8.84 ± 1.1 (10) 9.1 ± 1.8 (11)
(3.0)
Mo 108 1046 ± 144 (11) 2015 ± 139 (4.9) 1060 ± 216 (13) 1654 ± 210 (8.4) 1125 ± 157 (9.0) 1598 ± 157 (6.5) 7.63 ± 1.8 (15) 7.3 ± 2.5 (29)
803.0 ± 78.0
S 351 461.7 ± 76.2 (13) 872 ± 93.7 (7.3) 410.6 ± 99.7 (17) 593.0 ± 149 (17) 728.3 ± 110 (13) 1.47 ± 0.4 (14) 1.4 ± 0.8 (33)
(7.2)
Vhigh 120 973.4 ± 103 (7.2) 1605 ± 179 (7.2) 631.6 ± 166 (19) 1461 ± 204 (11) 1155 ± 145 (9.5) 1095 ± 124 (7.2) 0.61 ± 0.2 (14) 1.0 ± 0.3 (0.0)
234.7 ± 43.7 319.6 ± 61.3 278.9 ± 51.2 272.7 ± 52.6 279.5 ± 55.8
rumble 37 84.85 ± 26.5 (24) 4.44 ± 2.4 (38) 7.3 ± 4.9 (38)
(7.8) (7.2) (6.7) (6.9) (5.1)
221.4 ± 43.7 298.0 ± 57.0 265.9 ± 54.0 258.6 ± 52.9 257.7 ± 47.5
short R 26 76.67 ± 22.1 (16) 3.05 ± 0.9 (19.2) 4.5 ± 1.6 (33)
(5.2) (5.1) (6.9) (5.2) (5.2)
266.3 ± 22.3 370.5 ± 36.6 309.5 ± 29.1 306.0 ± 33.1 331.2 ± 36.6
long R 11 104.2 ± 26.1 (21) 7.74 ± 1.4 (15) 14 ± 3.3 (24)
(6.3) (9.2) (7.7) (9.4) (8.6)
202.2 ± 15.9 147.7 ± 20.8
sLFdown 37 83.12 ± 24.0 (25) 119.1 ± 22.8 (13) 180.1 ± 20.4 (11) 110.6 ± 22.1 (17) 0.55 ± 0.1 (18) 0.0 ± 0.0 (NA)
(5.3) (6.5)
341.0 ± 30.4 412.0 ± 32.1 383.8 ± 32.8 370.8 ± 31.2 376.8 ± 28.5
sLFconst 41 71.01 ± 23.7 (27) 0.91 ± 0.2 (16) 0.3 ± 0.7 (NA)
(2.9) (2.9) (5.0) (6.0) (2.6)
589.8 ± 44.3 713.2 ± 62.2 673.4 ± 45.4 623.6 ± 57.0 627.7 ± 47.0
sLFconst2 36 123.4 ± 40.6 (17) 0.76 ± 0.2 (22) 0.1 ± 0.3 (NA)
(6.3) (4.9) (5.0) (6.9) (6.4)
Minter 16 869.1 ± 210 (23) 1153 ± 103 (8.2) 284.1 ± 124 (41) 1135 ± 99.4 (7.7) 917.9 ± 210 (22) 1049 ± 121 (11) 1.58 ± 0.4 (19) 0.6 ± 0.8 (0.0)
1198 ± 33.0
MiSG3 6 1137 ± 30.0 (1.3) 1276 ± 39.4 (1.2) 139.8 ± 43.1 (32) 1254 ± 38.0 (2.3) 1184 ± 34.5 (0.8) 1.18 ± 0.4 (28) 1.2 ± 0.9 (100)
(1.8)
708.6 ± 42.5 758.2 ± 37.9 958.9 ± 38.4
Mio 10 1079 ± 43.2 (2.0) 370.6 ± 59.3 (10) 1064 ± 42.5 (2.0) 1.82 ± 0.2 (3.0) 0.3 ± 0.5 (NA)
(4.0) (4.0) (2.0)
457.3 ± 13.2 537.3 ± 7.46 80.07 ± 8.55 481.6 ± 16.5 504.8 ± 19.4
sup 8 520.9 ± 6.6 (0.4) 0.31 ± 0.1 (13) 0.0 ± 0.0 (NA)
(1.9) (0.5) (8.6) (2.0) (1.4)
Table 2. Summary of key acoustic characteristics of 9 unit types of bowhead whale songs, including
mean ± standard deviation, and coefficient of quartile variation (cqv in %).
Results
Bowhead whale songs were detected from the second week of October 2013 to the first week of April 2014,
with almost daily detections during the peak of the season from December to February (Supplementary Fig. S1
online). These detections indicate that a probable bowhead whale mating ground described from the Fram Strait
data22,33 could actually extend some 170 km further east towards the coast of Greenland. The manual analysis of
the songs resulted in the identification of 13 song groups that comprised songs sharing similar acoustic charac-
teristics (i.e. the presence of specific unit types M and S (see Methods and Fig. 3). The analysis revealed that up to
3 animals were singing similar songs simultaneously (Fig. 2). The song groups were detected between November
and February (see Supplementary Fig. S2 online). An example of each of the song groups is shown in Fig. 3 and
can be listened to on the LIDO website (link to song groups).
Song groups description. A total of 804 units were measured and manually classified into 9 unit types
using visual and audio properties of the units as well as the temporal arrangement of units in a song. An over-
view of the units and their main characteristics is provided in Table 2 and Supplementary Fig. S3 online, with
their occurrence in song groups summarised in Table 1. Songs contained 2–6 unit types (Fig. 3 and Table 1). The
overall structure of the songs consisted of two main phrases. An M unit and a variable number of S units com-
posed the first phrase, present in all the song groups. A second phrase consisting of two alternating short and
narrowband low frequency units (sLFdown and sLFconst/sLFconst2) were detected in 6 song groups, the higher
frequency sLFconst2 replacing sLFconst in half of them. Other units, such a s Vhigh and rumble-like units were
present in different song groups, with the exception of sup occurring only in SG4.
Semi‑automated clustering. The MDS map globally reflected the output of the manual analysis in terms
of clustering the units into separate types. Interpretation of the distances and relative positions of the clusters
from the two-dimensional MDS plot was regarded as valid based on the values of R squared (R2 = 0.99) and
goodness of fit (stress = 0.066). Close relationships (R2 > 0.7) were found between the first MDS axis and the
variables median frequency, high frequency, low frequency, contour start and frequency bandwidth, suggesting that
this dimension was strongly related to the global positioning of the unit in the frequency domain. The second
Scientific Reports | (2021) 11:168 | https://doi.org/10.1038/s41598-020-80220-5 6
Vol:.(1234567890)www.nature.com/scientificreports/
Figure 4. Multidimensional-scaling visualisation of 804 units from 13 song groups. Each dot represents a single
unit, colour-coded according to its membership in one of the 9 unit types identified through manual analysis.
Bold ellipses highlight subcluster from the MDS projection and correspond to the manual classification of song
groups (except for rumble where text indicates subclusters based on duration). Dotted ellipses highlight specific
unit groups and cluster mentioned in the Results. Top right corner represents the relationship between MDS
axis and significant acoustic variables. The slope of the line is an indication of the correlation value and the
arrow gives the direction of increasing values for the selected variables.
MDS axis was less correlated to the acoustic variables, although correlations with inflections and duration were
noticeable (R2 = 0.3–0.4) (Fig. 4).
Units defined by the manual procedure appeared to be well separated on the MDS map. Short units (sLF-
down, sLFconst, sup and sLFconst2) were closely positioned along the first dimension, i.e. they separated along
a frequency gradient, respectively from lower to higher frequency (Fig. 4). Analysis at the song group level of
the S cluster did not reveal any clear structuring although in some SGs the units showed a tendency to aggregate
in the same spatial location in the cluster (e.g. SG4, Fig. 4 and Supplementary Fig. S4a online). Vhigh clusters
presented a higher degree of scattering that could reflect the inaccuracy of measurements due to lower SNR of
this unit type. Rumble were displayed along a continuum on the second dimension of the MDS map, with two
subtypes based on duration parameters (short < 5 s and long > 5 s).
Unlike the densely grouped S units, the M units were more scattered. In the context of song sharing, this unit
type was manually defined as a broad category, and high variability on some acoustic parameters (especially
duration, inflection and frequency bandwidth) was consistently observed. The MDS projection suggested that M
units formed five distinct subtypes (Fig. 4 and Supplementary Fig. S4b online). The map showed one large and
scattered cluster (Mo) containing 68% of the M units from 9 song groups overlapping each other, and 4 smaller
separated clusters, each one containing M units from a specific song group. MSG11 was characterised by a very
high number of inflection points and a reduced bandwidth (respectively 17 and 501 Hz, Table 2). The second
cluster grouped MSG5 units and shared similar characteristics with MSG11 in terms of duration but displayed a
three-time higher bandwidth, and only half of the inflection points. MSG1 had the longest duration, and inter-
mediate values between MSG11 and MSG5 for inflection points. MSG2 was grouped together based on higher
values for all parameters compared to the large cluster Mo. Inside the 5th cluster Mo containing all the other
SGs, fine scale structuring was visible for some song groups, as noted during the manual analysis. Interestingly,
SG7 was positioned at the Mo cluster edges (Fig. 4 and Supplementary Fig. S4b online), in a transition position
between Mo and the MSG11 clusters and visual observation of the MSG7 unit contour shapes confirmed that
MSG7 shared characteristics both with the large Mo cluster (large bandwidth, reduced number of inflections)
and MSG11 cluster (reduced bandwidth, high number of inflections).
Standard deviation (SD) values for the M unit acoustic parameters were higher than for the other unit types,
and still superior to S type values when considering only the Mo cluster (Table 2 and Fig. 5a). Short units had low
SD values. Globally, the coefficient of quartile variation values per parameter showed that inflection, duration
and frequency bandwidth were the most dispersed around the mean (Table 2 and Fig. 5b).
Clusters from the MDS map were used in combination with the manual analysis to create an improved clas-
sification of unit types and its validity was assessed using the silhouette coefficient. Values of 0.49 for both the
Scientific Reports | (2021) 11:168 | https://doi.org/10.1038/s41598-020-80220-5 7
Vol.:(0123456789)www.nature.com/scientificreports/
Figure 5. Heatmap visualisation of the dispersion of values per parameter and unit type. (a) Standard deviation
(SD) (Inflection and Duration plotted apart due to smaller range of values). (b) Coefficient of quartile variation
(CQV) (Grey colour indicates that the cqv values could not be computed). Note that the SD has the same unit as
the parameter it is computed from and the CQV has no unit.
clustering of M units and the Except-M units were higher than the values obtained for the hierarchical clustering
for the same number of clusters (respectively 0.40 and 0.28) (Supplementary Fig. S5 online). A higher silhouette
value represents a better clustering solution where each object (unit) is closer to its own cluster centroid. Sil-
houette values from the MDS map clusters were also higher over a range of cluster numbers, with one exception
that clearly oversimplified the grouping of the units into only 3 or 4 distinct clusters.
Biphonation patterns on M and S units. All the analysed song groups presented a biphonation on one
or two unit types. Biphonation presented strong similarities between some song groups, and could be divided
into 3 and 4 major types for M and S units respectively (Supplementary Table S6 online). Close ups of the units
are shown in Supplementary Fig. S7 online. The main recurrent biphonation type on M and S units was a tonal
frequency modulated downsweep, respectively present in 6 and 7 song groups. Mbi1 overlapped in time with
the whole M unit, and sometimes even with the following S unit. Sbi1 tonal downsweep sometimes included fre-
quency modulation. Remarkably different, consisting in short broadband “whoops” in sequence, Mbi2 presented
a highly consistent and repetitive pattern on SG11 and SG13 but variable temporal characteristics in other song
groups (SG2, SG8 and SG10). A similar biphonation pattern was present on S unit from SG1 (Sbi2). M from SG4
showed a distinct type of biphonation, a short constant tonal around 130 Hz with 3 harmonics, present at the
end of the unit. Altogether, biphonation patterns resulting from the combination of biphonation types on M and
S units were unique for almost half of the song groups.
Discussion
Bowhead whales singing behaviour has been studied for more than 3 decades and an increasing diversity in
their song repertoire has been described from the simple patterned moan sequences reported by Ljungblad
et al.34 to the remarkably high song diversity described for the Spitzbergen p opulation22. Although previous
studies provided song or unit descriptions, there has been little discussion about variability and consistency in
bowhead whale singing display and its impact on our understanding of bowhead whale acoustic ecology in a
mating context.
Scientific Reports | (2021) 11:168 | https://doi.org/10.1038/s41598-020-80220-5 8
Vol:.(1234567890)www.nature.com/scientificreports/
Figure 6. Vocal performance limit approach in 2 species, the bowhead whale and the swamp sparrow
(Melospiza georgiana). (a) Inflection rate by frequency bandwidth for 158 M units recorded from bowhead
whales (this study). Ellipses highlights song groups mentioned in the text. (b) Trill rate by frequency bandwidth
for 280 songs recorded from 91 male swamp sparrows40. Open circles represent the points that were used to
calculate the upper-bound regression line. The upper-bound regression line represents the vocal performance
limit. Low deviation from this line indicates a high-performance song. High deviation indicates a low-
performance song (arrows). Grey areas represent the “acoustic space” that vocalisations o ccupy41.
Bowhead whale songs were almost continuously present from November 2013 to March 2014, with a peak of
vocal activity between December 2013 to February 2014. Previous studies in the Fram S trait21,22, also described
intense singing activity of bowhead whales in winter months, suggesting that this location was a mating ground
for the Spitsbergen p opulation33. Our data, recorded approximately 170 km from the Fram Strait, provides com-
pelling acoustic evidence that the spatial range of the mating ground of this critically endangered population
would likely extend from the western Fram Strait to the Northeast Greenland coastal area, hundreds of kilometres
more west than previously reported.
Past studies describing the bowhead whale repertoire from different populations have reported the occurrence
of the same song overlapping in time, demonstrating that bowhead whales do share s ongs2,3,8. Elaborating on this
finding, Johnson et al.8 estimated that during the migration of whales from the Bering-Chukchi-Beaufort popula-
tion, a song type could be shared by up to nine animals. Temporal overlapping of songs in our data revealed that
at least three animals were sharing the same song (Fig. 2). Structural characteristics of these shared songs were
used to identify song groups based on similar unit types arranged in comparable temporal pattern, leading to
the selection of 13 song groups. Analysis of the song groups revealed variability at multiple hierarchical levels
of the songs, from units to phrases.
Variations in a given unit type have been described in previous acoustic studies of bowhead whale songs.
Evolution of unit structure (loss of part of the unit, splitting into smaller units) or frequency (e.g. shifting) has
been reported from all the populations that have been acoustically studied so f ar2,3,8. Our analysis revealed two
major paths for intra-unit type variability, that were measured in terms of standard deviation and coefficient of
quartile variation and were readily noticeable on the MDS maps. The first path of variation was related to duration
and inflection points and was especially noticeable on two unit types, M and rumble. These two unit types both
had a distinctive frequency contour displaying multiple inflections, thus variation in duration was coupled with
variations in the number of inflection points. The second path was linked to variability in frequency parameters
with variations mainly related to frequency bandwidth. Gradual changes on one or both of these paths of varia-
tion eventually led to the appearance of new unit types, and therefore larger vocal repertoire. Novel or complex
vocal repertoires have been identified as important traits influencing female sexual selection in several studies
on birds (e.g.35,36) and in a similar way, sexual selection might be one of the mechanisms underlying innovation
in humpback whale song37,38.
While ecological and behavioural functions of songs in bowhead whales are still unclear, the presence of
intensive singing during the reproductive season indicate a function in sexual advertising. This would correspond
to a polygynous mating strategy as seen in humpback whales (where one male mates with multiple females),
although the exact nature of the bowhead whale mating system is still unclear to researchers17. In this context, a
possible advantage of displaying calls with longer duration could be linked to an increase in stamina with age or
as an honest advertisement of physical fitness as it has been described in bearded seals, Erignathus barbatus39.
Variability in inflection points could similarly be associated to fitness since highly modulated sounds require
higher motor control of the vocal apparatus. Interestingly, for most of the unit types, variability was contained
inside a unique cluster corresponding to a single unit type (i.e. unit types were separable in the feature space
as they had little to no overlap). However, combined variability on both frequency and modulation/duration
parameters led to a gradual split of M units into subtypes, some of them matching the song groups labels. The M
unit type, possessing characteristic of long duration, numerous inflections points and variable bandwidth could
Scientific Reports | (2021) 11:168 | https://doi.org/10.1038/s41598-020-80220-5 9
Vol.:(0123456789)www.nature.com/scientificreports/
be identified as the unit that best represents abilities of the animal to produce physically challenging sounds. This
would be similar to trilled songs in songbirds where production of trills, expressing vocal performance, defines
a constraint on the song, represented by a trade-off between trill rate and frequency bandwidth40–42 (Fig. 6). The
upper boundary of this trade-off represents a vocal performance limit and songs containing trills with acoustic
characteristics close to this limit are considered to express high vocal p erformance40–42. In the context of sexual
selection, vocal performance has been related to male quality assessment by female birds and to male-male
competition40,43. It appears that highly modulated sound produced by bowhead, such as the M units studied here,
face a similar trade-off between number of inflection points (analogue to trill repetition rates) and the frequency
range they can span (Fig. 6). Song groups containing M units at the limits of the performance constraints, such
as SG1, SG5 and SG11, could then be associated with higher vocal performance (Fig. 6). If songs are used in
a mate choice context, the presence of units with numerous inflections could function as an honest indicator
of mate quality, by virtue of the “inflection rate/frequency band” trade-off. As such, these units could carry a
higher level of inter-individual variability expressing different levels of fitness, and additionally higher levels of
intra-individual variability in relation to the difficulties of accurately producing and reproducing such sounds.
An additional source of unit-level variability described here comes from the presence of biphonated signals.
Recent acoustic studies confirmed that bowhead whales use biphonation4 and that the use of biphonated signals
can be quite common in bowhead whale s ongs8. All the song groups studied here showed biphonation on one
or two unit types, with the occurrence of different biphonation types including continuous whistle-like sounds,
short impulsive broadband sounds and harmonics signals. Functions of biphonated signals remain unclear
and they have been suggested to encode information on size44, individuality45–47 or localisation of the signal
emitter48,49. Mastering the production of biphonated signals, which require high vocal control of the laryngeal
apparatus (Musculus diverticuli laryngei)50, could function as another honest signal of mate quality in a context
of reproductive display4. If one structure is the source of two simultaneous sounds, then producing two very
different sounds i.e. decoupling mechanisms of air movements in the larynx, would require strong vocal skills.
Broadband discrete impulsive signals coupled with continuous M units could be more difficult to produce than
whistle-like types. As such, the presence of type Mbi2 could indicate older or more experienced singers and,
interestingly, this biphonation type occurred concurrently with M units than can be associated with higher
vocal performance (SG11). Similarly, recent studies on bowhead whales’ closest relatives, the North Atlantic
right whales, have linked age with increasing structure in non-linear phenomena, from disorder (deterministic
chaos) to increased control (biphonation and subharmonics)51.
On the upper level of the song hierarchy (phrases), temporal arrangement of units in phrases showed regular
patterns of association between units in stable phrases. However, while phrases containing M and S were present
in every song group, phrases containing the short alternating units (sLFdown, sLFconst, sLFconst2, sup) were only
present in half the song groups. The duty cycle used in this study (2 min on, 38 min off) could have resulted in
recording only partially the variability of each song group. The average song duration of a bowhead whale song
is considered to be approximately one m inute1,3,8,21 but songs lasting almost two minutes have been reported.
Therefore, in our study, most of the time, only one entire song was present in the file, and variability at the song
bout level (differences in successive iterations of the same song by the same animal) could not be assessed. Nev-
ertheless, the aforementioned phrases containing the short alternating units were present in half of the studied
song groups, and can be considered as common and part of the song structure. In humpback whales, the only
other cetacean species to produce such complex songs, omission or insertion of entire themes is considered part
of the natural evolution of song types and themes present in 50% or more of the songs were included in song
sequence study14. Similarly, temporal evolution of a song type over a period of a few months has been previously
described in bowhead whales. Delarue et al.3 reported the observations of primitive versions occurring during
the initial development of the song until the final, stable version emerged. The overall song variability suggested
a low level of constraint in the song structure (e.g. units missing, variability in the repetition rate of units, pres-
ence or absence of a phrase). In humpback whale songs, phrase structure is reported to be much more flexible
than in bird songs and can even be progressively modified within individual songs14,52. While there are inherent
recording limitations when conducting acoustic studies in the high Arctic, longer duty cycles are required to
quantitatively describe song structure variability and evolution over a season.
To describe and quantify variability at unit level and to allow the description of song structure, we have used
a semi-automated method combining multidimensional scaling maps and human expertise. MDS maps showed
unit clusters corresponding well to human classification into nine distinct unit types. Based on this agreement,
MDS was used to investigate subclustering in the M unit type. Units were positioned along a continuum on the
MDS axes, following a gradation in the frequency, modulation and duration parameters of this unit type, which
complicated the classification into subtypes. Graded vocal repertoire has been described for many mammalian
taxa such as p rimates53, elephants54, sirenians55, odontocetes56–58, and mysticetes including h umpback59 and right
whales60,61. Graded repertoires are challenging for classification tasks since there is no clear boundary where a
grouping begins or ends. Manual (human) classification of animal vocalisations usually leads to accurate r esults62,
but with a strong subjective component, whereas automatic methods can add objectivity and standardisation. It
appears that a combined method such as the one we described here can greatly help the classification process at
the unit level. The next step forward towards standardisation of bowhead whale song studies would be applying
automated methods that have been validated on other species. For example, the Levenshtein distance, a similarity
analysis that compares vocal sequences, has been successfully applied to humpback whale songs to objectively
quantify differences among groups of s ongs63–65.
Earlier studies suggested that bowhead whales, unlike all other singing whale species, entirely change their
song repertoire from year to year. This feature has been reported for the Bering-Chukchi-Beaufort (BCB) popula-
tion on their migration route1,3 and for the Eastern Canada-Western Greenland (EC-WG) population in Disko
Bay in spring5. It is likely that these studies only sampled a small part of the song repertoire, neither locations
Scientific Reports | (2021) 11:168 | https://doi.org/10.1038/s41598-020-80220-5 10
Vol:.(1234567890)www.nature.com/scientificreports/
Figure 7. Examples of 3 bowhead whale songs recorded from the Greenland Sea. Top, song recorded in
Northeast Greenland on the 11 of November 2013 (this study). Middle and bottom, songs recorded in the Fram
Strait, respectively from November 2013 and December 2 01269 (Spectrogram parameters: 1024 pts FFT, 50%
overlap, Hann window). The numbers correspond to a single unit or a sequence of units: 1 is a long frequency-
modulated sound around 500 Hz with a distinctive growling on the highest parts of the signal; 2 is a sequence of
alternating downsweep and upsweep units; 3 is a “V” shaped unit with a flat biphonation.
being wintering grounds where most of the singing is thought to occur in relation to r eproduction66. A recent
study from the Spitsbergen population analysed data from a probable mating area in the Fram Strait during four
successive winter seasons. As predicted, researchers recorded and described a much higher diversity of songs.
Again, the results highlighted the lack of recurrence of song types from year to year, indicating that bowhead
whales completely renew their singing repertoire each y ear22.
Nevertheless, our results suggest that the high variability reported in this study could hinder the recognition
of units and phrase types that are potentially reused from year to year, in a dynamic and progressively evolving
singing display. Although songs may be considered different between years (depending of the level of variability
researchers select to assess song diversity), some unit types and patterns of association between unit types may
be maintained over time. Acknowledging this inherent variability could help to track patterns in units and song
presence at different temporal and geographical scales. For example, close examination of songs from the Spitz-
bergen population from our dataset and from the Stafford et al.22 study revealed that identical units forming
highly similar songs were present at the two locations (170 km apart), during the same time period (December
2013–January 2014) and moreover, were present at the same location in the Fram Strait during two consecutive
years (Fig. 7). Furthermore, we discovered the presence of highly similar units in our dataset from Northeast
Greenland and in published song studies from the BCB population. The MSG11 unit described here is identical
to the warble unit characterised in Delarue et al.3 and to the high-frequency whistle reported in Würsig and
Clark1. Figure 8 shows that units from theses 3 studies share similar median frequency (around 1500 kHz),
shape (multiple inflections), and an identical highly specific biphonation pattern (broadband grunt or “whoop”).
Additionally, the 1988 song described by Würsig and C lark1 is composed by the aforementioned high-frequency
whistle associated with another unit that closely resembles the S unit described here, both in terms of frequency
parameters and contour shape (Fig. 8).
These findings are highly relevant in the context of population exchanges questions that arose from recent
studies of the Spitzbergen population22,23. Whether the individuals recorded from the Greenland Sea are remnant
of the nearly extirpated Spitzbergen population or immigrants from other populations (BCB or EC-WG) is not
known. Drastic sea ice loss in the high Arctic has already made contact possible between once ice-separated
bowhead populations and the continuous increase of this phenomena is likely to open new areas for bowhead
whale migration67. Tracking acoustic similarities at the unit or phrase level will help to gather acoustic evidence
revealing these movements.
Bowhead whales are undoubtedly amongst the most prolific singers, and the high diversity of the singing
repertoire has just begun to unveil. In order to build up our understanding of bowhead whale acoustic ecology,
we propose that future acoustic studies should consider (i) further developing automated methods using objec-
tive categorisation to facilitate inter study comparisons, (ii) shifting the framework of acoustic studies from a
song-based to a unit or phrase-based approach as it has been suggested for humpback w hales19 to investigate
song similarities in the context of song sharing, song evolution and cultural transmission, (iii) conducting col-
laborative studies to track acoustic patterns at larger temporal and geographic scales.
Scientific Reports | (2021) 11:168 | https://doi.org/10.1038/s41598-020-80220-5 11
Vol.:(0123456789)www.nature.com/scientificreports/
Figure 8. Examples of 3 bowhead whale songs displaying a highly similar biphonated unit. Top, song from
the Chukchi Sea recorded in 19881. Middle, song from the Chukchi sea recorded in December 2007 (3 adapted
from, reproduced with the permission of the authors and the Acoustical Society of America). Bottom, song
from the Greenland Sea recorded in December 2013 (this study). (Spectrogram parameters: 2048 pts FFT, 50%
overlap, Hann window). The blue box corresponds to the long whistle-like vocalisation, with multiple inflections
(MSG11 described in this study). The red box shows the associated biphonation, a rapid sequence of shorts
grunts or “whoops”.
Data availability
The datasets generated during and/or analysed during the current study are available in the LIDO repository,
http://www.arctic.listentothedeep.com/.
Received: 11 March 2020; Accepted: 14 December 2020
References
1. Würsig, B. & Clark, C. W. Behavior. in The bowhead whale (eds. Burns, J. J., Montague, J. & Cowles, C. J.) 157–199 (the Society for
Marine Mammalogy, 1993).
2. Stafford, K. M., Moore, S. E., Laidre, K. L. & Heide-Jørgensen, M. P. Bowhead whale springtime song off West Greenland. J. Acoust.
Soc. Am. 124, 3315–3323 (2008).
3. Delarue, J., Laurinolli, M. & Martin, B. Bowhead whale (Balaena mysticetus) songs in the Chukchi Sea between October 2007 and
May 2008. J. Acoust. Soc. Am. 126, 3319–3328 (2009).
4. Tervo, O. M., Christoffersen, M. F., Parks, S. E., Kristensen, R. M. & Madsen, P. T. Evidence for simultaneous sound production
in the bowhead whale (Balaena mysticetus). J. Acoust. Soc. Am. 130, 2257–2262 (2011).
Scientific Reports | (2021) 11:168 | https://doi.org/10.1038/s41598-020-80220-5 12
Vol:.(1234567890)www.nature.com/scientificreports/
5. Tervo, O. M., Parks, S. E., Christoffersen, M. F., Miller, L. A. & Kristensen, R. M. Annual changes in the winter song of bowhead
whales (Balaena mysticetus) in Disko Bay, Western Greenland . Mar. Mammal Sci. 27, E241–E252 (2011).
6. Payne, R. S. & McVay, S. Songs of humpback whales. Science 173, 585–597 (1971).
7. Collins, S. Vocal fighting and flirting: the functions of birdsong. in Nature’s Music 39–79 (Elsevier, Amsterdam, 2004).
8. Johnson, H. D., Stafford, K. M., George, J. C., Ambrose, W. G. & Clark, C. W. Song sharing and diversity in the Bering-Chukchi-
Beaufort population of bowhead whales (Balaena mysticetus), spring 2011. Mar. Mammal Sci. 31, 902–922 (2015).
9. Cholewiak, D. M., Cerchio, S., Jacobsen, J. K., Urbán-R, J. & Clark, C. W. Songbird dynamics under the sea: acoustic interactions
between humpback whales suggest song mediates male interactions. R. Soc. Open Sci. 5, 171298 (2018).
10. Murray, A., Dunlop, R. A., Noad, M. J. & Goldizen, A. W. Stereotypic and complex phrase types provide structural evidence for a
multi-message display in humpback whales (Megaptera novaeangliae). J. Acoust. Soc. Am. 143, 980–994 (2018).
11. Garland, E. C. et al. Humpback whale song on the Southern Ocean feeding grounds: Implications for cultural transmission. PLoS
ONE 8, e79422 (2013).
12. Rekdahl, M. L. et al. Culturally transmitted song exchange between humpback whales (Megaptera novaeangliae) in the southeast
Atlantic and southwest Indian Ocean basins. 15 (2018).
13. Darling, J. D., Acebes, J. M. V., Frey, O., Jorge Urbán, R. & Yamaguchi, M. Convergence and divergence of songs suggests ongoing,
but annually variable, mixing of humpback whale populations throughout the North Pacific. Sci. Rep. 9, 7002 (2019).
14. Garland, E. C. et al. Quantifying humpback whale song sequences to understand the dynamics of song exchange at the ocean basin
scale. J. Acoust. Soc. Am. 133, 560–569 (2013).
15. Garland, E. C. et al. The devil is in the detail: Quantifying vocal variation in a complex, multi-levelled, and rapidly evolving display.
J. Acoust. Soc. Am. 142, 460–472 (2017).
16. Allen, J. A., Garland, E. C., Dunlop, R. A. & Noad, M. J. Cultural revolutions reduce complexity in the songs of humpback whales.
Proc. R. Soc. B Biol. Sci. 285, 20182088 (2018).
17. Tervo, O. M., Parks, S. E. & Miller, L. A. Seasonal changes in the vocal behavior of bowhead whales (Balaena mysticetus) in Disko
Bay, Western-Greenland. J. Acoust. Soc. Am. 126, 1570–1580 (2009).
18. Payne, K. & Payne, R. Large scale changes over 19 years in songs of humpback whales in Bermuda. Ethology 68, 89–114 (1985).
19. Cholewiak, D. M., Sousa-Lima, R. S. & Cerchio, S. Humpback whale song hierarchical structure: historical context and discussion
of current classification issues. Mar. Mammal Sci. 29, E312–E332 (2013).
20. Kowarski, K., Moors-Murphy, H., Maxner, E. & Cerchio, S. Western North Atlantic humpback whale fall and spring acoustic
repertoire: Insight into onset and cessation of singing behavior. J. Acoust. Soc. Am. 145, 2305–2316 (2019).
21. Stafford, K. M. et al. Spitsbergen’s endangered bowhead whales sing through the polar night. Endanger. Spec. Res. 18, 95–103 (2012).
22. Stafford, K. M., Lydersen, C., Wiig, Ø. & Kovacs, K. M. Extreme diversity in the songs of Spitsbergen’s bowhead whales. Biol. Lett.
14, 20180056 (2018).
23. Boertmann, D., Kyhn, L. A., Witting, L. & Heide-Jørgensen, M. P. A hidden getaway for bowhead whales in the Greenland Sea.
Polar Biol. 38, 1315–1319 (2015).
24. André, M. et al. Listening to the deep: live monitoring of ocean noise and cetacean acoustic signals. Mar. Pollut. Bull. 63, 18–26
(2011).
25. Bioacoustics Research Program. Raven Pro: Interactive sound analysis software (Version 1.5). (The Cornell Lab of Ornithology,
2014).
26. Wilden, I., Herzel, H., Peters, G. & Tembrock, G. Subharmonics, biphonation, and deterministic chaos in mammal vocalization.
Bioacoustics 9, 171–196 (1998).
27. Bonett, D. G. Confidence interval for a coefficient of quartile variation. Comput. Stat. Data Anal. 50, 2953–2957 (2006).
28. Demšar, J. et al. Orange: data mining toolbox in python. J. Mach. Learn. Res. 14, 2349–2353 (2013).
29. Kruskal, J. B. Multidimensional scaling by optimizing goodness of fit to a nonmetric hypothesis. Psychometrika 29, 1–27 (1964).
30. Hair, J. F., Black, W. C., Babin, B. J., Anderson, R. E. & Tatham, R. L. Multidimensional scaling. in Multivariate data analysis: A
global perspective 539–582 (Upper Saddle River, NJ: Pearson, 2010).
31. Rousseeuw, P. J. Silhouettes: a graphical aid to the interpretation and validation of cluster analysis. J. Comput. Appl. Math. 20, 53–65
(1987).
32. Arbelaitz, O., Gurrutxaga, I., Muguerza, J., Pérez, J. M. & Perona, I. An extensive comparative study of cluster validity indices.
Pattern Recognit. 46, 243–256 (2013).
33. Ahonen, H. et al. The underwater soundscape in western Fram Strait: breeding ground of Spitsbergen’s endangered bowhead
whales. Mar. Pollut. Bull. 123, 97–112 (2017).
34. Ljungblad, D. K., Thompson, P. O. & Moore, S. E. Underwater sounds recorded from migrating bowhead whales, Balaena mysticetus,
in 1979. J. Acoust. Soc. Am. 71, 477–482 (1982).
35. Kroodsma, D. E. Reproductive development in a female songbird: differential stimulation by quality of male song. Science 192,
574–575 (1976).
36. Byers, B. E. & Kroodsma, D. E. Female mate choice and songbird song repertoires. Anim. Behav. 77, 13–22 (2009).
37. Payne, K. The progressively changing songs of humpback whales: A window on the creative process in a wild animal. in The origins
of music 135–150 (2000).
38. Parsons, E. C. M., Wright, A. J. & Gore, M. A. The nature of humpback whale (Megaptera novaeangliae) song. J. Mar. Anim. Their
Ecol. 1, 22–31 (2008).
39. Van Parijs, S. M., Lydersen, C. & Kovacs, K. M. Vocalizations and movements suggest alternative mating tactics in male bearded
seals. Anim. Behav. 65, 273–283 (2003).
40. Ballentine, B., Hyman, J. & Nowicki, S. Vocal performance influences female response to male bird song: an experimental test.
Behav. Ecol. 15, 163–168 (2004).
41. Podos, J., Huber, S. K. & Taft, B. Bird song: the interface of evolution and mechanism. Annu. Rev. Ecol. Evol. Syst. 35, 55–87 (2004).
42. Podos, J. A performance constraint on the evolution of trilled vocalizations in a songbird family (Passeriformes: Emberizidae).
Evolution 51, 537–551 (1997).
43. Moseley, D. L., Lahti, D. C. & Podos, J. Responses to song playback vary with the vocal performance of both signal senders and
receivers. Proc. R. Soc. B Biol. Sci. 280, 20131401 (2013).
44. Reby, D. et al. Evidence of biphonation and source–filter interactions in the bugles of male North American wapiti (Cervus
canadensis). J. Exp. Biol. 219, 1224–1236 (2016).
45. Aubin, T., Jouventin, P. & Hildebrand, C. Penguins use the two-voice system to recognize each other. Proc. R. Soc. B Biol. Sci. 267,
1081–1087 (2000).
46. Fitch, W. T., Neubauer, J. & Herzel, H. Calls out of chaos: the adaptive significance of nonlinear phenomena in mammalian vocal
production. Anim. Behav. 63, 407–418 (2002).
47. Volodina, E. V., Volodin, I. A., Isaeva, I. V. & Unck, C. Biphonation may function to enhance individual recognition in the dhole,
Cuon alpinus. Ethology 112, 815–825 (2006).
48. Volodin, I. A. & Nagaylik, M. M. Cues to orientation of a caller to a listener in biphonic and non-biphonic close range contact calls
in the dhole (Cuon alpinus). 11 (2006).
49. Miller, P. J. O., Samarra, F. I. P. & Perthuison, A. D. Caller sex and orientation influence spectral characteristics of “two-voice”
stereotyped calls produced by free-ranging killer whales. J. Acoust. Soc. Am. 121, 3932 (2007).
Scientific Reports | (2021) 11:168 | https://doi.org/10.1038/s41598-020-80220-5 13
Vol.:(0123456789)You can also read