Social Impact Commentary - Transitional Part 3A Concept Plan Application - SIMTA
←
→
Page content transcription
If your browser does not render page correctly, please read the page content below
Social Impact Commentary

Transitional Part 3A Concept Plan
Application

13 / June / 2013
URBIS STAFF RESPONSIBLE FOR THIS REPORT WERE:

Director                    Jacqueline Ohlin
                            Susan Rudland
Consultant                  Leah Poulton
                            Susan Hatherly
Job Code                    SSP27312
Report Number               Social Impact Commentary_June 2013
xdisclaimerx

Urbis’s Social Policy team has received ISO 20252 Certification
for the provision of social policy research and evaluation, social planning, community
consultation, market research and communications research.

© Urbis Pty Ltd
ABN 50 105 256 228

All Rights Reserved. No material may be reproduced without prior permission.
While we have tried to ensure the accuracy of the information in this publication,
the Publisher accepts no responsibility or liability for any errors, omissions or
resultant consequences including any loss or damage arising from reliance in
information in this publication.

URBIS
Australia Asia Middle East
urbis.com.au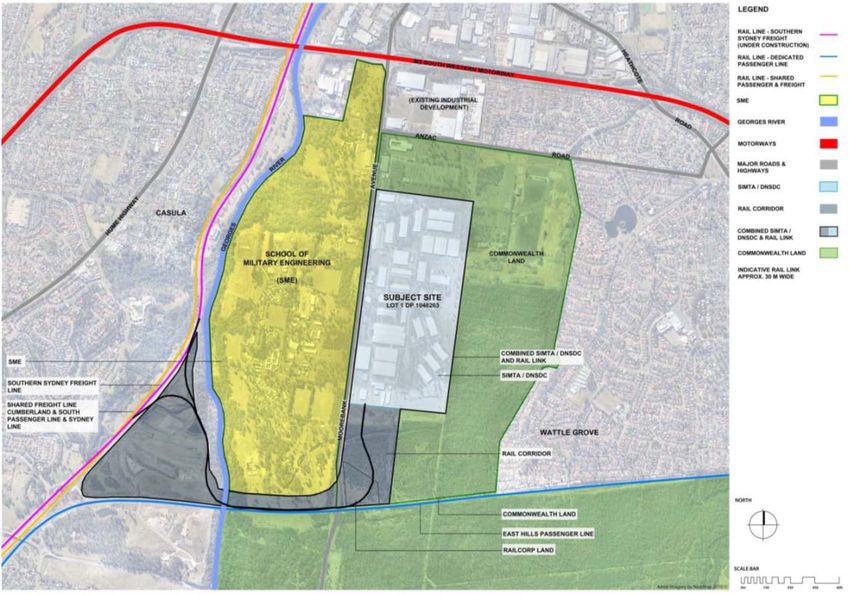
TABLE OF CONTENTS

1     Introduction....................................................................................................................................... 1
      1.1   The site and locality ................................................................................................................. 1
      1.2   The concept plan ..................................................................................................................... 1

2     Document Review............................................................................................................................. 5
      2.1  Draft South West Subregional Strategy (November 2007) ..................................................... 5
      2.2  North West and West Central Sydney Employment Strategies (November 2008) ................. 5
      2.3  Growing Liverpool 2021 – The Community Strategic Plan for the City of Liverpool ............... 7
      2.4  Liverpool City Council Social Impact Assessment Policy ........................................................ 7
      2.5  LEAPS Multicultural Plan 2010 – 2014 and Action Plan 2010 ................................................ 7
      2.6  Management Plan 2010 – 2011 Corporate Plan, Budget and Capital Works ......................... 7
      2.7  Community Safety and Crime prevention Plan Liverpool 2009 – 2012 .................................. 8
      2.8  Key findings ............................................................................................................................. 8

3     Demographic Profile ........................................................................................................................ 9
      3.1 Regional Context – Greater Western Sydney ......................................................................... 9
      3.2 Local context ......................................................................................................................... 10
      3.3 Key findings ........................................................................................................................... 14

4     Crime analysis ................................................................................................................................ 16
      4.1   Local crime trends – Liverpool LGA ...................................................................................... 16
      4.2   Comparison with selected NSW recorded incidents ............................................................. 17
      4.3   Identified crime ‘hotspots’ in Liverpool LGA .......................................................................... 19
      4.4   Key findings ........................................................................................................................... 23

5     Potential Social Impacts and Benefits .........................................................................................24
      5.1   Traffic ..................................................................................................................................... 24
      5.2   Air Quality and health impacts ...............................................................................................25
      5.3   Visual impact and light spill ................................................................................................... 25
      5.4   Noise and vibration impacts ..................................................................................................26
      5.5   Employment impacts ............................................................................................................. 26
      5.6   Crime prevention through environmental design................................................................... 26

6   Conclusion and recommendations .............................................................................................. 28
FIGURES:
      Figure 1 - SIMTA Moorebank ITF Site Location ................................................................................................ 4
      Figure 2 – Location map of Greater Western Sydney Local Government Areas ............................................... 9
      Figure 3 – Median weekly household income .................................................................................................. 12
      Figure 4 – Tenure type .................................................................................................................................... 13
      Figure 5 – Household type ............................................................................................................................... 14
      Figure 6 – Malicious damage ........................................................................................................................... 20
      Figure 7 – Steal from motor vehicle ................................................................................................................. 21
      Figure 8 – Motor vehicle theft .......................................................................................................................... 21
      Figure 9 – Break and enter dwelling ................................................................................................................ 22
      Figure 10 – Assault – non domestic violence related....................................................................................... 22
      Figure 11 – Assault – domestic violence related ............................................................................................. 23
TABLES:
      Table 1 – Age profile and distribution in Moorebank and Liverpool LGA in 2011 ............................................ 10
      Table 2 – NSW Bureau of Crime Statistics and Research recorded criminal incidents for Liverpool LGA, 201216
      Table 3 – Comparison of NSW Bureau of crime Statistics and Research rate per 100,000 population of
                 recorded criminal incidents for Penrith LGA and NSW, 2012 ....................................................... 18

URBIS
SOCIAL IMPACT COMMENTARY_JUNE 2013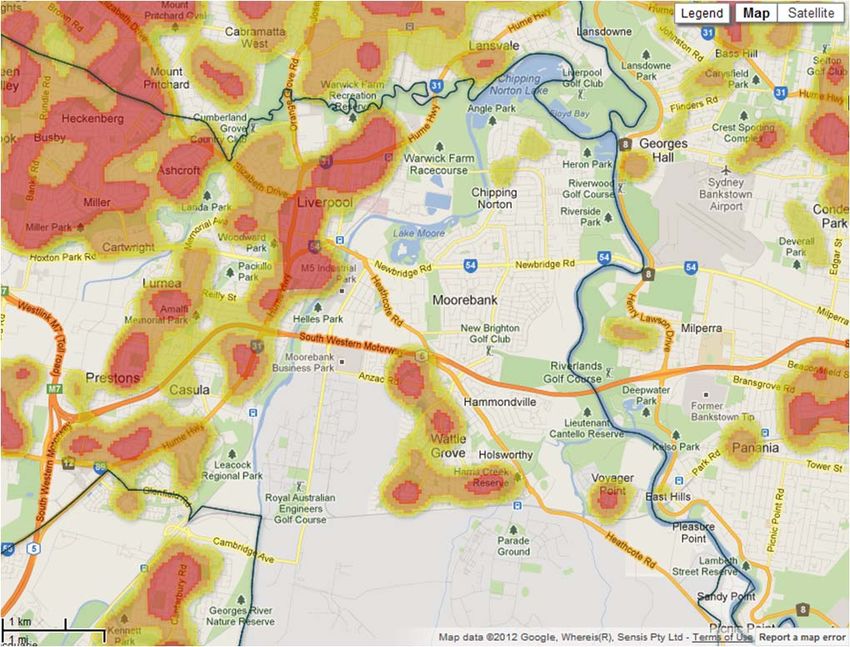
1 Introduction
This Social Impact Commentary has been prepared on behalf of the Sydney Intermodal Terminal Alliance
(SIMTA), a consortium of Qube Logistics and QR National, in relation to a proposal for an Intermodal
Terminal facility (ITF) at Moorebank Avenue, Moorebank. This report assesses the local demographic,
social policy context and identifies a range of social impacts and benefits associated with the proposed
development. A number of measures are also identified in order to manage some of the social impacts
identified.
While the Director General’s Environmental Assessment Requirements (DGRs) have no specific social
impact assessment requirements, the Preliminary Environmental Assessment noted that the
Environmental Assessment would identify and assess the potential social and economic impacts deriving
from the SIMTA Moorebank ITF.
This document includes:
A review of relevant documents and policies relating to the local social context and the development
of an intermodal terminal at Moorebank
A demographic profile of the Liverpool LGA and the suburb of Moorebank
An analysis of available crime statistics
Identification of a range of potential community impacts and benefits, building on issues identified
during community consultation and the findings of the specialist reports.
1.1 THE SITE AND LOCALITY
The SIMTA site is located on Moorebank Avenue, Moorebank. Key features of the site at present include:
A total area of approximately 83 hectares
A regular shape, with a length of 1,382 metres and a width of 600 metres
Relatively flat topography with a low hill on the eastern part of the site
The site is privately owned by SIMTA, and is occupied by the Department of Defence, commonly known
as the Defence National Storage and Distribution Centre. The site currently supports approximately
238,000m2 of low-rise buildings, including warehouses and administrative offices.
To the east and south is Federal Government-owned land, and land to the south and south west includes
a 75 hectare rail corridor owned by a range of government and non-government land holders including
Commonwealth of Australia, RailCorp, private owners and Crown Land held by the Department of
Primary Industries. The rail line is approximately 3.5 kilometres in length, 20 metres in width (variable
width) and includes two connections to the SSFL, one south and one north.
1.2 THE CONCEPT PLAN
1.2.1 RAIL CORRIDOR AND RAIL LINK
The proposed rail link is proposed to connect to the Southern SSFL, approximately 500 metres south of
Casula railway station. It would then extend south, then east, crossing Georges River from the south-east
corner of the Glenfield Waste Disposal Centre. The rail link would then continue east within the East Hills
rail corridor, before heading north into the SIMTA Site.
The proposed rail link would be constructed over the following parcels of land:
SSFL rail corridor on the western side of the Georges River
URBIS
SOCIAL IMPACT COMMENTARY_JUNE 2013 INTRODUCTION 1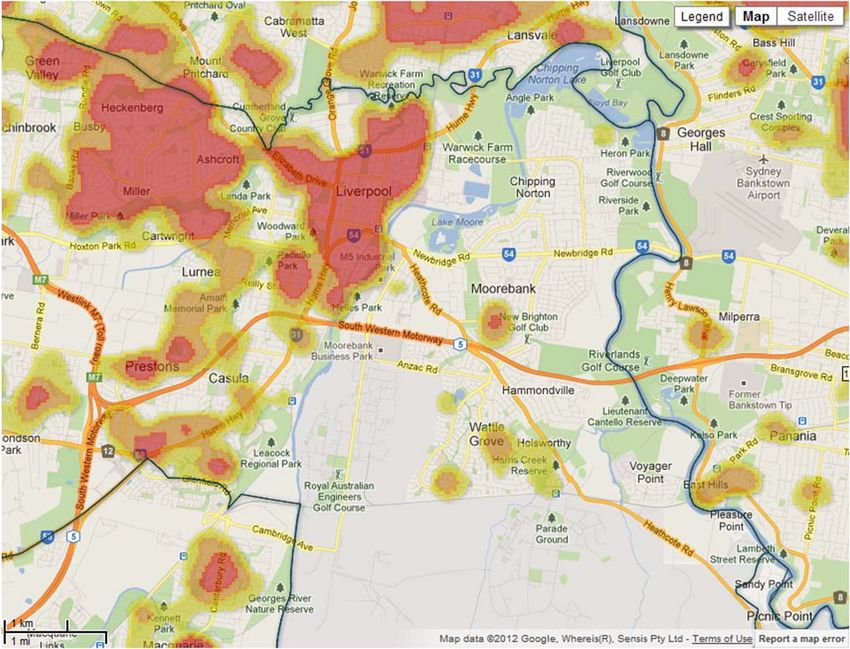
Glenfield Waste Disposal Centre on the western side of the Georges River
East Hills rail corridor
Irregular shaped portion of land owned by RailCorp and located to the east of the intersection
between Moorebank Avenue and the East Hills Railway Line.
Land to the south of the DNSDC site owned by the Commonwealth.
The proposed rail link would include the following infrastructure:
Culvert crossing of Anzac Creek.
A crossing under Moorebank Avenue in proximity to the existing grade-separated crossing which
supports the existing East Hills Railway Corridor.
Bridging the Georges River.
1.2.2 INTERMODAL TERMINAL
The intermodal terminal is proposed to be located on the western part of the site, adjacent to Moorebank
Avenue and away from the nearest residential properties. Key elements include:
Five rail tracks of approximately 650 to 1,200 metres in length, including four permanent and one
temporary siding.
Container hardstand of approximately 90,000m2 located on both sides of the rail tracks to be used for
container sorting and storage.
Terminal administration offices and ancillary operational facilities of approximately 2,100m2.
The intermodal terminal is proposed to operate 24 hours a day, 7 days a week to enable continuous
receipt and dispatch of freight, accommodating a wide range of servicing demands. It will be serviced
by world class and leading practice intermodal facilities including:
Automatic gantry systems
Modern container handling equipment
Modern control tower and support facilities
State-of-the-art rolling stock.
The final selection of mobile and static equipment will be made at the detailed application stage for the
rail terminal, taking into account compliance with the criteria established by way of the Concept Plan
approval, including noise levels, visual impacts and air quality.
1.2.3 WAREHOUSE AND DISTRIBUTION FACILITIES
Approximately 300,000m2 of warehouses with ancillary offices are proposed to be constructed to the east
of the intermodal terminal. The proposed warehouses are to be sited and designed to provide a physical
barrier between the intermodal terminal and the nearest residential properties. These warehouses
include:
Intermodal Terminal Warehouse and Distribution Facilities (Terminal Warehouses) – approximately
100,000m2 of warehouse floorspace will be located immediately adjacent to the intermodal terminal.
These buildings will be designed for cross-dock operations and are anticipated to be occupied by
large logistics operators dispatching goods in short turn-around times and with limited freight break-
down.
2 INTRODUCTION
URBIS
SOCIAL IMPACT COMMENTARY_JUNE 2013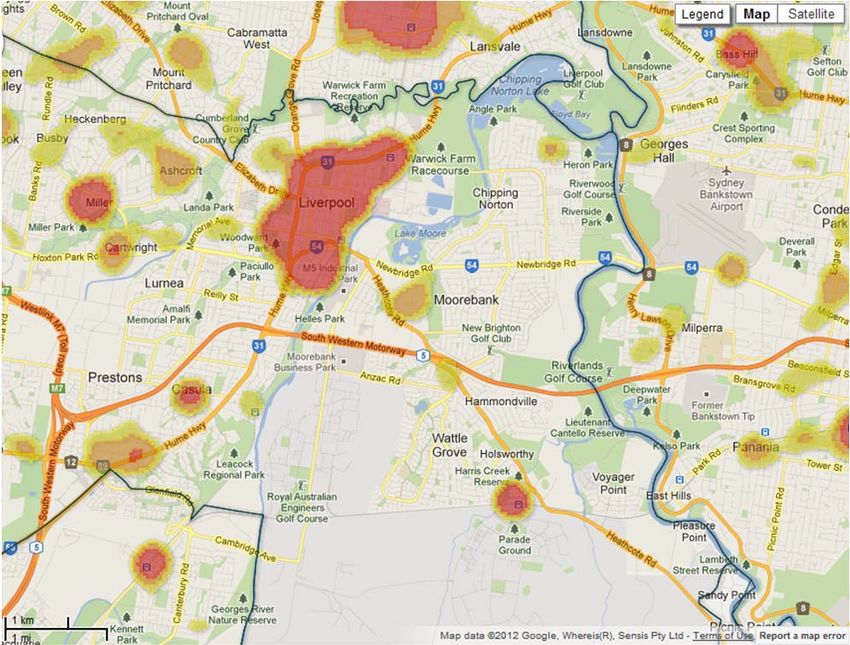
Large Format Warehouse and Distribution Facilities – approximately 200,000m2 of warehouse
floorspace will be located on the eastern part of the SIMTA site, east of the Terminal Warehouse
facilities. These buildings will have perimeter loading docks and are anticipated to be occupied by
logistics operators who require larger areas for operations, hold stock for longer periods and/or
undertake larger amounts of freight-breakdown before dispatching.
Each of the warehouses will be serviced by the central internal road system. The road system design and
location of the car park to the east of the large format warehouse buildings are proposed to maximise the
separation of staff and freight vehicle movements and minimise potential vehicle conflicts.
1.2.4 ANCILLARY TERMINAL FACILITIES
A range of ancillary support facilities are proposed within the SIMTA Intermodal Terminal Facility to meet
the needs of employees and visitors to the site. The final composition of these facilities will be based on
demand and will be privately operated by individual tenants. However, it is anticipated that a total
floorspace of approximately 8,000m2 will be provided and the uses are likely to include:
Site management and security offices
Retail and business service centre, potentially including a convenience store, banking facilities and
post office
Meeting rooms/conference facilities available for hire by individual tenants
Sleeping facilities for drivers
A café/restaurant.
A centralised staff car parking area provided adjacent to the ancillary facilities will enable separation of
heavy vehicle movements from private vehicle movements, particularly around the intermodal terminal
warehouses.
URBIS
SOCIAL IMPACT COMMENTARY_JUNE 2013 INTRODUCTION 3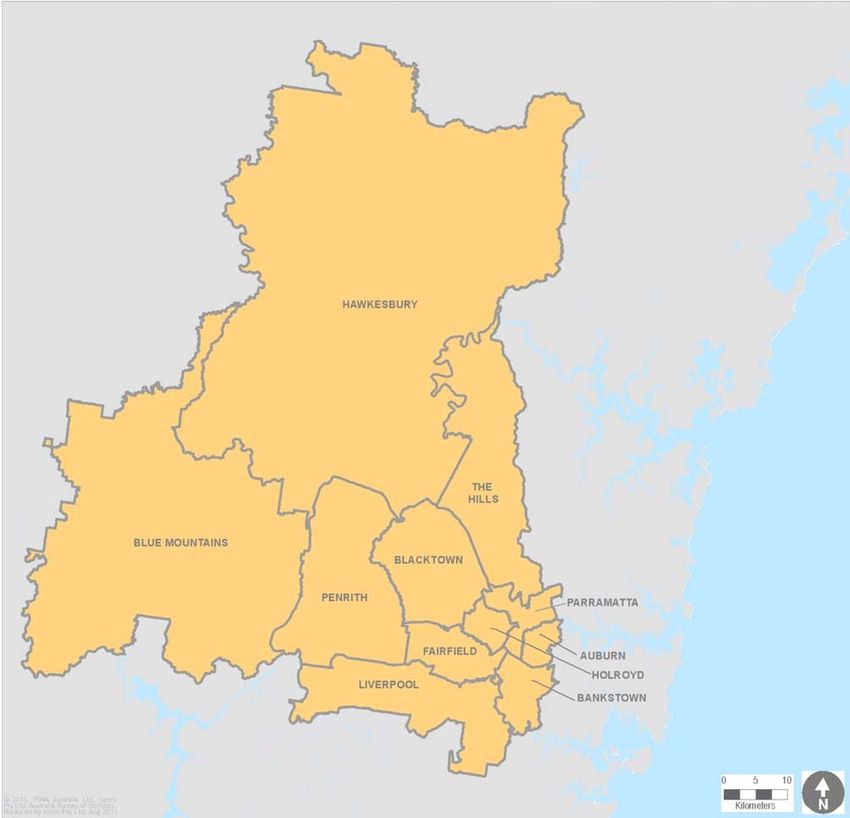
FIGURE 1 - SIMTA MOOREBANK ITF SITE LOCATION

4   INTRODUCTION
                                                                           URBIS
                                               SOCIAL IMPACT COMMENTARY_JUNE 2013
2 Document Review
The following section provides a summary of key regional and local documents and policies of relevance
to social impact and the proposed development. Documents reviewed as part of this section include:
Draft South West Subregional Strategy (November 2007)
North West And West Central Sydney Employment Strategies (November 2008)
Growing Liverpool 2021 – The Community Strategic Plan For The City Of Liverpool
Liverpool City Council Social Impact Assessment Policy
LEAP Multicultural Plan 2010 – 2014 And Action Plan 2010
Management Plan 2010 – 2011 Corporate Plan, Budget And Capital Works
Community Safety and Crime prevention Plan Liverpool 2009 – 2012
Liverpool City-Wide Recreation Strategy 2020
2.1 DRAFT SOUTH WEST SUBREGIONAL STRATEGY (NOVEMBER 2007)
The South West Subregional Strategy sets an employment capacity target of 208,500 jobs for the south
western area of Sydney (comprising Liverpool, Campbelltown, Camden and Wollondilly LGAs) by 2031.
This represents growth of 75% from current levels, and advocates the growth of Liverpool into a Regional
City, high quality urban development in the South West Growth Centre, improved access provided by the
M7 Motorway and improvements to the M5 Motorway. The employment capacity target for the Liverpool
LGA set by the South West Subregional Strategy totals 35,000 for the year 2031. This is the highest
growth target for the subregion.
The Strategy outlines the history of the Moorebank area from industrial zoning of the 1970s to the
addition of Defence land south of the M5 Corridor in 2003. 40% of the land is currently vacant or not
productively used for an industrial purpose. Land to the east, west and south of the defence land is listed
as potential employment land.
Moorebank contains a full range of industrial activities including:
Logistics and warehousing (especially west of Heathcote Road);
Manufacturing and heavy industry (between Newbridge Road and Heathcote Road); and
Local and light industry north of the M5 corridor.
Redevelopment of larger sites is providing an opportunity for more business and technology park type
uses to locate close to Liverpool City Centre, replacing heavy industry.
According to the Strategy, the State Government regards the proposal for a transport terminal at
Moorebank as a key component in meeting Sydney’s intermodal capacity needs.
2.2 NORTH WEST AND WEST CENTRAL SYDNEY EMPLOYMENT
STRATEGIES (NOVEMBER 2008)
This report was prepared by a consortium led by the Urban Research Centre at the University of Western
Sydney. Primarily, it analyses and recommends employment strategies for two of the sub-regions of
Western Sydney, North-West and West-Central. It was commissioned by the Western Sydney Regional
Organisation of Councils and its project partners.
Points of note include:
URBIS
SOCIAL IMPACT COMMENTARY_JUNE 2013 DOCUMENT REVIEW 5
There has been a fall in both the proportion of residents working locally and as well as a fall in the
ratio of total local jobs to local workers. Over a third of Western Sydney workers commute to
destinations outside the region for employment.
A simulation was conducted to reveal how the target of 235,000 net additional jobs would be
generated. It was found that the rate of net job production in the Western Sydney region would fall
dramatically short of the target of 235,000 net additional jobs if the economic conditions persist.
The region has a major concentration of transport and logistics firms, which will be impacted by
changing requirements associated with climate change.
Western Sydney is the prime destination for Sydney’s goods traffic, performing the major role in
logistics handling, wholesaling and distribution in each of the metropolitan area’s international,
interstate and NSW regional supply chain linkages. Road freight transport is currently the most
significant transport mode in these operations. It is reasonable to expect that this industry will
undergo major transformation over time as climate change responses are enacted.
Western Sydney is a large diversified economy containing nearly 250,000 businesses and producing
around 9% of the nation’s GDP. Employment growth in Western Sydney over the next 25 years will
be driven by five major factors, including engagement with the global economy, population growth,
access to supply and distribution chains through quality infrastructure, employment lands and
investment in knowledge and skills.
Population growth will be an employment growth driver reflected in growing employment in retailing,
construction, health and community services, and education. Growth in population and of household
consumption also generates the movement and distribution of freight. The North-West will play an
increasingly important role as host to transport and logistics industries attracted by lower-cost
greenfield sites and easy access to the Sydney orbital via the M4 and M7 motorways.
The most significant impediments to growth in Western Sydney are identified in the report as:
insufficient competitive industry clusters; transport bottlenecks; skills shortages; inadequate
telecommunications infrastructure; cost pressures on households especially in housing and
transportation; and ineffective governance.
Western Sydney remains over represented in the manufacturing; construction; retail; transport and
warehousing; and low value adding services segments of the workforce.
The report sets out a range of strategies to improve the socio-economic prospects of Western Sydney. It
is noted that among these are strategies for coordinated provision of regional and local employment to
reduce time spent in travelling to and from jobs. Relevant strategies outlined include:
Enhancing the movement of people and goods into, out of, and across the region
Improving the region’s competitive spaces through the provision of well-provisioned employment
lands, business parks and other specialist business and industrial spaces; and thereby build
concentrations of successful, jobs generating products
Enlivening the Metropolitan Strategy’s City of Cities vision including by the generation of a new spatial
diagram for the metropolitan area which captures Western Sydney’s aspiration to be a world class
regional economy that supplies quality jobs for its residents
Enhanced infrastructure provision to employment lands including the sub-regional centres
Significant new investments in freight handling and interchange infrastructure and facilities.
6 DOCUMENT REVIEW
URBIS
SOCIAL IMPACT COMMENTARY_JUNE 20132.3 GROWING LIVERPOOL 2021 – THE COMMUNITY STRATEGIC PLAN
FOR THE CITY OF LIVERPOOL
Growing Liverpool 2021 is a 10-year plan introduced to guide future development and growth in the LGA.
The plan establishes a vision for Liverpool as ‘a vibrant historical regional city of growth, prosperity and
diversity’.
The plan was informed by community engagement and consultation regarding the community’s visions
and priorities for the future development of Liverpool LGA. A range of strategies to be implemented over
the ten year period, contributing to a range of objectives, are outlined. Those relevant to this assessment
include:
Liverpool is the vibrant regional centre for South West Sydney
Neighbourhoods and villages are well designed, safe and clean
Liverpool is a socially inclusive and healthy community
There is an efficient and a highly connected transport system
Urban infrastructure meets the needs of a growing community
Liverpool has a range of business and employment opportunities
No specific reference is made to Moorebank, the SIMTA or to infrastructure of a similar nature, however
visions relating to efficient transport, appropriate urban infrastructure and ensuring business and
employment opportunities are relevant.
2.4 LIVERPOOL CITY COUNCIL SOCIAL IMPACT ASSESSMENT POLICY
Released in April 2012, this Policy details Council’s commitment to incorporating social impact into
decision making, development assessment and policy processes. The Policy outlines the principles of
social impact assessment and most relevant to this project, the requirement for particular types of
development to consider social impacts. The Policy provides guidance regarding the kinds of impacts that
may be considered by Council officers in assessing applications, and these have in part informed this
Social Impact Commentary.
2.5 LEAPS MULTICULTURAL PLAN 2010 – 2014 AND ACTION PLAN 2010
The Local Equity and Access Policy Statement (LEAPS) Multicultural Plan 2010 – 2014 (including the
Action Plan 2010) is part of Liverpool City Council’s broader commitment to delivering equitable and
accessible services to Liverpool residents of culturally and linguistically diverse (CALD) backgrounds.
The LEAPS Multicultural Plan provides an overview of the cultural and demographic characteristics of the
Liverpool LGA population and acknowledges the challenges associated with delivering accessible and
equitable services to the LGA’s diverse community. The Plan outlines a variety of actions in the areas of
program and service delivery, planning and evaluation, staffing, communication and funded services.
The Plan does not specifically mention Moorebank.
2.6 MANAGEMENT PLAN 2010 – 2011 CORPORATE PLAN, BUDGET AND
CAPITAL WORKS
Published in 2010, the Liverpool Management Plan 2010 – 2011 guides the operation and activities of
Liverpool City Council for the designated period. The Plan details how the LGA has grown and changed
in recent years and establishes the priorities, roles and responsibilities of Council going forward.
With respect to Moorebank and the subject site, the Plan acknowledges that the Moorebank area has and
will continue to experience increased residential infill development. Regional growth will continue to
URBIS
SOCIAL IMPACT COMMENTARY_JUNE 2013 DOCUMENT REVIEW 7occur, driven by the development of the South West Growth Centre, and will see the LGA continue to be
a primary provider of residential land for development in Sydney.
The plan makes a number of commitments to the local community, including maintaining good
communication between Council and the community, and striving for triple bottom line sustainability.
2.7 COMMUNITY SAFETY AND CRIME PREVENTION PLAN LIVERPOOL
2009 – 2012
The Community Safety and Crime Prevention Plan provides an overview of criminal activities and crime
statistics for the Liverpool area, and identifies a number of key actions to particularly assist in reducing
high rates of assault and theft from motor vehicles. The Plan does not mention Moorebank or the subject
site. It is understood that Council are planning to update the Plan in 2013.
Local crime statistics are considered further at Section 4 of this report.
2.8 KEY FINDINGS
Key findings from the above document review include:
The local environment is characterised by a high level of labour market regionalisation with a low job
to resident ratio exacerbated by rapid growth of the local labour market, which has grown faster than
the overall population.
There is significant population and employment growth anticipated in the LGA. Growth will occur
across a number of areas and industries. Liverpool is assigned the highest employment growth target
for the region. Residential growth is anticipated to occur in Moorebank in the form of infill
development.
There is an existing strong employment base in logistics, with Western Sydney well represented in
manufacturing, construction, retail, transport and warehousing. Many employment opportunities at the
fringe have tended to occur in low skilled areas, including manufacturing, wholesaling, transport and
construction, with fewer opportunities in more skilled employment sectors.
Local planning documents identify a number of priorities that relevant to the ITF, including:
Reduce unemployment particularly for young people and those experiencing long term
unemployment
Support initiatives that improve employment outcomes for Aboriginal people
Support economic development and access to local employment opportunities
Support development of Liverpool City Centre into a regional City with accessible services and
employment opportunities
Support affordable goods and services.
8 DOCUMENT REVIEW
URBIS
SOCIAL IMPACT COMMENTARY_JUNE 20133 Demographic Profile
The following provides an overview of the demographic characteristics of the local area population, as
well as that of the broader Liverpool and Greater Western Sydney regions.
3.1 REGIONAL CONTEXT – GREATER WESTERN SYDNEY
Moorebank is a suburb of the Liverpool Local Government Area in Greater Western Sydney. Greater
Western Sydney is home to approximately 1.85 million people, or over 43% of the metropolitan Sydney
population. The map below shows the location of Liverpool LGA within the local context of Western
Sydney (the yellow area being those Councils that are members of the Western Sydney Regional
Organisation of Councils).
Urbis Property Economics forecast an average annual growth rate of between 2.1% and 3.3% between
2006 and 2036 for the South West Subregion. Liverpool LGA is expected to account for 30% to 35% of
this growth. Development of the Growth Centres is expected to affect the need for future employment
lands within the region.
The development of employment lands is considered integral in local government areas such as Liverpool
which face the added pressure of population growth associated with nearby Growth Centres. Apart from
the North and South Subregions, the South West Subregion has the lowest provision of jobs, with just
0.72 job opportunities per person in the labour force.
FIGURE 2 – LOCATION MAP OF GREATER WESTERN SYDNEY LOCAL GOVERNMENT AREAS
Source: Western Sydney Regional Organisation of Councils (WSROC)
URBIS
SOCIAL IMPACT COMMENTARY_JUNE 2013 DEMOGRAPHIC PROFILE 9Analysis of the Greater Western Sydney context identifies a number of issues of potential consideration
with relation to social infrastructure requirements. Some key social characteristics of relevance include:
A high proportion of residents born overseas creating an environment of cultural, linguistic, religious
and ethnic diversity. The demographic profile of Moorebank reflects this profile, as does that of
Liverpool LGA.
The region has a young population profile which is rapidly ageing with a trend towards smaller
households and with single person households increasing at a significantly higher rate than Sydney
as a whole.
A large retired workforce, with impacts for the provision of health and social services to an older
population. The policy implications of decreased mobility and increased social isolation, coupled with
increased housing and transport stress are also important. 1
Significant new development in the release areas and redevelopment in established areas places
pressure on social infrastructure in the region. As identified within the Issues Paper prepared for the 2007
State Election by the Western Sydney Councils, social sustainability within Western Sydney has been
declining over recent years. The Issues Paper attributed this to a number of factors, including increased
socio-economic polarisation, high unemployment in some parts of south-western Sydney and under-
provision of social infrastructure relative to population growth.
Employment issues warrant special attention and priority in the region, which endures the spatial impact
of distance from most major employment centres, such as Sydney’s Global Economic Corridor, along with
structural factors including high regional unemployment.
3.2 LOCAL CONTEXT
The following summarises available demographic data, providing an overview of the local population and
current trends of relevance occurring in Moorebank suburb and Liverpool LGA. The analysis is based on
recently released 2011 census data, published by the Australian Bureau of Statistics. Comparison is
made with 2006 data to identify emerging trends.
3.2.1 CURRENT DEMOGRAPHIC TRENDS
At the time of the 2011 Census, the suburb of Moorebank had a total population of 7,595. The population
remained steady with a very slight decrease of 4 residents from 2006. Aboriginal and Torres Strait
Islanders comprise approximately 0.8% of the Liverpool LGA population.
3.2.2 AGE PROFILE AND DISTRIBUTION
The age profile of the Moorebank suburb is evenly spread and is relatively similar to that of the Liverpool
LGA. Table 1 below details the age distribution of the Moorebank population, compared with that of the
Liverpool LGA.
TABLE 1 – AGE PROFILE AND DISTRIBUTION IN MOOREBANK AND LIVERPOOL LGA IN 2011
2011 2006
AGE GROUP MOOREBANK LIVERPOOL LGA MOOREBANK LIVERPOOL LGA
Total 7,595 180,143 7,599 164,602
population
Median age 35 33 34 32
0 – 4 years 8.4% 7.8% 8.1% 8.3%
1
Future West Final Report, September 2006, Western Sydney Regional Organisation of Councils
10 DEMOGRAPHIC PROFILE
URBIS
SOCIAL IMPACT COMMENTARY_JUNE 20132011 2006 AGE GROUP MOOREBANK LIVERPOOL LGA MOOREBANK LIVERPOOL LGA 5 – 14 years 13.2% 15.6% 12.7% 16.6% 15 – 24 years 12% 14.5% 13.2% 14.5% 25 – 54 years 42.3% 43.3% 41.8% 43.8% 55 – 64 years 11.3% 9.5% 14.4% 8.6% 65 years and 12.8% 9.2% 9.7% 8.2% over As can be seen, the largest age group in both Moorebank and the Liverpool LGA was those aged 25-54 years, comprising 42.3% and 43.3% of the total populations respectively. The Moorebank population aged slightly between 2006 and 2011, with a growth in the number of residents aged 25-54 years, 55-64 years and over 65 years. The Moorebank population is slightly older than the Liverpool LGA population, with a larger proportion of residents aged over 55 and 65 years and a higher median age overall. 3.2.3 CULTURAL AND LINGUISTIC CHARACTERISTICS In 2011, approximately 34.2% of the Moorebank population were born overseas, with the most common countries of birth being New Zealand (2.3%), Fiji (2.2%), Vietnam (2.2%) and England (2%). The population of Liverpool LGA is generally more culturally diverse, with a significantly larger proportion of the population born overseas (46.2%). The most common countries of birth were Fiji (2.6%) and Iraq (3.4%). 61.3% of the Moorebank population reported speaking only English at home, compared to a lower 44.4% who reported speaking only English at home at the LGA level. Common languages spoken in Moorebank and Liverpool LGA include Arabic, Greek, Vietnamese, Italian and Hindi. 3.2.4 INCOME AND RELATIVE AFFLUENCE As illustrated in Figure 3 below, the median individual and household incomes of Moorebank residents are higher than Liverpool LGA medians, but comparable to Sydney SD medians. Individual and household incomes in the Liverpool LGA ($510 individual, $1,299 household) are lower those of Moorebank ($630 individual, $1,434 household) and Sydney ($619 individual, $1,447 household). URBIS SOCIAL IMPACT COMMENTARY_JUNE 2013 DEMOGRAPHIC PROFILE 11
FIGURE 3 – MEDIAN WEEKLY HOUSEHOLD INCOME

    $1,600
                             $1,434                                        $1,447
    $1,400                                        $1,299

    $1,200

    $1,000

     $800
                     $630                                           $619
     $600                                  $510

     $400

     $200

       $0
                     Moorebank            Liverpool LGA              Sydney SD

             Median personal household income     Median weekly household income

The SEIFA Index of Relative Socio-economic Disadvantage2 produced by the ABS provides an indication
of the socio-economic status of residents within the suburb of Moorebank and the Liverpool LGA. The
index focuses primarily on disadvantage, and is derived from Census variables including low income, low
educational attainment, unemployment, and dwellings without motor vehicles. The Liverpool LGA has a
SEIFA index score of 968, which is indicative of some disadvantage. Disadvantage is slightly less
apparent within the suburb of Moorebank, which has a SEIFA index score of 1,023.

3.2.5        HOUSING TENURE, AFFORDABILITY AND HOUSEHOLD STRUCTURE
Figure 4 below provides an overview of the proportions of tenure types in Moorebank, the Liverpool LGA
and Sydney SD. In 2011, there was a lower proportion of rental households in Moorebank (19%) than in
the Liverpool LGA (30%) and Sydney SD generally (32%). Reflecting this, over three quarters (78%) of
the Moorebank population own their home outright or with a mortgage. There are generally fewer home
owners in Liverpool, with 24% of homes owned outright.

2
 Socio-economic Index for Areas, ABS data, 2011, accessed at:
http://www.abs.gov.au/AUSSTATS/abs@.nsf/DetailsPage/2033.0.55.0012011?OpenDocument

12     DEMOGRAPHIC PROFILE
                                                                                                            URBIS
                                                                                SOCIAL IMPACT COMMENTARY_JUNE 2013
FIGURE 4 – TENURE TYPE
50%
44%
45% 42%
40%
34% 35%
35% 32%
30% 30%
30%
24%
25%
19%
20%
15%
10%
5%
0%
Moorebank Liverpool LGA Sydney SD
Owned outright Owned with a mortage Rented
Affordability has been assessed based on the Australian Housing and Urban Research Institute’s finding
that housing stress occurs when housing costs exceed 30% of the household income3. In 2011, the
median weekly rent in Moorebank ($350) was comparable to the Sydney SD ($351), while the median
weekly rent was lower in Liverpool ($295). In Moorebank, the rent equates to 24% of the median weekly
household income ($1,434/week) and is therefore considered affordable.
According to ABS data, the proportion of households in Moorebank where rent is 30% or greater of
household income is 6.3%, while in Liverpool the proportions of households where rent is 30% or greater
of household income is around double that of Moorebank at 12.2%.
3
Australian Housing and Urban Research Institute, 2006, Housing Affordability in Australia National
Research Venture 3: Housing Affordability for Lower Income Australians. Retrieved from:
http://www.ahuri.edu.au/downloads/NRV3/NRV3_Research_Paper_3.pdf#nameddest=NRV3_02
URBIS
SOCIAL IMPACT COMMENTARY_JUNE 2013 DEMOGRAPHIC PROFILE 13FIGURE 5 – HOUSEHOLD TYPE
90%
83% 82%
80%
73%
70%
60%
50%
40%
30%
23%
20% 16% 16%
10% 4%
2% 2%
0%
Moorebank Liverpool LGA Sydney SD
Family household Lone person household Group household
As shown in Figure 5 above, the household structure in Moorebank mirrors that of the Liverpool LGA, with
a high proportion of family households and fewer lone person households. There are a large proportion of
family households in Moorebank (83%), with 2,031 families recorded in 2011, and the number of families
in Moorebank increased by 3.5% between 2006 and 2011. Family households are less dominant at the
Sydney SD level, with a greater proportion of group and lone person households.
3.2.6 EMPLOYMENT
Of the Moorebank labour force in 2011, 88.8% were employed in full- or part-time work. The
unemployment rate is 4.7% of the labour force, lower than the Liverpool LGA (7%) and Greater Sydney
(5.7%).
Defence is the most common industry of employment (4.8%), following by school education (4.5%) and
road freight transport (3.3%). This profile is quite different to that of the Liverpool LGA, where school
education (3.8%) is the most common, followed by food services(3.6%) and road freight transport (3.2%).
3.3 KEY FINDINGS
This section has considered the demographic profile of Moorebank and the wider Liverpool LGA. Key
findings include:
The population of Moorebank has remained largely static in recent years. The population of the
Liverpool LGA on the other hand has increased by 8.6% between 2006 and 2011, which is reflective
of broader regional growth driven in part by the nearby Growth Centre.
The LGA currently has a younger population with a median age of 33 years compared with 37 years
for Australia as a whole. Moorebank suburb has a median age of 35 years and an increasing
proportion of families. However like much of Sydney, the Moorebank and Liverpool populations aged
slightly between 2006 and 2011, with a growth in the number of residents aged 25-54 years, 55-64
years and over 65 years.
Moorebank is less culturally diverse than the broader Liverpool LGA, which has high and increasing
levels of ethnic diversity and language groups. The proportion of the Moorebank population born
overseas did however increase by 6.1% between 2006 and 2011.
14 DEMOGRAPHIC PROFILE
URBIS
SOCIAL IMPACT COMMENTARY_JUNE 2013 There is some level of disadvantage in Moorebank, but particularly in Liverpool LGA, with SEIFA
index scores indicating comparative disadvantage. Reflecting this, median incomes in Moorebank are
higher than that of Liverpool, however comparable to Greater Sydney.
Employment in Moorebank is high, with unemployment rates lower in Moorebank than Liverpool LGA
and Greater Sydney. Reflecting local land uses, the most common industries of employment in
Moorebank are defence, school education and road freight transport. Road freight transport is
similarly common across the Liverpool LGA.
URBIS
SOCIAL IMPACT COMMENTARY_JUNE 2013 DEMOGRAPHIC PROFILE 154 Crime analysis
This section outlines crime trends in Liverpool Local Government Area (LGA), which encompasses the
suburbs of Moorebank, Wattle Grove and Casula, using the most current NSW Bureau of Crime Statistics
and Research (BOCSAR) data, in order to address this concern. It is noted that BOCSAR crime statistics
are only available at LGA level.
It is important to note that the crime figures discussed in this section relate to those crimes that have been
recorded by BOCSAR (i.e. Recorded Incidents (RI)), not necessarily all crimes committed in Liverpool
LGA. Levels of crime are sensitive to the willingness of ability of people to report crime, levels and nature
of police detection and actual levels of criminal activity.
In addition, crime data must be interpreted with caution as many factors may influence apparent trends,
for example a Police ‘crackdown’ on particular types of offences may push up recorded crime rates for
those categories. An increase in figures therefore does not necessarily translate to an increase in that
type of crime, but rather an increase in detection of, and potentially convictions for, that type of crime.
4.1 LOCAL CRIME TRENDS – LIVERPOOL LGA
The following outlines the local crime trends in Liverpool LGA. A combination of BOCSAR statistical data
and visual thermal ‘hotspot’ maps has been reviewed to provide an understanding of crime trends in the
area. According to BOCSAR data outlined in Table 2 the offence categories where incidents were most
frequently recorded in Liverpool LGA from January to December 2012 were:
Malicious damage to property (1,871 offences)
Fraud (1,432)
Steal from motor vehicle (1,390)
Break and enter dwelling (1,123)
Assault - domestic violence related (880)
Steal from retail store (861).
TABLE 2 – NSW BUREAU OF CRIME STATISTICS AND RESEARCH RECORDED CRIMINAL INCIDENTS FOR
LIVERPOOL LGA, 2012
OFFENCE TYPE NUMBER OF 24-MONTH 60-MONTH 2012 LGA
INCIDENTS TREND TREND RANK
Murder 0 nc** nc**
Assault - domestic violence related 880 Stable +9.6% 43
Assault - non-domestic violence related 746 -14.1% Stable 82
Sexual assault 124 Stable Stable 81
Indecent assault, act of indecency and other sexual 129 Stable Stable
offences
Robbery without a weapon 108 Stable Stable 11
Robbery with a firearm 12 nc** nc**
16 CRIME ANALYSIS
URBIS
SOCIAL IMPACT COMMENTARY_JUNE 2013OFFENCE TYPE NUMBER OF 24-MONTH 60-MONTH 2012 LGA
INCIDENTS TREND TREND RANK
Robbery with a weapon not a firearm 68 Stable Stable
Break and enter dwelling 1,123 -11.6% Stable 49
Break and enter non-dwelling 259 Stable -12.0% 109
Motor vehicle theft 624 Stable -8.3% 26
Steal from motor vehicle 1,390 Stable Stable 38
Steal from retail store 861 Stable +6.4% 16
Steal from dwelling 385 Stable +4.1% 114
Steal from person 143 Stable - 11.3% 32
Fraud 1,432 +28.4% Stable 12
Malicious damage to property 1,871 Stable -4.3% 83
Source: NSW Bureau of Crime Statistics and Research 2013
** Trend information was not calculated (nc) for the 12-month period if the selected offence category has less than 20
incidents.
The data in Table 2 below indicates that the majority of offence categories in Liverpool LGA in the two
year period to December 2012 have remained stable. Non-domestic violence related assault reduced by
approximately 14.1%, and the number of break and enter dwelling offences reduced by 11.6%. The only
crime reported by BOCSAR to have increased over 24 months is fraud, increasing by 28.4%.
The last five years have seen increases to assault – domestic violence related (increased by 9.6%), steal
from retail store (increased by 6.4%) and steal from dwelling (increased by 4.1%). This period also saw
decreases to the following offence categories break and enter non-dwelling (by12.0%), steal from person
(by11.3%), motor vehicle theft (by 8.3%) and malicious damage to property (by 4.3%).
Liverpool LGA ranked number 11 out of all NSW LGAs for incidences of robbery without a weapon, 12 for
fraud and 19 for steal from retail store.
4.2 COMPARISON WITH SELECTED NSW RECORDED INCIDENTS
Table 3 shows the number of recorded criminal incidents for each offence category for Liverpool LGA in
comparison to those in NSW for the period from January to December 2012.
The number of incidents for each offence category is listed, together with the rate of offending per
100,000 population. The trend for these incidents occurring in both Liverpool LGA and NSW over a 24
month period has also been included.
URBIS
SOCIAL IMPACT COMMENTARY_JUNE 2013 CRIME ANALYSIS 17TABLE 3 – COMPARISON OF NSW BUREAU OF CRIME STATISTICS AND RESEARCH RATE PER 100,000
POPULATION OF RECORDED CRIMINAL INCIDENTS FOR PENRITH LGA AND NSW, 2012
LIVERPOOL LGA NSW
OFFENCE TYPE NUMBER OF JAN-DEC 2012 24- NUMBER OF JAN-DEC 2012 24-
INCIDENTS RATE PER MONTH INCIDENTS RATE PER MONTH
100,000 TREND 100,000 TREND
POPULATION POPULATION
Murder 0 0.0 nc** 71 1.0 Stable
Assault - domestic 880 466.7 Stable 27,399 375.2 Stable
violence related
Assault - non-domestic 746 395.6 -14.1% 35,230 482.5 -5.7%
violence related
Sexual assault 124 65.8 Stable 4,629 63.4 Stable
Indecent assault, act of 129 68.4 Stable 5,646 77.3 Stable
indecency and other
sexual offences
Robbery without a 108 57.3 Stable 2,799 38.3 Stable
weapon
Robbery with a firearm 12 6.4 nc** 353 4.8 Stable
Robbery with a 68 36.1 Stable 1,402 19.2 Stable
weapon not a firearm
Break and enter 1,123 595.5 -11.6% 40,487 554.5 Stable
dwelling
Break and enter non- 259 137.3 Stable 16,245 222.5 -4.9%
dwelling
Motor vehicle theft 624 330.9 Stable 18,221 249.5 -7.0%
Steal from motor 1,390 737.1 Stable 47,072 644.6 Stable
vehicle
Steal from retail store 861 456.6 Stable 21,904 300.0 Stable
Steal from dwelling 385 204.2 Stable 21,849 299.2 Stable
Steal from person 143 75.8 Stable 8,092 110.8 Stable
18 CRIME ANALYSIS
URBIS
SOCIAL IMPACT COMMENTARY_JUNE 2013LIVERPOOL LGA NSW
OFFENCE TYPE NUMBER OF JAN-DEC 2012 24- NUMBER OF JAN-DEC 2012 24-
INCIDENTS RATE PER MONTH INCIDENTS RATE PER MONTH
100,000 TREND 100,000 TREND
POPULATION POPULATION
Fraud 1,432 759.4 +28.4% 42,644 584.0 14.6%
Malicious damage to 1,871 992.2 Stable 82,461 1,129.3 Stable
property
Source: NSW Bureau of Crime Statistics and Research 2013
Table 3 shows that a larger proportion of crime trends are occurring in greater frequency in Liverpool LGA
than NSW which suggests a higher prevalence of incidences of crime in Liverpool LGA. Offence
categories with a higher rate of incidence per 100,000 population in Liverpool LGA compared to NSW
include:
Assault – domestic violence related (Liverpool LGA, 466.7; NSW, 375.2)
Sexual assault (Liverpool LGA, 65.8; 63.4)
Robbery without a weapon (Liverpool LGA, 57.3; NSW; 38.3)
Robbery with a firearm (Liverpool LGA, 6.4; NSW, 4.8).
Robbery with a weapon not a firearm (Liverpool LGA, 36.1; NSW, 19.2)
Break and enter dwelling (Liverpool LGA, 595.5; NSW, 544.5)
Motor vehicle theft (Liverpool LGA, 330.9; NSW, 222.5)
Steal from motor vehicle (Liverpool LGA, 737.1; NSW, 644.6)
Steal from retail store (Liverpool LGA,456.6; NSW, 300.0)
Fraud (Liverpool LGA, 759.4; NSW, 584.0).
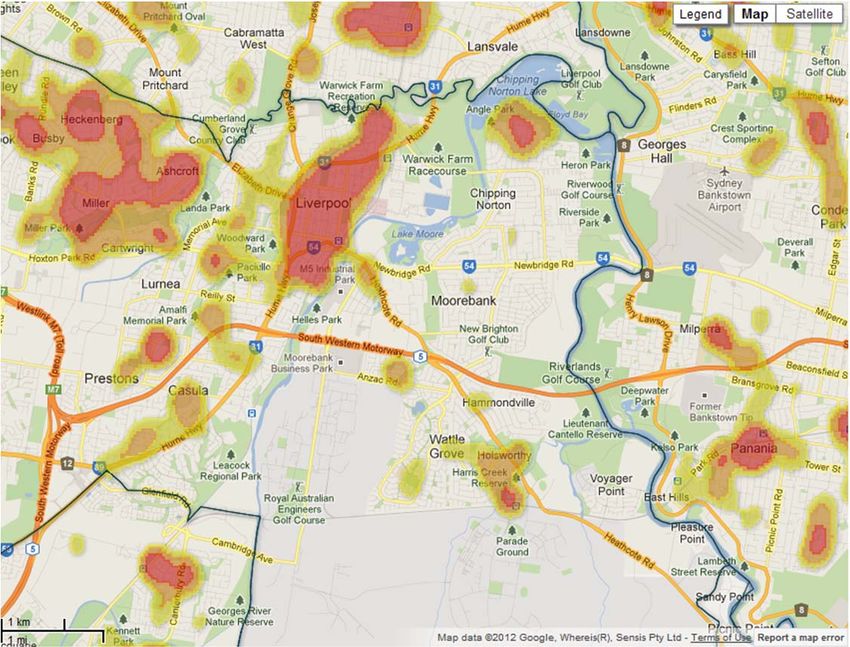
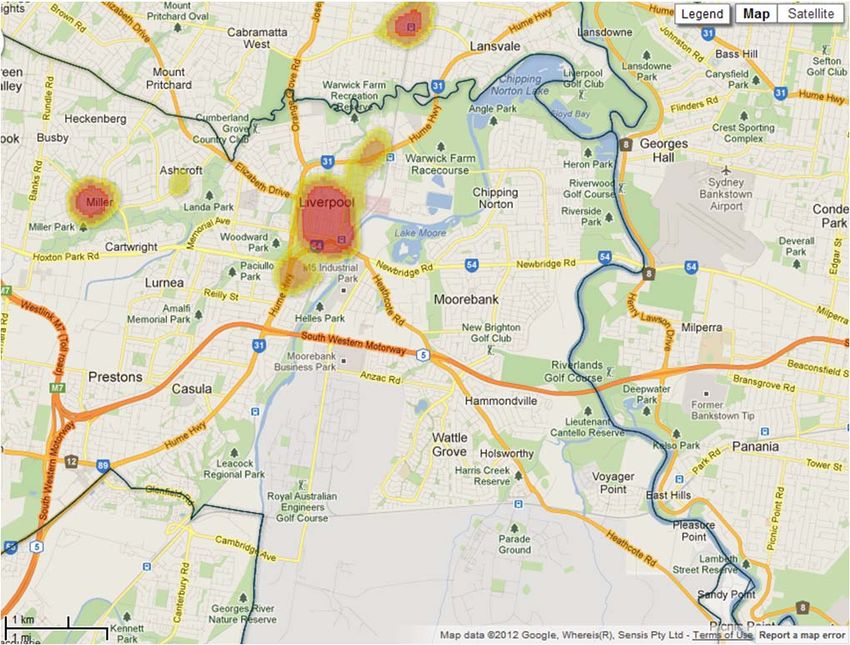
4.3 IDENTIFIED CRIME ‘HOTSPOTS’ IN LIVERPOOL LGA
BOCSAR publish density ‘hotspot’ maps to illustrate areas of high crime density relative to crime
concentrations across NSW. The ‘hotspots’ indicate areas with a substantially higher than average
density of recorded criminal incidents for selected offence categories. Areas in the top three deciles of
crime concentrations are illustrated by the ‘hotspots’, with the 10th group denoting the highest crime
density in red, the 9th group coloured orange, and the 8th group coloured yellow. It is noted that hotspots
are not adjusted for the number of people residing in or visiting the LGA.
‘Hotspot’ maps shown below reflect relevant high frequency crime trends in Liverpool LGA in 2010 (the
most recent data available), and include:
Malicious damage
Steal from motor vehicle
Motor vehicle theft
Break and enter dwelling
URBIS
SOCIAL IMPACT COMMENTARY_JUNE 2013 CRIME ANALYSIS 19 Assault – non-domestic violence related
Assault – domestic violence related.
FIGURE 6 – MALICIOUS DAMAGE
Source: NSW Bureau of Crime Statistics and Research 2012
20 CRIME ANALYSIS
URBIS
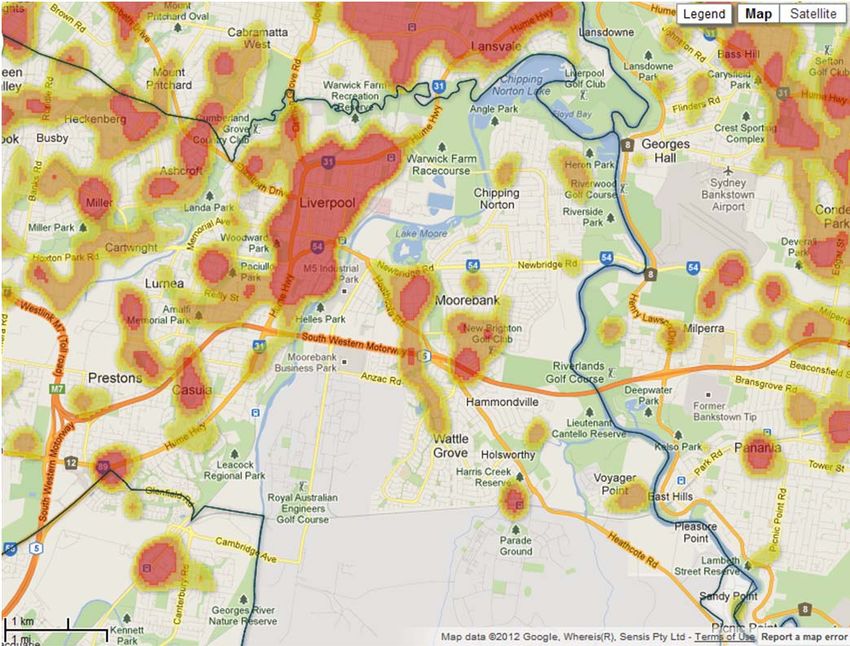
SOCIAL IMPACT COMMENTARY_JUNE 2013FIGURE 7 – STEAL FROM MOTOR VEHICLE Source: NSW Bureau of Crime Statistics and Research 2012 FIGURE 8 – MOTOR VEHICLE THEFT Source: NSW Bureau of Crime Statistics and Research 2012 URBIS SOCIAL IMPACT COMMENTARY_JUNE 2013 CRIME ANALYSIS 21
FIGURE 9 – BREAK AND ENTER DWELLING

Source: NSW Bureau of Crime Statistics and Research 2012

FIGURE 10 – ASSAULT – NON DOMESTIC VIOLENCE RELATED

Source: NSW Bureau of Crime Statistics and Research 2012

22   CRIME ANALYSIS
                                                                                       URBIS
                                                           SOCIAL IMPACT COMMENTARY_JUNE 2013
FIGURE 11 – ASSAULT – DOMESTIC VIOLENCE RELATED
Source: NSW Bureau of Crime Statistics and Research 2012
The ‘hotspot’ maps do not show any current incidences of crime occurring at the proposed site of the
Moorebank Intermodal. The majority of crimes are concentrated around Liverpool station and town
centre, with incidents of crime occurring in smaller density at Casula Mall shopping centre and Casula
station, Holsworthy Station, and near areas of activity or open space.
4.4 KEY FINDINGS
Crime has remained largely stable in the Liverpool LGA over the last two years, despite occurring at
higher rates than the NSW average. The most common crimes in 2012 were malicious damage to
property, fraud, steal from a motor vehicle and break and enter dwelling. Available suburb level data
(primarily hot spot maps) indicate that crime is not currently an issue in the area surrounding the
Moorebank Intermodal site. but that crime rates are comparatively high in the LGA in general.
URBIS
SOCIAL IMPACT COMMENTARY_JUNE 2013 CRIME ANALYSIS 235 Potential Social Impacts and Benefits
A number of potential social impacts and benefits have been identified based on a review of consultation
outcomes and specialist reports, and taking into account the findings of the above demographic profiling,
crime statistics analysis and document review.
A consultation report prepared by Elton Consulting in 2011, documenting engagement activities
undertaken in relation to the proposal, has been used to structure the assessment against areas of
identified community concern, with additional commentary is added based on review of technical reports
and findings of research documented earlier in this report.
5.1 TRAFFIC
A major concern identified in the draft Consultation Outcomes Report included the potential for
congestion, mainly truck traffic on major roads, on local roads and on residential streets. Some of the key
impacts on the community, identified from the Consultation Report are related to potential for increased
trucks on residential streets, congestion and truck impact on the M5 and truck traffic along Anzac Road
and Moorebank Avenue. The Consultation Report identified the need for traffic modelling, particularly on
Moorebank Avenue.
A Transport and Accessibility Impact Assessment was prepared by Hyder in June 2013 to model the
potential impacts of the ITF. The assessment models the potential traffic generated, identifies potential
issues at key intersections and identifies mitigation measures to minimise impacts. The modelling
assumed the following figures:
1,035 rigid truck movements per weekday
1,603 articulated truck movements (both directions) each weekday
3,613 car movements each weekday (based on 2,258 personnel working on site with 80% of daily
movements made by private car)
The project proposes up to 1,800 car parking spaces.
Hyder identified that the proposed development will contribute to existing poor levels of service in the
local area and there will be some additional congestion at peak hours. However, a range of mitigation
measures are proposed in the technical assessment and it is considered that observing these will assist
in managing potential impacts. Some of these mitigation measures that will reduce potential social
impacts include:
A range of intersection and road upgrades to increase the local road capacity, including:
Potential upgrade of Moorebank Avenue between the M5/Moorebank Avenue interchange and
the SIMTA northern access, to four lanes when SIMTA site is fully developed;
Concurrent with four lane widening on Moorebank Avenue, the Moorebank Avenue/Anzac Road
signal will require some form of widening at approach roads.
A new traffic signal at SIMTA’s northern access with the Moorebank Avenue.
Additional capacity improvements in the form of widening at the following ramp locations
including: M5 westbound off ramp; M5 westbound on ramp and M5 eastbound off ramp.
A range of ‘travel demand management actions’ that seek to encourage more active modes of
transport and public transport to reduce potential peak hour congestion associated with journey to
work.
Provision of pedestrian and cycle infrastructure which will serve the new development as well as the
surrounding community.
24 POTENTIAL SOCIAL IMPACTS AND BENEFITS
URBIS
SOCIAL IMPACT COMMENTARY_JUNE 20135.2 AIR QUALITY AND HEALTH IMPACTS
Issues relating to poor air quality in South Western Sydney and its impacts on population health (in
particular on asthma rates) are well-documented in academic studies and reflected in various planning
documents. Reflecting this, the Consultation Outcomes Report indicates concern about potential impacts
on local air quality; the question of increased particulates through diesel fumes; the effects of idling
trucks; the methodologies for assessing current and future air quality and the effect of the proposal on the
existing ‘asthma zone’.
Pacific Environment Limited completed an Air Quality Impact Assessment in June 2013 to assess the
potential impacts of the proposal. It notes that from an air quality perspective, the potential emissions
during operation of the proposed ITF are primarily from diesel vehicle exhaust (locomotives, trucks and
container handling equipment) and ancillary equipment. During construction, 9dust emissions can also be
expected from the site; however, construction impacts are proposed to be staged, temporary and
relatively short. In regards to regional air quality, the operation of the SIMTA proposal is expected to have
a net positive impact by reducing freight transport by truck and reducing the overall emissions to the local
area.
A technical Health Risk Screening was completed by Toxicology Consultants Toxicos in November 2012
to assess the potential local health impacts associated with air quality concerns. The cumulative health
impacts were assessed and considered the existing air quality data with the addition of the proposed ITF.
The report found that the emissions from the terminal facility were unlikely to have acute or chronic direct
health effects on the local residents. Individual concentrations of Nitrogen Dioxide (N02) and Particulate
Matter (PM10 and PM2.5) are modelled to be below their respective health guidelines. The report does note
that in a there may be some rare incidences where the accumulation of particulate matter and nitrogen
dioxide can exceed the combined standards. This does not mean health effects are probable or imminent
in the vicinity of the facility.
From a social impact perspective in relation to the concerns raised in the Consultation Outcomes Report,
the Air Quality impacts have not been identified as significantly exceeding the standards and determined
as unlikely to have acute or chronic direct health effects on the local residents.
5.3 VISUAL IMPACT AND LIGHT SPILL
A specialist report was prepared by Reid Campbell in June 2013 which assesses the potential visual
impact of the facility as well as the potential impact of light spill. This report concludes that the proposed
development would generally be in keeping with the existing general industrial character of the area. The
visual impacts were considered generally low, with some limited and localised visual impacts associated
with higher and bulkier structures. In addition, in those areas where negative visual impacts were
identified, mitigation measures have been proposed including intensive landscaping and planting, built-
form screening and mounding.
The Consultation Outcomes Report identified concerns about the potential brightness and extent of light
spill. It indicates that SIMTA proposes to measure light spill and to mitigate against its effects through the
design and location of light poles. From a light spill perspective the report concludes that:
The light spill from the site has been modelled based on a preliminary lighting concept and
results suggest that 1 lux in residential dark surrounds during curfew hours is achieved
approximately 150 metre from the light source. The nearest residential properties are
approximately 400 metres away and hence the impact of spill light to the residential
properties will be well within the required criteria as specified in Australian Standard
AS4282-1997 “Control of the Obtrusive Effect of Outdoor Lighting.
Source: Reid Campbell, Visual Impact Assessment
This conclusion indicates that light spill does not exceed regulated levels, and the proposed landscaping
and works associated with reducing visual impacts will also assist in mitigating the effects of light spill.
URBIS
SOCIAL IMPACT COMMENTARY_JUNE 2013 POTENTIAL SOCIAL IMPACTS AND BENEFITS 25You can also read