SWITCHED ON! ENVIRONMENT - Achieving a green, affordable and reliable energy future - The New Zealand Initiative
←
→
Page content transcription
If your browser does not render page correctly, please read the page content below
ENVIRONMENT

SWITCHED ON!
Achieving a green, affordable
 and reliable energy future
          Matt Burgess

                            THE NEW ZEALAND INITIATIVE   1
© The New Zealand Initiative 2019 Published by The New Zealand Initiative PO Box 10147 Wellington 6143 New Zealand www.nzinitiative.org.nz Views expressed are those of the author and do not necessarily reflect the views of The New Zealand Initiative, its staff, advisors, members, directors or officers. ISBN 978-0-9951105-4-0 (print) 978-0-9951105-5-7 (online) RR52 Typeset by The Little Design Company Printing arranged by True North New Zealand Ltd Attribution 4.0 International (CC by 4.0) 2 SWITCHED ON!
SWITCHED ON!
Achieving a green, affordable and reliable energy future

                                       Matt Burgess

      About the New Zealand Initiative

      New Zealand Initiative is an independent public policy think tank supported by
      chief executives of major New Zealand businesses, including energy companies. We
      believe in evidence-based policy and are committed to developing policies that work
      for all New Zealanders.

      Our mission is to help build a better, stronger New Zealand. We are taking the
      initiative to promote a prosperous, free and fair society with a competitive, open and
      dynamic economy. We are developing and contributing bold ideas that will have a
      profound, positive and long-term impact.

      Disclosure

      The author has invested in a small holding of New Zealand Units through the NZX-
      listed Carbon Fund.
About the Author Matt Burgess is a Research Fellow. He was Senior Economic Advisor to a former Minister of Finance, a Chief Executive of iPredict, and a Senior Associate at consultants Charles River Associates. He has a Master of Commerce in economics with first class honours from the University of Canterbury and a Bachelor of Commerce in economics and mathematics. Acknowledgements The author acknowledges and thanks those who have generously volunteered their time and expertise to give comments on an earlier draft, including in particular Prof. (Emeritus) Lewis Evans, the expert reference group, and New Zealand Initiative staff. The sole responsibility for views expressed and any errors or omissions in the report lies with the author.
Contents
Executive Summary                                                                                           5

Chapter 1
Introduction                                                                                                8
1.1 How not to do a renewables policy                                                                       8
1.2 Electricity in New Zealand                                                                              9
1.3 The 100% renewable generation policy                                                                   12

Chapter 2
Economics of electricity and renewables                                                                   13
2.1 Capital costs matter                                                                                  14
2.2 How supply meets demand in a wholesale electricity market                                             16
2.3 Generators cooperate when they compete                                                                18
2.4 Intermittency                                                                                         19

Chapter 3
Why renewables policies fail                                                                              21
3.1 When intermittent generation works best                                                               22
3.2 Displacement breaks renewables policies                                                               22
3.3 It’s the policy, not renewables                                                                       24
3.4 Explaining Germany                                                                                    24

Chapter 4
Cost of New Zealand’s 100% renewables policy                                                              27
4.1 The outlook                                                                                           27
4.2 Costs estimate                                                                                        27
4.3 Picking winners is expensive and unnecessary                                                          29
4.4 The danger of capacity contracts                                                                       31

Chapter 5                                                                                                32
A better way to reduce emissions                                                                          32
5.1 Emissions trading                                                                                     32
5.2 A hypothetical                                                                                        33
5.3 Managing distributional issues                                                                        34
5.4 Is an ETS actually effective?                                                                         35

Chapter 6
What’s the strategy? The futility of emissions policies under an ETS                                     36
6.1 Political tolerance for the ETS                                                                      37

Chapter 7
Recommendations                                                                                          39
7.1 Findings                                                                                             39
7.2 General policy principles                                                                            40
7.3 Implementing the 100% renewables policy and wider emissions reductions.                              40

Appendix 1: How cost effective are top-down programmes on emissions reduction?                           41
Appendix 2: Overseas evidence for the effectiveness of carbon and pollution taxes                        43

Bibliography                                                                                             44
Endnotes                                                                                                 47

                                                                                    THE NEW ZEALAND INITIATIVE   3
Figures
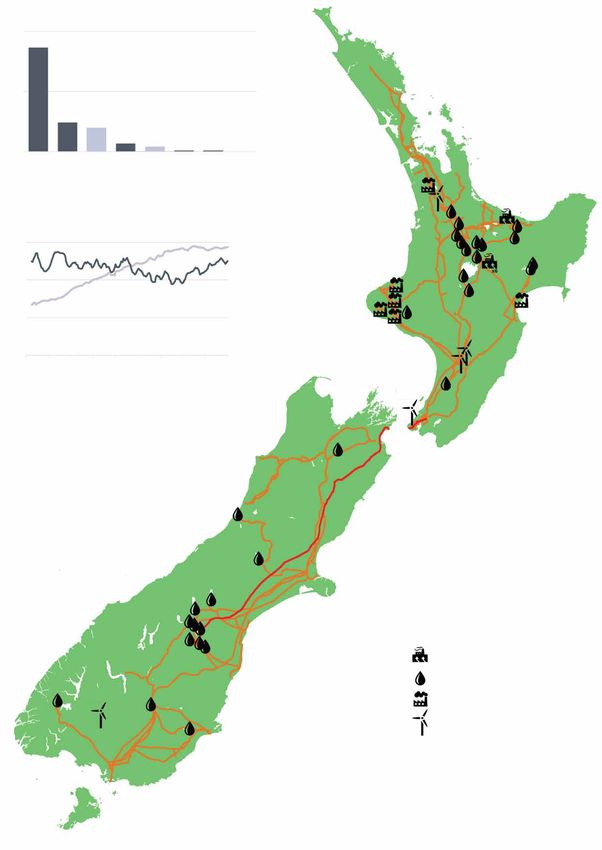
Figure 1: Electricity sources in New Zealand 10
Figure 2: Residential electricity prices in OECD countries 12
Figure 3: New Zealand electricity demand (26 June 2018) 13
Figure 4: Demand for electricity (1 October 2017 to 30 September 2018) 14
Figure 5: Levelised cost of electricity by generation type 15
Figure 6: New Zealand daily wholesale electricity prices 2014–2019 17
Figure 7: Coal and gas backs hydro in dry years 18
Figure 8: Available sun energy in Wellington on 2 November vs 3 November 2018 19
Figure 9: Renewable generation output vs demand in New Zealand 28
Figure 10: Estimated 2035 carbon abatement curve 29
Figure 11: Estimated effective carbon prices in the electricity sector 41
Figure 12: Estimated effective carbon prices in the transport sector 42
Boxes
Box 1: The UK electricity system 20
Box 2: South Australia blacks out 25
Table
Table 1: Cost of abatement by policy (US$) 30
4 SWITCHED ON!Executive Summary
New Zealand’s electricity system works. policy – renewables make sense in New Zealand
Electricity here is reliable and more affordable with its vast natural resources. But there is no
than in most other OECD countries. But feasible combination of hydro, wind, solar or
what sets New Zealand apart is that 83% of its geothermal that can supply the last 5%. When
electricity is produced from renewable sources, policy forces electricity demand to be met using
mainly hydro, geothermal and wind, the the wrong technologies, the main way to correct
third-highest share of renewables in the OECD. for the technology mismatch is by overbuilding.
Just 3% of our electricity comes from emissions- Alternatives such as demand response and battery
intensive coal. Over the next 20 years, renewables storage have potential but look expensive.
will increase their share to between 90% and 97%.
Renewables work in New Zealand. Other countries have aggressively supported
renewables to pursue their emissions targets.
Electricity’s impressive record in New Zealand Unlike New Zealand, the electricity sectors
has largely been achieved without subsidies or in Australia, Germany and the UK operate
direction from policymakers. Despite remaining more or less under the direct control of elected
in majority public ownership, businesses and governments. These governments have directed
regulators in the electricity sector operate investments worth hundreds of billions of dollars
independently of elected governments. For into solar and wind generation. The result?
30 years, government’s relationship with Substantial increases in the cost of electricity in
electricity has been mostly conducted through those countries for only limited cuts in emissions.
overarching environmental and competition
legislation, rather than ministerial direction. This does not reflect any problem with renewable
technologies. The problem is policies that force
Until now, that is. The 2017 Labour-Green renewables into roles within electricity systems
coalition agreement has set a target: By 2035, 100% for which they are a poor fit. It is one thing to
of New Zealand’s electricity will be generated build renewable generation, but quite another for
from renewable energy, excluding dry years. It that generation to find a productive home within
is an expensive policy. By one estimate, it could an electricity system where it is actually used. It
add more than $800 million to the annual cost is no coincidence that affordable, clean electricity
of electricity. More importantly, it is a needlessly has emerged in one of the few countries,
expensive way to reduce carbon dioxide emissions: perhaps the only country in the OECD, where
the cost of more than $1,000 per tonne is investment in electricity generation is determined
40 times the current price of emissions units on not by policy and subsidies but by competition
New Zealand’s Emissions Trading Scheme (ETS). between technologies on a level playing field
Worse, the 100% renewables policy could actually beyond the reach of politics. If electricity is to be
raise emissions if the higher cost of electricity affordable and clean, technologies must each find
delays the anticipated transition of transport and their own level within an electricity system.
industry off fossil fuels on to electricity.
The government does not need to be in the
The first 95% of the government’s renewables business of picking winners to reduce emissions.
target is expected to happen without any help from Policies like 100% renewables choose one part
THE NEW ZEALAND INITIATIVE 5of one sector for emissions reduction without Political support for the ETS can be lifted by a
weighing the alternatives across the rest of the commitment to revenue neutrality in the scheme,
economy – an impossible task for policymakers that is, a commitment to use the revenues
when those alternatives can cost millions. The from the sale of emissions rights to lower taxes
problem is not that the government picked the elsewhere. This will prevent carbon pricing
wrong winner with its 100% renewables policy, from being seen as a ‘tax grab’, while carrying
but that it tried picking any winner at all. the potential, by no means guaranteed, of a
‘double dividend’: benefits first from pricing the
The government can reliably reduce emissions carbon externality, and second from lowering
at less cost by pricing carbon. The decentralised other distortionary taxes. Other ways to lift
nature of emissions gives price the advantage over political support for an ETS include independent
policy as a mechanism for reducing emissions. evaluations of all emissions policies on a cost
New Zealand prices carbon through the ETS, per tonne basis, and a commitment to reallocate
established in 2008. The government recently funds from less- to more-effective policies based
said it sees the ETS as its “main tool” for on the evaluation findings.
achieving its emissions targets and is taking steps
to tighten it up. The government is right to seek cross-party
policy consensus on climate policy. A policy’s
It is right to do so. Research suggests a huge credibility matters when the goal is to move
performance gap between government policy incentives that affect long-term investment.
and carbon pricing as mechanisms. Results vary
widely, but on the whole governments spend This consensus should be extended to rule out
$5 to avoid emissions costs of $1. In a properly direct policy interventions in the electricity
calibrated ETS, emitters spend up to $1 to avoid system. Investment decisions over large and
emissions costs of $1. Together, these suggest an expensive generation facilities are highly sensitive
order of magnitude gap in the performance of an to the potential for further intervention. Even
ETS and government policy on the basis of cost limited government interventions in electricity
per tonne abated. markets tend to cascade, as seen here in
New Zealand in the 1970s and currently abroad.
New Zealand’s ETS has not been effective to The importance of policy credibility strongly
date, but this reflects a watering down rather favours consistent, institutionalised solutions like
than any inherent problem with the mechanism. the ETS over ad hoc approaches such as the 100%
A stronger ETS will increase investment in renewables policy. Like governments, policies
renewables as well as in R&D, but getting there come and go, but institutions are permanent.
will require dealing with difficult problems,
including leakage and whether and how to Distributional effects of carbon pricing should be
include agriculture. These problems are worth resolved using the welfare system, not by watering
solving because the prize is huge: the ability to down environmental policies. It is not clear in any
achieve any emissions target at a fraction of the case that policy as a mechanism is less regressive
cost of the policy alternative. than a carbon price on average. A sound general
policy principle is to protect households and
Policy’s goal, apart from building an effective individuals via incomes, not prices.
ETS, should be to maximise the emissions
scheme’s share of abatement efforts. But The next 20 years will likely see growth in
politics puts limits on how much can be done electricity and waves of new technologies.
with an ETS. New Zealand’s current electricity model
6 SWITCHED ON!– independence from political influence, prices
on electricity and carbon that reflect costs,
competition between generation, storage and
other technologies on a level and credible playing
field – puts us in an ideal position to extend our
lead over most other countries for affordable,
green electricity. In emissions as for electricity,
the government’s role is a choice between
deciding the answer, or providing the level
playing field that enables its discovery. In both
cases, the government’s opportunity to add value
is to support discovery.
THE NEW ZEALAND INITIATIVE 7Chapter 1
Introduction
1.1 How not to do a renewables policy generating companies, determine how many
solar panels and wind turbines are to be built
One can only hope no country will ever spend as in Bavaria, Bremen and Berlin in a year. A
much money to do as little for the environment complex system of subsidies involving thousands
than Germany with its renewable energy policy. of different prices, all politically determined,
channels investment in solar and wind.
Germany introduced its Energiewende
policy, meaning ‘energy turnaround’, in 2010 Such complexity inevitably leads to absurdities.
and sharply accelerated it the day after the In 2011 and 2012, it cost around three times more
Fukushima earthquake in March 2011. The to generate 1kW of power from a solar panel
policy is a commitment to phase out nuclear than from a wind turbine. Subsidies for solar
power in Germany by the early 2020s and replace were set at a level sufficient to offset this cost
it with wind turbines and solar panels. Its scale gap, making solar competitive. The world price
is extraordinary: 20 years, €550 billion, about for solar panels was falling rapidly, much faster
€25,000 for every household. That’s three times than for wind turbines, but political pressure in
the cost of the entire US Apollo programme in Germany prevented downwards adjustments to
today’s money. solar subsidies to compensate. Solar subsidies
became overly generous. High-cost solar
The Economist reported on the progress of suddenly became far more profitable than
Energiewende in 2013, three years after the lower-cost wind.4
policy’s launch.1 The policy had succeeded in
lifting the share of solar and wind generation Solar investment boomed to such an extent
and reducing that of nuclear. But emissions that by 2013, Germany, one of the least sunny
from Germany’s electricity sector had increased, countries on earth (even Antarctica receives
not fallen.2 Germany was burning more brown more annual sunshine hours),5 held nearly 50%
coal than at any time since shortly after the fall of the world’s installed solar capacity. The same
of communism in 1990. Germany’s households number of solar panels located in Spain would
were now paying some of the highest electricity have produced 2.5 times more energy than in
prices in the world. Worse, Germany was looking Germany.6 Only since 2013 have subsidies in
at spending €1 trillion more on transmission to Germany been adjusted in favour of wind,
transport the renewable energy generated in the leading to a boom in wind energy generation.7
northern states to the population and industrial
centres in the south.3 Today, Germany’s total Investment subsidies had several adverse
emissions are almost unchanged from 2010. consequences. The flood of renewable energy
into the market crashed wholesale electricity
How did this come about? prices, cut the credit ratings of Germany’s largest
energy utilities, and compromised the financial
In Germany, electricity investment is decided viability of competing, unsubsidised coal and
politically. State and federal governments, not gas generators. But without any way to store
8 SWITCHED ON!large quantities of energy, Germany needed its as well as the first large-scale coal generator, the
coal and gas generators to keep the lights on, 210MW Meremere station in Waikato, both
ready to step in whenever output from solar and arrived in 1958. Natural gas was discovered in
wind dropped. So in 2016, Germany introduced Taranaki in 1959, leading to the first large-scale
legislation to prevent closing coal and gas plants, gas-fired station in New Plymouth in 1974.
and introduced subsidies to keep their financial Biomass and modern wind generators first
heads above water.8 appeared in New Zealand in the early 1990s.
By 2016, Germany’s households and businesses Through the early 20th century to the
had paid renewables companies €176 billion mid-1980s, electricity was entirely publicly
for electricity worth €5 billion.9 Even so, an owned and under the direct control of elected
early exit from Energiewende is impossible. governments. Beginning in 1903, legislation
Livelihoods now depend on the generous reserved all hydrogeneration to the Crown. By
subsidies continuing. Political movements in the 1970s, Ministers were using their control of
Germany’s regions, and a powerful solar lobby, the electricity sector to pursue various political
have emerged to block attempts at reform. objectives such as employment generation – goals
unconnected to supplying electricity at least cost.
Energiewende’s defenders note the valuable Consumers were paying prices far below cost.
learning and technology the policy has generated, High-cost projects were selected over cheaper
while the German public continue to support alternatives. Projects frequently ran late and over
renewable generation.10 Notwithstanding, budget. Marsden B, a major power station, was
Energiewende is a policy disaster with built at a cost of nearly $1 billion in today’s dollars
far-reaching lessons for the New Zealand but never used. In early 1984, Treasury estimated
government as it considers various options for the economic costs of this mismanagement of the
achieving its emissions targets. electricity sector at $3 billion in 1983 dollars, an
astronomical sum at a time when national income
totalled $35 billion.12,13
1.2 Electricity in New Zealand
The reforms that followed put operational
Electricity in New Zealand interestingly had decisions out of the reach of politics, and
started with renewable energy.11 The first plant gradually adjusted prices to reflect costs.
was most likely a hydroelectric plant built in Decision-making shifted from a government
1885 in Bullendale, Otago, to power a mine department, an entity that ministers are legally
stamp, a machine used for crushing rock and entitled to direct, to a new kind of entity, the
coal. In 1888, Reefton became the first town state-owned enterprise which ministers had only
in the Southern Hemisphere to distribute limited powers to direct. Managers of SOEs have
hydroelectricity using permanent lines from a a statutory obligation to operate on a commercial
station on the nearby Inangahua River. basis. Electricity sector regulators, who were
to emerge later, would eventually operate at
The nation’s first large-scale station, a 10MW arm’s length from the government under a
hydrogenerator, was built on the Waikato River consumer welfare objective. Households faced
near Cambridge in 1913. This station was later higher electricity prices over time as subsidies
submerged in 1947 by the construction of the were unwound.
larger Karapiro station and its reservoir, Lake
Karapiro. New Zealand’s first geothermal The majority of the reforms took place between
generator, a 161MW station north of Lake Taupo, 1986 and 1996, reorganising the sector largely into
THE NEW ZEALAND INITIATIVE 9Figure 1: Electricity sources in New Zealand
30
60%
TWh
15
17% 14%
5% 3% 0.6% 0.6% 0.2%
0
o
al
s
d
al
d
as
lar
Ga
dr
in
oo
rm
Co
og
So
W
Hy
W
he
Bi
ot
Ge
45TWh 100%
80%
30TWh
60%
40%
15TWh
20%
0TWh 0%
98
13
18
93
73
78
83
88
03
08
20
20
19
19
19
19
20
19
19
20
Electricity produced (lh axis) % renewable (rh axis)
Geothermal
Hydro
Thermal
Wind
Transmission
HDVC interisland
Source: Transpower, “Maps and GIS data,” Website, https://www.transpower.co.nz/keeping-you-connected/maps-and-gis-data-0.
10 SWITCHED ON!the form we see today. Control of generation and The wholesale market was launched in 1996.
transmission was initially shifted to the state- By 2008, demand for electricity had increased
owned Electricity Corporation of New Zealand, by 20%. Since then, demand has been flat and
which would later be split into Transpower, to per capita consumption has fallen, mirroring
run the national grid, and four of the five major trends in other OECD countries. Growth in
generating companies operating today. Lines demand for electricity is widely expected to
companies mostly remained in local public resume in New Zealand with the anticipated
ownership. Regulation brought discipline to the electrification of transport and industrial
natural monopolies of lines and transmission. processes in the coming decades.
Generators and retailers competed for
their business. Generation in New Zealand is completely
unsubsidised, including renewables. Until the
The first major test of the reforms came in the 100% renewables policy was introduced in 2017
winter of 1992 when exceptionally low lake inflows by the Labour-led coalition (see section 1.3),
and unusually cold weather combined to produce the government has had virtually no direct
a major energy shortage. For the first time, it say in the mix of generation since 1988. The
was industry – not government – that took the government’s influence is exercised indirectly
initiative to coordinate the industry response, through overarching energy, competition
with support from the government. Blackouts, and environmental legislation that is mostly
New Zealand’s time-honoured response to technology-neutral. Electricity is a part of the
shortages, were avoided and have not been seen Emissions Trading Scheme (ETS), meaning
since, at least as the result of low lakes in dry years. generators face the cost of their emissions.
The reformed system had survived its first major Anybody, including homeowners, can invest in
test, driving the final nail in the coffin of central generating capacity and sell their electricity to
control of the New Zealand electricity system. buyers via the wholesale spot market or using
long-term contracts. With carbon priced, and
The reforms were substantially completed with without direct intervention by the government,
the launch of the wholesale electricity market competition between generators and between
in October 1996. After this date, major changes generating technologies occurs on a level playing
have included the introduction of private field. Generating technologies find their own
participation in 1999 with the sale of Contact level within the system by competing on their
Energy, and a shift from self-regulation to full merits. This hands-off approach by government
regulation from about 2000. The sector remains in New Zealand may be unique among OECD
in majority public ownership. member countries.
Today, 69 generators operated by 12 companies The results are impressive:
supply electricity to a national grid with 12,000
kilometres of lines running the length of the • Around 83% of New Zealand’s electricity
country. Five generators – Meridian, Contact, is generated from renewables, far higher
Mercury, Genesis and Trustpower – generate than almost all other OECD countries14
around 94% of electricity. Twenty-seven local • Consumers pay the 12th lowest electricity
lines companies take electricity from the national prices among 33 OECD countries (Figure
grid and distribute it to 2.1 million households 2), industry the 7th lowest15
and businesses. Each week, the average residential • Electricity sector emissions as a share of
consumer uses 134 kilowatt-hours and pays $38 for New Zealand’s total emissions are low by
electricity, about 27 cents per kilowatt-hour. international standards16
THE NEW ZEALAND INITIATIVE 11• One-fifth of all households and businesses other things, advising on the delivery of
change their electricity retailer each year,17 the 100% renewables policy. The advice is
the highest annual switching rate in the expected in April.
world, and18
• Security of supply is comparable to that in The policy’s “hydrological year” exemption
other developed countries.19 is significant. About 60% of New Zealand’s
electricity is produced by hydroelectric generation.
Renewables are generally expected to exceed But inflows fluctuate, falling by as much as
a 90% share of generation in the next decade, 20% below long-term averages in a year.23 The
and may reach 95% share by 2035 without any exemption leaves room for thermal generation –
intervention by the government. Renewables coal, gas and diesel – to continue to provide cover
clearly work in New Zealand. for energy shortfalls in dry years. But in normal
hydrological years, the policy amounts to a ban on
the use of thermal generation.24
1.3 The 100% renewable generation policy
The 100% renewables policy is in fact about
In October 2017, the Labour-led coalition that last 5% from a 95% share to 100%. For this
government announced a policy to achieve small fraction of the demand for electricity,
100% renewable generation20 “in a normal there is no feasible combination of hydro, solar,
hydrological year” by 2035, the latest in a number wind and geothermal generation that can meet
of renewables policies for New Zealand since demand at anything like a competitive cost. To
1993.21 An Interim Climate Change Committee, understand what makes renewables so costly
announced in April 2018, is preparing advice for the last 5%, and why policies like 100%
for a permanent Climate Change Commission, renewables threaten an electricity system that is
which is expected to be established in late 2019.22 working so well, we must first understand how
The interim committee is tasked with, among electricity systems work.
Figure 2: Residential electricity prices in OECD countries
Tax Electricity
500
400
$US/MWh
300
200
100
0
Australia
Poland
Mexico
United States
Latvia
Portugal
Slovak Republic
Turkey
Slovenia
Germany
Spain
Italy
Belgium
Denmark
Czech Republic
Chile
Greece
Hungary
Ireland
Japan
United Kingdom
Estonia
France
New Zealand
Finland
Switzerland
Sweden
Korea
Canada
Norway
Netherlands
Austria
Luxembourg
Source: Miriam R. Dean, et al. “Electricity Price Review Hikohiko Te Uira, First report for discussion” (Wellington: New Zealand
Government, 2018), Figure 9, 23.
12 SWITCHED ON!Chapter 2
Economics of electricity and renewables
Whenever you switch on a light or a television, While electricity production over the year
you add somewhere between 7 and 140 watts averages about 5,000MW, demand can vary by as
to the national demand for electricity.25 At that much as 60% of this average within a day (Figure
same moment, the energy you consume must be 3) and by as much as 80% of this average over the
generated somewhere in the country. year (Figure 4).
If the demand for electricity were constant every The peaks and troughs of electricity demand help
day, electricity supply might be relatively simple. determine the design of the system. Peak demand
A matter of building just enough generation to determines the smallest total generating capacity
meet demand, plus some in reserve to deal with a system needs. Minimum demand defines
outages, transmission losses, and variations in baseload, the smallest amount of generating
output from generators. But the demand for capacity that will be needed at every moment
electricity is peaky. in a year.26
Figure 3: New Zealand electricity demand (26 June 2018)
8,000MW
PEAKING
7,000MW
6,000MW
5,000MW
4,000MW
3,000MW
BASELOAD
2,000MW
1,000MW
0MW
00:00 06:00 12:00 18:00
Source: Electricity Authority, “Generation output by plant,” Website, https://www.emi.ea.govt.nz/Wholesale/Datasets/Generation/
Generation_MD.
THE NEW ZEALAND INITIATIVE 13Figure 4: Demand for electricity (1 October 2017 to 30 September 2018)
8,000 Maximum demand
6,992MW
26 June 5:30pm
Peak
7,000
6,000
5,000
Megawatts
4,000
3,000
Baseload
Minimum demand
2,979MW
2,000
31 March 3:30am
1,000
0
Oct 17 Nov 17 Jan 18 Mar 18 May 18 Jul 18 Sep 18
Source: Electricity Authority, “Generation output by plant,” Website, https://www.emi.ea.govt.nz/Wholesale/Datasets/Generation/
Generation_MD.
Electricity systems minimise overall costs by just 97 hours in the year to October 2018.27
building generators that specialise in meeting Peakers can also be pressed into action
either baseload or peaks: as cover for disruptions elsewhere in the
system, albeit at a high cost. Technologies
• Baseload generators are designed to specialising in peaking include open cycle
run for high proportions of every gas turbines and diesel generators.28
year, churning out gigawatt-hours of
electricity at a constant, optimised rate. In between peak and baseload generators sit
Baseload generators use economies of ‘mid-merit’ generators capable of fulfilling both
scale to squeeze as much electricity out roles. In New Zealand, hydro provides
of every tonne of fuel as possible. Coal, mid-merit capacity.
geothermal, combined cycle gas turbines
hydro, and (overseas) nuclear are baseload
specialists. 2.1 Capital costs matter
• Peaking generators, or ‘peakers’, specialise
in meeting infrequent peaks in electricity Specialisation by generators emerges from a
demand. Peakers may run for only a few fundamental trade-off between operating and
hours in a year. The Whirinaki diesel capital costs. Peakers are usually smaller than
plant in Hawke’s Bay, for example, ran for baseload generators, using less concrete, steel
14 SWITCHED ON!and other equipment per megawatt, forgoing is almost as costly as one that is producing
economies of scale. As a result, peakers burn electricity. Fixed costs make geothermal an
more fuel and produce more emissions per expensive peaker. If electricity from a geothermal
megawatt than baseload generators. But for a station costs $70/MWh at 100% capacity, it will
plant that runs for only a few hours each year, cost about $700/MWh running at 10% capacity
it is worth making this trade-off of higher as a peaker. By comparison, a gas peaker running
operating costs for the use of less capital. It is at 10% capacity might cost $250/MWh – higher
expensive letting capital collect dust. than baseload ($70/MWh) but far less than the
cost of pressing a baseload generator into action
Generators specialise depending on their cost as a peaker ($700/MWh).
characteristics. Consider geothermal, an excellent
technology for baseload but quite unsuited for Electricity systems minimise costs by taking
peaking. Geothermal stations have relatively advantage of the cost and output characteristics
high construction costs per megawatt, but of different generation types (Figure 5). If
once built geothermal energy arrives at little technologies are forced into roles they are not
additional cost.29 In economics jargon, its costs suited for, the overall cost of electricity can
are fixed. If a geothermal station runs at near dramatically increase.
100% capacity throughout its life, its lifetime
cost of energy – lifetime costs of construction, Capital costs matter, and ignoring them has
maintenance and operations divided by the consequences. New Zealand’s energy policy in
energy it produces – may be $70/MWh. But the 1970s, a time when electricity investment
geothermal’s low cost of energy once built cuts was politically determined, operated under the
both ways – a geothermal station sitting idle misguided view that “the use of self-replenishing
Figure 5: Levelised cost of electricity by generation type30
Capital Fixed operating Variable Transmission
200
180
160
140
120
Cost per MWh
100
80
60
40
20
0
o
al
s
d
lar
ar
s
al
Ga
as
dr
in
rm
Co
cle
So
om
W
Hy
he
Nu
Bi
ot
Ge
Source: US Energy Information Administration, “Levelized Cost and Levelized Avoided Cost of New Generation Resources in the
Annual Energy Outlook 2018,” Independent Statistics and Analysis (2018), 6.
THE NEW ZEALAND INITIATIVE 15hydro resources is preferable to the use of The cost of building and operating generating
consumable thermal resources, on the grounds assets is entirely funded by the sale of electricity
that lower operating costs are in some way from those assets.36 Investors build at their own
preferable to lower capital costs incurred at cost, and in competition with other generating
the time of construction…”31 A modern wind companies and other generating and storage
turbine can consume 185 tonnes of concrete and technologies. There are no generation subsidies.
44 tonnes of steel to build.32 These materials The wholesale market is technology-neutral, and
embed costs and environmental effects the same competition between generators and generation
way as fossil fuels, albeit in different proportions. technologies occurs on a level playing field.37
Governments and government policies can Standards strictly regulate the electricity supplied
be curiously reluctant to recognise costs and to the national grid, but not the technology used
environmental consequences. The financial and to generate it. Electricity’s participation in the
environmental disaster in New Zealand that ETS means generators bear the costs of their
was Think Big embedded an implicit view that emissions, including from geothermal energy.
capital comes free.33 Financial and environmental
outcomes are likely to improve only when Trade between buyers and sellers of electricity
decision-making takes all costs into account: produces a wholesale price for electricity. The
fuel, operations, emissions and capital. It is not wholesale price reflects the intersection of the
as if renewable energy requires capital costs be nationwide demand and supply of electricity,
ignored to look affordable – renewable energy is uninterrupted by subsidies or any special
affordable when all costs are considered. treatment for favoured technologies. As such, it
approximates a real-time measure of the social
value of electricity – a useful property for a
2.2 How supply meets demand in a price that serves as the organising principle for
wholesale electricity market investment and operations across the system. The
wholesale price:
A price is a signal wrapped up in an incentive.
—Alex Tabarrok, George Mason University • measures scarcity: when supply falls
or demand spikes, the wholesale price
Electricity systems divide neatly into four parts: reacts immediately. For example, when a
generation, transmission, distribution (local lines) faulty valve on an offshore platform was
and retail. The 100% renewables policy is mainly discovered in the Pohokura natural gas
concerned with generation. To understand how field in September 2018, gas generators
the policy could play out, we must first consider lost access. At the same time, lakes were
how generators are built. well below average for that time of the
year, and the world price for methanol
In New Zealand, generation works on a was high, increasing the competition
competitive model. Anybody can build a for limited gas supplies. Electricity was
generator34 and sell electricity. Owners of suddenly scarce, a fact reflected in the
generation trade their energy with buyers on the wholesale price (Figure 6). Coal and
electricity wholesale market in a process managed gas generators use the wholesale price
by Transpower, the System Operator, as well as an advance warning to increase their
as the owner of the national grid.35 Wholesale stockpiles of fuel ahead of dry winters.
market buyers are mainly large businesses or • represents the price paid to generators
electricity retailers contracting for energy on subject to contracting arrangements
behalf of their customers. (discussed below). For buyers, the
16 SWITCHED ON!wholesale price is a cost comprising about by a generating asset justifies the cost of resources
one-third of their electricity bill. sunk in its construction and operation. In
• signals demand for new investment in practice, generating companies build their
generation capacity. investments on paper long before they first break
• encourages energy conservation when ground. Companies build investment pipelines,
electricity is scarce. planning new assets, arranging funding, and
obtaining resource consent for their construction.
Around 85% of transactions on the wholesale This gives companies the right to build new
market occur via hedges, or long-term contracts. capacity at any time within the window of
Hedges are important for at least two reasons. the resource consent.39 A company must then
First, they shield households and businesses from decide when to trigger construction of the asset.
the short-run movements in the wholesale price, Investment will generally commence when the
giving certainty. Second, owners of generating company wishes to expand, and the hedge price
assets use hedges to share revenue risk with other for electricity from other generators is higher
parties. For example, the owner of a generating than the cost of building a new generating asset.
asset used only infrequently, such as a peaker that
sits idle for weeks at a time, can use a hedge to Thus the quality of investment directly depends
smooth revenue.38 on a wholesale price (reflected in the hedge price)
that conveys information about the value society
When is society’s interest served by investing in places on electricity. When the wholesale price
new generation? The answer is straightforward in reflects the social value of electricity, investors’
principle: when the value of electricity produced private interest in a return from their next
Figure 6: New Zealand daily wholesale electricity prices 2014–2019
$600
$500
$400
NZ$/MWh
$300
$200
$100
$0
Sep Oct Nov Dec Jan Feb
Average price 2014–18 2018/19
Source: Electricity Authority, “Wholesale energy prices,” Website, https://www.emi.ea.govt.nz/Wholesale/Reports/.
THE NEW ZEALAND INITIATIVE 17investment in generation coincides with society’s the jostle of competition as generators seek the
interest in the sinking of further resources into highest possible price for their energy, and as
the production of electricity. This is the power of they respond to disruptions, innovation and
good pricing. constantly changing conditions. Understanding
some of this interplay is necessary to understand
Because assets are funded from the sale of the challenge policymakers take on when they
electricity they generate, assets must be used once intervene.
they are built otherwise investors lose their shirts.
This is an important filter on investment – one Hydrogeneration is by far the most important
that can be lost when governments intervene. source of electricity in New Zealand with a 60%
share of production. Hydro fulfils several roles
that vary with the rise and fall of lakes. When
2.3 Generators cooperate when they lakes are full, hydro provides baseload and a high
compete proportion of ‘mid-merit’ demand each day (see
Figure 3). In dry years, however, hydro tends to
The previous section alluded to just how step back from baseload and concentrates more
complicated the investment decision is. A on peaking capacity, where electricity’s value is
generating asset could last 50 years. During highest. Gas and coal generation fill the energy
that time there will be any number of shocks to shortfall in dry years (Figure 7).40
demand, supply, innovations and government
policy, all of which must be considered by When lake levels are low, hydrogenerators have
investors who want a return and buyers looking to decide when to use their limited reserves of
at entering into a long-term contract. No less water. Generators want the highest price for their
complicated are decisions about how generating energy (the wholesale price is as important to
assets are used and the intricate coordination operational decisions as it is to investment); when
between generators and between different lakes are low, water used for generation today
technologies. These dynamics emerge from may be water that cannot be used next week.
Figure 7: Coal and gas backs hydro in dry years
28 13
27 12
Coal and gas total generation (TWh)
26 11
Hydro total generation (TWh)
25 10
24 9
23 8
22 7
21 6
20 5
2011 2018
Hydro Coal and gas
Source: Ministry of Business, Innovation and Employment (MBIE), “Electricity statistics – Data tables for electricity,” Website,
https://www.mbie.govt.nz/building-and-energy/energy-and-natural-resources/energy-statistics-and-modelling/energy-statistics/
electricity-statistics/.
18 SWITCHED ON!Figure 8: Available sun energy in Wellington on 2 November vs 3 November 2018
2 November 3 November
900
800
700
600
Sunlight (watts/m 2)
500
400
300
200
100
0
00 04 08 12 16 20 00
Hour
Source: Weather Underground, data from 12 stations in Wellington suburbs.
Each generator must work out the minimum by cloud) and the height of the sun above the
wholesale price it would take to generate today horizon.41 In contrast, energy from geothermal,
rather than wait, called a ‘shadow price’. The hydro (mostly), coal, gas, oil and nuclear is
higher the shadow price, the more inclined a dispatchable – or available on call.42
generator is to wait. When to use water, and
when to wait, is one example of the many Earlier in this chapter, we discussed how cost
complicated and subtle problems generators must differences between generation types lead to
constantly solve. specialisation in supplying either baseload or
peaks. Intermittency is another factor that
affects specialisation, relevant to understanding
2.4 Intermittency what roles solar and wind can productively fulfil
in an electricity system. Intermittency can be
We close this chapter by introducing the concept thought of as a cost, in the sense that part of the
of intermittency. Energy from solar and wind is problem of meeting the demand for electricity
intermittent. Their output depends on the local is having generation available at the moment it
weather (Figure 8 shows solar is strongly affected is needed.
THE NEW ZEALAND INITIATIVE 19Box 1: The UK electricity system
The UK has made renewables commitments that and regulators for ever more support. Every
will cost £100 billion over 20 years. Estimates major energy company and every major energy-
suggest electricity prices are 20% higher due consuming company has its own regulatory team.
to renewables policies. And despite the global Perhaps the most striking aspect of electricity
financial crisis rendering flat the demand for in the UK is the ‘quasi re-nationalisation’ of
electricity, the UK has seen capacity margins investment decisions that occurred in just seven
fall to “dangerously low” levels, threatening years, between 2010 and 2017. The introduction
security of supply.43 No blackouts have yet of government-backed capacity contracts in
occurred, though. 2013 means the government is responsible
Support for renewable generation in the UK for determining the quantity of generation
works through a combination of carbon pricing and investment. And in a pattern repeated in Germany,
top-down policy interventions, of which there are Australia and New Zealand under Think Big, the UK
dozens. Interventions include subsidies through government is using its increasing control to invest
the Renewables Obligation (2002) and the in the most expensive technologies first, and then
Small-Scale Feed-In Tariff (2010), and an exploring even more expensive options.
assortment of policies: the EU Third Energy Consumer electricity price rises have led to
Package (2011), carbon price floor (2013), demands for ever more intervention. In September
interconnection policy (2013), Contracts for 2018, UK regulator Ofgem announced electricity
Difference (2014), capacity market auctions (2014), price caps to “save consumers £1 billion,” roughly
and emissions performance standards (2015). equal to the combined profits of the major energy
An official review of the UK energy market companies in 2017. All this in an electricity system
in 2017 was scathing.44 The sheer number of that already has capacity pressures.
overlapping interventions makes it impossible to The 2017 review concluded that far more
understand the effects of policies. Complexity decarbonisation could have been achieved more
has led to ever more complexity. A lobbying quickly at much less cost with less intervention and
industry has emerged to press the government a more uniform price on carbon.
As economist Paul Joskow put it: wind availability at the moment of a peak and
will make sure there is sufficient dispatchable
Wholesale electricity prices reach extremely generation in reserve ready to step in should solar
high levels for a relatively small number of or wind output drop.46
hours each year and generating units that
are not able to supply electricity… at those But there are other parts of electricity supply
times are (or should be) at an economic that are less time sensitive. Here intermittency’s
disadvantage.45 costs are low. Intermittency’s costs are also
reduced by access to energy storage, which
Intermittency’s cost strongly depends on raises intermittent energy’s value by making it
circumstances. When timing matters, as it does dispatchable. As Chapter 3 shows, intermittency
when supplying peaks in electricity demand, has proved to be an Achilles’ heel for renewables
then intermittency is a major problem. System policies overseas. But it need not be that way.
Operators will take and use electricity from solar Understanding intermittency – when it is a
and wind to help meet peaks when it is available. serious problem and when it is not – is central to
But to keep the lights on reliably, the System making renewables work.
Operator will not generally count on solar and
20 SWITCHED ON!Chapter 3
Why renewables policies fail
Government has got into the business of “picking These principles are labelled ‘iron’ in this
winners”. Unfortunately, losers are good at report because they are strict constraints on
picking governments… The scale of the multiple renewables policies.
interventions in the electricity market is now so
great that few if any could even list them all, The first law is the most important. In practice,
and their interactions are poorly understood. no government will allow a coal or gas plant to
Complexity is itself a major cause of rising costs, close if that would jeopardise security of supply,
and tinkering with policies and regulations is and no government will hesitate to reinstate coal
unlikely to reduce costs. Indeed, each successive or gas generation to secure supply. Governments
intervention layers on new costs and unintended confronted with choosing between energy
consequences. It should be a central aim of security and emissions targets will not hesitate.
government to radically simplify the interventions,
and to get government back out of many of its The second iron law says at every moment of
current detailed roles. every day, available generating capacity must at
—Dieter Helm (2017)47 least equal electricity demand. Given the lights
must stay on, this sets an absolute minimum for
Overseas, renewables policies generally achieve the amount of dispatchable generation that must
four things: raise the share of renewable be available. Every megawatt of demand must
generation, increase the cost of electricity, be backed by an equal amount of dispatchable
reduce the security of supply, and hardly capacity.49 No amount of investment in
reduce emissions. In practice, policies pushing intermittent capacity can reduce this minimum
investment in solar and wind have struggled to requirement for dispatchable capacity – see the
fit the square peg of intermittency into the round first iron law.
hole of reliable and affordable electricity.
The third iron law says investment in clean
Three principles help explain why government generation benefits the environment only to the
support for renewable energy has so frequently extent that it reduces the use of coal, gas and
failed to deliver for the environment: diesel. This is the key idea of displacement, a
concept with profound consequences for how
Iron law #1: The lights must always stay on. a renewables policy is implemented – and the
central idea of this chapter. As we saw in
Iron law #2: Electricity must be generated Chapter 2, not all generation is equal. At a
in the moment it is consumed.48 minimum, displacement can only occur when
the lights stay on. So what are the circumstances
Iron law #3: Renewables reduce emissions in which investments in intermittent generation
only by displacing other generation. will actually lead to the exit of dispatchable
thermal generation? The environmental benefit
of renewable energy depends on the answer to
this question.
THE NEW ZEALAND INITIATIVE 213.1 When intermittent generation works keeps lake levels higher. Higher lake levels reduce
best emissions because coal and gas back hydro
(Figure 7). In effect, wind has displaced coal and
Efficient electricity systems solve the problem of gas generation with hydro as the middleman.
meeting the demand for electricity at least cost.
This means building just enough generation Hydro is an especially good fit for the role of
and storage capacity to keep the lights on backing intermittent generators: hydro is (mostly)
reliably, and protecting affordability by building dispatchable; it can operate at below 100%
no more.50 capacity without losing much efficiency, unlike
other generation types; and hydro also has a
As a result, electricity systems operate close high ‘ramping rate’ – it can reach 100% capacity
to one of two fundamental constraints. from a standing start in just 6 seconds, making
Most countries operate close to the ‘capacity for a timely entrance when energy from solar or
constraint’. At peaks in demand, these countries wind falls.51
have just enough generating capacity to burn
fuel, and convert wind, solar and water energy, at Hydro has one other characteristic that makes
a high-enough rate to keep up with demand. it a good fit for backing intermittent generation:
large-scale energy storage. New Zealand’s lakes
New Zealand operates close to a different are effectively huge batteries, holding a combined
constraint. We have more than enough total of up to 3,350GWh energy.52 Storage
generating capacity to meet peaks. Our reduces the cost of intermittency, or equivalently
constraint is total energy, known as a ‘firming increases the (gross) value of electricity from
constraint’. In our hydro-dominated system, dry intermittent generators, by allowing energy from
years can take out more than 3 terawatt-hours solar or wind to be available when needed, rather
of energy from the system, about 7% of all than whenever the sun shines or the wind blows.53
electricity produced in a year. This risks running
out of energy. If capacity-rich New Zealand is
a V8 Holden that runs low on petrol every few 3.2 Displacement breaks renewables
years, everyone else is a Vespa with a full tank. policies
It turns out New Zealand’s firming constraint Notice how in the wind-hydro partnership
is wind’s opportunity. Although energy from described in the previous section, wind’s
intermittent wind cannot be counted upon at any emissions benefits are not automatic – those
given moment – making it unsuitable for time- benefits occur mainly because in New Zealand
sensitive problems like reliably meeting peaks in coal and gas step in for hydro in dry years.
electricity demand – over time wind produces Winds emissions benefits might largely disappear
predictable quantities of energy that makes it if hydro were backed by another technology.
useful in a system that from time to time runs Renewable generation can only help the
low on energy. Here is how it works. environment if it reduces the use of thermal
generation, and there are many circumstances in
Wind energy is sent to the national grid which investment renewables leaves the need for
whenever it is available. Hydro is used to back thermal generation unchanged.
wind, stepping in to fill the gap whenever wind
energy falls. Together, wind and hydro produce I prefer using the term displacement pathway as
a smooth combined output of electricity. But shorthand to describe the sequence of steps by
more importantly, wind’s partnership with hydro which generation of one sort leads to the reduced
22 SWITCHED ON!use of another. The previous section discussed policymakers, the precise point at which
a two-step displacement pathway operating in constraints becomes binding and renewables
New Zealand: hydro backs wind, and coal and cease to have much or any effect shifts with the
gas back hydro. Gas can also directly back wind seasons, changes in demand, or the arrival of new
without hydro in the middle, which is the case in technologies; when renewables already produce a
parts of Australia. high proportion of electricity, renewables policies
risk displacing other renewables, rather than
But displacement pathways do not always exist, thermal generation; and it may only be years later
and even where they exist they can be broken. In that it becomes clear a renewables policy ceased
every electricity system there is a point at which to deliver any environmental benefits.
intermittent generation will cease to displace
other generation. Before that limit is reached, With so many unseen constraints and without
each unit of solar or wind will displace fewer and short-term feedback, policymakers take on an
fewer units of other generation. If renewables impossible task when they decide to use policy to
investment continues beyond the point it ceases direct investment in electricity systems. Policies
to displace other generation, the additional solar fail when they push investment far beyond the
panels and wind turbines will provide no further point at which displacement ceased. If policies
benefits, only costs. These limits exist because push investment hard enough and far enough,
different generating technologies are not perfect countries end up building and maintaining
substitutes for one another. two electricity systems. This is why renewables
policies overseas have done so much to increase
Consider some of the ways the wind-hydro-coal/ the cost of electricity but so little to reduce
gas pathway discussed above can break down: emissions.
• when capacity rather than firming is the Renewables policies can also compromise
constraint – capacity is time sensitive, security of supply. At high market shares, swings
making intermittent generation an in output from intermittent solar and wind
expensive solution become large enough to stress the transmission
• further investment in wind could lead grid, raising maintenance costs, and spending
to any or all of the following constraints on upgrades. In addition, investment in load
becoming binding:54 balancing – additional generation needed to
• lakes reach full capacity more often, step in at short notice to fill drops in solar and
during which times wind does not add wind output – becomes necessary. Together,
to the total energy in the system these are called ‘integration costs’, and at high
• hydro runs out of generating capacity market shares for solar or wind these costs can be
sufficient to back wind significant. A 2013 study of the electricity system
• use of hydro assets falls to the point in Germany found that at 25% and 40% market
hydro’s economics suffer share, solar and wind respectively would impose
• transmission capacity sets an upper integration costs large enough to nearly double
limit on how much wind can be the cost of energy from solar and wind.55
backed by hydro.
Another risk to energy security is the potential
There might be a dozen other ways the wind- compromising of the ability of System Operators
hydro partnership could break down. All of this to manage the frequency of alternating current
makes electricity a tough space for policymaking. in transmission lines. Nearly all countries have
To make things even more complicated for adopted a frequency standard of either 50 Hertz or
THE NEW ZEALAND INITIATIVE 2360 Hertz (New Zealand uses 50 Hertz). Frequency china shop. There are almost unlimited ways
is a function of the balance of energy added to the an intervention from the top into an electricity
grid by generators against the energy used up by system can bump into unseen financial or
consumers. When a generating plant trips offline, security of supply constraints, breaking the
for example, the grid frequency would fall because policy or the system, or both.
electricity demand exceeds supply. Frequency
keeping would require energy be added to the The problem is not that the bull turned left at
grid, or demand be reduced, to restore the balance aisle two when it should have turned right. The
between supply and demand. problem is the china shop has a bull in it. This
report is critical of neither renewables generation
System Operators use a range of technologies nor the government’s 100% renewables policy. It
and procedures to regulate grid frequency. One is critical of attempts by governments to direct
strategy for managing grid frequency is to use investment when policy is inherently unfit for
generators that produce electricity at a frequency that purpose given the nature of the emissions
precisely aligned with the grid – a property called problem. Policy has a crucial role in reducing
‘synchronous’. Thermal generators generally have emissions, but in a different capacity.
this property but other generating technologies
– including solar and wind (in most cases) – do
not. So this frequency control strategy depends 3.4 Explaining Germany
on synchronous generation holding a high-
enough share of overall generation at all times to It is hard to think of a messier and more wasteful
give System Operators sufficient control.56 way of shifting from fossil and nuclear fuel to
renewable energy than the one Germany has
All this may sound rather abstract, but there blundered into.
were real consequences on 28 September 2016 —The Economist (2012)57
when a momentary loss of frequency control
led to a state-wide blackout in South Australia Based on the lessons learned from the previous
(see Box 2). two chapters, we are now in a position to
understand the policy disaster unfolding
in Germany.
3.3 It’s the policy, not renewables
Germany’s generous solar and wind subsidies
Nothing in this chapter should be read as have almost certainly led to investment in
criticism of renewable energy. Every generating solar and wind generation continuing far past
technology has pros and cons. The problem is the point at which the displacement of other
not with renewables but with policies that drive generation ceased.
investment towards technologies past the point
at which those technologies add value, or into Germany has only limited access to storage
roles within a system they are not suited for. capacity, and without it the energy from solar
In an efficient electricity system, and indeed in and wind has lower value. A higher proportion
efficient emissions reduction, technologies must of energy from solar and wind is produced when
be allowed to find their own level. it is least needed, and there is no guarantee the
energy will be available during peaks when it
One of the goals of this chapter is to illustrate is needed most. To keep the lights on, most of
what a difficult place electricity is for Germany’s coal and gas generators have had
policymaking. Policy is the bull to electricity’s to remain in service. Solar and wind has not
24 SWITCHED ON!You can also read