Sector State of Play: Energy - Discussion Document - Infrastructure Commission
←
→
Page content transcription
If your browser does not render page correctly, please read the page content below
Sector State of Play:
Energy

Discussion Document
Foreword
Our wellbeing depends on our infrastructure
Our way of life depends on infrastructure. Whether it’s moving freight to keep the supermarket
shelves stocked, warming our homes, driving to work or calling our friends, there are few parts of our
lives that don’t rely on the services provided by infrastructure.

Infrastructure decisions have intergenerational impacts, so it is essential that we take a strategic
view of the planning, development and operation of infrastructure in Aotearoa. New
Zealand Infrastructure Commission was formed to give infrastructure this strategic voice, and the
significance of this task is reflected in our Māori name, Te Waihanga, which means cornerstone.

Our first task is to develop a 30-year strategy for infrastructure - this paper is a part of this work. It
takes a closer look at the current state of play in New Zealand’s energy sector. By understanding where
we are now we can set a course for where we want to go and the steps we’ll need to take to get there
over the next 30 years.

New Zealand faces a range of challenges and opportunities over the next 30 years which will have
significant implications for infrastructure. Our changing climate, rapidly growing cities, aging
population and evolving global technologies will change what we need from infrastructure in order to
maximise the wellbeing of New Zealanders. Each of us has our own experiences of infrastructure, so
we look forward to receiving your feedback to ensure this State of Play report accurately reflects the
current state.

Ross Copland

Chief Executive

                                                                                                       Page 2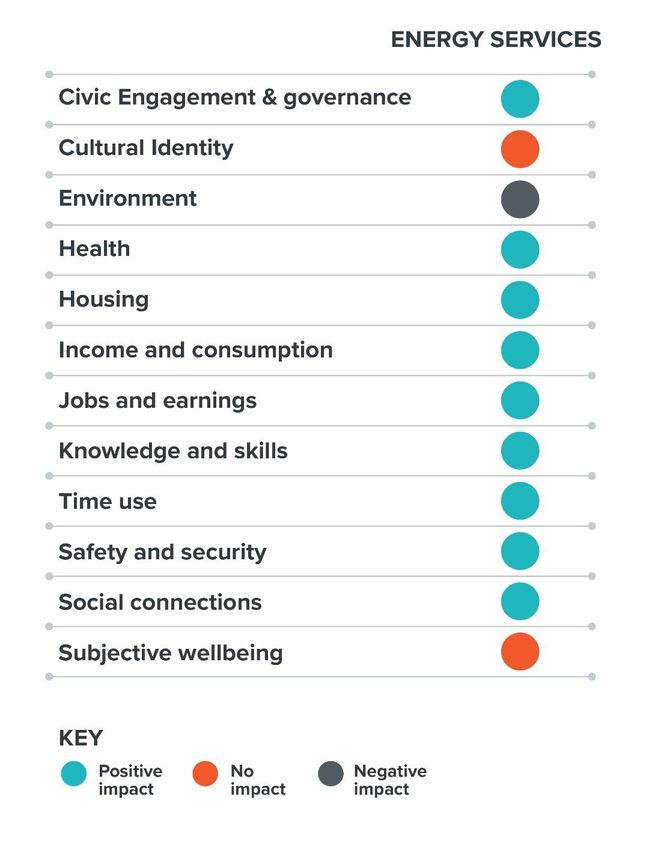
Kupu Takamua
E whakawhirinaki ana tō tātou oranga ki tā tātou hanganga
E whakawhirinaki ana tō tātou ao ki tā tātou hanganga. He ahakoa ko te neke utanga e kī tonu ai mgā
paenga hokomaha, ko te whakamahana rānei i ō tātou kāinga, ko te taraiwa rānei ki te mahi, ko te waea
atu rānei ki ō tātou hoa, he iti noa ngā wāhanga o tō tātou e kore rā e whakawhirinaki ki ngā ratonga e
whakaratongia ana e te hanganga.

Ka pāngia ngā uri whakaheke e ngā whakatau hanganga, nō reira, he mea whaitake kia rautaki tā tātou
aro atu ki ngā mahi whakamahere, mahi whakawhanake me ngā mahi whakahaere hanganga ki
Aotearoa. I whakatūria te NZIC e whai reo rautaki ai te hanganga, ā, e pūkana mai ana te hiranga o tēnei
i te ingoa Māori, Te Waihanga, arā te kāmaka mō te kokonga.

Ko te whakawhanake i tētahi rautaki 30-tau mō te hanganga te tūmahi tuatahi - he wāhanga nō tēnei
mahi tēnei pepa. Ka anga tēnei ki te āta titiro ki te āhua ōnāianei o te rāngai pūngao o Aotearoa. Mā te
mārama ki tō tātou tūranga ōnāianei e āhei ai i a tātou ki te aro atu ki whea tātou e pīrangi ana ki te tū,
me ngā hatepe e tika ana kia whāia e tae ai tātou ki reira hei roto i te 30 tau e tū ake nei.

Inā te maha o ngā taero me ngā āheinga kei mua tonu i a Aotearoa i roto i te 30 tau e tū nei. Katoa
katoa e whai hīraunga whakahirahira ana. Ka panonitia ngā mea e matea ana i te hanganga e tino kino
te pai ai te kounga o te oranga o ngā kirirarau o Aotearoa e te hurihanga o te āhuarangi, me te tere
whanake hoki o ngā tāone nunui, me te tētere haere o tō tātou taupori kaumātua me ngā hangarau ā-
ao e whanake nei, e whanake nei. Kei tēnā kei tēnā o tātou ōna ake wheako ki te hanganga, nā konā anō
mātou e hiamo nei ki te whiwhi i ā koutou whakahoki kōrero e whakaū ai e tautika ana tā tēnei pūrongo
State of Play whakamāori i te tūāhua ōnāianei.

Ross Copland

Tumu Whakarae

                                                                                                       Page 3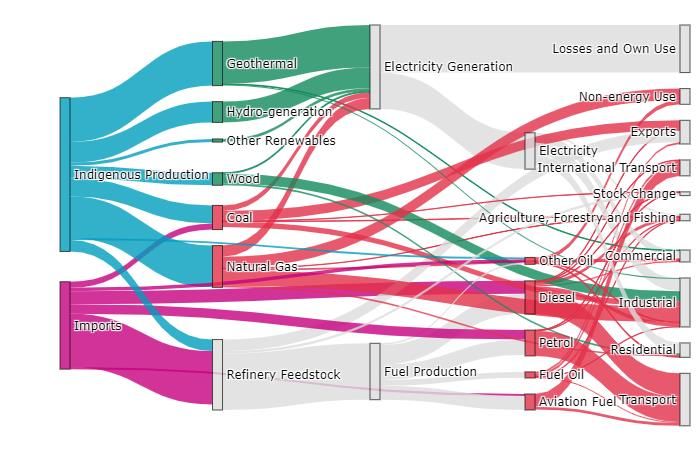
Table of Contents
1. Executive Summary .................................................................................................................................................. 8

Whakarāpopototanga .................................................................................................................................................... 8

     1.1. Current energy infrastructure ....................................................................................................................................... 8

     1.2. How is the sector performing? .................................................................................................................................... 9

     1.3. Looking to the future ................................................................................................................................................... 10

2. Context ...................................................................................................................................................................... 12

Horopaki.......................................................................................................................................................................... 12

     2.1. Who we are and what we do..................................................................................................................................... 12

     2.2. About our sector State of Plays ................................................................................................................................ 12

     2.3. Our next steps ................................................................................................................................................................. 13

     2.4. Have your say .................................................................................................................................................................. 14

3. About the system .................................................................................................................................................... 15

E pā ana ki te punaha ................................................................................................................................................... 15

     3.1. The services enabled by energy infrastructure .................................................................................................. 15

     3.2. Māori and energy........................................................................................................................................................... 16

     3.3. The importance of energy resilience ...................................................................................................................... 16

     3.4. The physical assets ........................................................................................................................................................ 16

     3.5. Wellbeing and capital flows ....................................................................................................................................... 18

4. What shapes the sector today? .......................................................................................................................... 20

E whakaahuatia ana te rāngai e te aha? ................................................................................................................. 20

     4.1. Energy is a fundamental building block for New Zealand’s economy and households.................... 20

     4.2. Mixed public-private ownership and regulation are important characteristics of the sector ......... 23

     4.3. Electricity regulation ..................................................................................................................................................... 28

     4.4. New Zealand’s oil and gas history .......................................................................................................................... 28

     4.5. Natural gas ....................................................................................................................................................................... 29

     4.6. LPG                .............................................................................................................................................................................. 31

     4.7. Oil                .............................................................................................................................................................................. 31

     4.8. Coal               .............................................................................................................................................................................. 32

     4.9. Wind               .............................................................................................................................................................................. 32

     4.10. Solar             .............................................................................................................................................................................. 32

     4.11. Geothermal ....................................................................................................................................................................... 33

     4.12. Biomass .............................................................................................................................................................................. 33

                                                                                                                                                                                                    Page 4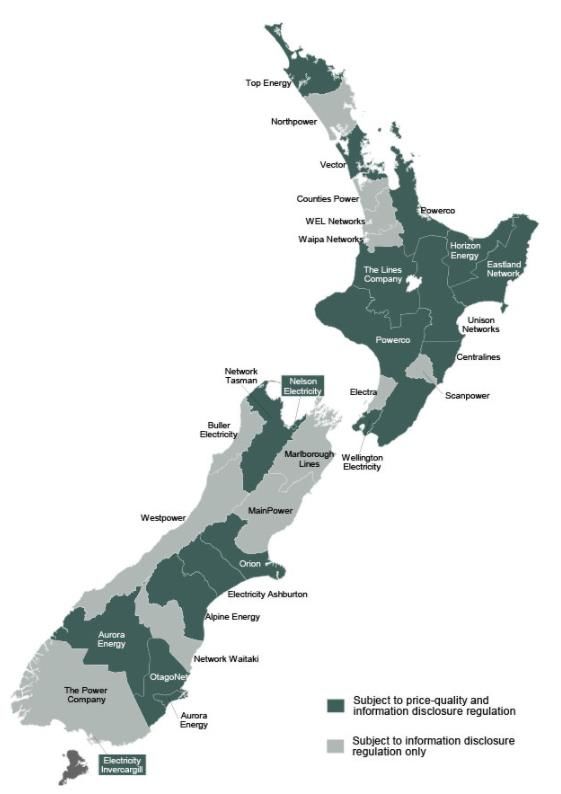
4.13. Distributed energy ......................................................................................................................................................... 34

     4.14. Hydrogen .......................................................................................................................................................................... 34

     4.15. A regulatory and policy environment more complex than other infrastructure sectors ................... 35

     4.16. Gas regulation ................................................................................................................................................................. 36

     4.17. Other regulation and taxation .................................................................................................................................. 36

     4.18. Predominantly a privately financed and user-pays sector ............................................................................ 38

     4.19. Congestion pricing of the electricity network .................................................................................................... 40

     4.20. User-pays of other fuels .............................................................................................................................................. 40

5. How is the sector performing? ........................................................................................................................... 42

E pēhea ana te rāngai?................................................................................................................................................ 42

     5.1. The overall state of the sector .................................................................................................................................. 42

     5.2. Electricity prices .............................................................................................................................................................. 45

     5.3. Power purchase agreements ..................................................................................................................................... 48

     5.4. Petroleum prices ............................................................................................................................................................ 49

     5.5. Systems and frameworks in place to ensure asset quality ............................................................................ 50

     5.6. A national infrastructure system largely dependent on energy resilience.............................................. 51

     5.7. Major asset risk ............................................................................................................................................................... 52

6. How is the sector responding to what might come next? .......................................................................... 54

Pēhea ai te rāngai e urupare ai ki ngā taero o anamata? .................................................................................. 54

     6.1. The sector is in a strong position today to deliver in the short-term ....................................................... 54

     6.2. Looking to the future ................................................................................................................................................... 55

     6.3. The future energy supply ............................................................................................................................................ 56

     6.4. Demand response and distributed energy resources ..................................................................................... 57

     6.5. Getting the policy settings right .............................................................................................................................. 57

     6.6. Major opportunities for decarbonisation ............................................................................................................. 58

7. Appendix one: Process, assumptions and limitations ................................................................................... 61

Āpitihanga Tuatahi: Te tukanga, ngā whakapae, me ngā herenga ................................................................. 61

     7.1. Our process ...................................................................................................................................................................... 61

     7.2. Limitations ........................................................................................................................................................................ 61

8. Conclusion ............................................................................................................................................................... 62

Whakatepenga.............................................................................................................................................................. 62

11. Appendix four: Quality of Electricity Distribution Assets ............................................................................ 72

Āpitihanga Tuawhā: Te kounga o ngā Rawa Whakarato Hiko ......................................................................... 72

                                                                                                                                                                                        Page 5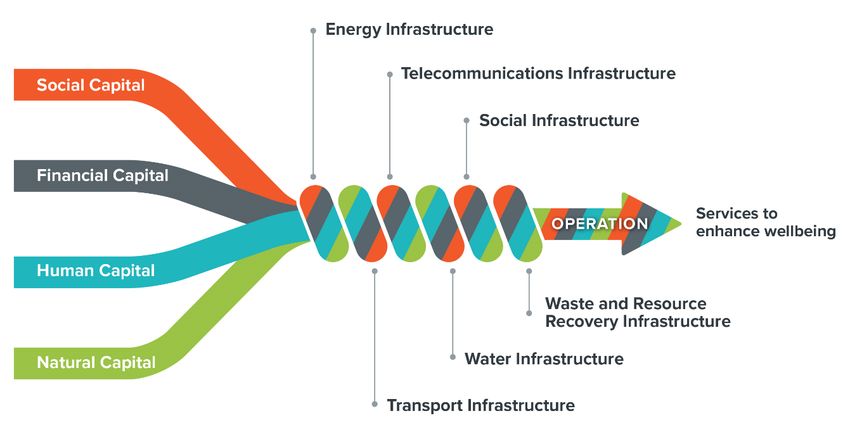
Figures
Figure 1: New Zealand's energy trilemma ............................................................................................................................... 9
Figure 2: Te Waihanga's definition of infrastructure ........................................................................................................ 13
Figure 3: Energy infrastructure and corresponding services ......................................................................................... 15
Figure 4: Impact of energy services on the 12-wellbeing domains ........................................................................... 18
Figure 5: Sankey diagram of New Zealand's energy flows ............................................................................................ 20
Figure 6: New Zealand's gross energy demand ................................................................................................................. 21
Figure 8: Breakdown of average electricity bill ................................................................................................................... 22
Figure 7: Breakdown of regular petrol price components ............................................................................................. 22
Figure 9: New Zealand’s gross energy supply .................................................................................................................... 22
Figure 10: EDBs by region and type of regulation ............................................................................................................ 27
Figure 11: Structure of gas value chain in New Zealand ................................................................................................ 30
Figure 12: New Zealand’s energy trilemma and score trends ...................................................................................... 43
Figure 13: Electricity prices by OECD country ..................................................................................................................... 44
Figure 14: Electricity forward price curves ............................................................................................................................ 46
Figure 15: Wholesale contract prices versus cost of building new power stations.............................................. 47
Figure 16: Quarterly premium unleaded petrol prices in OECD countries, January quarter 2020 ................. 49
Figure 17: Projected electricity demand growth to 2050 ............................................................................................... 56
Figure 18: Potential fuel by use type ...................................................................................................................................... 60

                                                                                                                                                                      Page 6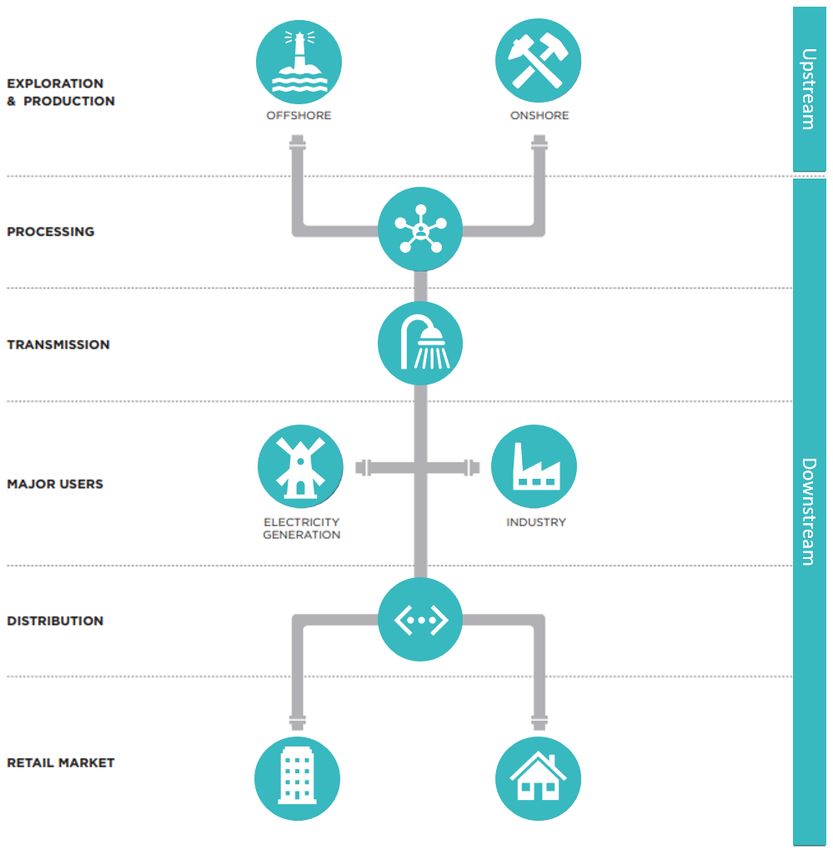
Tables
Table 1: Market share and ownership of five main gentailers ...................................................................................... 25

                                                                                                                                              Page 7
1. Executive Summary
Whakarāpopototanga
The New Zealand Infrastructure Commission, Te Waihanga has been charged with developing a 30-
year strategy for infrastructure. With your input, we will build our understanding of future trends and
likely challenges and make recommendations on how infrastructure can support New Zealand’s future
wellbeing.

This chapter provides a summary of New Zealand’s current energy infrastructure and collates views
from numerous reports about how well the sector is placed for meeting New Zealand’s longer-term
opportunities and challenges.

1.1. Current energy infrastructure
Energy infrastructure refers to the assets used to extract, produce and transport gas, electricity and
petroleum products to New Zealanders. It also includes the fuel stocks used to produce energy; oil, gas
and coal, as well as water, steam, wind, sun and biomass for producing electricity and biomass and
hydrogen for producing transport fuels and providing process heat to industry.

New Zealand has plentiful coal reserves1 but the transition to a decarbonised economy shifts the
emphasis to renewable fuel stocks that New Zealand is reasonably well-endowed with, such as wind,
solar, biomass, and geothermal resources.

The current energy infrastructure largely reflects substantial cost-efficiencies arising from extracting
large fuel stocks, large scale production, and then bulk transportation across the country to major load
centres. Electricity transmission stretches the whole country, configured with multiple lines and as an
interconnecting network of circuits to provide resilience. Similarly, gas pipelines connect load centres
to supply in the Taranaki region.

However, not everything is at large scale and remotely located. In electricity, for example, there are
many modest-scale generation plants located close to major load centres, and for many decades there
have been smaller scale plants located around the country, connected to local distribution networks
(called distributed generation). Technological advances in wind and solar generation, battery
technology and electric vehicles, are shifting the sector increasingly towards distributed generation
and energy storage.

The sector is predominantly characterised by large firms and mixed public-private ownership, although
this is changing due to technological advances. The sector is extensively regulated due to its use of
New Zealand’s natural resources as well as safety impacts.

Investments are predominantly privately financed and funded by energy consumers through their
purchases of delivered electricity, gas, and petroleum products. The combination of user-pays funding
mechanisms and marginal cost pricing encourages infrastructure providers to invest efficiently, taking
into account regulatory requirements regarding desired levels of quality and reliability of services. In
addition, wholesale spot markets for both gas and electricity encourage efficient short-term utilisation

1
 “Statistics of Coal.” Accessed December 2020. Ministry of Business, Innovation and Employment.
https://www.mbie.govt.nz/building-and-energy/energy-and-natural-resources/energy-statistics-and-modelling/energy-
statistics/coal-statistics/.

                                                                                                                    Page 8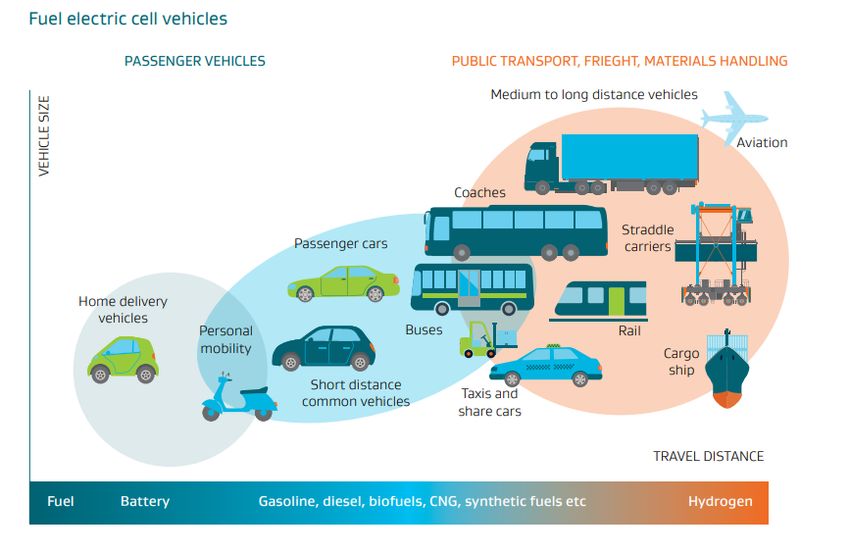
of infrastructure capacity and it encourages suppliers to invest in reserve generation and energy
storage. For example, when a part of the transmission grid becomes ‘congested’ the spot price of
electricity is generally higher in the downstream area, in contrast to transport where there is no
change in price when the roads are congested (excluding the time value experienced by road users).

1.2. How is the sector performing?
It is useful to consider sector performance on three dimensions, called the energy trilemma: energy
equity (prices and affordability), energy security, and environmental sustainability (see Figure 1
below).

Figure 1: New Zealand's energy trilemma                 In 2019, the World Energy Council ranked New
                                                         Zealand 10th out of 128 countries in the index. New
                                                         Zealand is the only Asian-Pacific country in the top
                                                         10, with Australia placing 28th. New Zealand has been
                                                         in the top 10 on the energy trilemma since 2000.
                                                         Whilst there is room for improvement, New
                                                         Zealand’s energy sector is globally seen to be
                                                         performing well. The International Energy Agency,
                                                         for example, has spoken highly of New Zealand’s
                                                         electricity market and the market-driven (non-
                                                         subsidised) rise in renewable generation.2

                                               The World Bank notes the average retail price of
                                               electricity in New Zealand is roughly ~US$0.12 per
                                               kWh placing us 11th cheapest in the 37 members of
Source: World Energy Council                   the OECD. This compares favourably with Australia
                                               where the retail price of electricity is more volatile
year-to-year and the price averages around ~US$0.20 per kWh.3 Similarly, a recent International
Energy Agency report showed New Zealand compared fairly well to other OECD countries in terms of
the retail price of petroleum.4

Notwithstanding, there have been several Government policy initiatives in mid to late 2020 to
strengthen the consumer voice in electricity regulation and reduce energy hardship, as well as
initiatives to further enhance competition in the electricity and petroleum markets (following reports
from the Electricity Price Review Panel on electricity and the Commerce Commission on the petroleum
market).

A high degree of resilience is built into the energy sector by drawing on multiple types and locations of
fuels, building multiple production units, and installing multiple transport modes and routes. There are
also many regulatory systems and frameworks in place to ensure the quality of energy sector
infrastructure assets, and to achieve desired levels of reliability and resilience.

The electricity sector, in particular, procures standby generation to cover the risks of the largest
system asset failing (either generation or transmission), and transmission and distribution assets are

2
  “World Energy Trilemma Index.” World Energy Council, 2020.
https://www.worldenergy.org/assets/downloads/World_Energy_Trilemma_Index_2020_-_REPORT.pdf
3
  “Doing Business.” The World Bank. Accessed August 2020.
https://databank.worldbank.org/reports.aspx?source=3001&series=IC.ELC.PRI.KH.DB1619.
4
  “Weekly Fuel Price Monitoring.” Accessed August 2020. Ministry of Business, Innovation and Employment.
https://www.mbie.govt.nz/building-and-energy/energy-and-natural-resources/energy-statistics-and-modelling/energy-
statistics/weekly-fuel-price-monitoring/.

                                                                                                                    Page 9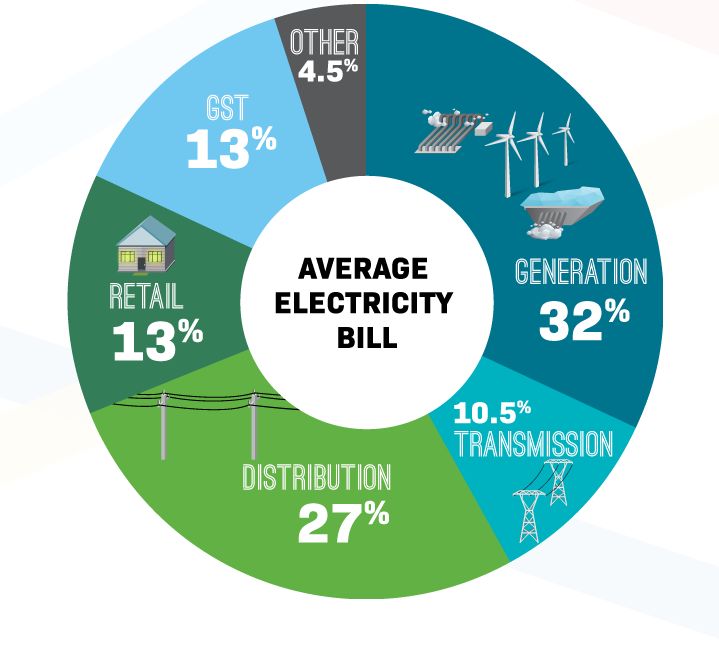
configured and operated to provide greater redundancy for larger demand centres. In part, this
reflects the dependency of other lifeline utilities on electricity.5

Key areas of focus are the condition of New Zealand’s gas and oil pipelines and the security of
electricity supply during prolonged dry winter episodes. Pipeline problems have occurred several times
over the last 10 years, driving significant regulatory effort to improve resilience. In contrast, electricity
security of supply has been robust over the last decade, with concerns centred on how the sector will
adjust if/when the coal-fired Huntly generation units are retired.

Overall, the energy sector is positioned well, with the main issues being equity (prices and
affordability) and security, particularly in the petroleum part of the sector. The single most pressing
issue is the critical reliance on Marsden Point’s fuel distribution system into Auckland, as highlighted
by recent failures of the Refinery to Auckland Pipeline (RAP).

1.3. Looking to the future
Looking longer term, the most significant force shaping the energy sector is climate change and New
Zealand’s commitment under the Paris Agreement to reduce greenhouse gas emissions by 30 percent
below 2005 levels by 2030 and the Change Response (Zero Carbon) Amendment Act 2019, to be net
carbon neutral by 2050.

To meet those commitments New Zealand’s energy consumption is expected to place far greater
reliance on electricity, which currently provides about 25% of the country’s energy needs. This is
expected to rise to 60% by 2050, due to mass electrification of transport and process heat for industry.
This amounts to growth in electricity demand of 1.7% per year for the next 30 years, compared to 0.2%
per year over the last 10 years and 1.3% per year over the last 30 years.6,7

Meeting this increase requires more than doubling current generation capacity by 2050, primarily from
wind, solar, and geothermal, and phasing out thermal generation. Energy storage capacity is expected
to increase greatly to cope with the variability of wind and solar generation.

In general, under current policy settings, regulatory and market incentives will broadly define what
energy infrastructure is built, when, and where it is installed, taking into account the speed and
location of population growth and industry changes. Provided appropriate carbon budgets and
effective emission pricing occurs, the electricity sector is expected to increase the share of generation
from renewable sources to 93-97% from current levels of 82-84% (in a normal hydrological year).8 It is
also expected to incentivise new gas-fired generation to cover capacity and dry year risks and replace
old thermal generation units at Taranaki and Huntly.9

Longer term policy and regulatory settings will need to be congruent with the Government’s climate
objectives and the pace of technological change. Along those lines, the Government’s goal of achieving
100% renewable electricity by 2030 needs to be considered in the context of dry year risk and pursued
in a way that preserves private sector incentives to build additional hydro-firming sources of energy.

5
   Including wastewater, gas, fuel supply, and traffic management
6
  “Data tables for electricity.” Ministry of Business, Innovation and Employment, table 2, row 42. Accessed December 2020,
https://www.mbie.govt.nz/building-and-energy/energy-and-natural-resources/energy-statistics-and-modelling/energy-
statistics/electricity-statistics/.
7
   “Data tables for electricity.” Ministry of Business, Innovation and Employment.
8
   “Accelerated electrification.” Interim Climate Change Committee, 30 April 2019, 97.
https://www.iccc.mfe.govt.nz/assets/PDF_Library/daed426432/FINAL-ICCC-Electricity-report.pdf
9
   Ibid, 38.

                                                                                                                        Page 10
Decarbonisation and the impending transition are resulting in a number of macro trends. Technology
and pricing improvements are expected in the next three to five years to make electrification of light
and medium road vehicles cost effective.10,11 Rapid advances in technology are improving the
prospects for cost-effectively decarbonising heavy transport and process heat by 2030. Although green
hydrogen has been gaining momentum in recent years, questions remain about its role in New
Zealand’s energy market; specifically around economic production, transport, and storage. These
trends highlight the importance of timing and ensuring the transition to a lower carbon economy is
balanced in regard to the energy trilemma.
Technology will also fundamentally alter what is needed from transmission and distribution
infrastructure. Distributed generation (such as rooftop solar generation), combined with battery
storage and effective demand-side management like smart-chargers for EVs, has the potential to
reduce the need to build additional infrastructure capacity to cope with peak demand. This is a
strength in relation to other infrastructure sectors where forms of congestion pricing are less or not
prevalent. Adopting transmission and distribution pricing that more closely reflects marginal costs will
be important for funding and incentivising efficient investment in these sources of energy and peak
demand management.
Ultimately, the sector is at the precipice of a major transition. It is critically important that the settings
are correct for the sector to transition in a desirable way and that the sector we are left with is well
positioned to deliver future needs – an optimal balance of the trilemma.
10
Dan Gearino. “Inside Clean Energy: How Soon Will An EV Cost the Same as a Gasoline Vehicle? Sooner Than You Think,” July
30, 2020. https://insideclimatenews.org/news/30072020/inside-clean-energy-electric-vehicle-agriculture-truck-costs/.
11
Steve Hanley. “UBS Predicts EV Price Parity In 2024,” October 22, 2020. https://cleantechnica.com/2020/10/22/ubs-predicts-
ev-price-parity-in-2024/.
Page 112. Context
Horopaki
2.1. Who we are and what we do
The New Zealand Infrastructure Commission, Te Waihanga is working to improve New Zealanders’ lives
through better infrastructure. It aims to lift the level at which infrastructure is planned and delivered,
taking a strategic approach so that we maximise the social return on our collective
dollar and stand well prepared in the face of an uncertain future.
Our Māori name, Te Waihanga, means a cornerstone, or to make, create, develop, build, construct,
generate. Te Waihanga therefore reflects the significance of long-term planning in shaping New
Zealand’s future.
A major part of this work is the development of a 30-year strategy for infrastructure. The strategy will
look ahead to 2050, and consider how infrastructure might support environmental, social, cultural and
economic wellbeing for all New Zealanders. This will be delivered to the government
in September 2021 and will set out how we can make sure our investment in infrastructure delivers
what we need, where we need it and at the right time.
2.2. About our sector State of Plays
We understand that our infrastructure works together - it is a system of systems. Our roads carry pipes
and powerlines, and they connect to homes, workplaces and schools. For this reason, our strategy will
focus on cross-cutting themes rather than infrastructure sectors in isolation. However, we believe that
it’s important we understand the infrastructure we have today, why we have what we have, and how
it’s already contributing to New Zealanders’ wellbeing.
The sector State of Plays are structured around the components of Te Waihanga’s working definition
of infrastructure, set out in our discussion document, “Infrastructure Under One Roof”.12 Our
definition places wellbeing outcomes at the core, while recognising commonalities, including the use
of capital such as financial and environmental resources; the interconnectedness of physical
structures; and the delivery of shared services, as well as the wellbeing benefits we get from those
shared services. In short, Te Waihanga defines infrastructure as follows:
“A system of inter-connected physical structures that employ capital to provide shared services to enhance
wellbeing.”
Figure 2 illustrates the components of our working definition, showing how they are related to one
another in delivering wellbeing services.
12
Te Waihanga. “Infrastructure under one roof”, December 2020
https://infracom.govt.nz/assets/Uploads/Te-Waihanga-Infrastructure-Under-One-Roof-2020.pdf
Page 12Figure 2: Te Waihanga's definition of infrastructure
By
Source: New Zealand Infrastructure Commission, Te Waihanga
defining infrastructure in this way, we have then been able to develop a common framework to think
about the integrated management of infrastructure. This considers the relationship between the
enabling environment for our infrastructure, the sustainable use of the capitals employed in its
development, the investment management process and the wellbeing benefits created by
infrastructure services.
Our sector State of Plays are the result of desktop research, augmented by insights from our survey of
infrastructure asset owners, and engagement with sector experts. These reports will be updated over
time. We want to improve the picture as our understanding grows and different elements come in to
focus.
2.3. Our next steps
As well as continuing to build on our picture of the State of Play, next steps include building our
understanding of future trends and likely challenges, including climate change, incorporation of
Mātauranga Māori, demographic change, and the role of technology. We will look at what our way of
life might be 30 years from now. Based on all of this, we will begin to make recommendations as to
how infrastructure might support New Zealand’s future wellbeing.
We’ll share our thinking on what will be included in the strategy, focusing on the cross-cutting themes
that affect all sectors, the opportunities and challenges we can expect in the future, as well as our
initial recommendations and options for consideration.
This will then be followed by a draft strategy that firms up our thinking on recommendations and
provides greater detail as well as the evidence base behind them. From there, we’ll develop the
document that goes to Ministers.
Page 132.4. Have your say
We’ll share our work as we go and are keen to hear what you think, starting now. Tell us what you
think about our State of Play reports – have we got it right or are there issues, information or problems
that we’ve missed?
You’ll also have the opportunity to comment on the draft strategy. We’ll be continually refining and
assessing our work based on the feedback we get from you and others.
Page 143. About the system
E pā ana ki te punaha
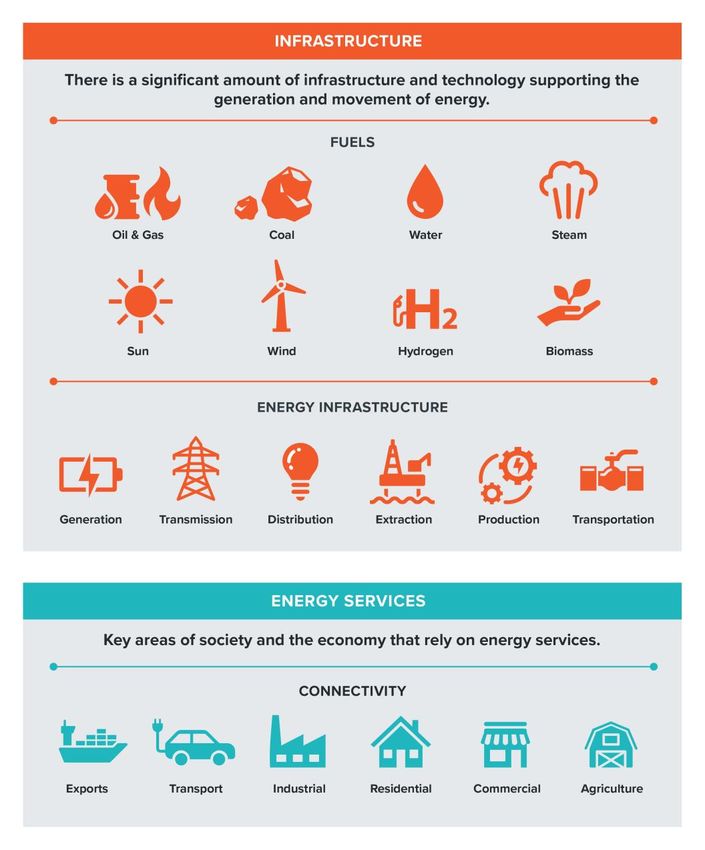
3.1. The services enabled by energy infrastructure
Energy infrastructure is the generation, extraction, transmission, and distribution assets for electricity
as well as assets that provide or support energy flows from fuels that consume capital and through a
market, provide energy to New Zealanders. The infrastructure, fuels, and corresponding services are
shown in Figure 3 below.
Figure 3: Energy infrastructure and corresponding services
Source: New Zealand Infrastructure Commission, Te Waihanga
Page 15The energy that powers New Zealand is broad and multifaceted, ranging from the movement of
electrons through conductive material to the combustion of hydrocarbons. Energy is not an end in
itself, but rather the means for providing services and catalysing activity.13 It is the oxygen of the
economy.14 It is essential in supporting New Zealand’s export, industrial, and transport sectors.
The value of energy to society extends further than economic spheres; it is an essential enabler across
almost every aspect of modern life and subsequently foundational to the wellbeing of New Zealanders.
Energy consumption is a key dimension of this; whether it’s keeping the lights on, powering other
essential infrastructure like hospitals and schools, or keeping our homes warm through winter, energy
is the foundation of a modern economy and society.
3.2. Māori and energy
Māori have fundamental interests in the energy sector due to the role of natural resources in their
culture, values, and worldview (Te Ao Māori). In particular, Māori knowledge (Mātauranga Māori) is
embedded in the relationship between people and natural resources, often connected with their
kinship (whanaungatanga). Their intergenerational view leads naturally to a strong focus on
sustainable business practices to ensure future generations enjoy the benefits of the natural resources
they are using today. This is often expressed as being guardians (kaitiaki) of the land and the resources
under and on it.
Māori are involved in energy production at both the resource and generation levels. They have
extensive interests in land, forestry, geothermal and hydro resources. For example, in the central
North Island the Tauhara North #2 Māori Trust is a joint venture partner with Mercury Energy in the
Ngatamariki geothermal field; Tuaropaki Power Company owns and operates the Mokai geothermal
generation plant; and Miraka Milk draws energy from the Mokai field for its dairy processing activity.
3.3. The importance of energy resilience
New Zealand’s infrastructure system is largely dependent on energy infrastructure.15 The National
Lifelines Council refers to the national grid (transmission assets), distribution assets, electricity
generation assets, and various elements of New Zealand’s oil and gas supply chain, as ‘critical
infrastructure’. The Council notes that most lifeline utilities to some degree depend on electricity and
although utilities typically have backup generation, a widespread outage would have broad impacts
across multiple infrastructure sectors. Combined with a national dependence on fuel for backup
electricity generation, and fuel for running plants and vehicles for service personnel, a major energy
interruption would have widespread impacts on the economic and social fabric of New Zealand.
3.4. The physical assets
The current physical infrastructure for energy largely reflects the location of New Zealand’s energy
resources relative to demand centres and the economic trade-offs facing investors at the time the
assets were designed and installed. Historically, substantial economies of scale (cost-efficiencies) arose
13
Kurt Yeager. “Energy and Economy.” In Global Energy Assessment - Toward a Sustainable Future, edited by Nora Lustig, 416.
Cambridge University Press, 2012.
14
“Energy for Economic Growth.” Geneva, Switzerland: World Economic Forum, 2. 2012.
http://www3.weforum.org/docs/WEF_EN_EnergyEconomicGrowth_IndustryAgenda_2012.pdf.
15
“New Zealand Critical Lifelines Infrastructure - National Vulnerability Assessment.” New Zealand Critical Lifelines, Civil
Defence 17-64, 2020. https://www.civildefence.govt.nz/assets/Uploads/lifelines/nzlc-nva-2020-full-report.pdf.
Page 16extracting from large resource fields, producing/generating at large scale, and bulk
transportation/transmission of energy across the country to large load centres.16
However, cost efficiency is not the only factor. A high degree of resilience is built into by drawing on
multiple fields, building multiple production/generation units and installing multiple transport modes
and routes. In electricity, for example, large generating stations contain multiple turbines and
transmission towers carry multiple cables, and notably the HVDC undersea cable across the Cook Strait
is actually three separate cables.
Where it has been cost-effective, the transmission system is an interconnected network of high
voltage power lines to provide different routes for power flows should one route fail. The level of
redundancy built into the system is greater for larger load centres. For example, power supplies to the
Auckland region are built and operated to withstand the two largest transmission assets and the
largest generation unit all failing at the same time. In contrast, power supplies to medium-sized cities
are built and operated to withstand only the failure of the largest transmission asset.17
There were severe electricity shortages in the winter of 1992, following which a Government inquiry
found the underlying problem was that all major generation decisions were made by a single supplier,
the Electricity Corporation of New Zealand (ECNZ). Although a fully coordinated electricity system
might deliver the best cost-efficiencies, this could lead to groupthink and poor resilience.
In addition, the resilience benefits of having multiple decision-makers of key resources, such as hydro
reservoirs, led to the devolution of New Zealand’s electricity generation fleet in the 1990s and the
formation of a wholesale electricity market in 1996.
The cost/resilience trade-off is also evident in the oil and gas sectors. New Zealand imports refined oil,
which is delivered to key ports around the country, and it also imports crude oil which it refines at
Marsden Point and distributes the output through three transport modes (by road tankers, coastal
shipping, and by pipeline to Auckland). Resilience is arguably improved with government held (or
contracted) oil reserves. However, this is not a perfect solution, as demonstrated by the recent failures
in the pipeline to Auckland, where in 2017 the pipeline that brings diesel, petrol, and jet fuel from
Marsden Point Oil Refinery into Auckland was ruptured, stopping transmission for 10-days.18
In regard to gas, commercial incentives for exploration have resulted in multiple onshore and offshore
fields however gas transmission is not diversified due to all operational gas being in the Taranaki area.
Moreover, technological advances are driving disaggregation. Examples include small scale electricity
generation, particularly in the form of solar rooftop units, energy storage and improved battery
technology, metering and micro sensors, all combined with advances in big data and artificial
intelligence to deliver individualised customer services. Although distributed generation (i.e.,
generation located within distribution networks) has been a significant feature in New Zealand for
several decades, these technological advances are likely to continue shifting the balance towards
disaggregation.
16
Personal correspondence, Carl Hansen, Capital Strategic Advisors Limited.
17
“New Zealand Critical Lifelines Infrastructure”. New Zealand Critical Lifelines, 18.
18
“Establishment of the Government Inquiry into the Auckland Fuel Supply Disruption.” Department of Internal Affairs.
Accessed December 16, 2020. https://www.dia.govt.nz/Auckland-Fuel-Line---Terms-of-Reference.
Page 173.5. Wellbeing and capital flows
Infrastructure services are an important contributor to wellbeing. New Zealanders make heavy use of
energy infrastructure every day, to participate in society and contribute to the economy. Energy
infrastructure provides the fuel and electricity New Zealanders use to live their lives; enjoying the
natural environment and sheltering from it, raising and educating their families, connecting with their
wider family/whanau and with others socially and culturally, undertaking their jobs and
communicating with their colleagues and customers.
As assessed by Te Waihanga, energy has a broadly positive impact across the 12-wellbeing domains
defined in the Living Standards Framework – shown in Figure 4 below. However, inherent in the
production of energy, it has the propensity to consume more natural capital than it produces. It is also
important to note that these benefits are not always felt equally across New Zealand.
Figure 4: Impact of energy services on the 12-wellbeing domains
Source: New Zealand Infrastructure Commission, Te Waihanga
Page 18Fundamentally, energy infrastructure lifts the productivity with which New Zealanders undertake all of
these activities, making it easier for them to improve their immediate wellbeing and provide for their
future wellbeing by building their stocks of social, human, and financial/physical capital. Indeed, there
is empirical research covering the United States and Europe, and more recently regarding some
developing countries, that suggests the supply of energy increases productivity growth rates, not just
productivity levels.19,20,21
Energy infrastructure also makes it easier and lower cost for New Zealanders to experience a wide
range of natural environments, both here and abroad. However, far more than other forms of
infrastructure, current energy production consumes a significant quantum of natural capital,
particularly oil, gas, and other minerals. Longer-term, unless technological change renders the natural
capital redundant, the scarcity value of the remaining natural capital increases as it is depleted. In
many (but not all) cases, the growing scarcity value encourages conservation for the enjoyment of
future generations.
For more information see:
19
Dale Jorgenson. “Productivity and US Economic Growth,” 1987.
https://scholar.harvard.edu/jorgenson/publications/productivity-and-us-economic-growth.
20
Luis R. Murillo-Zamorano, “The Role of Energy in Productivity Growth: A Controversial Issue?” Energy Journal 26, no. 2
(2005): 69–88.
21
Barnabé Walheer. “Labour Productivity Growth and Energy in Europe: A Production-Frontier Approach.” Energy 152 (June
2018): 129–43.
Page 194. What shapes the sector today?
E whakaahuatia ana te rāngai e te aha?
4.1. Energy is a fundamental building block for New Zealand’s economy
and households
Energy is an essential ingredient for modern societies and households. Its prominence permeates
almost every facet of the economy and household wellbeing.
Figure 5: Sankey diagram of New Zealand's energy flows
Source: MBIE
Figure 5 above is a Sankey diagram depicting the flow of energy in New Zealand starting from imported
or domestically produced energy to end consumption. The width of the arrows is proportional to the
energy flows i.e., the thicker the arrow, the greater the energy flow.
As shown, the majority of New Zealand’s energy is domestically produced. Primary sources are natural
gas, wood, coal, geothermal, and the gravitational potential energy of water. Minor but growing
sources of electrical energy include solar, wind, and co-generation from industrial processes.
On the demand side, each year New Zealander consumes roughly 600,000 petajoules of energy.22 This
domestic production powers most industrial, commercial, residential consumption of electricity.
22
“Energy in New Zealand 2019.” Ministry of Business, Innovation and Employment, October 2019, 4.
https://www.mbie.govt.nz/dmsdocument/7040-energy-in-new-zealand-2019.
Page 20Fuelling this demand, a significant amount of energy is imported predominantly in the form of oil. The
majority of this is then cracked into lighter fuels at Marsden Point and used to power transport; the
cars, trucks, and tractors we drive, as well as the planes that physically connect us to the world.
Depending on the year coal may also be imported to supply generation units at Huntly (Huntly has
three gas/coal Rankine units 250MW each, one combined-cycle 403MW unit, and one 50.8 MW open-
cycle gas/diesel unit).23,24,25,26
The demand for energy has grown over the last several decades – shown in Figure 6 below. The main
consumers of energy and significant drivers of expansion in energy demand have come from transport
and industrial uses. This highlights energy’s contribution in supporting New Zealand through relatively
stable economic and population growth in the decade following 2010.
Figure 6: New Zealand's gross energy demand
600
500
400
300
Grss petajoules
200
100
0
1990 1995 2000 2005 2010 2015
Transport Commerical Industrial Residential Agriculture, Forestry and Fishing
Source: MBIE
Broadly speaking, the infrastructure components combined with various taxes combine to form the
cost that New Zealanders pay for energy. For electricity, this is made up of generation, transmission,
and distribution, as well as retail and tax. This breakdown can be seen in Figure 7 below. For fuels, this
is made up of taxes, levies, and emissions trading scheme, as well as importer margin and costs. Figure
8 shows this breakdown of price components.
23
“Our Generation Assets.” Genesis Energy. Accessed December 17, 2020. https://www.genesisenergy.co.nz/assets.
24
Tracey Hickman. “Managing Huntly’s Coal Stockpile.” Genesis Energy, November 6, 2018.
https://www.genesisenergy.co.nz/about/media/news/managing-huntly%E2%80%99s-coal-stockpile.
25
“Genesis to Recertify Huntly Unit 2 for Backup Cover.” Genesis Energy. Accessed December 14, 2020.
https://www.genesisenergy.co.nz/about/media/news/genesis-to-recertify-huntly-unit-2.
26
Tracey Hickman. “Managing Huntly’s Coal Stockpile.”
Page 21Figure 7: Breakdown of average electricity bill Figure 8: Breakdown of regular petrol price components
Source: MBIE Source: Electricity Authority
There has been more volatility on the supply side, with geothermal growing significantly as a source of
energy in the last two-decades. This growth is shown in Figure 9 below. Overall, about 40% of New
Zealand’s primary energy was supplied by renewable resources in 2019,27 placing third highest in the
OECD. Within electricity, 82% was generated from renewable sources in 2019. This trend will likely
continue with initial signs pointing to a diminishing contribution of coal and oil, and a growing
contribution of geothermal and other renewable generation like wind and solar.
Figure 9: New Zealand’s gross energy supply
900
800
700
Gross petajoules
600
500
400
300
200
100
0
1990 1995 2000 2005 2010
Other Oil Hydro Geothermal Gas Coal
Source: MBIE
27
“Energy in New Zealand 2020.” Ministry of Business, Innovation and Employment, 2.
Page 22The demand-supply trajectories highlight the key issue the sector is facing: the transition from carbon-
based fuels to non-carbon resources for energy. How each side responds to this challenge and the
confluence of forces and market dynamics will be fundamental if New Zealand is to meet its carbon
neutral target by 2050.
4.2. Mixed public-private ownership and regulation are important
characteristics of the sector
The energy sector boasts a large number of agents with varying levels of influence and integration
across the value chain.
Dating back to the 1980s, electricity generation and transmission assets were the responsibility of the
Ministry of Energy.28 As a consequence, there was significant political influence in decision making
around long-term investment and energy prices, causing various issues across the sector. For example,
prior to the 1980s rolling blackouts occurred from time-to-time even though generation capacity often
greatly exceeded winter demand.
Similarly, in 1985 there were 61 electricity supply authorities providing distribution and retail services,
a consolidation from 93 in 1945.29 Most of the electricity supply authorities were governed directly by
elected boards or local authorities and again heavily influenced by politics leading to inefficiencies.
Government concerns about New Zealand’s overall economic performance led to various reforms of
many sectors of the economy from the mid-1980s, including the electricity sector.
The Electricity Corporation of New Zealand (ECNZ) was set up as a State-Owned Enterprise (SOE) in
1987 and operated the generation and transmission assets of the Ministry of Energy. In 1988, the
transmission assets were vested to a subsidiary, Transpower, leaving ECNZ as solely a generator. In the
early 1990s, many of the electricity supply authorities transitioned to ownership by local trusts or
companies.30
ECNZ provided around 97% of New Zealand’s electricity supply in 1990.31 Despite controlling almost all
generation, rolling blackouts occurred in winter 1992 due in part to poor decision-making by the single
supplier ECNZ. To remove reliance on a single decision-maker for hydro generation and to introduce
some competition as a means to put downward pressure on costs and prices, a wholesale electricity
market (with open entry to all sources of generation connected to the national network) was
established by October 1996 and some of ECNZ’s South Island hydro generation plants were placed in
an ECNZ subsidiary called Contact Energy. To further boost independent decision-making and
competitive generation, Contact Energy was sold in 1998 and ECNZ was split into three ECNZ
generation subsidiaries: Genesis, Meridian, and Mighty River Power (which changed its name to
Mercury in 2016). The other three major generators were partially privatised between 2013-2014, with
51% ownership retained by the Government.32
Although several generators competed to supply the wholesale electricity market, the demand side
remained dominated by the retail arms of the electricity supply authorities (some were trusts and
companies) and a few large industrial users. To facilitate fairer access for independent retailers and to
28
“Chronology of New Zealand Electricity Reform.” Ministry of Business, Innovation and Employment, August 2015, 1.
https://www.mbie.govt.nz/assets/2ba6419674/chronology-of-nz-electricity-reform.pdf.
29
“Chronology of New Zealand Electricity Reform.” Ministry of Business, Innovation and Employment, 4.
30
Ibid, 2.
31
“Competition, the Internet and the Customer”, Greg Sise, 28 May 2017
https://www.energylink.co.nz/news/blog/competition-internet-and-customer.
32
Ibid, 11.
Page 23remove the ability of line businesses to use their natural monopolies, the electricity supply authorities
were required in 1999 to divest either their monopoly distribution businesses or their competitive
retail and generation businesses. TrustPower (which had evolved from the Tauranga Electric Power
Board) decided to sell its distribution assets and retain its retail and small hydro generation assets.33
However, virtually all others chose to sell their retail businesses to various parties, including Contact
Energy and the three subsidiaries of ECNZ, leading to the formation of both the large generator-
retailers (often called gentailers) that persist in the market today and the suppliers of electricity
distribution services today (electricity distribution businesses or EDBs).
Of the major gentailers, Meridian Energy operates the two largest hydro generation stations
Manapouri and Benmore, Contact owns the Clutha hydro scheme, and Genesis owns the Tongariro
hydro scheme. As a result of the 2009 ministerial inquiry, Genesis acquired the Tekapo stations on the
Waitaki hydro scheme from Meridian Energy.
Contact and Genesis own the major thermal generation assets, Stratford and Huntly. Genesis has
announced its intention to replace baseload thermal generation with renewables and to remove the
remaining coal from its back-up thermal generation under normal hydrological conditions by 2025,
with an intent to remove it altogether by 2030.34 First Gas owns a large gas storage facility in Ahuroa35
and Genesis has a 46% ownership stake in the Kupe Gas joint venture, making it a major wholesaler of
gas. Genesis and Contact are both major retailers of gas, competing with eight other gas retailers.
Currently the sector is comprised of:
• Five major vertically integrated owners of generation and retailing assets,36 although noting
that there are numerous generation businesses operating in New Zealand and more than 40
different retail electricity businesses. More information is shown in Table 1 below.
33
“Company History - Company Development - Power Stations” Trust Power. Accessed December 18, 2020.
https://www.trustpower.co.nz/getting-to-know-us/our-history.
34
“Genesis Welcomes Government’s Dry Year Risk Review, but Urges Caution on What the Best Outcome Could,” Genesis
Energy. July 27, 2020. https://www.genesisenergy.co.nz/about/media/news/genesis-welcomes-governments-dry-year-risk-
review.
35
Mike Watson “Gas Company Squirrels down to Expand Storage Capacity for Peak Periods.” Stuff, October 7, 2020.
https://www.stuff.co.nz/taranaki-daily-news/news/300125261/gas-company-squirrels-down-to-expand-storage-capacity-for-
peak-periods.
36
Electricity Authority - EMI. “Market Share Snapshot.” Accessed August 2020.
https://www.emi.ea.govt.nz/Retail/Reports/R_MSS_C
Page 24You can also read