GLOBIO GLOBAL METHODOLOGY - FOR MAPPING HUMAN IMPACTS - Potsdam Institute for Climate Impact Research
←
→
Page content transcription
If your browser does not render page correctly, please read the page content below
Environment Information and Assessment Technical Report                                           3
                                                                                     UNEP/DEWA/TR.01-3

                                                             GLOBIO GLOBAL METHODOLOGY
                                                          FOR MAPPING HUMAN IMPACTS
                                                                       ON THE BIOSPHERE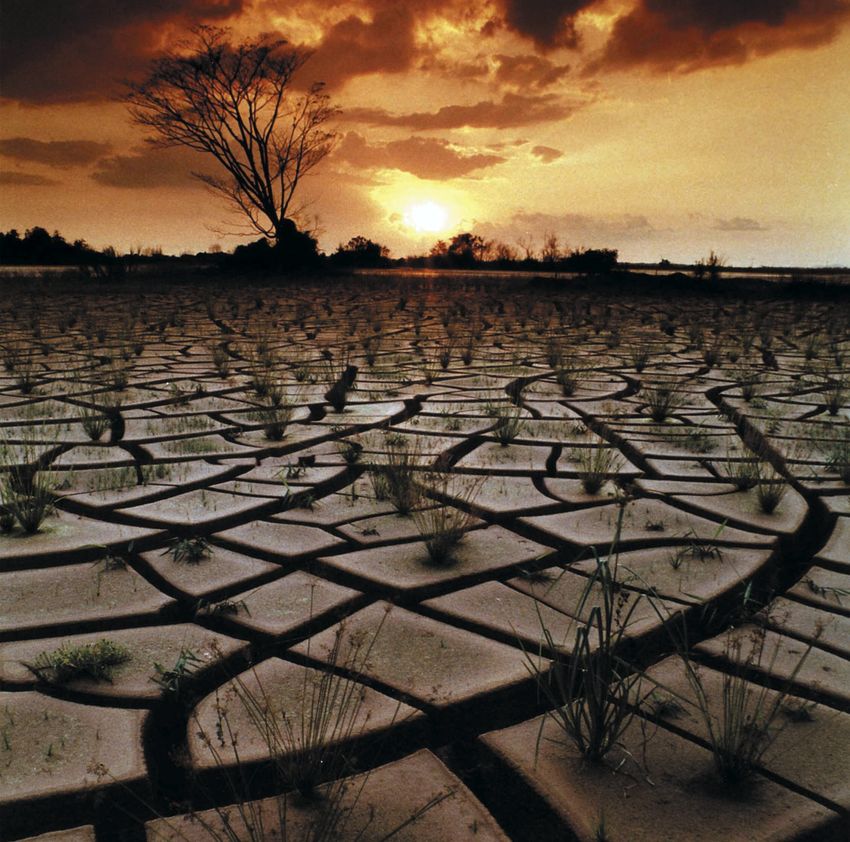
A word from the Executive Director

For thousands of years, humankind has relied and
depended upon the Earth’s resources to meet growing
demands for food, medicine, shelter and water. Our entire
existence and the diversity of cultures and economies has
been built upon goods and services from nature. However,
far too often, these activities have taken a heavy toll on
our environment.

Waste, desertification, pollution, deforestation, loss of      communication and foresight. We simply need to clearly
biodiversity and the degradation of land and fresh water       visualize and communicate the long-term impacts of the
are continually putting greater and greater strain on          growth in human resource use in a manner that is
sustainable economic, cultural and environmental               understandable. Not by predicting the future, but by
development. We are becoming increasingly aware that           scientifically documenting the likely future impacts of the
we not only rely on the environment for its many services,     choices that are being made today.
in fact, our health, economy and political world is largely
built on the Earth’s resources. What happens to the Earth,     The impacts of growing human resource demands are now
happens to humankind. So far, however, we have not had         seen in all parts of the world. Without foresight, the future
sufficient foresight to fully understand and communicate       is, at best, highly uncertain. GLOBIO is a pioneering
to the public, policymakers and state leaders the future       attempt from UNEP to help us all see the possible
impacts of the choices that are being made today. With         outcomes of what may happen to our globe with the policies
10-30 million different species and complex ecosystems         we make today. State leaders across the world have a
in existence, our knowledge of the environment is frag-        personal responsibility for the destiny of future generations.
mented into several thousand scientific journals, reflecting
millions of reports and papers, allowing policymakers to       The application of the GLOBIO principles at all levels and
make only best-guess solutions or to take no action.           in all regions on Earth makes it suitable for developing a
                                                               common platfor m for protocols and international
Our greatest challenge today is to plan better for our         agreements as they relate to humans and biodiversity. And,
common future. And one of our chief problems lies in           hence, help us form our common future.

                                                                      Klaus Topfer
                                                                      Executive Director, UNEP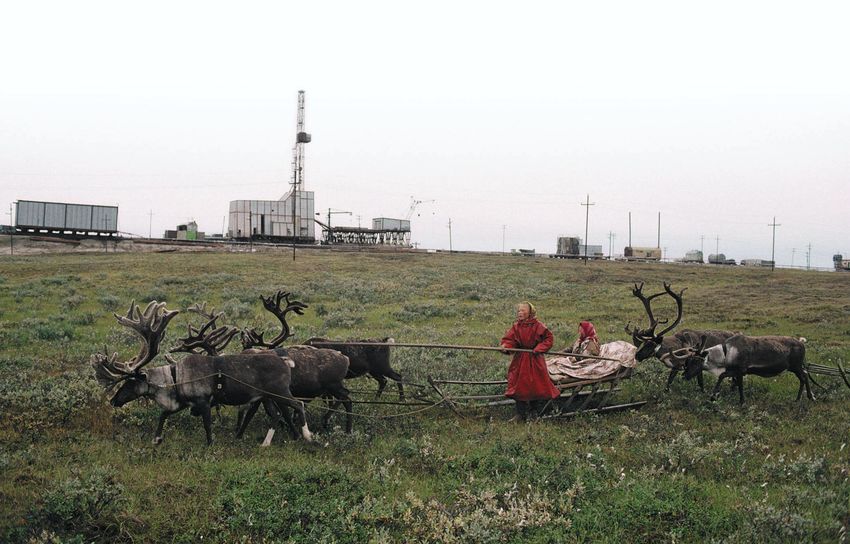
GLOBIO GLOBAL METHODOLOGY
FOR MAPPING HUMAN IMPACTS
  THE ARCTIC 2050 SCENARIO ON THE BIOSPHERE
                                     AND GLOBAL APPLICATION

                C. Nellemann           1,3
                L. Kullerud            2
                I. Vistnes             3
                B. C. Forbes           4
                E. Husby               2, 5
                G. P. Kofinas          6
                B. P. Kaltenborn       1
                J. Rouaud              2
                M. Magomedova          7
                R. Bobiwash            8
                C. Lambrechts          9
                P. J. Schei            10
                S. Tveitdal            2
                O. Grøn                11
                T. S. Larsen           12

1    Norwegian Institute of Nature Research (NINA), Pressesenteret, N-2624 Lillehammer, Norway
2    UNEP/GRID-Arendal, Longum Park, P.O. Box 1602 Myrene, N-4801 Arendal, Norway
3    Department of Biology and Nature Conservation, Agricultural University of Norway, P. O. Box 5014, N-1432 Ås, Norway
4    Arctic Centre, University of Lapland, P. O. Box 122 SF-96101 Rovaniemi, Finland.
5    Powel Gemini, Storetveitsveien 98, 5072 Bergen, Norway
6    Institute of Arctic Studies, Dartmouth College, 6214 Fairchild, Hanover, NH, 03755, USA
7    Institute of plant and Animal Ecology UD RAS, 8 Marta str., Ekaterinburg, 620144, Russia
8    Center for World Indigenous Studies (Canada), P.O. Box 19001, 360-A Bloor St. W. Toronto, ON CANADA M5S 1X1
9    UNEP, Division of Environmental Information, Assessment and Early Warning, United Nations Environment Programme, P.O. Box 30552, Nairobi, Kenya
10   Directorate of Nature Management, Tungasletta 2, 7005 Trondheim, Norway
11   Norwegian Institute for Cultural Heritage Research (NIKU), Box 736 Sentrum, N-0105 Oslo, Norway
12   Noragric, Centre for International Environment and Development Studies, Agricultural University of Norway, P. O. Box 5001, N-1432 Ås, Norway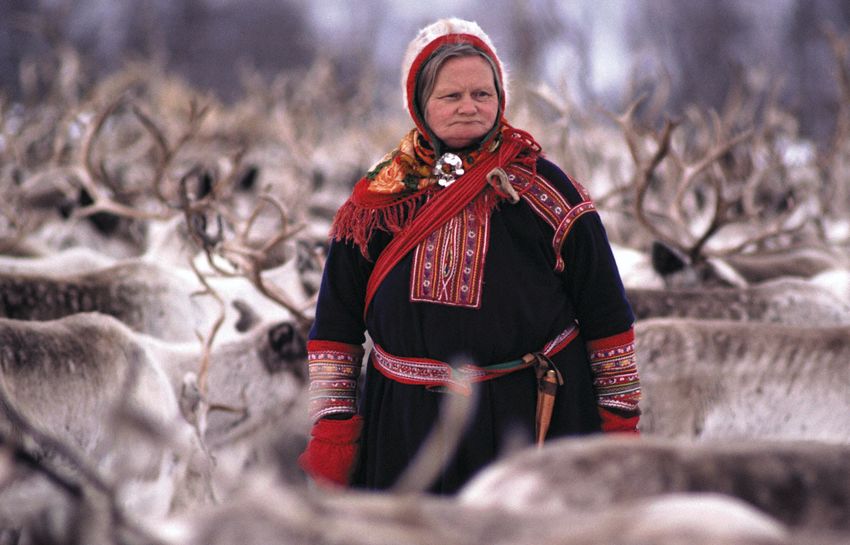
© 2001 United Nations Environment Programme
ISBN: 92-807-2051-1

This publication may be reproduced for educational or
non-profit purposes without special permission from the
copyright holders, provided acknowledgement of the
source is made. UNEP would appreciate receiving a copy
of any publication that uses this publication as a source.

No use of this publication may be made for resale or for
any other commercial purpose whatsoever without prior
permission in writing from the United Nations
Environment Programme.

For bibliographic and reference purposes this publication
should be referred to as:
UNEP (2001). C. Nellemann, L. Kullerud, I. Vistnes, B.
C. Forbes, E. Husby, G. P. Kofinas, B. P. Kaltenborn, J.
Rouaud, M. Magomedova, R. Bobiwash, C. Lambrechts,
P. J. Schei, S. Tveitdal, O. Grøn and T. S. Larsen.
GLOBIO. Global methodology for mapping human
impacts on the biosphere. UNEP/DEWA/TR.01-3.

UNEP-DEWA
Division of Early Warning and Assessment
P.O.Box 30552, Nairobi, Kenya
Tel: +254 2 62 32 31 / 62 40 28
Fax: +254 2 62 39 43
http://www.unep.org

Additional copies of this report are available at
http://www.earthprint.com

Cover photos by Bryan and Cherry Alexander (migrating
reindeer; Prudhoe Bay Oilfield) and by UNEP (logging
road in rain forest). All UNEP photos throughout
courtesy of Topham Picturepoint.

http://www.grida.no/prog/polar/globio/
GLOBIO GLOBAL METHODOLOGY
FOR MAPPING HUMAN IMPACTS
  THE ARCTIC 2050 SCENARIO ON THE BIOSPHERE
                            AND GLOBAL APPLICATION

CONTENTS

Preface by Walter V. Reid 1
Executive summary 2
1.0 Introduction 3
2.0 Goals 4
3.0 Background 4                        3.1 Infrastructure:    a leading cause to environmental disturbance 5
4.0 Methodology 9                       4.1 Synthesis    of impact zones from infrastructure 9
                                        4.2 Historic   growth in infrastructure 11
                                        4.3 Scenario    modeling 13
5.0 Results 13                          5.1 Overview    of the impacts 13
                                        5.2 Impacts    on biodiversity and ecosystem function 15
                                        5.3 Impacts    on indigenous cultures 15
                                        5.4 Impacts    on the Arctic 17
                                        5.5 Impacts    at a global scale 18
6.0 Benefits    and limitations 21      6.1 Supplement      to conventional approaches 21
                                           6.1.1 Traditional   wildlife biology approaches 21
                                           6.1.2 Traditional   landscape ecology approaches 21
                                        6.2 Data   availability 21
                                        6.3 Data   compatibility 22
                                        6.4 Sensitivity   of GLOBIO to input variables 23
                                        6.5 Scenario    modeling 24
7.0 Recommendations 24
8.0 Conclusions 24
9.0 References 26
10.0 Appendix 1 Examples of impacts of infrastructure 36
11.0 Appendix 2 Acknowledgements 43
12.0 Appendix 3 Reviews 44       12.1 W. Vergara, The World Bank 44

                                        12.2   B. N. K. Davis, Biological Conservation 45
                                        12.3   J. P. Hettelingh, University of Leiden 46
                                        12.4   A. Machado, European Centre for Nature Conservation 47

At the backside of the report, quotes from reviews are presented as a summary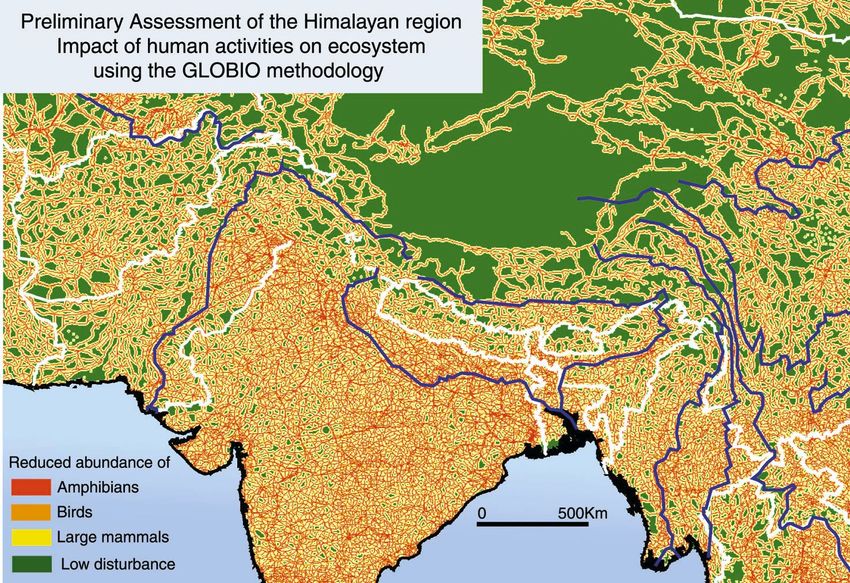
Preface                                                                                               1

For millennia, humans have altered the world's ecosystems to meet their growing demands for
food, fiber and water or to build cities, roads or other infrastructure. Many of these changes to
ecosystems have unquestionably benefited humanity - through for example vast increases in food
production - even if they transformed "natural" ecosystems. But with the benefit of hindsight we
can see that many were ill advised. Many dams have created more poverty than development, the
expansion of agriculture in some regions has increased the frequency of floods without substantial
gains in food production, everywhere we are losing "option values" as species go extinct, and in
some regions entire cultures have disappeared. Today, the sheer magnitude of the human impact
on Earth ecosystems, combined with growing human populations and consumption, means that
the challenge of meeting human demands for ecosystem goods and services is growing dramatically.
Everywhere countries are facing profound trade-offs: We can increase the amount of food produced
by ecosystems but only at a cost to the ability of those systems to meet our needs for clean water.
We can build more roads and expand or cities, but only at a cost to food production and the
protection of biodiversity.

Until now, our approach to managing ecosystems has been largely one of trial and error, with
hindsight our most powerful tool. We have sometimes learned from our mistakes, but our mistakes
have exacted a tremendous toll. It is time to arm policymakers and the public with foresight about
the potential consequences of choices we face. Advances in ecological sciences, combined with
improvements in monitoring and data gathering over the past decades now provide a sound scientific
basis for exploring the future consequences of policy choices we make today. But there have been
remarkably few attempts to actually apply science in this way. GLOBIO has taken up this challenge.

GLOBIO is a pioneering attempt to meet the needs of decision-makers and the public for
scientifically-based information about the consequences of their choices today for the future of
biodiversity, sustainable development, and local cultures.

Scenarios such as those used in the GLOBIO study are not predictions of the future. Instead, they
are tools that decision-makers can use to explore possible outcomes of choices they make today.
GLOBIO examines the potential consequences of different scenarios of infrastructure development
in the coming decades. Any scientist would be quick to note that infrastructure is only one of many
factors affecting ecosystems. But the elegance and strength of the GLOBIO approach lies precisely
in its focus on a simple and straightforward relationship between infrastructure and ecosystems.
Though the impacts of infrastructure development on ecosystems and local communities are
mediated through myriad causal routes, they are nevertheless profound and in the aggregate highly
predictable. GLOBIO gives us all a chance to explore where the road we are following will lead
us. And in doing so, it gives us a chance to explore the options of taking a different road. Or not
building a road at all.

      Dr. Walter V. Reid
      Director, Millennium Ecosystem Assessment.
2   Executive summary
    GLOBIO was initiated to provide an inexpensive, simple scientifically based communication tool
    for mapping, at large scale, the likelihood of human impacts on the biosphere resulting from
    increasing growth in resource utilization. GLOBIO is intended to bring scientific evidence on
    human impacts into a format suitable for policymaking.

    Conventional assessments of environmental impacts have usually been made through studies focused
    on specific ecosystems or species. Due to the complexity of the world’s ecosystems and the ecology
    of the Earth’s 10-30 million species, the conventional approach has led to the undertaking of a
    considerable number of case studies at various scales. Such a large number of studies render long-
    term planning and decision-making very difficult, as the latter would require the appraisal of all
    relevant studies at once in order to assess cumulative impacts. The different scales at which studies
    were undertaken compound this difficulty. Furthermore, most models require unrealistic amounts
    of input-data in order to be effective, and are not practical in national, industrial, or social planning
    procedures.

    To ensure the realization of the objectives of sustainable development, there is a critical need for
    tools that help assess the likelihood of environmental impacts of different developmental proposals.
    This is particularly relevant for infrastructure development, the central nervous system of our
    modern world. Towards addressing this need, this pilot report presents a methodology that relates
    probability of impact on biodiversity and ecosystems to distance to infrastructure, based on existing
    impact assessment studies. Infrastructure brings primary industrial development, but also secondary,
    more uncontrolled development in terms of increased human immigration and settlement, with
    increased risks of deforestation, overgrazing, desertification, social conflicts, and water and land
    degradation. The methodology is applied to the Arctic region. This Arctic pilot study is intended to
    be the forerunner of a global scenario report.

    In the last part of the 20th century, the Arctic has been increasingly exposed to industrial exploration
    and exploitation as well as tourism. The growth in oil, gas, and mineral extraction, transportation
    networks and non-indigenous settlements are increasingly affecting wildlife and the welfare of
    indigenous people across the Arctic. A considerable number of species of birds, mammals, and
    plants have already undergone a reduction in their populations or breeding success, or have been
    subjected to other types of impact in 15-20% of the land area of the Arctic. A 2050 scenario was
    made using reduced, stable, or increased rates of infrastructure growth as compared to the growth
    between 1940-1990. The scenario revealed that at even stable growth rates of industrial development,
    50-80% of the Arctic may reach critical levels of anthropogenic disturbance in 2050, rendering
    most of these areas incompatible with traditional lifestyles of many subsistence-based indigenous
    communities. As most of these impacts are related to the establishment of permanent infrastructure
    and the exploitation of non-renewable resources, the reversibility of the estimated changes in the
    near future is most unlikely.

    If similar patterns of human impacts apply at the global scale, the land area impacted significantly
    by human activities (such as reduced abundance of flora and fauna) may increase globally from
    15-20% to 50-90% within 50 years. This will most likely result in a substantial increase in
    environmental problems related to habitats, biodiversity, food production, water resources and
    health in 2050, thereby impacting both ecological, social and economic aspects of the global
    environment. The rapid growth of infrastructure with its associated secondary human impacts
    underlines the urgency for scenarios and appropriate methodological improvement to provide the
    necessary platform for holistic policymaking and international agreements.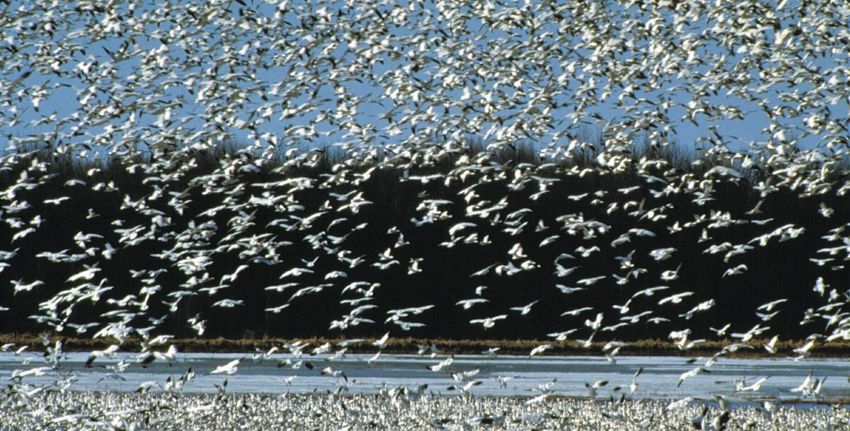
3
Photo B.P. Kaltenborn

                        More than 1 billion people rely on the well-functioning of the Himalayan ecosystem for their water resources outside of the
                        mountain range. Construction of roads into pristine areas often unintended results in deforestation, followed by erosion,
                        with subsequent impacts on water and drainages far down-stream. The fate of the remaining forests in the Himalayas
                        bears destiny for many people.

                        1.0 Introduction
                        There is a growing understanding and awareness that our basic resources, in particular food,
                        water, and land products, are largely dependant upon the well-functioning of our ecosystems.
                        Ecosystems also serve as important buffers to absorb pollution and mitigate the effects of global
                        changes. They also provide natural response to pests. The disruption of these ecosystems may
                        seriously threaten our health, food production, and economy.

                        Population growth and expanding human activities encroach increasingly on natural ecosystems
                        disturbing wildlife and disrupting essential environmental services. Considerable efforts are being
                        made in many countries to assess the impacts on ecosystems caused by human activities. Most
                        environmental impact assessments have, however, a narrow approach as they usually focus on
                        one individual activity and its impacts on one species or the local environment. As such, they fail
                        to fully assess the overall cumulative impacts of smaller, consecutive developments in a region 42.                           references page 26 - 35

                        In the area of long-range air pollution, international scenarios of likelihood of impacts at large
                        scales within a defined time span have been developed to help decision-making 163. However, no
                        methodology has been elaborated for scenario assessment of the cumulative impacts of human
                        activities on biodiversity and ecosystems at a large scale.

                        In order to help address this gap, the GLOBIO methodology was developed. This report presents
                        the main features of GLOBIO and the outcome of its application in the Arctic region.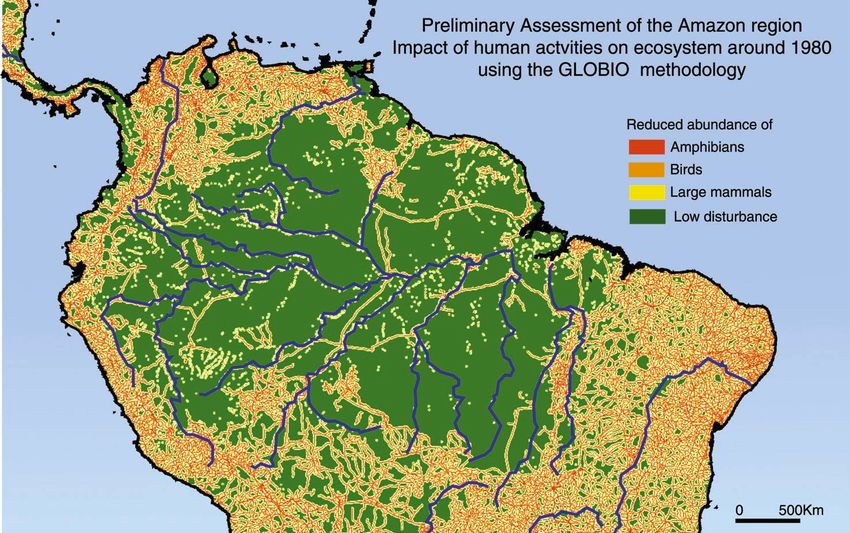
4

      Photo George V. Carbig, UNEP

    Roads are often built through forest for industrial purposes, such as mining/mineral exploration, oil and gas interests.
    Secondary, more uncontrolled development, result in deforestation, with subsequent erosion and loss in biodiversity.
    Sustainable development planning should therefore take into consideration the effects of the entire road network, not just
    the individual new segments that are continuously added on.

    2.0 Goals
    The purpose of GLOBIO is to develop a global methodology for mapping risk of human impacts
    on the biosphere. GLOBIO is intended to bring scientific evidence on human impacts into a format
    suitable for policymaking.

    The requirements set for the methodology are: a low-cost, quantitative, scientifically sound, logic
    and simple communication tool linking development to environmental impacts. The methodology
    should moreover be directly suitable for:

                                     • assessing ecological, cultural and socio-economic aspects of developmental activities
                                     • providing guidance for conservation
                                     • providing guidance for development planning with minimum impacts
                                     • analyzing impacts at various scales, including local, national, regional, and global scales
                                     • undertaking scenario assessments
                                     • assessing impacts with complex multiplicative effects such as fragmentation

    3.0 Background
    Natural resources exploitation and anthropogenic activities have expanded rapidly in the Arctic,
    particularly during the last decades of the past century. These activities include oil and gas
    exploration, mineral exploration, mining, marine fisheries, waste dumping, shipping, and tourism 35,
    41, 105. The Arctic is considered to hold large reserves of hydrocarbons and minerals 99. Today oil
and gas exploitation development is the keystone to many northern economies. Various plans are 5
underway to extend the infrastructure and development network to new regions, such as the Yamal
Peninsula of Russia, the National Petroleum Reserve and the Arctic National Wildlife Refuge of
Alaska, and the Barents Sea region 137, 140.
Tourism is another activity with major economic interests and a important market globally. It is
one of the fastest growing activities in the Arctic and is difficult to control 107. Many prospective
travellers perceive the Arctic as one of the last wilderness areas and among the least exploited
regions by tourism in the world. Pristine landscapes and wildlife are the major attractions in the
Arctic 79, 106, 205. As a highly mobile activity, tourism is likely to add to the impacts of the more
stationary industrial activities of the Arctic in the years to come.
So far, no large-scale mapping methodology has been presented relating industrial development
and tourism to probability of impact on biodiversity and ecosystem function. Such a large-scale
quantitative assessment could enable us to model and predict impacts more directly on some of the
most essential products, such as food, medicine, and services provided by ecosystems. This kind
of mapping would help define critical levels of disturbance, and would monitor and predict changes
in our global environment as a result of human activities.
The critical level concept for mapping purposes used in this pilot study has been adapted from the
one used in relation to emission control under the UN-ECE Convention on Long-range
Transboundary Air Pollution in Europe 163.
3.1 Infrastructure: a leading cause to environmental disturbance
Globally, there is increasing evidence that infrastructure, such as roads, transportation corridors,
airports, pipelines, power lines, utilities, and dams lead to substantial environmental impacts,
even with low levels of transportation traffic.
New infrastructure will accelerate other development activities due to the increased access afforded
by infrastructure 56, 67. Hence, the impacts associated with infrastructure may vary not only with
the climate and ecology of a region, but also largely with the social, political, and economic
situation in a country.
Roads and other infrastructure also impact wildlife by modifying animal behavior and species
distribution in areas with infrastructure 194. Wildlife is impacted directly by infrastructure through
collisions with vehicles (considerable even at population levels in some instances), substantial
noise, disruption of the physical environment, alteration of the chemical environment, and
introduction of exotic species 194.
Infrastructure, an important key to human development and economic growth, also brings many
environmental risks. The impacts vary with social and climatic conditions, but may be classified into
3 major phases:
1) The primary development phase, including impacts associated with primary industrial
development and associated potential pollution of water, air and land;
2) The secondary development phase, including secondary, more uncontrolled human immigration
and settlement with risks of deforestation, overgrazing and desertification, sometimes illegal
crops and hunting, social conflicts and water and land degradation;
3) The third development phase, including the regional cumulative impacts of the addition of
infrastructure to the already existing infrastructure network. This includes social, economic, and
environmental effects within the region, positive as well as negative.number of species with reduced abundance
160
6
I reduced survival and/or abundance 140
cumulative impacts on the species'
ecosystem 120
A
I insects 100
A amphibians
B 80
B birds
P large predators 60
P U ungulates
40
U 20
0
0 5 10 15 20 25 30 1 2 3 4 5 6 7 8 9
distance to infrastructure (km) distance to roads or infrastructure (km)
Figure 1a-b: Distances from roads and other infrastructure within which reduced survival or abundance
of wildlife has been observed, synthesized from >100 studies and a total of 151 species, mainly birds
and mammals.
Impacts can be expected on most fauna families. Examples include insects 82, 83, 117, 184, am-phibians
and reptiles 212, birds 11, 94, 160, 170, 171, 176, 178, 186, 212, small mammals 8, 12, 89, 98, caribou and reindeer
(Rangifer tarandus) 35-37, 88, 148-151, 210, 221, arctic fox (Alopex lagopus) 74, elk (Cervus canadensis)
43, 130, 180, wolves (Canis lupus) 72, 102, 142, 192, black bears and brown bears (Ursus americanus and
Ursus arctos) 23, 134, 141, mountain lions (Felis con-color) 204, bobcats (Lynx rufus) 129, elephants
(Loxodonta africana) 14-16, and primates 21, 179 (Figures 1-2).
Animals avoid areas near infrastructure, breed-ing success decreases in developed areas, and habitats
become fragmented 9, 66-69, 117, 194. The ecological impacts of losses of habitats and redistribution
of animals away from develop-ment may again affect foraging success or survival substantially in
areas beyond these initial zones of disturbance, and, hence, result in overgrazing, erosion, changes
in predation pressure and breeding success. Avoidance of developed areas therefore affects much
larger areas than that of the physically altered footprint of development.
The extents of the zones within where wildlife will become affected by infrastructure vary according
to species, season, type of disturbance, habitat, and other environment factors. The effect of
anthropogenic development is thus species specific; while specialist species seem to avoid developed
areas, generalists are more tolerant and may even benefit from human development 45, 80, 91. While
some studies have suggested that wildlife and industrial development are highly compatible 46, 47,
139, all in all, however, studies including both specialist and generalist species conclude that total
species diversity declines with increasing anthropogenic development (see appendix) 38, 56, 91, 117,
122, 186, 121.
Sensitivity is particularly high in the Arctic. Reindeer and caribou (Rangifer tarandus) are among
the most sensitive species in the Arctic to human activity, often reducing the use of grazing grounds
by 50-90% within 3-10 km of roads, power lines, or resorts (Figure 1) 49, 88, 148-151, 221.
Large Arctic carnivores abandon areas when road densities reach a certain level, typically around
0.5-0.6 km/km2 (Figure 2) 142, 144, 192, 203.
Birds may be highly sensitive not only to drainage of wetlands (Walker et al. 1987), but also to
noise from traffic 169-172. Reijnen et al. (1996) found reduction in populations of 14-44% up to
1500 m from roads for a series of bird species. The net result is serious impacts on ecosystem
function, even at considerable distances from infrastructure (Figure 1).breeding success/abundance (%)
100
The probability of impact on vegetation 7
90 caribou
80 wolf
also varies with type of disturbance involved.
70 bear The impact on vegetation and hydrology
60 elk of the tundra is relatively limited from
50 power lines and pipelines; generally related
40 to changes in snow distribution, ablation
30
patterns, and minor disturbances of soils
20
10 etc. within 500 m 13, 58-65, 120, 123, 137, 138.
0 From roads, the impacts on vegetation are
0,0 0,2 0,4 0,6 0,8 1,0 1,2 1,4 1,6 1,8 2,0
road density (km/km2)
considerably greater, at close ranges (8
Photo UNEP
Many bird species are migratory, and the damming of rivers for hydro-electric power and irrigation purposes results in the
draining of wetlands, with global impacts on migratory species. The pattern is recognized worldwide.
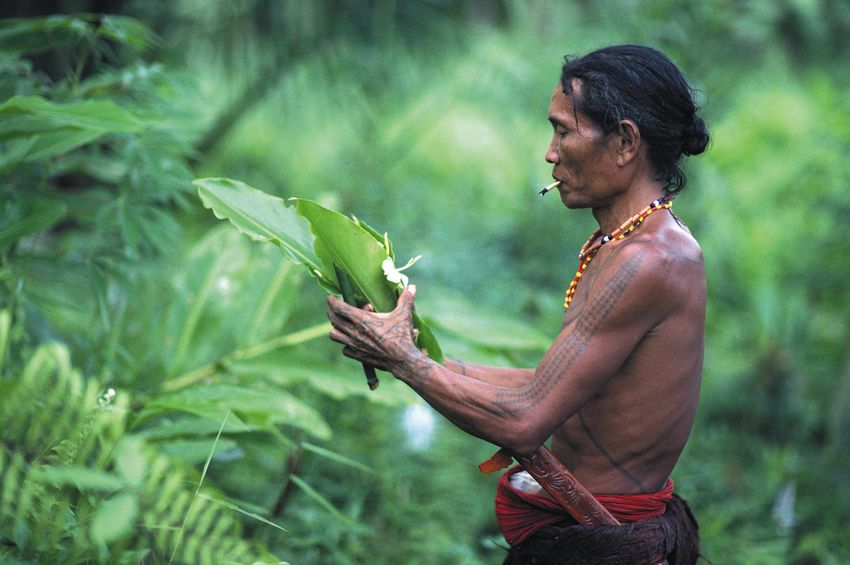
Collecting medical herbs. Mentawai, Indonesia. For many people, even the modern pharmaceutical industry, biodiversity
is the leading source to all medical supplies.
Photo Bryan and Cherry Alexander
Photo Bryan and Cherry Alexander4.0 Methodology 9
methodology
Following the initial stage of literature review, the main
elements of this methodology are based upon 3 major steps: synthesize current
1) Synthesis of studies on impact zones of infrastructure (see scientific studies on
environmental impacts
above); 2) Review of historic growth in infrastructure, and 3)
Scenario assessment (see right). To obtain a simple framework
for assessing probability of impact in function of the distance
from infrastructure, four levels of degree of likelihood of relate probability of impact
impact were defined (see below). to distance to infrastructure
4.1 Synthesis of impact zones from infrastructure
Based upon some 200 scientific studies, an attempt was made estimate development of
infrastructrue based on
to summarize the extent of the impact zones of infrastructure different growth rates
on flora and fauna in the Arctic. Studies on vegetation, soils
and wildlife, referred to in this report, were used to derive
the probability of impact in function of the distance from 1)
power lines or pipelines; 2) roads; and 3) settlements, cabin the 2050 scenario
resorts, or construction-related facilities (Tables 1-2). These
zones were then extrapolated to produce a circumpolar map of
current development and probability of disturbance in the Arctic.
The extent of the impact zones are likely to vary considerably with traffic volume; small country
roads obviously produce less impacts than highways for comparable habitats 66. Noteworthy, some
Arctic species adapted to open areas with high natural predator awareness have been documented
avoiding human structures even in the absence of traffic 148, 149.
A similar pattern has been observed for vegetation. The impact zone of power lines and pipelines
on vegetation and hydrology of the tundra is relatively limited, typically within 500 m; greater for
roads (10
Table 1: Extent of zones of impact on Arctic fauna caused by power-/pipelines, roads, and
settlements. The impact zones designate the probability that habitat availability is reduced
substantially, or that breeding success, abundance, or survival has decreased as a result of
infrastructure or associated activity. Note that different, generally 25-75% lower, sensitivity and
impact zones apply to warmer climate zones.
Type of disturbance Type of impact
Reduced Cumulative impacts Low
abundance on ecosystems disturbance
Power-/pipe lines 0-4 km 4-16 km > 16 km
Roads 0-5 km 5-20 km > 20 km
Settlements 0-10 km 10-40 km > 40 km
Table 2: Extent of zones of impact on vegetation caused by power-/pipelines, roads, and
settlements. Impacts include both direct (like road dust out to 0.5-1 km) and cumulative impacts
(changes in hydrology, ATV-tracks etc.). Note that different, generally lower, sensitivity and impact
zones apply to warmer climate zones.
Type of disturbance Type of impact
Reduced abundance/ Cumulative impacts on ecosystems, Low or no
shift in composition such as thermokarst, off-road traffic disturbance
Power-/pipe lines 0-0,5 km 0,5-2 km > 2 km
Roads 0-1 km 1-10 km > 10 km
Settlements 0-10 km 10-30 km > 30 km
variation in response is presented in Figure 1, based upon the studies assessed (see Appendix 1).
Four categories of impacts were defined for the Arctic (Figure 3):
1) Reduced abundance of birds (0-1 km from infrastructure);
2) Reduced abundance of large mammals (0-3 km);
3) Cumulative impacts on flora and fauna, including shifts in insect composition, food chains,
hydrology, predation patterns etc. (0-20 km);
4) Areas with low or no disturbance (> 20 km).
Note that some species, like reindeer and caribou, are impacted at greater distances, and 50-90%
reduced abundance compared to undisturbed areas have been observed up to 15 km from
development. In Arctic areas with permafrost, roads may lead to changes in hydrology and habitats
several kilometers away from development, thereby affecting areas considerably beyond these
estimates.
Data from the Digital Chart of the World (DCW) at an approximate scale of 1:1 million were used
to produce the circumpolar map. The primary source for this database is the US Defense Mapping
Agency (DMA) Operational Navigation Chart (ONC) series that are produced by the United States,
Australia, Canada, and the United Kingdom. The ONCs have a scale of 1:1,000,000 (1 inch equals
approximately 16 miles) and include details of technical structures. The DCW database was
originally published in 1992. Data currency varies from place to place depending on the currency
of the ONC charts. Chart currency ranged from mid 1960s to the early 1990s. DCW has proved to
be inaccurate compared with higher resolution regional and national mapping databases in the
Arctic. However, it provides the best available coverage for the whole Arctic region 68.11
Figure 3: GLOBIO requires only baseline information on infrastructure. Impact zones are derived through a
synthesis of numerous scientific studies, and adjusted according to climate, eco-zone, and type of infrastructure.
Overlays with additional information, such as pollution, can be supplemented to the overviews.
4.2 Historic growth in infrastructure
Changes in infrastructure between 1940 and
1990 were used to create scenarios of future
development. The entire Arctic was divided
into 25 by 25 km grid squares (“plots”) and
these again into 250 by 250 km grid squares
(“sites”). The buffer zones from infrastructure
outlined above were applied to the 1940
Photo ICIMOD
situation where available and similar analysis
done for the 1990 DCW situation. All 25 by
25 km grid squares with >50% of the area
having buffer zones 1-3 (practically speaking: Infrastructure is often built into the most productive
any plot with any significant amount of infra- regions, with subsequent immigration of non-indigenous
populations and growth in resident farmlands. Nomadic
structure at these scales) was classified as and semi-nomadic people are often forced into more
being “impacted” e.g. having reduced abund- marginal grazing lands previously used only seasonally.
The result is overgrazing and high vulnerability to periods
ance of wildlife or other cumulative impacts
of drought, often with tragic results. The driving pressures
on the ecosystem. The scale of 250 by 250 km of development that initially started these processes, often
grid with 25 by 25 km plots was used in order with social conflicts, are too often overlooked.
to monitor, depict and visualize the expansion
of new infrastructure at regional scales.12 To derive with an estimate of the growth in
areas impacted by infrastructure across the 50-
year period from 1940 to 1990, the following
approach was applied based on the assumption
that new infrastructure primarily spreads out
from existing infrastructure.
1) 30 random, non-overlapping grid cells
of 250 by 250 km, covering areas with
existing infrastructure (roads, power-/
pipelines, or railroads) in 1940, were
selected across the Arctic.
2) Within the grid cell, the area with the
highest concentration of infrastructure
around 1940 (roads/km2) was located.
If no concentration was found, any ran-
dom point in the existing infrastructure
was selected (see Figure 4a).
3) The selected point was then “revisited”
in the 1990 situation (Figure 4b).
4) A circle was drawn around the selected
point (Figure 4c). The radius of the
circle was expanded until ca. 75% of
the circle area was located within 3 km
from of the roads existing in 1990. (e.g.
having < 75% “impacted” plots of 25
by 25 km)
5) The radius of the 1990 circle minus the
radius of the 1940 circle was then cal-
culated (Dmax) (Figure 4d). This radius
is an estimate of how far infrastructure
has spread away from existing infra-
structure in the period 1940-1990.
6) The procedure was replicated across all
30 grid cells, and a mean value cal-
culated (Figure 4e and Table 3).
The availability of good maps from around
1940 is very limited. Furthermore, maps are
updated at irregular schedules. Reliable maps
are available for parts of Scandinavia and
North America. However, many parts of the
Arctic were still undeveloped before World
War II, and most development occurred
throughout the 1960-1970s. Hence, most of
the development, excepting parts of Russia and
Scandinavia, are the result of changes from
near 0 to the situation in 1990. Examples
include the Prudhoe Bay oilfield of Alaska,
the trans-Alaskan pipeline, and the oil fields
of Yamal, Russia.13 Table 3: The average distance (Dmax) from infrastructure existing in 1940 within which >75% of the areas are
14   disturbance, depending upon growth rates
     (Figure 6). For Scandinavia and parts of Rus-
     sia, these levels will occur within 20-30 years
     (Figure 7). This development will accelerate
     with the possible opening of parts of a North-
     ern Sea Route through the Northeast Passage
     153, where development of infrastructure and
     upgrading of harbors will facilitate extraction
     rates. These figures will, correspondingly,
     depict an ecological transformation of tradi-
     tional lands for many Arctic indigenous people
     dependent upon reindeer husbandry and cari-

                                                                Photo UNEP
     bou hunting. In 2000, Greenland and northern
     Canada are the two regions most unaffected
     by industrial development.
                                                              While infrastructure does not depict long-range trans-
                                                              ported air pollution, it often well depicts degree of local
                                                              land and water pollution, as most of the industry is located
                                                              at concentrations of infrastructure near cities. Heavy
                                                              development of infrastructure into previously undeveloped
                                                              areas, or heavy expansion of existing network locally,
                                                              therefore indirectly often leads to increased waste and
                                                              water pollution. Often not considered, but unless con-
                                                              trolled, part of the long-term pattern and development
                                                              globally.

     Figure 6: Changes in human impact on biodiversity and ecosystems between 1990 and 2050 using three
     different rates (50-100-200%) of growth in infrastructure and resource utilization compared to 1940-1990.
     Temperate parts of USA, Europe and Russia will appear more impacted on these maps than what actually is
     the case. A global scenario would use different impact zones in different climatic regions. See the Barents
     Sea map for finer resolution.
5.2 Impacts on biodiversity and ecosystem function 15
The fragmentation of Arctic habitats will, at the levels of development predicted, seriously threaten
biodiversity and ecosystem function. Considerable scientific research in the 1990s confirm that
fragmentation of landscapes by infrastructure and related activities of human resource utilization
(logging, farming, mineral extraction etc.) directly result in reduced productivity and survival of
many species, and hence, in reduced species richness 38, 56, 117, 122, 186. Terrestrial infrastructure
development will also substantially affect aquatic systems not only by i.e. pollution, but also
through the construction of new transportation routes and settlements along the coast, thereby
affecting also sea and freshwater ecosystems indirectly. Stream and lake ecosystems are also affected
through the building of dams, wetland drainage, channelization, and groundwater exploitation.
This will impact fish, invertebrates, sea mammals, and other organisms through increased harvesting
or disturbance 174, 194. Infrastructure therefore causes impacts far beyond those effects directly
induced by the physical foot print.
Even more serious may be the long-term effects on ecosystem function as a result of altered proportions
between predator and prey organisms. Certain groups of species may benefit from lowered survival
of other otherwise competitive species. Fragmentation may result in reductions in populations of
natural enemies for “pest insects”, thereby increasing the number of “pest insects” 117, 122.
Fragmentation of habitat may also lead to a crowding of species in remaining habitat patches,
making the species more vulnerable to predation. Under these conditions, fragmentation may favor
small and medium sized predators and corvine birds. Species vulnerable to fragmentation include
species dependent on large, continuous areas, species with poor dispersal abilities, species with
low fecundity or short life cycles, and species with specialized habitat requirements. Several studies
also document disrupted natural mechanisms and food chains due to development. The changes in
natural food chains and buffer mechanisms as a result of development of infrastructure will seriously
exacerbate the direct environmental impacts on populations and ecosystems at regional scales.
5.3 Impacts on indigenous cultures
Living as herders, hunters, and gatherers, Arctic indigenous people have adapted their lifestyle with
reindeer/caribou systems through thousands of years of co-evolution 28, 100, 113, 158. Today’s Arctic
In Siberia and the Yamal peninsula, like in the rest of the Arctic,
the growing infrastructure related to oil, gas and mineral interests
often conflict with the traditional lifestyles of indigenous people
and their interactions with the land.
Photo Bryan and Cherry Alexander16
Photo Bryan and Cherry Alexander
Reindeer and caribou are crucial to many indigenous people in the Arctic. The saami of the Barents Sea region, once
nomadic, are now struggling to retain their traditional grazing ranges, that are encroaching rapidly due to hydro power
development, large cabin resorts, roads, forestry and mineral exploration. Most of the fragmentation is done by continuous,
small-scale expansion from the already existing network of roads and settlements.
indigenous settlements are commonly located in resource-strategic positions, with territoriality
and social networks adapted to the movements of reindeer or caribou 28, 29, 126, 187. While caribou
hunters and reindeer herders have embraced aspects of modernity, many also retain their close
relationship with wild and domesticated populations of Rangifer. This resource has and continues
to be the most important terrestrial subsistence resource for Arctic indigenous peoples of the
Circumpolar North 114. Indigenous culture groups that herd and hunt reindeer/caribou include (but
are not limited to): in Eurasia, Saami, Nenets, Komi, Khanti, Dolgan, Nganasan, Yukagir, Even,
Evenk, Sakha (Yakut), Chukchi, Koryak, and Chuvan; and in North America, Gwich’in, Iñupiat,
Dogrib, Koyokon Dene, Metis, Cree, Chipewyan, Innu, Naskapi, Yupiit, Inuvialuit and Inuit.
The impact of infrastructure development on reindeer and caribou potentially threatens the cultural
traditions of Arctic indigenous people and their chosen way of life. Changes in the size, distribution,
and movements, or overall behavior of Rangifer populations may, accordingly, have a significant
impact not only on the subsistence-based economies of Arctic hunting people, but also on their
social organization and cultural systems as a whole 64, 154. Therefore, a focus on this keystone species
serves as an indicator of future possibilities for those peoples who depend on this resource 181.
Northern Scandinavia and parts of Russia are examples of areas where the current growth of
infrastructure related to transportation, oil, gas, and mineral extraction is increasingly incompatiblewith land requirements for reindeer husbandry 64, 222. In these areas infrastructure growth is 17 associated with the loss of traditional lands, and conditions forcing indigenous people to abandon nomadic herding patterns for more sedentary life styles. Infrastructure development is often concurrent with changes in regional economic activity, inviting southern-based resource extraction companies interested in short-term economic gains. Such socio-economic changes not only affect cultural practices directly related to traditional reindeer husbandry, but also conflict with the use of traditional homelands for hunting, fishing, and gathering. Due to the simplicity and compressed food chains of Arctic wildlife and their dependence upon slow-growing forage resources, long-term disruptions in the productivity of primary species like nesting waterfowl and reindeer/caribou may seriously affect ecosystem function and sustainability of these northern systems. In addition to these biophysical impacts comes multiplicative effects that may follow from changes in related human land-use patterns, such as increased public access, intensive resource harvesting, and the full array of social costs typically associated with the transformation of longstanding local cultural traditions. The rates of change and their potential impacts on northern reindeer herders and caribou hunters are therefore significant. Utilization of fugitive resources like caribou and waterfowl are critical not only as food, but also for identity and spiritual values of herders and hunters. Through numerous fora, Arctic people now seek to define a sustainable balance in their participation in the cash economy with traditional pursuits. Infrastructure development is closely associated with greater changes in economic activity, and is accompanied with a loss of rights for use of subsistence resources. Thus, the study of cumulative effects of infrastructure development must be linked to analysis and implementation of institutional arrangements that sustain a meaningful role for local resource users in development planning and management 19. Extending the cumulative effect assessment to socio-cultural elements of the system broadens the scope of impacts on development trends. Policies that support external interests in resource extraction in the Arctic need to account for indigenous resources into the full array of impacts related to development activities. Consequently, there is a need to advance our understanding of these effects more thoroughly. Recently the International Arctic Science Committee (IASC) concluded that the cumulative effects of current forces changing Arctic grazing systems are of significant concern in the Circumpolar North. In 1998 an international research-planning forum of IASC on the human role in reindeer/ caribou systems arrived to this conclusion, noting the paucity of tools for assessment of cumulative effects, and calling for methodological development of assessment tools as critical to human’s capacity to anticipate and respond to future conditions 114. The principles of GLOBIO may help to breach this gap and extend it beyond the North. 5.4 Impacts on the Arctic Continued growth at current rates in infrastructure, gas, oil, and mineral extraction will, within 20- 50 years, seriously impact wildlife populations, vegetation, and ecosystem function across 50- 80% of the Arctic. Migratory species, like birds, will carry the impacts with them far beyond the Arctic region. Furthermore, the cumulative impacts are likely to affect many of the indigenous cultures in the Arctic, which are depending upon natural resources for their traditional lifestyles. The extent of the impacted areas, even with conservative estimates assuming 50% reduction in development rates, ostensibly illustrates the severity of the environmental threat to the Arctic. Although the Arctic is among the least developed areas of the world, the extent of the impact zones is much larger. Changes in the hydrology of the tundra may also affect climate patterns as these areas hold some of the world’s greatest carbon reserves.
18 These risks are more complex to assess and less easily predictable with recent changes in global
climate. In Polar regions, the effects of climate change are likely to be the more dramatic than in
any other regions. Whilst the effect of climate change is not the focus of this paper, it is important
to highlight its potential impacts on Arctic ecosystems, and its need to be considered in combination
with the impacts from industrial development and tourism.
5.5 Impacts at a global scale
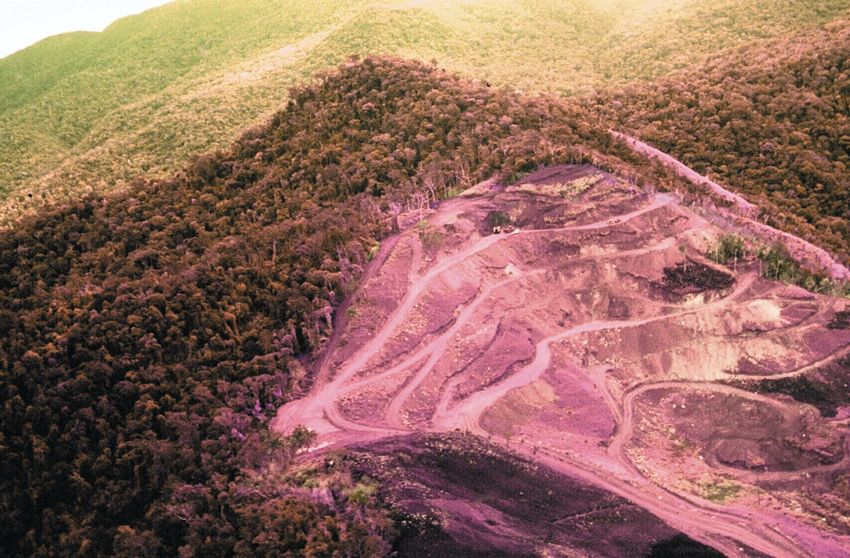
Early pilot assessments of the Barents Sea, Himalayan region and Amazon region (Figures 7-10),
demonstrate that the GLOBIO-mapping techniques can be useful for cumulative impact assessments
in most ecosystems. The maps, at very different scales, provide important information on the
major driving pressures and changes that, over time, have been the greatest contributors to
environmental changes within a region. At fine scales, it may depict the impacts of the contribution
of many smaller development projects to the overall development of a region.
At a global scale, a substantial decline in abundance and diversity in fauna, including insects,
amphibians, reptiles, mammals and birds, will occur in an estimated 50-90% of the land area in 2050
if growth in infrastructure and exploitation of natural resources continues at the current rate. Some
species will increase in numbers, particularly “generalist” species such as smaller predators and
“pest” insects, with subsequent impacts on flora and fauna. The environmental impacts of continued
growth in infrastructure with its associated resource exploitation will also threaten the production
of food and water resources and other essential products from nature. There is a significant risk
that the cumulative impacts will lead to the collapse of many natural buffer mechanisms within
50-100 years, and, hence, substantially exacerbate the impacts of pollution and climate change.
Figure 7: The use of GLOBIO at finer scales for visualizing the cumulative impacts of bit-by-bit encroachment.
In the Barents Sea region, it is used to map the encroachment and fragmentation of the ranges used by the
Saami people and their livestock of migratory reindeer. Notice that the greater resolution of this map compared
to the circumpolar maps provide much more detail on also the variation locally in degree of impacts. The risk
of reduction in wildlife is related to the situation before infrastructure was established. Natural rich, but impacted
areas may still be higher in biodiversity than e.g. naturally low-productive non-developed inland areas.19 Figure 8: Preliminary assessment of the Amazon region. The map is made for illustration purposes only to demonstrate the application of GLOBIO in other regions of the world. The majority of the deforestation and decline in biodiversity in this region has taken place along the road corridors. Due to the coarse scale of this map, some areas appear more impacted that actually the case. Figure 9: Preliminary assessment of the Himalayan region. The map is made for illustration purposes only to demonstrate the application of GLOBIO in other regions of the world. The density of infrastructure closely resemble much of the original forest cover in parts of the region, now greatly diminished in most places.
20
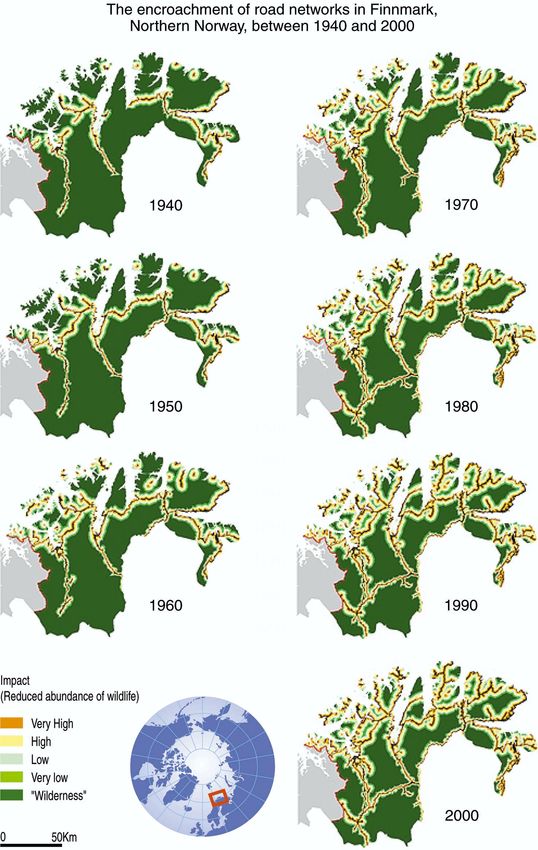
Figure 10: The development of the road network in Finnmark, Norway, between 1940 and 2000. The maps
show some of the changes used for the GLOBIO scenario development. The coastal areas of Finnmark are
crucial to the Saami indigenous people for calving grounds and summer ranges of their livestock of semi-
domesticated reindeer. The same coastal zones, however, have been those subjected to most of the development
(see above). The development depicts only part of the encroachment, as the military bombing ranges, resorts,
power lines and also major hydro power dams are not included on the maps. Currently, a series of proposed
development projects for mineral exploration, power stations, roads and resorts threaten the remaining grazing
land and biodiversity in the region.6.0 Benefits and limitations of GLOBIO 21 6.1 Supplement to conventional approaches 6.1.1 Traditional wildlife biology approaches To date, most environmental impact assessments of anthropogenic disturbance of wildlife and vegetation have relied extensively on studies at local scales, or on more theoretic models. Anthropogenic disturbance of wildlife has traditionally been discussed through local studies of fright behavior, flight distances or stress hormone production in animals 4, 54,85, 95, 147, 177, 198, 214, or assessed in relation to direct physical destruction or alteration of habitat 39, 40, 139, 211. However, assessments of physiological or short-term responses in individual animals or on vegetation at local sites may substantially underestimate regional and global environmental impacts such as changes in species abundance and reproduction, thereby failing to describe fully the cumulative impacts of development 65, 91, 213. While studies of short-term, local impacts are valuable for understanding mechanisms in ecological responses to human activity, it is difficult to relate physiological stress in individuals and local site-dependent effects on vegetation to impacts at regional levels. Furthermore, such effects cannot readily be linked to the geographic area affected by human activity, and will therefore become difficult to monitor across larger regions. As Arctic indigenous people are largely dependent upon natural resources such as fish and reindeer/caribou, the functioning of the ecosystems at large scales, including successful migration of ungulates, becomes of overriding importance to the wellbeing of these people 18, 64, 111, 154. So far, however, while isolated, small-scale developments may have only minor impact, the cumulative impacts of consecutive development may seriously endanger not only wildlife, but also the cultural traditions of those depending upon flora and fauna in the Arctic. 6.1.2. Traditional landscape ecology approaches There are numerous more or less complex biodiversity and landscape indices currently available for more detailed assessments. A review of some complementary approaches is presented elsewhere 191. Many indices are very sensitive to information on baseline situations or on the state (“quality”) of the ecosystems assessed, thereby requiring rather extensive input information to be reliable. Furthermore, even though roads alter only a small footprint directly (around 1-5% of the land cover), they result in large impact zones by bringing in human activity and fragmentation, as illustrated here. Such indices and models, however, may provide important complementary information to GLOBIO-assessments. Indeed, there are numerous research programs assessing landscape ecological approaches to human impacts at more detailed scales, but many are limited by high requirements of input data. Many are also difficult to relate to socio-economic, cultural, and economic aspects. Such methods should however be explored further to supplement and refine the distance zones, particularly of impacts on ecosystems presented in GLOBIO. 6.2 Data availability GLOBIO’s only requirement for baseline information is maps of infrastructure. At national scales, updated information on infrastructure is generally readily available. Both current and developing remote sensing techniques holds promise for rapid updating and monitoring techniques that can provide step-by-step information on changes in environmental risks. New research on impact zones is continuously available through international publication networks, and the size of zones can therefore easily be updated according to new advances and information. At a global scale, growth scenarios must be linked closely to socio-economic models of development to provide the most realistic scenarios. Furthermore, remote sensing may give specific information on changes in land cover, such as changes in forest cover, grasslands etc.
22   6.3 Data compatibility

     The methodology presented in this report relates probability of impact on abundance, reproduction,
     and survival of wildlife and vegetation to distance to infrastructure. The mapping of impacts may
     also be combined with diffuse pollution sources such as POP’s, acid rain, heavy metals, and other
     sources of water or air borne pollutants. Based upon the extensive global database from the US
     Defense Mapping Agency available to UNEP, giving information on transportation network, dams,
     power lines, utilities and other human physical impacts, the analysis can be conducted for all
     ecosystems from tropical rain forest to Arctic tundra using a common methodology, but with
     varying criteria.

                                          continued growth in
                                      development of infrastructure

      off-site reduced                                                                              growth in
                                                        physical              pollution,
         abundance           fragmentation                                                       non-indigenous
                                                       destruction             waste,
         or survival        and habitat loss                                                      settlements/
                                                        of habitat             noise
          of wildlife                                                                              immigration

       increase in "pest"-species,
                                               health risks, deforestation,         social conflicts, increased
         overgrazing, increased
                                               desertification, water and          competition for grazing land,
         predation, disruption of
                                                    land degradation                   hunting and fishing
       natural buffer mechanisms

                          land and water degradation, loss of biodiversity,
                             and increased poverty and social conflicts

                                                      GLOBIO

                         criteria for protection of                   integrated area and
                              biodiversity and                       development planning
                           ecosystem function

                         holistic planning and basis for cultural, ecological
                              and economic sustainable development
23
Photo Ng Chan Chien, UNEP
The regulation and damming of many rivers for power or irrigation purposes not only impact wildlife, but also the water
situation for many people further down stream.
6.4 Sensitivity of GLOBIO to input variables
In many other ecosystems, such as in temperate and tropical regions, the impact zone from
infrastructure is substantially lower than in the Arctic; 100-1000 m compared to 4-10 km,
respectively 68, 152. This may partly be explained by a high shrub and tree cover in boreal, temperate
and tropical regions compared to the Arctic, as impact zones from infrastructure locally have been
shown to be larger in open areas than in areas with cover 179. As ecological disturbance zones from
development are smaller in many parts of for example USA, Europe, South America, Africa, and
southeastern Asia, even areas with an apparently high density of infrastructure may clearly have
areas with low probability of impact on wildlife. However, the network of infrastructure is far
greater in many temperate and tropical regions compared to the Arctic 15, 66, 171. Reduced survival
of numerous species related to density of infrastructure and human resource utilization has been
reported in studies undertaken recently from all parts of the world 15, 22, 78, 91, 142, 179, 186, 192, 194. This
provides the GLOBIO approach with the potential for global application.24 The statistical factor having the by far greatest impact on the scenarios is the extrapolation of
historic development in infrastructure. Indeed, reducing the impact zones by 50% only results in
5-15% difference to the area impacted in 2050, simply because many zones merge due to extensive
existing occurrence of infrastructure. By using a range in development of 50-200%, these estimates
become statistically far more important than minor variation in impact zones, simply due to the
extent of existing infrastructure.
6.5 Scenario modeling
Among the most crucial inputs to GLOBIO are good and realistic scenario-models for development
in infrastructure. There are obvious differences in the rates of such development including both
socio-economic (urbanization trends) and natural factors, such as low interest in developing desert
regions. This part needs to be thoroughly developed for the global scenario work, and currently
requires specific attention. New landscape disturbances, which are disconnected to existing
infrastructure and may arise in regions previously undeveloped also needs to be addressed in the
methodology ahead. For example, this analysis does not include the many mining, power line, and
road facilities currently planned for in previously undeveloped regions of the Arctic (e.g., Nunavut
and Labrador of Canada).
The major advantage of the GLOBIO-approach of relating environmental risk to distance and
density of infrastructure is its simplicity. Global infrastructure holds a key to understanding
environmental impacts related to human activity and resource utilization. The likelihood of impact
can effectively be linked to existing and planned infrastructure at local scales, as well as to regional,
national, and international development scenarios. Herein also lies a disadvantage, namely that
GLOBIO mainly provides a risk assessment overview. The many more advanced models and
indices available currently should therefore be seen as complimentary to the GLOBIO-approach,
as they may provide additional and more detailed information on the impacts of changes in human
activity over time.
7.0 Recommendations
The following recommendations are made with regard to progress and improvements:
1) Finalize an initial global scenario report and develop regional assessments in close
collaboration with regional institutions.
2) These reports should integrate and synthesize recent advances in relevant fields.
3) Include specific recommendations for actions on integrated area and development planning,
mitigation, and protection worldwide, including detailed assessments of specific regions,
for example (but not limited to) the Arctic, the Barents Sea region, the Amazon, the Himalayas,
and selected regions of Africa, to cover the variety of political, environmental, social and
cultural diversity worldwide.
4) Develop further the pilot methodology, particularly with regard to mapping techniques of
already fragmented areas, scenarios and critical levels.
5) Recommend a structure for implementation worldwide, including the establishment of expert
working groups on mapping, policymaking and key-topics.
8.0 Conclusions
Most of the current environmental problems are the results of excessive human impacts on 10-
15% of the land area. Arctic land areas with excessive human impacts (reduced abundance of floraYou can also read