From the Adirondacks to Acadia - A Wildlands Network Design for the Greater Northern Appalachians
←
→
Page content transcription
If your browser does not render page correctly, please read the page content below
From the Adirondacks to Acadia

A Wildlands Network Design for the Greater Northern Appalachians

       Conrad Reining, Karen Beazley, Patrick Doran, Charlie Bettigole

          WILDLANDS      PROJECT     ~   SPECIAL PAPER NO. 7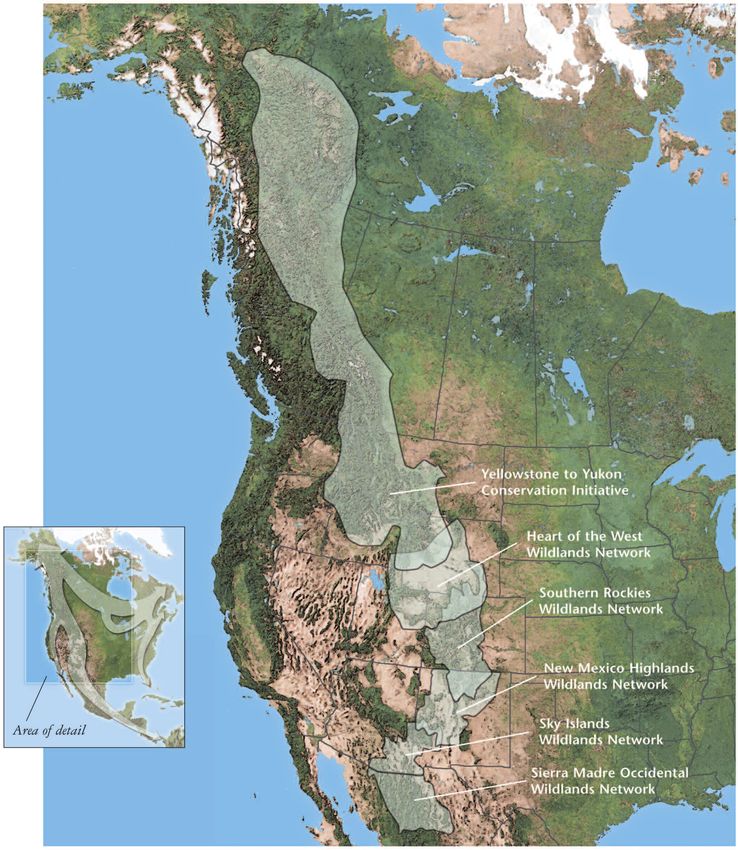
We are ambitious. We live for the day when grizzlies in
Chihuahua have an unbroken connection to grizzlies in
Alaska; when wolf populations are restored from Mexico
to the Yukon to Maine; when vast forests and flowing
prairies again thrive and support their full range of native
plants and animals; when humans dwell on the land with
respect, humility, and affection.

Toward this end, the Wildlands Project is working to
restore and protect the natural heritage of North America.
Through advocacy, education, scientific consultation, and
cooperation with many partners, we are designing and
helping create systems of interconnected wilderness areas
that can sustain the diversity of life.

WILDLANDS PROJECT

P.O. Box 455
Richmond, VT 05477
802/434-4077
info@wildlandsproject.org
www.wildlandsproject.org
From the Adirondacks to Acadia
    A Wildlands Network Design for the Greater Northern Appalachians

                     Conrad Reining, Karen Beazley, Patrick Doran, Charlie Bettigole

         CONTENTS
         Executive Summary . . . . . . . . . . . . . . . . . . . . . . . . . . . . . . . . . . . . . . . . . . . . . . . . . . . . . . . . 2
         Introduction . . . . . . . . . . . . . . . . . . . . . . . . . . . . . . . . . . . . . . . . . . . . . . . . . . . . . . . . . . . . . 3
         Wildlands Project Mission and Megalinkages . . . . . . . . . . . . . . . . . . . . . . . . . . . . . . . . . . . 4
         From the Adirondacks to the Maritimes: A Regional Overview of the Greater
         Northern Appalachians and Why They Need Protection and Restoration . . . . . . . . . . . . . 9
         A Wildlands Network Design for the Greater Northern Appalachians . . . . . . . . . . . . . . . 15
            Study Area . . . . . . . . . . . . . . . . . . . . . . . . . . . . . . . . . . . . . . . . . . . . . . . . . . . . . . . . . . . . .   15
            Three-track Approach to Conservation Planning . . . . . . . . . . . . . . . . . . . . . . . . . . . . . . . . . .                      15
            Site Selection . . . . . . . . . . . . . . . . . . . . . . . . . . . . . . . . . . . . . . . . . . . . . . . . . . . . . . . . . . .   19
            Planning Units . . . . . . . . . . . . . . . . . . . . . . . . . . . . . . . . . . . . . . . . . . . . . . . . . . . . . . . . . .     19
            Sensitivity Analysis . . . . . . . . . . . . . . . . . . . . . . . . . . . . . . . . . . . . . . . . . . . . . . . . . . . . . . .     20
            MARXAN Parameters . . . . . . . . . . . . . . . . . . . . . . . . . . . . . . . . . . . . . . . . . . . . . . . . . . . . .            20
            Data Limitations . . . . . . . . . . . . . . . . . . . . . . . . . . . . . . . . . . . . . . . . . . . . . . . . . . . . . . . . .     22
            Results of the Site Selection Analysis . . . . . . . . . . . . . . . . . . . . . . . . . . . . . . . . . . . . . . . . . .             23
            Methods for Creating the Wildlands Network Design . . . . . . . . . . . . . . . . . . . . . . . . . . . . . .                          27
            Methodological Limitations and Strengths . . . . . . . . . . . . . . . . . . . . . . . . . . . . . . . . . . . . . .                   30
            Results of the Network Design . . . . . . . . . . . . . . . . . . . . . . . . . . . . . . . . . . . . . . . . . . . . . . .            32
            Goal Attainment in the Network Design . . . . . . . . . . . . . . . . . . . . . . . . . . . . . . . . . . . . . . .                    39

         Discussion . . . . . . . . . . . . . . . . . . . . . . . . . . . . . . . . . . . . . . . . . . . . . . . . . . . . . . . . . . . . . . 40
         Acknowledgments . . . . . . . . . . . . . . . . . . . . . . . . . . . . . . . . . . . . . . . . . . . . . . . . . . . . . . . . 45
         Appendices . . . . . . . . . . . . . . . . . . . . . . . . . . . . . . . . . . . . . . . . . . . . . . . . . . . . . . . . . . . . . 46
            Appendix 1: Methods Used by TNC, NCC and their
              Partners to Delineate Matrix Forest Blocks . . . . . . . . . . . . . . . . . . . . . . . . . . . . . . . . . . . .                   46
            Appendix 2: Ecological Land Unit Types Captured by Draft Wildlands Network . . . . . . . . . . . .                                     47
            Appendix 3: Detailed Methods Used to Create the Wildlands
              Network Design at the State And Provincial Level . . . . . . . . . . . . . . . . . . . . . . . . . . . . . . .                       50
            Appendix 4: Experts Who Participated in Meetings or Were Otherwise
              Consulted in the Development of the Network Design . . . . . . . . . . . . . . . . . . . . . . . . . . . .                           53

         References . . . . . . . . . . . . . . . . . . . . . . . . . . . . . . . . . . . . . . . . . . . . . . . . . . . . . . . . . . . . . . 55

Suggested citation: Reining, C., K. Beazley, P. Doran and C. Bettigole. From the Adirondacks to Acadia: A Wildlands Network
Design for the Greater Northern Appalachians. Wildlands Project Special Paper No. 7. Richmond, VT: Wildlands Project. 58 pp.

©2006 Wildlands Project • August 2006 • Cover photo: Richard Ennis • Design: Kevin Cross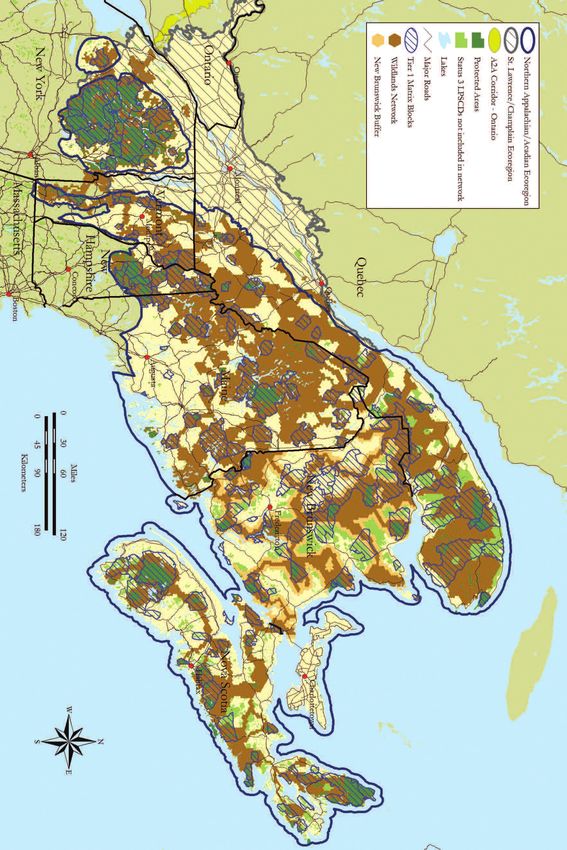
EXECUTIVE SUMMARY

T H I S R E P O RT P R E S E N T S A P R O P O S E D W I L D L A N D S   Greater Northern Appalachian region. All existing core
network design for the Greater Northern Appalachian                      protected areas, currently 24,661 km2 (6,091,267 acres;
region of the northeastern United States and southeastern                6.4% of the region), are captured in the proposed network.
Canada. This region spans 388,541 km2 (96,010,538                        An additional 42,053 km2 (10,387,010 acres) in proposed
acres) and encompasses two ecoregions, the Northern                      core areas are identified (10.6 % of the region), along with
Appalachian/Acadian and St. Lawrence/Champlain, and all                  an additional 114,805 km2 (28,356,835 acres) of lands of
or part of ten states and provinces. A network design is a               high biological significance (29.5% of the region). Of the
conservation plan that uses the most recent research and                 total proposed network, about 14% is in existing core pro-
data to identify areas of high biological value for very large           tected areas, 23% is in proposed core areas and the remain-
regions, integrating core protected areas with wildlife                  ing 63% is in high biological significance lands. About
linkages and economically active stewardship lands. The                  33% (60,235 km2 or 14,878,045 acres) of the proposed
wildlands network design is an effective, science-based                  network is in status/gap 3 or Public/Crown lands, and
model for understanding where land and biodiversity con-                 about 53% (96,623 km2 or 23,865,800 acres) remains pri-
servation is both needed and possible.                                   vately held and subject to potential development.
     The current study establishes the location and extent                    When implemented over the course of many years, the
of existing core protected areas, proposed core areas, and               wildlands network design for the Greater Northern
areas of high biological significance. Core protected areas              Appalachians should contribute to the protection and
are highly-irreplaceable areas of concentrated conserva-                 restoration of ecological integrity in the region. The
tion value and are therefore intended to be managed with                 strength of this design is its capacity to identify the major
biodiversity values as the primary objective. Areas of high              terrestrial conservation “nodes” in this region and the
biological significance (HBS) are lands that we have iden-               potential linkages among them. From a regional perspec-
tified as having significant conservation value based on                 tive, 13 high-priority conservation areas are identified,
the analysis. In general, these areas had somewhat lower                 including the Gaspé Peninsula, northern and western
conservation value at a regional scale than either existing              Maine, the Chignecto Isthmus of Nova Scotia and New
or proposed core areas, although they are vital to achiev-               Brunswick, the southern Lake Champlain valley, and the
ing overall conservation goals. Additional study will be                 Green Mountains (Vermont)/Sutton Mountains (Québec)
needed to determine the precise conservation designation                 region. The current analysis demonstrates (in conjunction
for these lands. Wildlife linkages have been included in                 with other efforts) that even smaller-scale threats can have
the HBS category.                                                        a broader regional effect. By providing a big picture
     To establish the location and extent of the network                 overview, this study aims to help focus conservation efforts
design elements, we used three major sources of information:             on the places and issues, at various scales, with the greatest
1) the results of a site selection analysis that integrates infor-       conservation need. While this network design should be
mation on three major “tracks” of environmental data—focal               seen as a living document, to be refined as new data and
species, environmental variation, and special elements; 2) the           resources become available, it does provide insights into
location of The Nature Conservancy’s Tier 1 matrix forest                the major regional patterns of high terrestrial conservation
blocks in the Northern Appalachian/Acadian ecoregion; and                value and landscape linkages. Regardless of future adjust-
3) input from experts in the states and provinces.                       ments, it is unlikely that concentrated areas of the most
     The total proposed network would encompass                          highly-irreplaceable conservation features at the regional
181,519 km2 (44,835,112 acres) or about 47% of the                       scale identified through this analysis will vary significantly.

[2]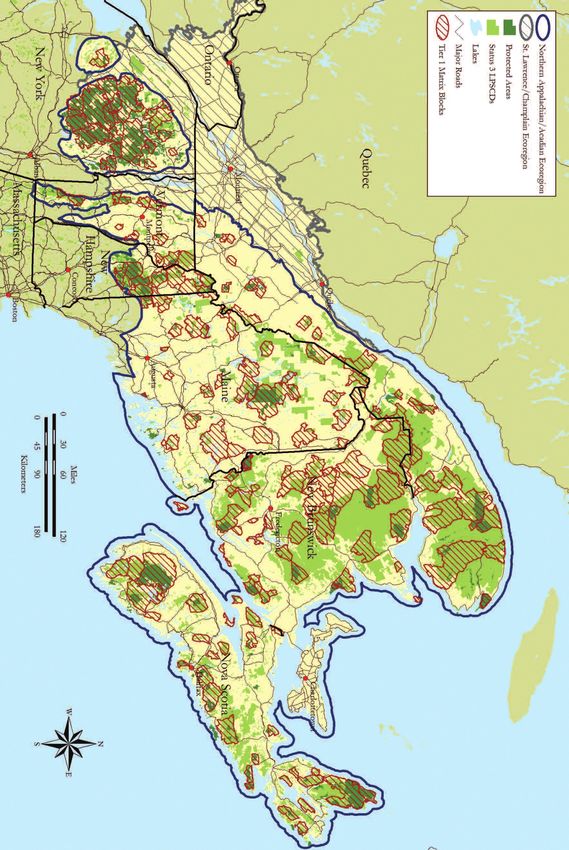
INTRODUCTION

THIS STUDY EXAM I N ES A CON S ERVATI ON A P P R O A C H          includes representing biotic and abiotic conditions as delin-
designed to systematically identify a network of areas of high    eated by ecological classifications. Second, the special ele-
conservation priority within the Northern Appalachian/Aca-        ments track attempts to protect occurrences of rare species or
dian and St. Lawrence/Champlain Valley ecoregions of the          communities and other sites with high ecological values.
northeastern United States and southeastern Canada (here-         Finally, the focal species track attempts to conserve sufficient
after the Greater Northern Appalachians). More specifically,      habitat to support ecologically viable populations of species
we identify existing and proposed core protected areas (areas     that serve important ecological roles at large spatial scales
managed with biodiversity values as the primary objective)        and/or are sensitive to human activities (Noss and
that are linked and buffered by areas of high biological sig-     Cooperrider 1994, Lambeck 1997, Miller et al. 1999, Noss
nificance. Collectively, these elements should create a conser-   et al. 1999). While each approach can lead to the siting of a
vation area network—known as a wildlands network                  conservation area to meet specific sets of goals (Noss et al.
design—to protect occurrences of rare species or communi-         1999), the integration of these approaches in the field of con-
ties and other sites with high ecological values, represent the   servation area design has only recently been applied (e.g.,
range of environmental variation across the study area, and       Noss et al. 2002, Foreman et al. 2003, Miller et al. 2003,
conserve sufficient habitat to support viable populations of      Jones et al. 2004, Beazley et al. 2005) and should produce a
selected focal species.                                           conservation plan that adequately provides protection for a
      Effective conservation of biological resources and eco-     wide range of biological diversity (Noss 2003).
logical systems requires management strategies at multiple              Effective conservation planning relies upon explicit, sys-
spatial scales, from local-level protection of individual         tematic and efficient methodologies to evaluate and rank
species or unique environmental features to the management        myriad scenarios for a conservation area system in a given
of whole landscapes or ecosystems over broad regional scales.     landscape (Margules and Pressey 2000). While historic
The establishment of a system of ecologically-based conser-       methods have often relied upon manual mapping and sub-
vation areas may provide an effective strategy for represent-     jective decisions regarding the location and size of conserva-
ing a wide range of biological diversity, as well as providing    tion areas, recent advances in the field of conservation area
a means for persistence of individual species and the protec-     system design have provided the tools necessary to evaluate
tion of biological resources (Trombulak 2003).                    alternative scenarios (Soulé and Terborgh 1999, Scott et al.
      Systematic conservation planning (Margules and              2001, Andelman and Willig 2003, and Rodrigues et al.
Pressey 2000) has recently emerged as a conceptually valid        2004). From a biodiversity-conservation perspective it
approach to designing a conservation area system to achieve       makes sense to maximize the area under some form of con-
adequate protection of biological resources. Systematic con-      servation, however social and economic realities rarely make
servation planning encompasses six steps to identify, imple-      such expansive conservation possible. The primary aim of the
ment, monitor, and maintain a system of conservation areas        conservation area design process then is to select the mini-
(Margules and Pressey 2000). These steps are: 1) compilation      mum suite of sites that effectively meets designated conser-
of existing data on biological resources within a planning        vation goals (Leslie et al. 2003). There are a variety of com-
area and identification of focal species or resources as surro-   puter-based siting algorithms (e.g., simulated annealing,
gates for biodiversity; 2) establishment of specific conserva-    iterative, optimizing) that are designed to meet such goals
tion features and goals; 3) evaluation of the degree to which     (see review in Leslie et al. 2003).
conservation goals are currently met; 4) explicit and objec-            This report summarizes the objectives, methods and
tive design of new conservation areas; 5) implementation of       results of our conservation area system planning process in
on-the-ground conservation actions; and 6) maintenance and        the Greater Northern Appalachians. We first present a brief
monitoring of conservation areas.                                 introduction to the Wildlands Project and its approach to
      One approach to the conservation of biological diversity    continental-scale conservation. This is followed by an
and the maintenance and restoration of ecological integrity       overview of the Greater Northern Appalachians and then by
follows three broad tracks (Noss 2003). First, the environ-       the specific methods used to create the wildlands network
mental variation track attempts to represent the full range of    design for the region. We present the network design itself
environmental variation across the area of interest. This often   and describe its features, followed by a discussion.

                                                                                                                            [3]
WILDLANDS PROJECT MISSION AND MEGALINKAGES

THE MISSION OF THE WILDLANDS PROJECT IS TO                           Major global change is occurring in land use; climate;
restore and protect the natural heritage of North America.      nitrogen deposition and acid rain; invasive and exotic
To achieve this end, the organization focuses its efforts on    species (sometimes called “biotic exchange”); and atmos-
four continental-scale “MegaLinkages” that, when imple-         pheric CO2 concentration. Over the next 100 years, land
mented, will tie North American ecosystems together to          use change will have the most dramatic impacts on biodi-
conserve and benefit native species in their natural patterns   versity in terrestrial habitats, while biotic exchange will
of range and abundance (Figure 1). These four areas are:        likely be most important in freshwater ecosystems (Sala et
                                                                al. 2000).
1) Pacific MegaLinkage, along the west coast from
                                                                     “In light of the dramatic rate at which landscapes are
Baja California to Alaska;
                                                                being changed, perhaps the most effective tool for con-
2) Spine of the Continent MegaLinkage, from Meso-               serving biodiversity is the establishment of reserves. These
america to Alaska through the Rocky Mountains and other         areas protect biodiversity by reducing threats to the per-
ranges;                                                         sistence of populations (Lawler et al. 2003: 1762).”
                                                                However, in North America, and worldwide, existing sys-
3) Atlantic MegaLinkage, from Florida to New
                                                                tems of reserves are not doing a good job of conserving the
Brunswick, mostly along the Appalachians; and
                                                                full sweep of biodiversity. Recent assessments show that
4) Boreal MegaLinkage, from Alaska to The Canadian              less than 6% of the coterminous United States is in nature
Maritimes across the roof of North America.                     reserves and that most reserves are found at higher eleva-
                                                                tions and on less productive soils, even as the greatest
      Each MegaLinkage is comprised of several “Wildlands       number of plant and animal species are found at lower
Network Designs,” conservation plans that use the most          elevations. Analyses of land-cover types indicate that
recent research and data to identify areas of high biologi-     approximately 60% of mapped cover types have less than
cal value for very large regions. A typical wildlands net-      10% of their area in nature reserves. Land ownership pat-
work design covers millions of acres or hectares, and iden-     terns show that areas of lower elevation and more produc-
tifies existing and proposed core protected areas that are      tive soils are most often privately owned and already
functionally linked and buffered by multiple-use lands          extensively converted to urban and agricultural uses
that are managed to promote conservation goals within           (Scott et al. 2001).
the broader network. These networks often cross state,               Another study (Andelman and Willig 2003) illus-
provincial, municipal and international borders. Several        trates the skewed geographical and size distributions of
network designs have been completed within the subre-           protected areas in the Western Hemisphere: 811 of 1413
gions that comprise the Spine of the Continent MegaLinkage      reserves in the Western Hemisphere are smaller than 10
(Figure 2). The Greater Northern Appalachians network           km2, and 35% of the total area of these reserves is in
design is the beginning of the Atlantic MegaLinkage.            Alaska. This study also compiled information on the
                                                                ranges of all bats in the continental New World (such data
                                                                are not available for all taxa). Bats are a crucial component
Why Large-Scale Conservation?                                   of mammalian biodiversity and the spatial distribution of
                                                                bat species richness parallels that of mammals in general.
Why do we need to pursue conservation on such a large           Almost 82% of threatened and small-range bat species are
scale? In short, “global biodiversity is changing at an         not protected adequately.
unprecedented rate as a complex response to several                  North America has also lost many of its native preda-
human-induced changes in the global environment. The            tors in large parts of their historic ranges. Wide-ranging
magnitude of the change is so large and so strongly linked      carnivores like wolves and jaguars often play essential roles
to ecosystem processes and society’s use of natural             in regulating the numbers and behavior of prey species
resources that biodiversity change is now considered an         below them in food chains. Such food chains are woven
important global change in its own right (Sala et al.           into complex webs of interaction, and the loss of large car-
2000: 1770).”                                                   nivores can reverberate through these webs, causing the

[4]
FIGURE 1 Map of North American “MegaLinkages.”

                                                 [5]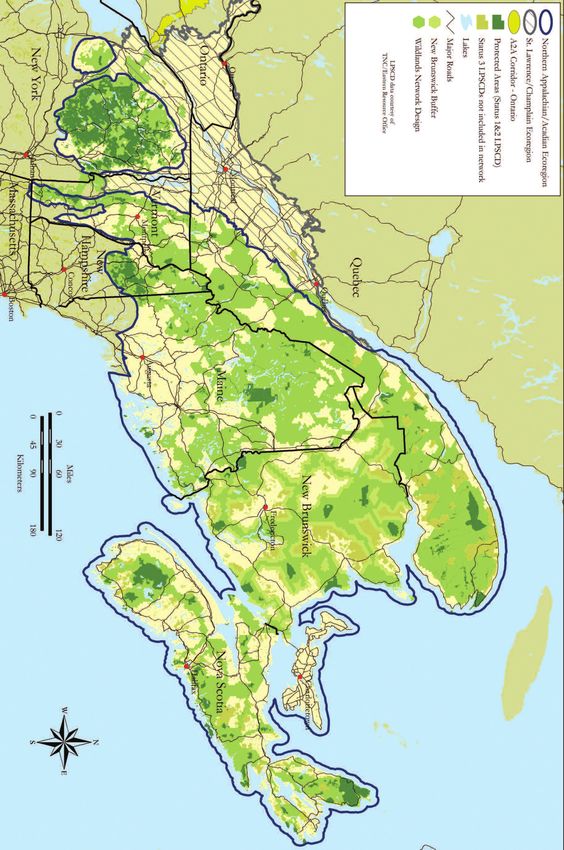
FIGURE 2 Spine of the continent megalinkage showing component wildlands network designs.

[6]
local disappearance of species and even entire communities        should also be buffered from ecologically-degrading
(Estes et al. 1978, Power et al. 1996, Estes et al. 1998,         human activities by areas of compatible use—often
Rogers and Caro 1998, Soulé and Noss 1998, Henke and              called stewardship lands—where areas of low-impact
Bryant 1999, Terborgh et al. 1999, Kullberg and Ekman             farming and forestry complement the functions of the
2000, Soulé et al 2003, Ray et al. 2005, Soulé et al. 2005).      core areas (Noss and Cooperrider 1994; Trombulak 2001,
In much of North America, for example, white-tailed deer          2003). The result is a network of core wild areas, func-
and raccoons have become overabundant in the absence of           tionally linked across the landscape and buffered by well-
their predators, disrupting plant communities and elimi-          managed stewardship lands.
nating some kinds of birds and small mammals (DeCalesta                The question remains as to the most efficient means of
1994, Waller and Alverson 1997, McShea and Rappole                creating networks of reserves. There is growing agreement
1997, McGraw and Furedi 2005).                                    within the conservation community that planning and
     Predator restoration may indeed help reverse declines        action should adhere to four key principles (after Pressey
in the condition of biodiversity in a given system, but Ray       and Margules 2000), addressed in detail below:
(2005: 419) cautions that such opportunities will be best           ■ Establish planning boundaries based on ecological
in “systems where the demise of predators has been clear-              features;
ly shown to result in adverse ecosystems impacts and                ■ Set clear biodiversity conservation goals within a given
where the system has not been importantly degraded by                  planning boundary;
other factors.” Ray (2005: 419) observes further that               ■ Follow a systematic conservation planning process; and
                                                                    ■ Involve a broad array of stakeholders in design and
    In the terrestrial realm…where habitat conversion has
                                                                       implementation.
    brought on so many changes to biodiversity, the return of
    predators to many places may require lengthy periods of
                                                                  Establish planning boundaries based on ecological
    time, if recovery is achieved at all. However, in all such
                                                                  features MegaLinkages represent the first step toward
    systems, restoring top predators may still be one important
                                                                  establishing boundaries based on ecological features: in
    component of a restoration plan with many other elements,
                                                                  this case with regard to the Appalachian mountain region
    and by itself may still nudge along the healing process in
                                                                  of North America. The network designs within this
    some fashion.
                                                                  MegaLinkage should adhere to further ecological subdivi-
     Much past conservation has been ad hoc, often driven         sions. Since the mid-1990s there has been increasing
by a region’s scenic values or remoteness—as well as              agreement among conservation scientists as to the defini-
wildlife and natural values. But this approach to biologi-        tions, boundaries and utility of these ecological divisions,
cal conservation has left “Canada, the United States,             usually referred to as ecoregions (Bailey 1998, Olson et al.
Mexico, and most other countries with highly fragmented           2001, Bailey 2002). As Olson et al. (2001) observe, “con-
systems of parks and reserves in which some elements of           servation strategies that consider biogeographic units at
the native biota are overrepresented and others are not rep-      the scale of ecoregions are ideal for protecting a full range
resented at all (Soulé and Terborgh 1999b).” This has             of representative areas, conserving special elements, and
occurred not only in North America but throughout the             ensuring the persistence of populations and ecological
world (Margules and Pressey 2000).                                processes, particularly those that require the largest areas
                                                                  or are most sensitive to anthropogenic alterations (Noss et
                                                                  al. 1999, Soulé and Terborgh 1999a, Groves et al. 2000,
The Promise of Wildlands Network Designs                          Margules and Pressey 2000).” Accordingly, the planning
                                                                  boundary for the current network design exercise encom-
One method of addressing gaps in protection and threats           passes the Northern Appalachian/Acadian and St.
to biodiversity is to establish large, regional-scale sys-        Lawrence/Champlain Valley ecoregions.
tems of interconnected core reserves, selected and delin-
eated in a systematic fashion. To facilitate the flow of life     Set clear biodiversity conservation goals within a
across the entire landscape, core areas should be linked          given planning boundary There is also substantial
by corridors of wild habitat that allow the unimpeded             agreement among conservation biologists as to the opera-
movement of wildlife and natural processes such as wild-          tional goals necessary for the protection and restoration of
fire and spring floods. These interconnected wildlands            life (e.g., Noss and Cooperrider 1994, Trombulak 2001):

                                                                                                                         [7]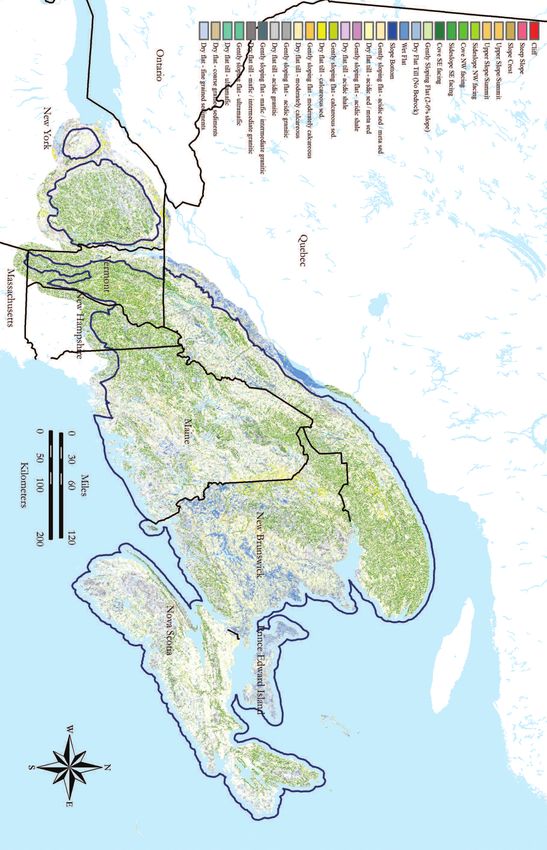
■   Represent all native ecosystem types and stages;             Follow a systematic conservation process As discussed
 ■   Maintain viable populations of all native species in         above, Margules and Pressey (2000) describe a six step sys-
     natural patterns of abundance and distribution;              tematic conservation planning approach to identify, imple-
  ■ Maintain ecological and evolutionary processes;               ment, monitor, and maintain a system of conservation areas.
  ■ Design and manage the system to be responsive to              We focus in this analysis on the first four of these steps: 1)
     change.                                                      compilation of existing data on biological resources within
     As Trombulak (2001:107) observes, “taken together,           a planning area and identification of focal species or
these goals encompass all of the levels of the biological         resources as surrogates for biodiversity; 2) establishment of
hierarchy: genes (through an emphasis on viable popula-           specific conservation features and goals; 3) evaluation of the
tions, since viability is associated with genetic diversity),     degree to which conservation goals are currently met; 4)
species, and communities. Further, these goals encompass          explicit and objective design of new conservation areas.
all three dimensions of biological organization: composi-
tion, function, and structure. The composition of biologi-        Involve a broad array of stakeholders in design and
cal communities is incorporated by the focus on all natu-         implementation It is critical to involve regional stake-
ral community types and species, structure by the focus on        holders, scientific and otherwise, in the process of design-
the full range of successional stages, and function by the        ing and implementing a network design. The draft net-
focus on processes and adaptability.” We have incorporat-         work design should also undergo rigorous expert reviews
ed these operational goals in our network design process          before a final design is released. We convened a group of
by using a three track approach (special elements, envi-          conservation scientists familiar with the Greater Northern
ronmental variation and focal species), setting conserva-         Appalachians and with the Wildlands Project’s scientific
tion goals for these features that reflect those established in   methods to help guide necessary research and analysis. We
the literature, and including key conservation system ele-        also worked closely with local partners to integrate their
ments (core areas, connectivity and buffers).                     expert knowledge of the region into draft designs.

[8]
FROM THE ADIRONDACKS TO THE MARITIMES
A Regional Overview of the rugged, forested landscape dominated by spruce, maple,
Greater Northern Appalachians beech, birch, pine, fir, hemlock and oak.
and Why They Need Protection Eighty-two percent of the region’s 82 million acres (about
and Restoration 332,000 km2) are covered by roughly equal amounts of
conifer (28 percent), deciduous (24 percent) and mixed
(24 percent) forest types. Presently, about 6 percent (4
VIEWED FRO M S PACE AT N I GH T, M UCH O F E A ST E R N
million acres, about 16,000 km2) of the forest is in an
North America is a bright web of lights. But a few areas
early successional state, most of that being “working for-
remain dark, unaffected by cities, towns, and roads. Despite
est” harvested in the last five years. The western and more
a long history of population growth, development, natural
southerly parts of the ecoregion in New York and Vermont
resource extraction, and pollution—pressures that continue
are considerably more deciduous in nature than the large
today—a surprising amount of land along the eastern edge
northeastern provinces New Brunswick, Nova Scotia and
of the North American continent is still wild. Looking at a
eastern Québec, which are chiefly coniferous.
nighttime image this way, the big, dark spaces in the north-
eastern United States and southeastern Canada stand out: There are substantial marine and coastal influences in
the Adirondacks, northern Maine, the Gaspé Peninsula of the Acadian portion of the ecoregion. According to
Québec, interior New Brunswick and the isolated reaches of Ricketts et al. (1999) this is the second richest ecoregion
Nova Scotia. This extraordinary region, what we call the for vertebrate diversity within the temperate broadleaf and
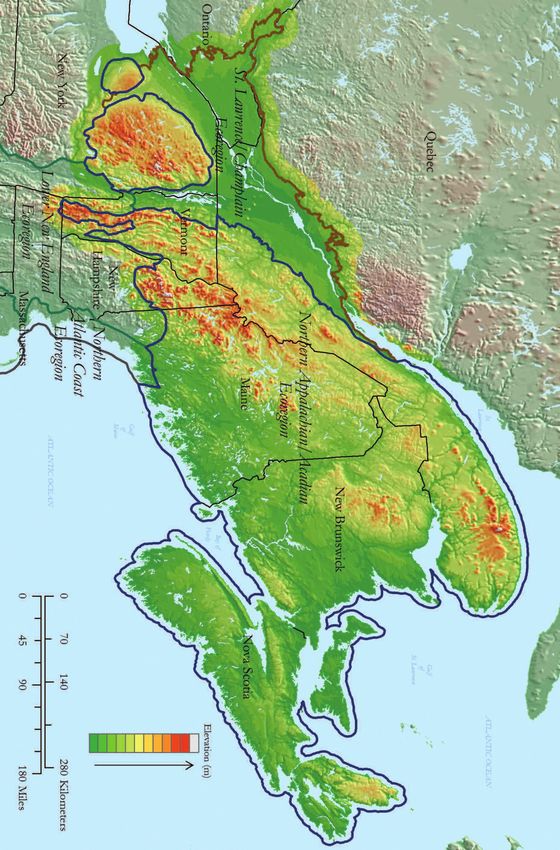
Greater Northern Appalachians (Figure 3), represents the mixed forest regions.
intersection of the cold boreal areas of Canada with the The lowlands of the Champlain and St. Lawrence val-
warmer temperate forests of the eastern United States. The leys are different enough from the Northern Appalachian/
result is a “transition forest,” a rich blend of species from Acadian ecoregion to constitute a separate ecoregion.
north and south. Its rugged topography, complex river sys- Encompassing major urban centers such as Burlington,
tems, and a long ocean coastline enhance the ecological Montreal and Québec City, the St. Lawrence/Champlain
diversity of the region. ecoregion surrounds the Adirondacks and separates them
The Greater Northern Appalachians encompasses all from the Tug Hill plateau and the main stem of the
or part of ten states and provinces (Table 1) and is a com- Appalachians. Thompson et al. (2002: 3) detail that the
bination of two ecoregions, the Northern Appalachian/ ecoregion includes “vast stretches of fertile land, rich wood-
Acadian Ecoregion and the St. Lawrence/Champlain lands, vibrant wetlands, dramatic cliffs...and hosts a num-
Valley Ecoregion. The Northern Appalachian/Acadian ber of endemic species as well as more widespread species
Ecoregion extends from the Tug Hill plateau and at the edges of their ranges. It provides critical habitat for
Adirondack Mountains of New York, across the Green migratory birds, breeding grassland birds, and wintering
Mountains of Vermont and White Mountains of New raptors. Because of its fertile soils, relatively mild climate,
Hampshire and into Maine. The ecoregion encompasses all and stunning scenery, the ecoregion has been used by
the provinces of Maritime Canada (New Brunswick, Nova humans for at least 10,000 years, and very heavily for the
Scotia and Prince Edward Island) as well as the last 300 of these.” Prior to European settlement, the fauna
Appalachian complex of eastern Québec, extending to the of this region likely resembled that of the nearby moun-
Gaspé Peninsula and Îles-de-la-Madeleine (Magdalene tainous areas, although this has changed dramatically over
Islands) (Anderson et al. 2006). The geographic bound- centuries of settlement, agriculture and logging. With
aries of the ecoregion were derived and modified by an 75% or more this area now in agricultural production, nat-
international team of scientists from standard ecological ural communities have been reduced greatly in size and are
land classification frameworks in Canada and the U.S. isolated from one another (Kavanagh et al. 2001).
(Omernick, 1987, Bailey et al. 1994, Keys et al., 1995, Li The Greater Northern Appalachians (GNA) presents
and Ducruc 1999, Marshall and Schut 1999, ECWG an extraordinary opportunity for conservation because the
2003, Neily et al. 2003). region has either retained or regained a large proportion of
Anderson et al. (2006) describe the ecoregion as a its historical forest cover (McKibben 1995; Cogbill et al.
[9]FIGURE 3 Greater Northern Appalachians showing Northern Appalachian/Acadian and St. Lawrence/Champlain
Valley ecoregions (Ecoregional boundary source: The Nature Conservancy/Eastern Resource Office).
[ 10 ]2002). Despite its predominantly wooded condition, how- try and other factors (Hagan et al. 2005, Northern Forest
ever, the habitats and species of this region suffer from a Lands Council 2005). In addition, this region appears to be
wide range of ecological impacts and face numerous ongo- facing a “latent extinction risk” as described by Cardillo et
ing threats. Today’s forests, for example, are far younger al. (2006). These researchers identified areas of the world
and less diverse than those that used to dominate the land- where mammals have biological traits that make them par-
scape (Lorimer 1977, Charles et al. 1999, Irland 1999, ticularly sensitive to future human impacts, but they are
Northern Forest Alliance 1999, 2002) and several species, not yet threatened because such impact is currently low.
such as the passenger pigeon, wolf, wolverine, elk, caribou Their study identified the “Eastern Canadian Forest,”
and mountain lion, have vanished completely or have been which encompasses much of the Greater Northern
reduced to small populations (Thompson 2002, Carroll Appalachians, as one of those areas of latent extinction risk.
2003, 2005). Climate change and mercury and acid depo- In many cases, quick action by conservationists has
sition are also major threats to the region (Carroll 2005, helped secure tens of thousands of acres (or hectares) from
Evers 2005, Anderson et al. 2006). Substantial and remote conversion to development. Despite these successes, howev-
portions of the region face threats from residential develop- er, vast tracts of ecologically important lands remain unse-
ment (Austin 2005) and new and expanded roads, ranging cured from development throughout the region (Figure 4).
from subdivision and collector roads to highways, are an In the Greater Northern Appalachians as a whole, lands
ongoing concern (Baldwin et al. In review). Compounding permanently secured from conversion to development
these problems is the increasingly rapid turnover in owner- (LPSCDs) (e.g., Status/Gap 1, 2 and 3 lands, such as public
ship of massive tracts of forestland, particularly in the U.S., conservation lands, easements on private lands, Crown lands
brought on by changes in the global forest products indus- in Canada)1 cover approximately 30% of the region (Table 2).
TABLE 1 The Greater Northern Appalachians (GNA) as distributed among ten states and
provinces (in km2 and acres, and as a percentage occupied by the state or province).
Ecoregional boundary source: The Nature Conservancy/Eastern Resource Office.
State or Province Km2 Acres Percent of GNA Region
Maine 76,680 18,948,122 19.7%
Massachusetts 73 18,016 0.0%
New Brunswick 73,087 18,060,252 18.8%
New Hampshire 7,984 1,972,929 2.1%
New York 38,439 9,498,511 9.9%
Nova Scotia 56,015 13,841,696 14.4%
Ontario 13,562 3,351,305 3.5%
Prince Edward Island 5,897 1,457,192 1.5%
Québec 96,785 23,916,037 24.9%
Vermont 20,018 4,946,477 5.2%
Total 388,541 96,010,538 100%
1. The idea of lands permanently secured from conservation to development (LPSCDs) emerged during a meeting in February 2006 of scientists associated
with Two Countries, One Forest (2C1Forest), a bi-national collaborative seeking to advance conservation in the Northern Appalachian/Acadian ecoregion.
These scientists realized that “protected areas” or “conservation areas” were inadequate to describe the wide range of lands that are off limits to residential
development but may be subjected to a wide range of management practices, some of which, like conversion to plantations and clearcutting, may have
substantial effects on biodiversity. The LPSCD term acknowledges this broad range of management regimes within this set of lands that are off-limits to
residential development. See Crist (2000) for more information on mapping and categorizing land stewardship. LPSCD status levels correspond to the
three main types of conservation land identified under the GAP regional species and analysis program, as follows: Status 1—An area having permanent
protection from conversion of natural land cover and a mandated management plan in operation to maintain a natural state within which disturbance
events (of natural type, frequency, intensity, and legacy) are allowed to proceed without interference or are mimicked through management. Status 2—
An area having permanent protection from conversion of natural land cover and a mandated management plan in operation to maintain a primarily natu-
ral state, but which may receive uses or management practices that degrade the quality of existing natural communities, including suppression of natural
disturbance. Status 3—An area having permanent protection from conversion of natural land cover for the majority of the area, but subject to extractive
uses of either a broad, low-intensity type (e.g., logging) or localized intense type (e.g., mining). It also confers protection to federally listed endangered
and threatened species throughout the area. (LPSCD data source: TNC/Eastern Resource Office).
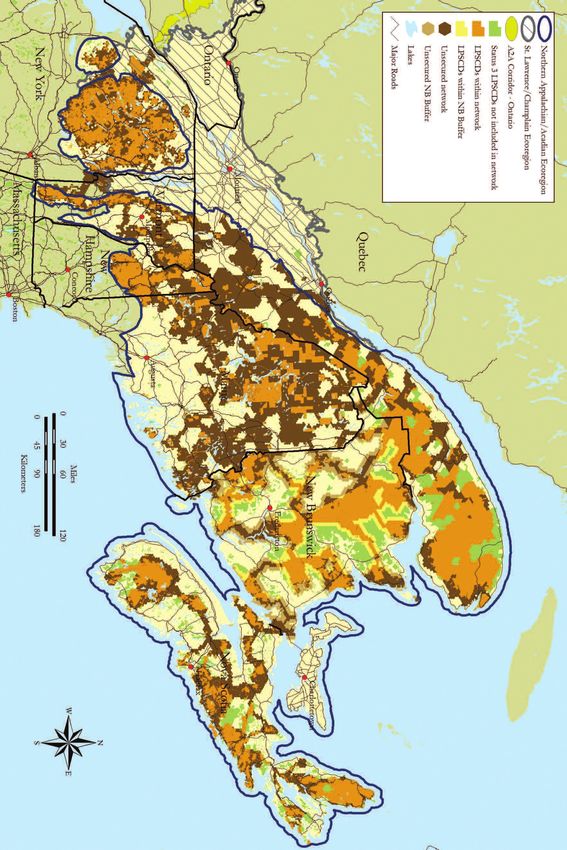
[ 11 ]FIGURE 4 Greater Northern Appalachians study boundary, with Status 1, 2 and 3 lands permanently secured from conversion to development (LPSCDs). LPSCD coverage
is current as of early 2006, although it does not include some important areas, such as the large conservation easements recently established in Downeast Maine.
[ 12 ]Within the GNA region there is broad variation in New York, on the other hand, makes up roughly 10% of
the extent and distribution of lands secured from develop- the GNA region—about half the area of Maine—but it
ment. Maine, for example, which makes up nearly 20% of contains about 12% of the lands secured from develop-
the Greater Northern Appalachians (refer to Table 1), con- ment, much of it in the Adirondacks.
tains only about 10% of these secured lands (Table 3). The Wildlife Conservation Society Canada and Two
Large blocks of northern Maine are in private ownership Countries, One Forest are working to understand the cur-
with no guarantee of protection from future development. rent and future threats in the region and to map them in a
TABLE 2 Extent of Status 1, 2 and 3 lands permanently secured from conversion to development (LPSCDs) by state and
province within the Greater Northern Appalachians study area (Source: TNC/Eastern Resource Office). No extraction of
natural resources is permitted on status 1 and 2 lands. Extraction is permitted on status 3 lands.
Status 1 & 2 (no extraction permitted) Status 3 (extraction permitted)
State or Province km2 Acres % of study area km2 Acres % of study area
Maine 2,199 543,421 0.6% 9,109 2,250,979 2.3%
Massachusetts 0 26 0.0% 24 5,958 0.0%
New Brunswick 2,192 541,573 0.6% 32,308 7,983,539 8.3%
New Hampshire 1,771 437,584 0.5% 2,325 574,459 0.6%
New York 10,196 2,519,392 2.6% 3,373 833,489 0.9%
Nova Scotia 4,492 1,110,104 1.2% 13,500 3,335,972 3.5%
Ontario 17 4,152 0.0% 0 0 0.0%
Prince Edward Island 69 17,118 0.0% 2 529 0.0%
Quebec 3,161 781,003 0.8% 25,377 6,270,859 6.5%
Vermont 650 160,554 0.2% 2,959 731,111 0.8%
Totals 24,746 6,114,927 6.4% 88,978 21,986,896 22.9%
TABLE 3 Status 1, 2 & 3 conservation lands in the states and provinces as a percentage of all
conservation lands, and showing the ratio of the area of LPSCDs in a state or province to the amount
of land the state or province occupies in the study area.
Ratio of LPSCDs to
state/province area
State or Province Status 1 & 2 Status 3 Status 1, 2 & 3 in study area
Maine 8.9% 10.2% 9.9% 0.50
Massachusetts 0.0% 0.0% 0.0% 1.13
New Brunswick 8.9% 36.3% 30.3% 1.61
New Hampshire 7.2% 2.6% 3.6% 1.75
New York 41.2% 3.8% 11.9% 1.21
Nova Scotia 18.2% 15.2% 15.8% 1.10
Ontario 0.1% 0.0% 0.0% 0.00
Prince Edward Island 0.3% 0.0% 0.1% 0.04
Québec 12.8% 28.5% 25.1% 1.01
Vermont 2.6% 3.3% 3.2% 0.62
Totals 100.0% 100.0% 100.0%
[ 13 ]spatially explicit way. These mapping efforts take the form ical analyses of past patterns and trends as well as model- of the Current and Future Human Footprints. Building ing landuse use transitions, highlighting increasing upon the global methodology developed by the Wildlife threats from, amenity-focused development in wild areas Conservation Society and Center for International Earth such as around lakeshores. Science Information Network (Sanderson et al. 2002), the The threats facing this region, combined with vast Current Human Footprint (CHF) analysis measures direct opportunities for conservation and advances in conserva- human influence on the land within the ecoregion based tion science, prompted The Nature Conservancy (TNC) on four categories of Human Influence: Access (roads, rail), and its partners to begin pursuing comprehensive conser- Human Habitation (population density, dwelling density, vation planning for the Northern Appalachian/Acadian urban areas), Human Landuse (agriculture, development, and St. Lawrence/Champlain Valley ecoregions in the late forestry, mining, large dams) and Electrical Power 1990s (Anderson et al. 1998). A key part of this planning Infrastructure (utility corridors). The resulting high reso- in the Northern Appalachian/Acadian ecoregion involved lution (90 meter) map displays a composite of Human identifying large representative examples of the “matrix- Influence relative to the ecoregion that reveals not only the forming” forests (matrix blocks) that dominate the land- remaining wildness and potential ecological linkages scape (Anderson et al. 1999; 2006). Many of the datasets within the area, but also identifies potential low-cost developed as part of their ecoregional planning process opportunities for conservation action, priority areas for were generously shared with us and have been used to cre- restoration, and hotspots of human development that pres- ate the wildlands network design described in this docu- ent barriers to regional connectivity (Woolmer et al. In ment. The processes used by TNC to delineate the matrix prep.). The Future Human Footprint (FHF) aims to fore- blocks, and how we took their locations into account as we cast impacts from human development into the future. developed our network design, are described below The FHF is based on scenarios for the future growth of (Methods for Creating the Wildlands Network Design) population, roads, and dwellings derived, from geograph- and in Appendix 1. [ 14 ]
A WILDLANDS NETWORK DESIGN FOR THE
GREATER NORTHERN APPALACHIANS

Study Area                                                                           subsequently consolidated in consultation with a TNC
                                                                                     ecologist by combining similar categories within each ele-
Our study area consists of the intersection of two ecoregions                        vation, geology and landform class. The final layer con-
defined by The Nature Conservancy (TNC), the Northern                                sisted of 162 unique combinations of elevation, geology
Appalachian/Acadian and the St. Lawrence/Champlain                                   and landform (Figure 5, Appendix 2)
Valley ecoregions, and encompasses 388,541 km2
(91,145,138 acres) (refer to Figure 3). For purposes of site                         Special Elements For our special elements track we used
selection analyses, the study area is further buffered, extend-                      a geographic data layer of modeled occurrences of small to
ing into a small portion of the Lower New England ecore-                             moderately-sized, high-quality ecosystems developed by
gion, south of Lake Champlain and the mountains of                                   the Eastern Regional Office of TNC. This database con-
Vermont. Despite gaps in uniform data availability for some                          sisted of nine ecosystem types: Open Wet Basins, Pine
of these ecoregions, we chose to maintain these study area                           Barrens, Open Dry Flats, Beach Dune, River
and buffer boundaries because important wildlife linkages                            Systems/Coves, Floodplain, Forested Wetlands, Steep
likely fall within the St Lawrence/Champlain and Lower                               Slopes and Cliffs, and Summits. Predicted occurrences of
New England ecoregions, and buffering is advantageous to                             each of the types were first modeled with existing ecolog-
take into account important contextual information just                              ical data. Modeled occurrences were then reviewed by
outside the study area. Data limitations are discussed below.                        regional experts and high-quality occurrences of each type
                                                                                     were identified (Anderson et al. 2006). In this study we
                                                                                     used only these high-quality occurrences as input data.
Three-track Approach to                                                                   In most such analyses, rare, threatened and endan-
Conservation Planning                                                                gered species occurrence data (e.g., G1 [critically imper-
                                                                                     iled globally] to G3 [vulnerable globally] and S1
The conservation planning methodology that we applied                                [extremely rare at state/province level] to S2 [very rare at
in the GNA region focused on environmental variation,                                state/province level]) as defined by TNC and other Natural
special elements, and focal species, and is described more                           Heritage programs) are used. However, in the case of the
fully as follows.                                                                    Greater Northern Appalachians study area, our data were
                                                                                     of inconsistent availability and of questionable reliability.
Environmental Variation To represent the variation in                                In particular, different species were monitored in each
ecological conditions that exists across the region, we used                         state and province, and we could not access data for Maine
a data layer of Ecological Land Units (ELUs) developed by                            and the Canadian provinces. Consequently, we used
The Nature Conservancy (TNC) (Anderson et al. 1999,                                  ecosystem occurrences 1) as a surrogate or coarse filter for
2006; Groves et al. 2003). ELUs are unique combinations                              these species-based data and 2) to represent places of high
of three environmental factors—elevation, geology and                                conservation value (geographical clusters of diversity and
landform—that are important to the distribution and                                  rarity), as is also consistent with the definition of special
abundance of ecological communities in the ecoregion.                                elements2 provided by Noss et al. (1999b). Ideally, if data
Analyses by TNC and its partners indicate that smaller-                              sets are reasonably uniform, either rare species element
scale ecosystems, communities and species locations are                              occurrences or modeled occurrences of ecosystems, or both,
highly correlated with the types and diversity of ELUs                               could be used as special elements.
(Anderson et al. 2006). The original ELU layer provided
by the TNC consisted of many hundreds of unique com-                                 Focal Species Focal species planning complements spe-
binations of elevation, geology and landform. These were                             cial elements and representational (or environmental vari-

2. Special elements are species and places of high conservation value such as critical areas for species at risk and geographical clusters of diversity and rarity
   (Noss et al. 1999b).

                                                                                                                                                           [ 15 ]
FIGURE 5 Ecological land units in the Northern Appalachian/Acadian ecoregion (Data source: The Nature Conservancy/Eastern Resource Office).
[ 16 ]ation) approaches to the wildlands network design process. ing ecological scenarios.3 Source habitats are areas with
Special elements and representation help identify areas to positive predicted population growth rates. For the wolf
include in the network, whereas focal species are used prima- there are two data layers: 1) predicted source habitat under
rily to help address how large the network components should be current landscape conditions, and 2) predicted threatened
and how they should be configured (Miller et al. 1998). A care- source habitat under a condition of future landscape
fully selected set of focal species, effectively representing a change due to human population growth. For the lynx
broad range of life requisites, can be seen as surrogates for there are four data layers. The first pair of data layers con-
the protection of many other species. sists of 1a) base scenario prediction of source habitat with
We used data from a focal-species analysis (Carroll no population cycling, and 1b) predicted threatened
2003, 2005) that identified areas of high quality (source) source habitat under scenario with population cycling.
habitat for three species of carnivores: Canada lynx (Lynx The second pair consists of 2a) base scenario prediction of
canadensis), American marten (Martes americana), and east- source habitat with population cycling and no trapping of
ern gray wolf (Canis lupus, or Canis lycaon [after Wilson et lynx, and 2b) predicted threatened source habitat under
al. 2000]). These three mammalian carnivores are native to scenario with population cycling and trapping. For the
the study area but are considered threatened or extirpated American marten, there are also four data layers. The first
in some or all of the region. These three species differ in pair consists of 1a) base scenario prediction of source habi-
their basic habitat requirements and the factors responsi- tat with trapping, and 1b) predicted threatened source
ble for their decline (Carroll 2005). Vertebrate carnivores habitat under increased trapping pressure. The second pair
are used as focal species because they are vulnerable or sen- of data layers consists of 2a) base scenario prediction of
sitive to human activities and human-induced landscape source habitat under a scenario of habitat restoration, and
change (Weaver et al. 1996, Lambeck 1997, Carroll et al. 2b) predicted threatened source habitat under a scenario of
2003). Lynx and marten are especially important in the timber harvest. In total, 10 data layers were used to repre-
Greater Northern Appalachians because their populations sent the habitat requirements for the three focal species
represent “peninsular extensions of broader boreal ranges (Figure 6). These and other scenarios are described in more
(Carroll 2005:3).” As such they may be particularly sensi- detail in Carroll (2003, 2005).
tive to climate change, such as changes in snowfall, and
represent unique ecotypes of these species at the southern
limit of their range (Carroll pers. comm. 2006). Site Selection
In developing the focal-species analyses, Carroll, a car-
nivore biologist with extensive experience in model devel- As discussed above, effective conservation planning relies
opment, obtained focal species data, and derived resource- upon explicit, systematic and efficient methodologies to
selection functions (RSFs) (Boyce and McDonald 1999) evaluate and rank myriad scenarios for a conservation area
and dynamic, individual-based models (e.g. PATCH, system in a given landscape (Margules and Pressey 2000).
Schumaker 1998) for these three species. Carroll built on Recent advances in the field of conservation area system
extensive regional research on wolf (e.g., Harrison and design have provided the tools necessary to evaluate alter-
Chapin 1998, Mladenoff and Sickley 1999, Paquet et al. native scenarios (Soulé and Terborgh 1999, Scott et al.
1999), lynx (e.g., Hoving 2001, Hoving et al. 2003, 2001, Andelman and Willig 2003, and Rodrigues et al.
2004, 2005) and marten (e.g., Hepinstall et al. In prep., 2004). The primary aim of the conservation area design
Chapin et al. 1998, Payer and Harrison 2003) to provide process is to select the minimum suite of sites that effec-
analyses of habitat, population viability and conservation tively meets designated conservation goals (Leslie et al.
needs for the study area. 2003). While there exist a variety of computer-based sit-
Though the input data varied for each species, they ing algorithms (e.g., simulated annealing, iterative, opti-
generally consisted of spatially-explicit predictions of mizing) that are designed to meet a set of conservation
source habitat and of source habitat threatened under vary- goals based on a set of conservation features or targets (see
3. Threatened source habitat represents areas that occupy the upper right quadrant of irreplaceability/vulnerability graphs developed as part of the spatially
explicit population modeling. Irreplaceability in this context is the relative value of an area as source habitat for a given species. Vulnerability is the like-
lihood that a site’s conservation value will be reduced over time. Values were plotted on a graph of irreplaceabiity (y-axis) versus vulnerability (x-axis),
and the graph is divided into four quadrants. The upper right quadrant includes sites with high irreplaceability and high vulnerability – threatened
sources. These areas remain source habitat even under the threat scenarios. See Carroll (2005) and Carroll et al. (2003) for a detailed discussion.
[ 17 ]FIGURE 6 Predicted source and threatened source habitats for three focal species (Data source: Carroll 2003, 2005). [ 18 ]
review in Leslie et al. 2003), the simulated annealing algo-     2471 acres). The hexagonal shape provides a number of
rithm has been shown to meet conservation goals more             benefits. First, it approximates a circle and provides the
effectively than other approaches (Ball 2000, Possingham         benefits of relatively smooth coverage of the planning area
et al. 2000), so we use that algorithm in this analysis.         and a low edge-to-area ratio. Second, the smaller size will
      For each of the 181 conservation features (162 for         maximize the amount of internal homogeneity of a given
environmental variation, 9 for special elements, and 10 for      planning unit and thus help increase the efficiency of the
focal species), we compiled spatial data and set conserva-       site selection algorithm. Third, when the hexagons are rel-
tion goals (described below in Conservation Goals). Site         atively small, it will be easier to adapt the outputs of the
selection software was used to generate alternative reserve      site selection algorithm to political boundaries and natural
design solutions, specifically MARXAN (v1.8.2), a soft-          features (e.g., watersheds). The 1000 hectare (ha) size was
ware program for site selection (Ball and Possingham             sufficient to be larger than the coarsest data input, yet small
2000; Possingham et al. 2000). MARXAN allows for the             enough to be useful for on-the-ground conservation efforts.
use of a spatially explicit simulated annealing optimiza-        Finally, it is adequately large to result in a manageable
tion method to find a set of planning units that meets           number of planning units across the study area so as to not
identified conservation goals while minimizing costs. The        exceed the computational limits of the software.
objective function used by MARXAN’s simulated anneal-                 An integral part of a systematic approach to the
ing algorithm (hereafter referred to as a MARXAN analy-          design of reserve systems is to evaluate the conservation
sis) is as follows:                                              status of planning units, specifically to identify existing
                                                                 protected areas as well as those areas unavailable to con-
  TotalCost=   ∑ Cost+BLM ∑ Boundary+ ∑ CFPF*                    servation efforts. The MARXAN software allows for indi-
               Sites           Sites         ConValue            vidual planning units to be automatically included or
           Penalty+CostThresholdPenalty(t)                       excluded from the reserve design solution. One option is
                                                                 to “fix” or “lock” individual planning units into the initial
     In this equation, TotalCost is the total cost of the        reserve, and consequently, during the simulated annealing
reserve system used to compare alternative solutions; Cost       process, the planning units will be “fixed” into the final
is a measure of the cost, often the area, of each of the sites   solution. Another option is to fix/lock individual planning
within the reserve system; Boundary is the length of the         units out of the initial reserve and, during the simulated
boundary of the reserve system; BLM is the user defined          annealing process, the planning units will be excluded
boundary length modifier; CFPF, or conservation feature          from the final solutions.
penalty factor, is the penalty factor for not reaching a con-         To designate whether an individual planning unit
servation goal; and CostThresholdPenalty is a penalty            should be fixed in the reserve design, we used existing
added if the cost is exceeded. These MARXAN parameters           information on the distribution of lands permanently
are discussed in more detail below. The TotalCost of a spe-      secured from conservation to development (LPSCDs,
cific simulated annealing run can then be compared to            Figure 4). We locked into the reserve design analyses all
other such runs within the same set of input parameters,         hexagons with LPSCD Status 1 or 2 comprising >= 75%
or across different sets of input parameters.                    of the 1000 ha hexagon. All hexagons with >= 50% of the
                                                                 1000 ha hexagon in urban zones, as derived from ESRI
Planning Units                                                   (2002) datasets, were locked out of the reserve design
                                                                 analyses. This serves to exclude areas whose current state
The aim of the reserve design process is to select a suite of    of land conversion or development offers few opportunities
planning units that, when incorporated into a reserve sys-       for conservation even though they may potentially repre-
tem, meets a set of predetermined conservation goals. The        sent conservation features.
process for setting conservation goals is described below.            In preliminary site selection runs we also examined a
Planning units are the spatial areas into which the study        number of runs without locking in hexagons meeting the
area is divided for the purposes of analyses and with which      protected area cut-off. Site selection results with protected
the data are associated, typically as hexagonal or square        areas locked in or out did not visibly differ from one anoth-
grid cells of a consistent size. In our study, we chose a        er. Given few visible differences, we chose only to examine
hexagonal planning unit with a size of 1000 hectares (about      runs with protected areas locked into the final solution.

                                                                                                                        [ 19 ]
Sensitivity Analysis for the lynx and American marten. Here, we assigned each
of the four lynx and four American marten features a
Within the conservation area design process, a number of penalty factor = 1, and assigned the two wolf features a
input parameters influence the final conservation area penalty factor = 2, essentially weighing the wolf features
design, such as the choice of conservation features, specif- equal to the lynx and American marten features.
ic goals for those features, or the weight given to frag-
mentation (or spatial cohesiveness) parameters. It thus Boundary Length Fragmentation of habitat and reserves
becomes vital to assess the sensitivity of the selection frequently has detrimental effects on the health of such
process to variations in certain input parameters. To inves- reserves and their ability to support biological diversity
tigate the sensitivity of the site selection process to varia- (Newmark 1985, 1995; Paquet and Callahan 1996,
tions in two primary input parameters, we examined the Gibeau and Heuer 1996, Forman et al. 1997). In a reserve
sensitivity of the algorithm to variations in conservation system, one measure of fragmentation is the length of the
goals by setting four different combinations of conserva- reserve boundary relative to the area of the reserve. For a
tion goals, as described below. Second, we examined the given total area of a reserve system, a longer total bound-
sensitivity to variations in the algorithm’s boundary ary length would be characteristic of a fragmented system,
length modifier (BLM) a parameter that influences the spa- while a shorter length would characterize a relatively
tial cohesiveness of the planning units, and thus the con- unfragmented reserve. MARXAN allows the user to con-
figuration of the network. We conducted these analyses trol the degree of fragmentation or spatial cohesiveness in
with the goal of identifying planning units within a con- a reserve design by including a boundary length modifier
servation area system that were relatively insensitive to in the objective function.
variations in these two parameters. To explore the effects of the boundary length modifi-
er (BLM) on the reserve design, we varied the value of the
BLM in our analyses. After initial trial runs to determine
MARXAN Parameters workable values, we chose to run reserve design analyses
using three boundary length modifier values: 0, 0.001,
MARXAN allows the user to customize a range of model and 0.01. This range of values balances the benefits in flex-
parameters, and thereby influence kinds of outputs pro- ibility and efficiency of using an unrestricted run (i.e., 0,
duced by the model. We describe below four of the key which has no influence over clumping) with levels of spa-
parameters that we varied in the course of this analysis: tial cohesion more realistic for ecological functioning such
site cost, species penalty factor, boundary length modifier, as species dispersal and migration.
and goals for various conservation features.
Conservation Goals Conservation goal setting presents
Site Cost The cost of including an individual planning many challenges, especially with the increasing emphasis
unit into the final reserve design is considered in the cal- on considering conservation at multiple spatial scales (Tear
culation of the total portfolio cost. This cost can be the et al. 2005). Ideally one would establish a single quantita-
monetary cost of the land, but such information is not uni- tive goal for a given conservation feature based on exten-
formly available at the scale of the study area, so we sive understanding of the needs of a given species or
assigned each planning unit a cost = 1. Under this desig- ecosystem. These data are rarely available, however, espe-
nation, the model total portfolio cost is driven by the con- cially for more than 180 individual conservation features,
servation features and the model will seek to minimize the so we adapted a method used by researchers modeling
area of the final conservation portfolio. marine protected areas off the coast of British Columbia
(Ardron 2003). Accordingly, rather than use a single set of
Species Penalty Factor In addition to assigning a cost parameters, we chose a range of scenarios based on differ-
to individual planning units, MARXAN allows the user ent boundary length modifiers and goals for given targets.
to assign a penalty factor to individual features for not From these, we then examined the results for trends,
meeting conservation goals. For all ELU and special ele- focusing on areas that emerge under a variety of condi-
ments features, we assigned a species penalty factor = 1. tions. Those areas that are selected repeatedly can be inter-
We altered this assignment, however, for the focal species preted as having a high utility or usefulness for the overall
where we had two features for the wolf and four features design. While they may not necessarily meet all the goals,
[ 20 ]You can also read