INCREASING ACCESS TO DENTAL SERVICES FOR CHILDREN AND ADULTS ON THE CENTRAL COAST - BARBARA AVED ASSOCIATES
←
→
Page content transcription
If your browser does not render page correctly, please read the page content below
BARBARA AVED
                          ASSOCIATES

INCREASING ACCESS TO DENTAL SERVICES
           FOR CHILDREN AND ADULTS
               ON THE CENTRAL COAST

                              April 2016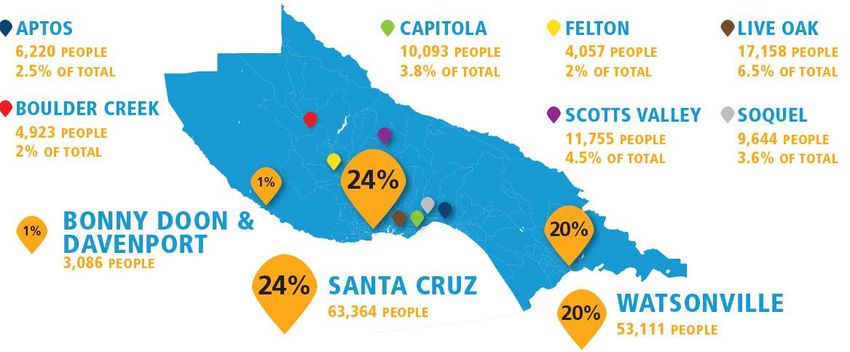
The report Increasing Access to Dental Services for Children and Adults on the Central Coast
would not be possible without underwriting by The Stanley and Audrey Goldstein Foundation, who
have a deep understanding of the need for oral healthcare for all. Dientes Community Dental Care,
which commissioned this oral health needs assessment, is profoundly grateful for their support.

Increasing Access to Dental Services for Children and Adults on the Central Coast           1
BARBARA AVED ASSOCIATES/April 2016
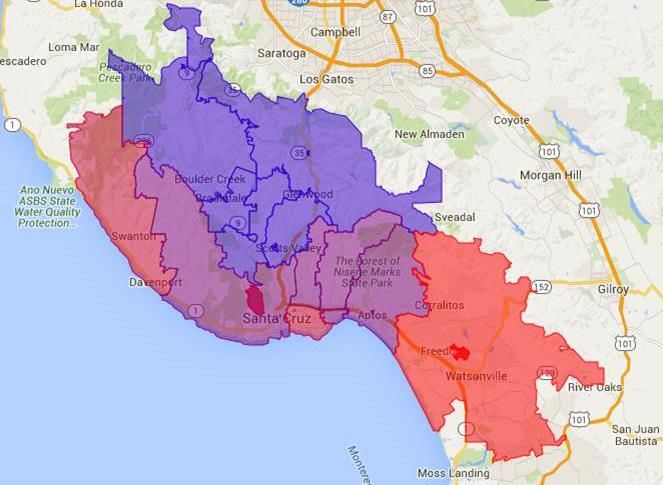
Table of Contents
EXECUTIVE SUMMARY ..................................................................................................................3
INTRODUCTION ..............................................................................................................................7
  Purpose of the Assessment ...........................................................................................................8
  Acknowledgements ........................................................................................................................8
METHODS ........................................................................................................................................9
FINDINGS ......................................................................................................................................10
     I.   Emerging Trends and Conditions in Dental Care .................................................................10
     II. Regional Profile ...................................................................................................................13
             Demographic Profile .........................................................................................................13
             Socioeconomic Factors ....................................................................................................17
             Other Related Community Characteristics ........................................................................29
     III. Extent of Dental Disease among Children and Adults .........................................................31
     IV. Overview of the Medi-Cal Dental Program...........................................................................33
             Required Benefits .............................................................................................................33
             Administration of the Dental Program ...............................................................................34
             Medi-Cal Dental Services Reimbursement .......................................................................35
             Statewide Provider Participation in Denti-Cal....................................................................36
             Utilization Measurement and Monitoring in Medi-Cal ........................................................37
             Improvements Planned for Denti-Cal ................................................................................37
             Changes in Covered California .........................................................................................38
     V. Access Factors ....................................................................................................................39
             Common Barriers to Getting Oral Health Services ............................................................39
             Local Dentist Supply and Denti-Cal Provider Ratios .........................................................42
             Local Dentists’ Opinions and Experience with Denti-Cal ...................................................42
             Other Dental Insurance Programs Available to Low-Income Persons ...............................51
             Available Safety Net Dental Services ...............................................................................51
             Other Supportive Community Resources ..........................................................................57
             Access Barriers to Hospital and Surgery Center-Based Dental Procedures .....................59
             Extent of Emergency Department Use for Preventable Dental Conditions ........................61
     VI. Dental Services Utilization ...................................................................................................67
             Population-Based Utilization .............................................................................................67
             Denti-Cal Utilization ..........................................................................................................70
             Healthy Kids Utilization .....................................................................................................74
             Head Start Utilization ........................................................................................................75
CONCLUSIONS AND RECOMMENDATIONS ...............................................................................76
APPENDICES .................................................................................................................................85

Increasing Access to Dental Services for Children and Adults on the Central Coast                                                        2
BARBARA AVED ASSOCIATES/April 2016
EXECUTIVE SUMMARY
“Nothing hurts in my kid’s mouth. Why does he need to see a dentist?”
— Parent respondent to the Denti-Cal member survey
Good oral health is increasingly recognized for its importance to overall health, as well as its
influence on how people appear, work, enjoy life, succeed in school, speak, chew and socialize.
While most children and adults living in Santa Cruz and Monterey Counties enjoy good oral health
and report being able to get the dental care they need, many of them do not.
This report presents findings and recommendations from an oral health needs assessment
commissioned by Dientes Community Dental Care to benefit Santa Cruz and Monterey Counties.
Its goal was to use the assessment information for developing a multi-stakeholder approach to
serving more of the dental need in these two counties. The study was carried out by Barbara Aved
Associates and addressed the needs, barriers, resources, and access and utilization issues
commonly examined in an environmental scan. The scope of the assessment included children
and adults under age 65 not living in nursing or other facilities.
Existing research, data retrieval and analysis, key informant interviews, and surveys were the
primary sources of information for the study. The findings provide an opportunity to address gaps
where continuing collaboration among the stakeholders will be essential for implementing the
recommended strategies.
Key Findings1
Regional Profile Factors
While the unemployment rate has improved since the recent recession, rates in both counties
were higher than the statewide average in November 2015: 7.1% unemployment in Santa Cruz
and 7.5% in Monterey compared to 5.7% statewide.
Educational attainment (high school diploma or higher) is lower in Monterey County than
statewide, 71% vs. 81%. (Santa Cruz is 85%.) Education level has important implications
because higher educational attainment is positively associated with health-protective factors like
receiving regular dental care.
Santa Cruz and Monterey Counties are home to a larger share of agricultural workers than other
counties in California, important because farmworkers of all ages have a level of oral health that is
worse than what is found in the general population. While they value dental services, agricultural
workers face unique barriers to accessing it.
Emerging Dental Care Trends
1
To streamline the Executive Summary, references and other citations are only included in the full report.
Increasing Access to Dental Services for Children and Adults on the Central Coast 3
BARBARA AVED ASSOCIATES/April 2016
Increased access to oral health services for children over the past decade and a half is
expected to lead to an adult population with reduced dental disease and less need for
restorative dental care.
The percentage of adults who visit a dentist has been declining for the past decade among all
income groups as have adult dental benefits; there will likely be continued erosion of dental
benefits for many groups of adults.
Medi-Cal represents one of the few market segments with expanding demand for dental care.
Prevalence of Oral Disease
24% of the children in Santa Cruz County and 15.5% in Monterey County showed evidence of
untreated dental decay according to recent screening results of reporting school districts.
12,634 low-income adults in Santa Cruz County are estimated to have some level of oral
disease, and 2,392 have severe periodontitis, the more advanced form of periodontal disease.
Medi-Cal Dental Program (Denti-Cal) Factors
Denti-Cal is the major source of public insurance for the area’s low-income children and adults,
covering 28.2% of the Santa Cruz population and 34.7% in Monterey County. Denti-Cal policies,
procedures and reimbursement rates strongly influence access and utilization on the local level.
California’s Denti-Cal reimbursement rates are among the lowest in the nation and account for the
top reason most dentists aren’t willing to participate in the program.
The State has said the dental program is a priority, but new dental strategies of the recently-
approved Medi-Cal Waiver do not benefit adults. This is troubling given their great need for care
and the narrow scope of adult dental benefits.
The Central California Alliance for Health is the local contractor for Medi-Cal patients but the
responsibility for providing direct dental services is not under its contractual obligations (it is a
“carved out” service). Nevertheless, the Alliance has an important role to play in ensuring dental
access for its Medi-Cal members.
Current Access Issues
The overall supply of licensed dentists is ample in both counties but 82% report not taking
patients with Denti-Cal. Those who do don’t take enough.
Denti-Cal utilization rates for children and adults vary widely by zip code in both counties. Even
though numbers are small in some areas, very low utilization suggests an access problem.
Santa Cruz County dental clinics are at full capacity. Salud Para la Gente receives about 10
calls a week for new adult patients looking for a dentist it cannot accommodate. Dientes
receives twice that number each day that has to be referred elsewhere or experience a long
wait for an appointment.
Close to half (47.3%) of surveyed Central Coast dentists said a rate increase of 70%-80% would
be necessary for them to see patients with Denti-Cal in their practice.
Increasing Access to Dental Services for Children and Adults on the Central Coast 4
BARBARA AVED ASSOCIATES/April 2016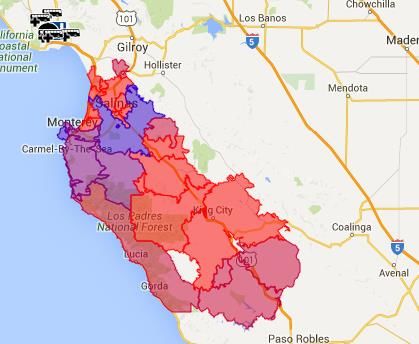
Only 29.5% of surveyed dentists who serve children start seeing them by the recommended first
tooth/first birthday.
72.5% of the emergency department visits for a dental condition by Santa Cruz County
residents in 2014 were considered preventable; the proportion by Monterey County residents
was 95.1%. The 6 EDs in Santa Cruz and Monterey Counties reported 2,392 ED visits for a
preventable dental condition. Public programs (Medi-Cal, primarily) picked up the tab for the
greatest majority of these visits.
Access problems related to dental anesthesia services are attributable to provider and facility
availability, not to the pre-authorization process. Resource options are limited for publicly
insured (or Medi-Cal) children and adults in Santa Cruz County; capacity to serve children is
only available in Monterey County.
For people on Medicare (including adults over age 65), dental services are not a covered
benefit.
Dental Services Utilization
Monterey and Santa Cruz were 2nd and 3rd best in the state in children’s Denti-Cal utilization in
2014, 64.4% and 58.6%, respectively; the state average was 52%.
Utilization in Healthy Kids mirrors Denti-Cal rates. The jump in utilization for age 0-3 between
2013-14 and 2014-2015 was significant (a percentage increase of 71%). The increase in
utilization for children age 2-6 was also notable (a 32% increase).
Use of Denti-Cal benefits by adults age 21-64 in both counties is extremely small—17.6% in
Santa Cruz and 18.3% in Monterey.
66.5% of Santa Cruz County Community Assessment Project (CAP) survey respondents at all
income levels reported getting dental care in 2015, lower than 85.8% reported in 2013. Whites
reported receiving it at a higher percentage than Latinos did (74% vs. 59%).
The percent of CAP respondents with dental insurance decreased to 58% in 2013 from 72% a
decade ago.
Conclusions and Recommendations
In addition to the robust FQHC safety net, many other local organizations play vital roles in
supporting oral health services via collaboration, training, promotion, assessments, and financial
support. Santa Cruz County is fortunate to have forward-thinking dental health leadership and
advocates. The recommendations on the next page, which are driven by the assessment findings
and fully explained in the report, are intended to improve oral health as well as suggest certain
areas for growth. There is no particular significance to their order.
1. Expand access to care in high-need communities by adding new clinical capacity.
2. Expand the use of mobile clinic resources to extend care.
3. Consider FQHC contracting with private dentists.
Increasing Access to Dental Services for Children and Adults on the Central Coast 5
BARBARA AVED ASSOCIATES/April 2016
4. Implement a “First Tooth/First Birthday” campaign countywide.
5. Design and implement an oral health promotion program specific to pregnant women.
6. Increase opportunities to promote oral health education and access for Medi-Cal managed care
   members.
7. Improve access for patients requiring sedation dental services.
8. Encourage schools to continue the AB 1433 pre-Kindergarten dental visit requirement to ensure
   children are accessing care by the age of 6, and to participate in the centralized online reporting
   of student oral health data.

9. Implement more models of medical-dental integration.

10. Reduce use of the emergency department (ED) for preventable dental conditions.
11. Continue to support and improve the United Way Community Assessment Project.
12. Advocate for higher Medi-Cal dental reimbursement rates.

13. Work toward supporting full-scope dental care (up to the Denti-Cal benefit) at all FQHCs.
14. Increase the proportion of communities with fluoridated community water systems.
15. Share the needs assessment information with decision makers, policymakers, and stakeholders
    through oral and written briefings.

Increasing Access to Dental Services for Children and Adults on the Central Coast                6
BARBARA AVED ASSOCIATES/April 2016
INTRODUCTION

    “Adults [on Medi-Cal] have such extensive needs that they take up a lot of service capacity.
                      Kids are easier to see .”– Community Dental Provider

There is an increasing recognition of the importance of oral health to overall health, and what
signals of health disorders the mouth can provide. Over the past decade, evidence has been
building of a relationship between oral disease and diabetes2 as well as cardiovascular disease and
its complications, including stroke.3 Evidence has also been accumulating of an association
between periodontal disease and adverse birth outcomes.4 Recent research has found significant
annual cost savings are possible with individuals with certain chronic diseases or who were
pregnant, and who received dental treatment for their gum disease.5 There is also a growing
appreciation for the psychosocial impact of oral health influencing how people appear, work, enjoy
life, speak, chew and socialize.6

Early childhood caries—the most prevalent unmet health care need for children nationwide7—is
especially troubling because it is preventable. Untreated tooth decay can cause pain and infections
that may lead to problems with learning;8 children with poorer oral health miss more school days,9 for
example. Importantly, oral diseases are progressive and cumulative and become more complex over
time. Access to early preventive care and necessary dental treatment, particularly for the
populations at highest risk, is the key.

While access to oral health services in Santa Cruz and Monterey Counties has improved as a result
of community leadership and commitment, opportunities exist for strengthening it, as this needs
assessment will show.

Many factors need to be examined in considering the need for expanded services and the existing
or potential opportunities to address gaps. In addition to basic socio-demographics, these include
an understanding of the population’s oral health status; existing resources and capacity; patient and
delivery system barriers; current and potential utilization; existing and forthcoming Medi-Cal dental
policies; current and potential community partners; and stakeholder, provider and consumer
attitudes and opinions.

Purpose of the Assessment
2
  Centers for Disease Control and Prevention. National diabetes fact sheet: national estimates and general information on diabetes and
prediabetes in the United States, 2011. Atlanta, GA: U.S. Department of Health and Human Services, Centers for Disease Control and
Prevention.
3
  Joshipura K, Jung H, Rimm E et al. Periodontal disease, tooth loss and incidence of ischemic stroke. Stroke. 2003;34:47-54.
4
  Association of State and Territorial Dental Directors. Best Practices Approaches. Perinatal Oral Health. Available at
http://www.astdd.org/perinatal-oral-health/#six.
5
  Jeffcoat M, Jeffcoat R, Gladowski P et al. Impact of periodontal therapy on general health: Evidence from insurance data for five
systemic conditions. American Journal of Preventive Medicine. 2014;47(2): 166-174.
6
  Locker D. Concepts of oral health, disease and the quality of life. In: Slade GD, ed. Measuring oral health and quality of life. Chapel Hill:
University of North Carolina, Dental Ecology; 1997:11-23.
7
  Benjamin RM. Oral Health: the Silent Epidemic. Public Health Rep. 2010 Mar-Apr; 125(2):158–159.
8
  Blumenshine SL, Vann WF, Gizlice A, Lee JY. Children's school performance: impact of general and oral health. J Pub Health Dent
2008;68(2):82-87.
9
  Pourat N, Nicholson G. Unaffordable Dental Care is Linked to Frequent School Absences. UCLA Health Policy Research Brief.
November 2009. https://escholarship.org/uc/item/14g1w8s7#page-1

Increasing Access to Dental Services for Children and Adults on the Central Coast                                                       7
BARBARA AVED ASSOCIATES/April 2016
The report was prepared by Barbara Aved Associates, a Sacramento-based health consulting firm,
at the invitation of Dientes Community Dental Care. Its purpose is to benefit providers, policy
makers, and advocates in Santa Cruz and Monterey by bringing together data in a way that can
help inform and support priority setting, capacity building and policy decisions to improve oral
health.
Specifically, the aim of the study was to:
Provide an overview of relevant demographic and socioeconomic characteristics of the region
and emerging market and dental care trends.
Provide information about the Medi-Cal Dental Program because of its extensive coverage for
the low-income population.
Estimate the dental needs of the population with commonly used indicators.
Describe the barriers to reaching the target populations most in need.
Identify the challenges and opportunities to provide optimum access to oral health.
Inventory existing resources.
Identify opportunities (recommendations) for improving access and utilization.
Acknowledgements
We are indebted to Laura Marcus and Sheree Storm of Dientes Community Dental Care for their
leadership and foresight in commissioning this study on behalf of the community health
stakeholders and other advocates, for patiently answering many questions and for steering us to
local key informants who could also inform this assessment. We appreciate the time and help of
these individuals in providing a picture of oral health issues in Santa Cruz and Monterey. In
particular, we would like to acknowledge Dori Rose Inda and her staff of Salud Para la Gente for
graciously responding to multiple email requests for information over the course of the study.
The consultant team for the assessment was led by Barbara M. Aved, RN, PhD, MBA, and included
Mechele Small-Haggard, MBA; Larry S. Meyers, PhD; Elita Burmas, MA; Gary L. Schmidt; and
Michael Funakoshi.
Increasing Access to Dental Services for Children and Adults on the Central Coast 8
BARBARA AVED ASSOCIATES/April 2016
METHODS
             “The need is neither the present nor the future state; it is the gap between them.”
                                               – Anonymous

Data Sources and Methods

We used a literature scan researching existing published and unpublished documents, articles and
reports; data retrieval and analysis; key informant interviews; and surveys to conduct this needs
assessment.

Data Retrieval and Analysis

Data on Denti-Cal utilization came from the Department of Health Care Services (DHCS) Medi-Cal
Dental program. We looked at several years of data from the Santa Cruz Community Assessment
Project (CAP); the Central California Alliance for Health procured Healthy Kids data for us; and the
Office of Statewide Health Planning and Development provided the data on emergency department
visits for dental conditions. We retrieved population-based data from the 2014 California Health
Interview Survey (CHIS)—the largest state health survey in the U.S.—to examine dental service
utilization among the overall Santa Cruz and Monterey populations. We also pulled applicable
findings from recent dental studies we conducted with relevance to the current assessment.

Interviews

Nineteen key informants were interviewed as part of the assessment process. (Additional individuals
contributed to interviews for specific information.) The key informants included local and state opinion
leaders, policy makers, dental experts, providers, community-based organization representatives,
funders and advocates. Their views and knowledge reflected a wide range of experience and served
as a key asset to the study. In addition to extensive interviews with safety net provider staff, a number
of follow-up emails helped us learn more about clinic services, capacity, and perspectives on need.
(Attachment 1 contains a list of these individuals.)

We also conducted brief telephone interviews with the Western dental and private dental offices in
Santa Cruz County that were reported to be accepting new Denti-Cal patients at the time of this
study to confirm their participation and inquire about capacity and patient age restrictions.

Surveys

We developed a survey for private dentists that the Monterey Bay Dental Society (MBDS) made
available online to its members.10 Respondents, which included participating as well as non-
participating Denti-Cal providers, were asked for their opinions and experience regarding Denti-Cal
and what it would take to participate more fully; 157 dentists responded to the survey, generating a
37.1% response rate.

We were also able to include the results from a Member Survey we were conducting for the Medi-
Cal dental plans during the course of this study. Findings from surveys of 341 families with children
and 508 adults regarding barriers to access and reasons for not fully utilizing dental benefits helped
to inform this needs assessment.

10
     The survey had an adequate reach of area dentists, as approximately 80% are members according to the MBDS.

Increasing Access to Dental Services for Children and Adults on the Central Coast                                 9
BARBARA AVED ASSOCIATES/April 2016
FINDINGS
“The FQHCs have really stepped up to respond to the access problem. They provide great
care and a sustainable business model.” –Local physician administrator
I. Emerging Trends and Conditions in Dental Care
“People do talk to each other here and have achieved a degree of trust, and
address vexing issues that we might not have solved on our own.”
— Key Informant commenting on local collaboration for oral health
A brief overview of some of the emerging dental care trends and market conditions prepared for the
American Dental Association in 2013,11 and from other research, help give context and
understanding to this oral health environmental scan for Santa Cruz and Monterey Counties.
Population-Related Factors
Children are the group with the highest likelihood of having dental coverage, primarily due to
public coverage which in California includes investments from First 5s.
Increased access to oral health services for children over the past decade and a half is
expected to lead to an adult population with reduced dental disease and less need for
restorative dental care. Because a higher proportion of the population is keeping their teeth as
they age, there may be an increased need for periodontal care, services generally provided by
dental hygienists rather than dentists.
Hispanics continue to be the fastest growing segment of the population in California. Hispanics
are less likely to visit the dentist and have less health literacy about oral hygiene and
prevention. They are more likely to rely on community dental clinics for services.
Looking forward, a combination of factors, including the Affordable Care Act, will lead to an
increase in dental benefits coverage for children. However, there will likely be continued erosion
of dental benefits for many groups of adults. The decline in private dental benefits among adults
is not uniform by age. The most significant declines over time have been among younger adults
(19-34 year olds), who have the lowest levels of private dental benefits. For those ages 50-64,
there has been very little decline in the percent with private dental benefits.12
11
Diringer J, Phipps K, Carsel B. Critical Trends Affecting the future of Dentistry: Assessing the Shifting Landscape. Prepared for
American Dental Association, May 2013. http://www.ada.org/~/media/ADA/Member%20Center/FIles/Escan2013_Diringer_Full.ashx
12
Vujicic M, Goodell S, Nasseh K. Dental Benefits to Expand for Children, Likely Decrease for Adults in Coming
Years. Research Brief. ADA Health Policy Institute. April 2013.
Increasing Access to Dental Services for Children and Adults on the Central Coast 10
BARBARA AVED ASSOCIATES/April 2016 The percentage of adults who visit a dentist has been declining for the past decade among all
income groups. The trends in dental care use among middle- and high-income adults are not
expected to reverse in the near term.13
Consumers are becoming more astute purchasers of health care and seeking value for their
spending. Baby Boomers may become more price‐conscious as they join the ranks of the
elderly, with less coverage and more out of pocket costs for their care.
Dental Workforce
While the dental workforce is increasing14—possibly creating a future oversupply of dentists—
there is an insufficient supply of providers to meet the demand in the growing publicly insured
sectors of the population. Low reimbursement rates are the primary reason.
Current market conditions could have an influence on some dentists’ willingness to open their
practices to patients with Denti-Cal. Recent research from the American Dental Association
indicates there is additional capacity available in the dental care system due to low dentist
busyness levels and shorter wait times for new appointments.15 Nationally, among general
practitioners (GPs), 40% of solo dentists indicated they were not busy enough compared to 18%
of non-owner GPs. The decline in GP dentists’ earnings (which represents a continuation of a
multi-year trend), coupled with a steady decrease in dental care use among adults,16 could be a
trend that creates new opportunities to engage more local dentists in serving the public sectors
in Santa Cruz and Monterey Counties.
New dentists are far more likely to be women. In 2012, 30% of California dentists were women
while among newly licensed dentists that same year 46% were women.17 Female dentists have
different practice patterns than male dentists; for example, they work part time and they tend to
work as employees or associates rather than business owners.
Registered Dental Assistants in Extended Function (RDAEF) is a relatively new licensure
category in dentistry in California, although it has been established in other states under
different names (such as dental health therapist) for some time. RDAEFs are trained to
complete many restorative procedures which were previously only done by dentists, which can
free up the dentist to see more patients and to deliver more care. The dentist continues to
oversee treatment and completes all surgical procedures on the teeth. These oral health
professionals play a mid-level provider role similar to the Nurse Practitioner or Physician’s
assistant in a medical setting allowing for more access and reduced costs.
Other Trends
Community health centers have been growing their dental practices. In 2013-14, dental care
was offered at 66% of the health centers statewide.18
13
Vujicic M, Nasseh K. A decade in dental care utilization among adults and children (2001-2010). Health Serv Res.
April 2014; 49(2): 460-80.
14
Solomon ES. The past and future evolution of the dental workforce team. J Dent Educ 2012;76(8):1028-1035.
15
Munson B, Vujicic. General Practitioner Dentist Earnings Down Slightly in 2014. Health Policy Institute. American Dental Association,
December 2015. http://www.ada.org/~/media/ADA/Science%20and%20Research/HPI/Files/HPIBrief_1215_1.ashx
16
Nasseh K, Vujicic M. Dental care utilization rate highest ever among children, continues to decline among working-age
adults. Health Policy Institute Research Brief. American Dental Association. October 2014.
http://www.ada.org/~/media/ADA/Science%20and%20Research/HPI/Files/HPIBrief_1014_4.ashx
17
Pourat N, Moonkyung KC. Trends in the Supply of Dentists in California. Health Policy Brief. UCLA Center for Health Policy
Research. March 2014.
18
Pourat N, Martinez, AE, Crall J. Better Together: Co-Location of Dental and Primary Care Provides Opportunities to Improve Oral
Health. UCLA Center for Health Policy Research. Health Policy Brief. September 2015.
Increasing Access to Dental Services for Children and Adults on the Central Coast 11
BARBARA AVED ASSOCIATES/April 2016 Payment for dental services is shifting from commercial dental insurance to public coverage and
personal out of pocket payments. Out of pocket payments are increasing for the elderly
population.
Medi-Cal represents one of the few market segments with expanding demand for dental care
according to a key finding in a Medicaid dental market study.19
There is a trend for more integration of oral health into primary care practices influencing
practice patterns and reimbursement as well as access. For example, Medicaid and children’s
insurance programs are increasingly reimbursing medical providers for fluoride varnish, oral risk
assessment and exam, and parent/caretaker oral health education.
More experimentation can be expected in the structure of public programs, which have larger
populations that are stable over a longer period of time and for which there is great pressure on
cost constraint. Although managed care has been slow in coming to dentistry, the use of
managed care in Medicaid dental plans is predicted to increase. While the California
Department of Health Care Services has indicated it “has no plans to expand dental managed
care to other counties in California at this time,”20 priorities could change as the cost of Medi-Cal
continues to rise.
Several factors are likely to place greater attention on quality measurement and health
outcomes in the dental care delivery system (which lags behind the medical care system in
addressing quality measurement.) These include the use of evidence-based dentistry; new
payment models aligned with improved quality and health outcomes; the use of information
technology; and the training of a wider array of health care providers in oral health care. These
types of innovations are essential to move the dental care system from “paying for volume” to
“paying for value,” according to oral health trend watchers.21
19
Yarbrough C, Vujicic M, Nasseh K. Medicaid Market for Dental Care Poised for Major Growth in Many States. Health Policy Brief,
American Dental Association, December 2014.
20
Sacramento Children and Dental Care: Better Off Than Five Years Ago? Barbara Aved Associates. Sacramento, CA:
www.barbaraavedassociates.com. December 2015.
21
Quality Improvement in Children’s Oral Health: Moving from Volume to Value. National Maternal and Child Oral Health Policy Center,
May 2012.
Increasing Access to Dental Services for Children and Adults on the Central Coast 12
BARBARA AVED ASSOCIATES/April 2016II. Regional Profile
“People do talk to each other here and have achieved a degree of trust, and
address vexing issues that we might not have solved on our own.”
— Key Informant commenting on local collaboration for oral health
Demographics
Population
Demographic trends help to project potential unmet needs for dental and other healthcare-related
services. In July 2015, Santa Cruz County had an estimated population of 271,646 and is projected
to grow to 314,875 by 2060, an increase of 15.1%. Monterey County’s estimated 2015 population
of 425,413 is projected to grow to 533,575 by 2060, an increase of 24.2%. In both counties, the
majority of the population growth (on average, about 210%) is estimated to occur in persons over
age 65.22 Table 1 shows the percentage change in population between 2014 and 2015 by county
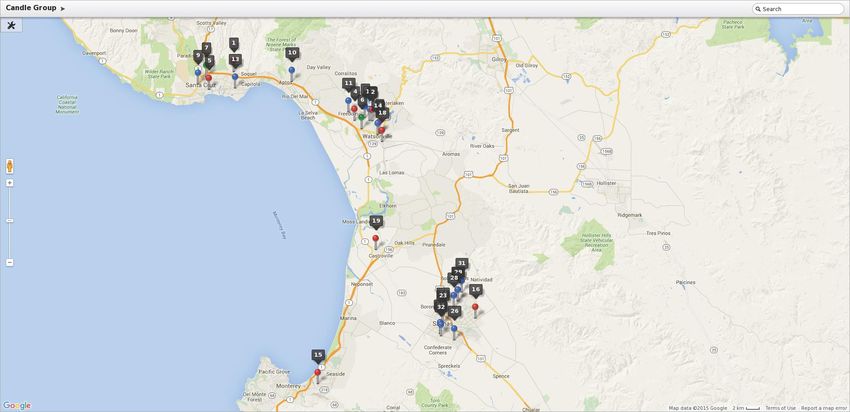
and city. The map that follows displays the location of the Santa Cruz County population.
Table 1. Percent Change In Population Between 2014 And 2015 By County and City
County/City Total Population Percent Change
1/1/2014 1/1/2015
Santa Cruz 269,322 271,646 0.9
Capitola 10,004 10,052 0.5
Santa Cruz 62,860 63,789 1.5
Scotts Valley 11,800 11,928 1.1
Watsonville 51,874 52,087 0.4
Balance of County 132,784 133,790 0.8
Monterey 424,774 425,413 0.2
Carmel-by-the-Sea 3,747 3,747 0.0
Del Rey Oaks 1,661 1,660 -0.1
Gonzales 8,363 8,357 -0.1
Greenfield 16,879 16,870 -0.1
King City 13,179 13,417 1.8
Marina 20,222 20,872 3.2
Monterey 28,319 28,163 -0.6
Table continues on next page
22
California Department of Finance, Total Population Projections for California and Counties: July 1, 2015 to 2060 in 5-year Increments,
December 2014.
Increasing Access to Dental Services for Children and Adults on the Central Coast 13
BARBARA AVED ASSOCIATES/April 2016(Continued from previous page)
Pacific Grove 15,394 15,388 0.0
Salinas 154,815 154,720 -0.1
Sand City 342 362 5.8
Seaside 33,456 33,672 0.6
Soledad 24,959 24,540 -1.7
Balance of County 103,438 103,645 0.2
Source: California Department of Finance. City/County Population Estimates with Annual Percent Change
Map 1. Location of Santa Cruz Population
Source: Graphic courtesy of Santa Cruz METRO Forward Transit Plan. 2015.
Population by Age
As Table 2 indicates, Monterey County has a slightly younger population than Santa Cruz County—
26.6% of residents are age 0-17 while in Santa Cruz the proportion is 21%. While these are not
necessarily large differences, they suggest on their own the need for children’s dental services may
be slightly higher in Monterey than in Santa Cruz County.
Table 2. Percent of Population by Age
Age Santa Cruz County Monterey County
0-4 (Preschool age) 5.7% 7.8%
5-17 (School age) 15.3% 18.8%
18-24 (College age) 14.1% 11.2%
25-64 (Working age 53.7% 51.4%
65+ (Retirement age) 11.2% 10.8%
Source: California Department of Finance County Population Projections, December 2014.
Figure 1 below shows the counties’ expected population growth by major age groups from 2010 to
2030. The largest positive change is projected to be in the oldest age group, with implications of
this shift in the age structure of the population described earlier.
Increasing Access to Dental Services for Children and Adults on the Central Coast 14
BARBARA AVED ASSOCIATES/April 2016Figure 1. County Population Projections by Age Group: 2010-2030
250000
229824 235810
213944
200000
150000 143226
141678 137650
100000 84067
78230 78829 81519
66690
50500 46647 63342
50000 40261 45831
37131 42159 44811 40908 42878
29530 29807 29553 32509 33355 32600
15109 16178 15814
0
2010 2020 2030 2010 2020 2030
Santa Cruz County Monterey County
Age 0-4 Age 5-17 Age 18-24 Age 25-64 Age 65+
Source: California Department of Finance, Report State and County Population Projections by Major Age Groups, December 2014.
Population by Race/Ethnicity
Figure 2 shows the race/ethnicity distribution in 2014 of Santa Cruz and Monterey Counties and
California. In comparison to Monterey, Santa Cruz has a higher proportion of Whites and a lower
proportion of African Americans. Both counties have similar percentages of the population who
report as 2 or more races. The proportion of Hispanic or Latino population is significantly higher in
Monterey than either Santa Cruz or the state.
Figure 2. Race/Ethnicity of Santa Cruz, Monterey and California, 2014.
100%
87.7%
82.6%
80% 73.2%
58.2% 57.4%
60%
38.5% 38.6%
40% 31.2% 33.2%
20% 14.4%
6.5% 6.9%
2.7% 4.8%
1.7%3.5% 1.8% 1.7% 4.1% 3.7% 3.7%
0%
White, Black, Amer Asian, 2+ races White Hispanic
alone alone Indian, alone alone, non
alone Hispanic
Santa Cruz County Monterey County CA
Source U.S. Census Bureau: State and County QuickFacts
Increasing Access to Dental Services for Children and Adults on the Central Coast 15
BARBARA AVED ASSOCIATES/April 2016Population by Zip Code
Age groups by zip code for Santa Cruz County are displayed in Table 3, data that are useful for
prioritizing locations and population categories for focusing services.
Table 3. Age Groups by Zip Code, Santa Cruz County, 2014.
Under 5 5-19 20-64 65 And Over
Number % Number % Number % Number % Row Total
95003 896 3.7% 4,443 18.2% 14,705 60.3% 4,339 17.8% 24,383
95005 342 5.2% 1,127 17.0% 4,462 67.5% 684 10.3% 6,615
95006 476 5.2% 1,145 12.5% 6,275 68.5% 1,266 13.8% 9,162
95007 40 5.9% 145 21.4% 441 65.2% 50 7.4% 676
95010 363 3.9% 1,674 17.9% 5,762 61.5% 1,568 16.7% 9,367
95017 7 1.1% 116 17.7% 433 66.2% 98 15.0% 654
95018 483 6.3% 1,463 19.1% 4,798 62.6% 916 12.0% 7,660
95019 635 8.6% 2,014 27.3% 3,998 54.2% 727 9.9% 7,374
95033 549 5.7% 1,574 16.3% 6,011 62.4% 1,494 15.5% 9,628
95041 0 0.0% 39 26.7% 107 73.3% 0 0.0% 146
95060 1,611 3.4% 6,803 14.4% 33,539 71.1% 5,195 11.0% 47,184
95062 2,166 6.0% 5,351 14.7% 24,659 67.8% 4,182 11.5% 36,358
95064 93 1.1% 5,458 64.8% 2,856 33.9% 18 0.2% 8,425
95065 467 5.6% 1,387 16.6% 5,041 60.5% 1,436 17.2% 8,331
95066 837 5.5% 3,188 21.1% 9,083 60.2% 1,987 13.2% 15,095
95073 594 5.5% 1,624 15.0% 7,023 64.7% 1,608 14.8% 10,849
95076 7,303 8.6% 19,468 23.0% 49,169 58.1% 8,647 10.2% 84,587
Column
16,862 5.9% 57,019 19.9% 178,362 62.3% 34,215 11.9% 286,494
Total/Avg
Source: http://www.usa.com/santa-cruz-county-ca.htm
Special Populations
Santa Cruz and Monterey Counties are home to a larger share of agricultural workers than other
counties in California. More than 18% of jobs in Santa Cruz County are reported for this sector,
compared to 2.4% statewide.23 Population estimates based on Bureau of Labor statistics as of
October 201524 suggest that 13.6% of the Santa Cruz population (approximately 37,000 persons)
and 17.6% in Monterey County (approximately 76,000 persons) are farmworkers.
Numerous studies of the oral health of farmworker children and adults consistently show
farmworkers of all ages to have a level of oral health that is worse than what is found in the general
population. A lack of dental insurance, long travel times to dental care, and linguistic barriers are
23
Santa Cruz County Comprehensive Economic Development Strategy (CEDS), 5-Year Plan, May 2015.
http://www.santacruzhumanservices.org/Portals/0/wib/reports/2015-CEDS-5-Year-Plan.pdf
24
http://www.bls.gov/regions/west/ca_santacruz_msa.htm#eag_ca_santacruz_msa.f.1 and
http://www.bls.gov/regions/west/ca_salinas_msa.htm
Increasing Access to Dental Services for Children and Adults on the Central Coast 16
BARBARA AVED ASSOCIATES/April 2016key obstacles to care for this population.25 What is evident from the local-level studies from other
26
areas analyzed by the Migrant Health Center is that farmworkers do not choose to forego dental
care. When affordable care was made available during hours when families could attend, in
locations they could reach, and with providers with whom they could communicate, they would seek
it. According to the analysis, visits for dental services accounted for a third of all reported visits by
agricultural worker patients.
Socioeconomic Factors
While this study does not consider the impact of changes in the general economy on the demand
for dental care (the demand for dental services is sensitive to changes in the general economy), it is
useful to review socioeconomic determinants that have been shown to affect overall health as well
as oral health status and outcomes. The information includes poverty and income (median
household income), percent of the population that is Medi-Cal eligible, population in poverty,
homelessness, employment and education.
Population in Poverty
“Persons living in poverty,” as federally defined, although an ambiguous term, is a common
measure of economic insufficiency in health services planning. In 2015, an individual living at the
federal poverty level (100% FPL) earned $11,770; a family of 4 living at 100% FPL earned
$24,250.27
The effects of poverty on access to and use of health services, as well as health and well-being, are
well documented. In Santa Cruz County, an estimated 16.1% of the total population was living in
poverty in 2014, while for children under age 18 the proportion was 19.1%. In Monterey County in
2014, the figures were 17.0% and 25.2%, respectively (Table 4).28
Table 4. Percent of the Population Living in Poverty, 2014
Total Population Children AgePoverty estimates for Santa Cruz County zip codes, where data were available, are shown in Table
5. The “total population in poverty” column in the table is listed in rank order. The geographic area
that includes the west side of Santa Cruz to Bonny Doon (zip code 95060), for example, illustrates
that 25.8% of the 11,970 population, the second highest proportion in the county, was living in
poverty in 2014.
Table 5. Number and Percent of the Population Living in Poverty
by Zip Code, Santa Cruz County, 2014
1
Population in Poverty Family in Poverty
Number % Number %
95064 267 27.0% 44 20.6%
95060 11,970 25.8% 900 10.1%
95019 1,755 23.8% 342 21.3%
95007 133 18.3% 0 0.0%
95076 14,946 17.9% 2,666 14.4%
95062 5,247 14.6% 607 8.1%
95003 2,476 10.2% 366 5.7%
95005 663 10.2% 106 6.1%
95073 984 9.1% 160 6.0%
95006 820 9.0% 112 4.6%
95065 719 8.7% 74 3.7%
95017 50 7.8% 8 5.0%
95010 689 7.5% 94 4.2%
95066 904 6.1% 90 2.3%
95033 486 5.1% 93 3.5%
95018 321 4.2% 31 1.6%
Total 42,430 16.5% 5,693 9.6%
Source: http://www.usa.com/santa-cruz-county-ca.htm
1
Zip codes are shown in rank order by “percent of population in poverty” (column 3).
Eligibility for Free or Reduced-Price Meals
The percent of students eligible for free and reduced-price meals is one of the markers of
community poverty in an environmental assessment. A child's family income must fall below 133%
of the federal poverty guidelines ($32,253 for a family of 4 in 2014-2015) to qualify for free meals, or
below 185% of the federal poverty guidelines ($51,634 for a family of 4 in 2014-2015) to qualify for
reduced-cost meals. Over half of local children are eligible.
While the proportion of eligible students in Santa Cruz County is somewhat close to that of the
state, 54.7% vs. 59.2%, Monterey County student eligibility is greater at 68.8% (Table 6 on the next
page).30
30
California Dept. of Education, Free/Reduced Price Meals Program & CalWORKS Data Files (Feb. 2015); U.S. Dept. of Education,
NCES Digest of Education Statistics and NCES Online Query System (Feb. 2015).
Increasing Access to Dental Services for Children and Adults on the Central Coast 18
BARBARA AVED ASSOCIATES/April 2016Table 6. Student Eligibility to Receive Free or Reduced Price School Meals, 2014
Locations Percent
California 59.2%
Monterey County 68.8%
Santa Cruz County 54.7%
Data Source: as cited on kidsdata.org
Medi-Cal Eligibility
Current Enrollment
Medi-Cal eligibility is another surrogate marker for poverty. In 2014, the most recent full-year period
for which enrollment by age group data were available, there were 73,985 individuals enrolled in
Medi-Cal in Santa Cruz County. This was 28.2% of the total Santa Cruz population. In Monterey
County, 34.7% of the population, or 149,886 individuals, were enrolled in Medi-Cal.31
Table 7. Population Enrolled in Medi-Cal, 2014
Age Number Eligible
Santa Cruz County Monterey County
Ages 0-3 8,120 22,181
Ages 0-5 11,897 32,587
Ages 6-20 24,008 58,084
Ages 21-64 32,793 49,946
Ages 65+ 5,287 9,269
Totals 73,985 149,886
Source: California Department of Health Services, Medi-Cal Dental Division.
Currently (January 2016) 69,993 or 25.8% of the population in Santa Cruz and 149,655 or 35.2% in
Monterey is enrolled in Medi-Cal.32
Projected Changes
There are an estimated 2.6 million immigrants living in California, according to the Migration Policy
Institute.33 The Governor’s 2015-16 budget, pursuant to Senate Bill 75, provides funding for the
state in May 2016 to begin extending Medi-Cal coverage to about 170,000 undocumented
immigrant children under age 19. At this time, the state will begin enrolling new enrollees into full
scope Medi-Cal coverage and transition children from restricted to full scope Medi-Cal aid codes.
The expansion is projected to cost $40 million in the next fiscal year and about $132 million
annually following implementation. (In addition to the Senate Bill 75 legislation, the California
Senate also approved SB 4, Lara, that was scaled back to only include children after the cost for
31
United States Census Bureau (population) California Department of Health Care Services (Medi-Cal).
32
http://www.dhcs.ca.gov/dataandstats/reports/Documents/MMCD_Enrollment_Reports/MMCEnrollRptJan2016.pdf
33
Migration Policy Institute (MPI) analysis of U.S. Census Bureau data from the 2013 American Community Survey and other date
sources. http://www.migrationpolicy.org/content/deferred-action-childhood-arrivals-daca-profile-california
Increasing Access to Dental Services for Children and Adults on the Central Coast 19
BARBARA AVED ASSOCIATES/April 2016including adults was projected to be more than $1 billion.34) SB 75 affects two populations of
children with “unsatisfactory immigration status”:
transition population individuals under age 19 who are currently enrolled into restricted scope
Medi-Cal;
new enrollee population - individuals under age 19 who are eligible for Medi-Cal and have not
yet enrolled.
Counties are grappling with how to estimate the number of undocumented children who will be
covered by Medi-Cal in their county. Because being in the U.S. without documents is illegal, it is
difficult to determine just how many people are in that category (similar to the challenges of
counting homeless persons, although the latter are not actively trying to keep from being identified),
so planners and providers are currently tossing various numbers around.35 The methodology we
used to estimate figures for full scope Medi-Cal eligibles for Santa Cruz County, while clearly not
perfect is logical, and suggests there will be at least 133 newly eligible undocumented children as a
result of this legislation (Table 8). This estimate is conservative because it does not take into
account the likelihood that Santa Cruz County may have a disproportionate share of undocumented
families due to its agricultural workforce or reflect potential enrollment changes in Healthy Kids.
Table 8. Santa Cruz County Estimate of Undocumented Children Eligible for full-Scope Medi-Cal in 2016
Step Calculation Estimate
Population of age 0-18 in Santa Cruz County in 2014 @
Step 1 54,633
20.1% of the total county population of 271,8041
Population of age 0-18 in CA in 2014 @ 23.6% of the total
Step 2 9,157,390
state population of 38,802,5002
Santa Cruz County age 0-18 of CA age 0-18 (divide 54,633 by
Step 3 0.6%
9,157,390).
170,000 immigrant children 0-18 estimated to become eligible
Step 4 170,000
for Medi-Cal in May 20163,4
Santa Cruz County’s portion of the 170,000 is 0.6%, or 1,020
Step 5 1,020
children
In 2013, 13% of CA's K–12 schoolchildren were estimated to
Step 6 133
have an undocumented immigrant parent.4 (.13 x 1,020)
1
California Quick Facts, 2014.
2
California Quick Facts, 2014.
3,
4Caifornia Department of Health Care Services; Migration Policy Institute. 114,981 are currently enrolled in restricted scope Medi-Cal
coverage; 50% of the 55,019 remaining currently eligible but not enrolled are estimated to take up coverage over 12 months.
4
Public Policy Institute of California. http://www.ppic.org/main/publication_show.asp?i=818
The Health Alliance has also made estimates with data provided by the Migrant Policy Institute. Its
estimates, which are acknowledged to be on the high side, are for total eligibles (as opposed to
expected enrollment) and they would not be eligible for full scope Medi-Cal.36 Note that
34
While Lara removed from the bill language seeking a federal waiver to enable undocumented immigrant adults to purchase coverage
through Covered California, he said he will pursue separate legislation (SB 10) to extend health coverage to all immigrants, regardless of
status, next year.
35
Conversations with Will Forest, epidemiologist, Santa Cruz County, and Olivia Byron-Cooper, epidemiologist, El Dorado County,
September 2015. Ms. Byron-Cooper vetted our methodology.
36
Personal communication with Alan McKay, Executive Director, Central CA Alliance for Health, February 22, 2016.
Increasing Access to Dental Services for Children and Adults on the Central Coast 20
BARBARA AVED ASSOCIATES/April 2016undocumented residents are sometimes eligible for limited scope Medi-Cal (typically emergency
and pregnancy related services) based on medical need.
Santa Cruz: 1,700-2,550 potentially eligible under age 19
Monterey: 6,000-9,000 potentially eligible under age 19
Dental Insurance
A primary indicator of access to dental care is having dental insurance. Data from the 2008
National Health Interview Survey suggest among adults age 65 or younger with private insurance,
approximately 73% have some type of dental insurance, while 27% have no coverage.37 Other
more recent estimates (2010) found the percent of non-elderly adults without any dental benefits to
be 34.3%.38 The scale-back of Medicaid dental benefits during this time by many states, including
California, likely accounted for part of the decline in coverage. Applying the average of these
estimates to the local counties suggests that about 30% of non-elderly adults would have no dental
insurance, or approximately 50,026 in Santa Cruz County and 75,347 in Monterey County. (Lack of
dental insurance coverage is much more prevalent than lack of medical insurance.)
The California Health Interview Survey (CHIS), a representative household survey at all income
levels across the state, last asked adults about dental insurance status in 2007.39 At that time,
before adult Medi-Cal benefits were scaled back, 36.8% of Santa Cruz residents and 45.3% of
Monterey residents reported having no dental insurance in the past year (Figure 3 on the next
page). The CHIS figures are higher than the estimate above from applying national averages, but
come close to what the 2014 Santa Cruz County’s Community Assessment Project (CAP) reported:
42% of adults had no dental coverage in 2013, down from 72% in 2003, (though 86% reported
being able to get the dental care they needed in the past year).40
37
Bloom B, Cohen RA. Dental Insurance for Persons Under Age 65 Years with Private Health Insurance: United States, 2008. NCHS
Data Brief. No. 40, June 2010.
38
Vujicic M, Goodell S, Nasseh K. Dental Benefits to Expand for Children, Likely Decrease for Adults in Coming
Years. Research Brief. ADA Health Policy Institute. April 2013.
39
UCLA Center for Health Policy Research. http://ask.chis.ucla.edu/AskCHIS/tools/_layouts/AskChisTool/home.aspx#/geography.
CHIS sources and level of funding each year determines what questions can be included in the survey. Over the years, the number and
type of dental questions have been greatly reduced.
40
http://static1.squarespace.com/static/5176dcd7e4b0e5c0dba41ee0/t/563a84b1e4b0330ccadca6fa/1446675633287/CAP%2B20%2BCo
mplete%2BReport.pdf
Increasing Access to Dental Services for Children and Adults on the Central Coast 21
BARBARA AVED ASSOCIATES/April 2016Figure 3. Percent of Adults with Dental Insurance in the Past Year, 2007
60% 53.3%
45.3% 47.2%
45%
36.8%
30%
15% 9.9% 7.6%
0%
None in past year Part of past year All of past year
Santa Cruz County Monterey County
Source: California Health Interview Survey.
The question asked was, “For how many months of the past 12 months did you
have any kind of dental insurance that pays for some or all of your routine dental care?"
The CHIS also last queried for children’s dental insurance in 2007, asking about current coverage.
As Figure 4 below shows, 80.7% of children were reported as covered in Monterey and 87.2% in
Santa Cruz.
Figure 4. Percent of Children with Current Dental Insurance, 2007
100% 87.2%
80.7%
80%
60%
40%
19.3%
20% 12.8%
0%
Santa Cruz County Monterey County
Has insurance Does not have insurance
Source: California Health Interview Survey.
Although surveyed 4 years later than the CHIS, respondents to the CAP household survey for 2011
reported similar levels of dental coverage for their children—84%-86% for at least one child in the
family (Figure 5).41
41
http://static1.squarespace.com/static/5176dcd7e4b0e5c0dba41ee0/t/53e945f8e4b00d85593e0448/1407796728504/CAP+18.pdf
Increasing Access to Dental Services for Children and Adults on the Central Coast 22
BARBARA AVED ASSOCIATES/April 2016Figure 5. Percent of Children with Current Dental Insurance, 2011
100%
84.1% 86.2%
80%
60%
40%
15.9% 13.8%
20%
0%
None At Least One
Age 0-5 Age 6-17
Source: Applied Survey Research, Santa Cruz County CAP, 2012.
The question asked, “How many of your children have dental insurance?”
In the 2013 CAP survey, the total respondents who reported they had dental insurance were 58%, a
decrease from 72% in 2003.42
Homelessness
A one-day homeless count conducted in January 2015 identified 1,964 homeless persons in Santa
Cruz County. This count was a 44% decrease from the prior census in 2013; virtually all of the
reduction came from unsheltered persons. Nearly one-third was sheltered, while the remainder was
unsheltered, and the majority of the unsheltered lived on the streets or in a vehicle. The number of
individuals counted in the January 2015 Monterey County Point-in-Time
general street count and shelter count was 2,308. Compared to 2013, this was a decrease of 282
individuals, or just under 11%. Approximately 71% of these individuals were unsheltered, a
decrease from 76% in 2013. Of the 678 sheltered individuals, 478 persons (71%) were in
transitional housing, while 29% were housed in emergency shelter.43
Employment
The relationship between unemployment and adverse health outcomes is bidirectional, meaning
that unemployment contributes to ill health and ill health contributes to unemployment.44 In
November 2015, an average of 140,900 residents in Santa Cruz County were in the labor force
(persons age 16 and older who are able, available, and actively looking for work, not including the
jobless who are not seeking work). During that month, 10,000 (7.1%) were not employed, compared
to 5.7% statewide. In Monterey County, 16,700 (7.5%) of the estimated 222,300 labor force were
not employed.45
42
http://static1.squarespace.com/static/5176dcd7e4b0e5c0dba41ee0/t/563a84b1e4b0330ccadca6fa/1446675633287/CAP%2B20%2BCo
mplete%2BReport.pdf
43
Applied Survey Research. 2015 Santa Cruz County Homeless Census & Survey. Watsonville, CA.
http://www.appliedsurveyresearch.org/homelessness-reports/2014/8/15/santa-cruz-county-homeless-census-and-survey and 2015
Monterey County Point-In-Time Homeless Census & Survey https://csumb.edu/sites/default/files/images/st-block-16-1437601723726-
raw-finalmc2015censusreport.pdf
44
County of Santa Cruz, Health Services Agency, Public Health Division. HEALTH, Santa Cruz County, 2015. Santa Cruz County, CA.
September 2015. http://www.santacruzhealth.org/Portals/7/Pdfs/2015SCRZHealthReport.pdf
45
http://www.labormarketinfo.edd.ca.gov/geography/lmi-for-california.html
Increasing Access to Dental Services for Children and Adults on the Central Coast 23
BARBARA AVED ASSOCIATES/April 2016You can also read