Strategies for Innovative and Effective ICT Components & Systems Manufacturing in Europe
←
→
Page content transcription
If your browser does not render page correctly, please read the page content below
Strategies for Innovative and
 Effective ICT Components &
  Systems Manufacturing in
            Europe

            FINAL REPORT
            A study prepared for the European Commission
            DG Communications Networks, Content & Technology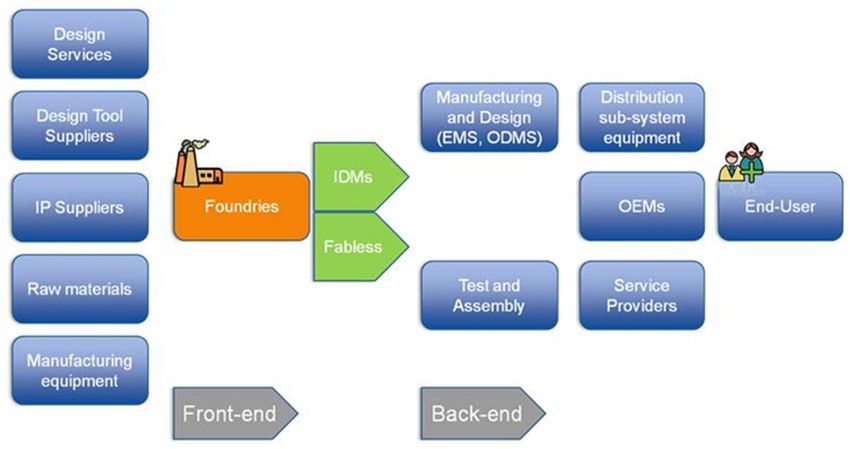
This study was carried out for the European Commission by

 Authors : Gabriella Cattaneo, Stefania Aguzzi, Alain Pétrissans, Stéphane Krawczyk,
 Sebastien Lamour, Henrik Noes Piester, Malene Stidsen

 Internal identification
 Contract number: 30-CE-0455328/00-14
 SMART number: 2011/0063

DISCLAIMER
By the European Commission, Directorate-General of Communications Networks,
Content & Technology.
The information and views set out in this publication are those of the author(s) and
do not necessarily reflect the official opinion of the Commission. The Commission
does not guarantee the accuracy of the data included in this study. Neither the
Commission nor any person acting on the Commission’s behalf may be held
responsible for the use which may be made of the information contained therein.
ISBN 978-92-79-30927-4
DOI: 10.2759/24160
Copyright © European Union, 2013. All rights reserved. Certain parts are licensed
under conditions to the EU. Reproduction is authorised provided the source is
acknowledged.

                                                                                       2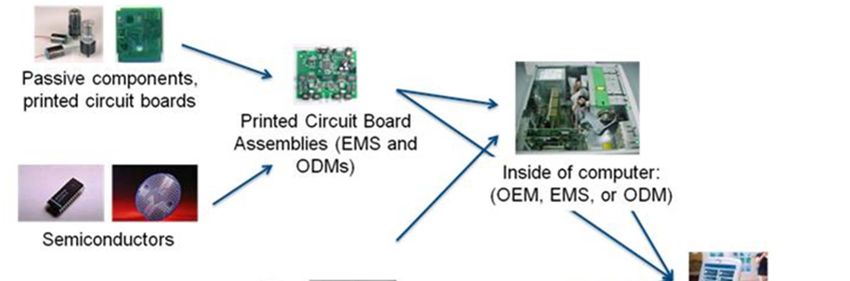
TABLE OF CONTENTS
1.         Executive Summary                                                                                                        7
1.1.       Clusters' Key Characteristics ............................................................................... 7
1.2.       Main Success Factors ............................................................................................ 8
1.3.       Analysis of funding models .................................................................................. 9
1.4.       Recommendations ................................................................................................. 10
1.5.       Background ............................................................................................................ 12
2     I nt ro duct io n a nd b ackgr ound                                                                                           13
2.1        Policy context of the study................................................................................... 13
2.2        Clusters' definition................................................................................................. 14
2.3        Focus and scope .................................................................................................... 14
2.4        Structure of the report ......................................................................................... 15
3          General approach                                                                                                         17
3.1   Characteristics of the electronics manufacturing market ................................ 17
   3.1.1 Definition and value chain............................................................................ 17
   3.1.2 Market forecasts ............................................................................................ 18
3.2 Semiconductors: a key segment of the value chain ........................................ 19
   3.2.1 A growing market .......................................................................................... 19
      3.2.2     A market creating and destructing value.............................................................. 21
3.3        General Challenges in Research, Development and Education                                           ...................... 21
3.4        Conclusions   ............................................................................................................ 22
4          Analysis of Clusters                                                                                                     23
4.1   Overview................................................................................................................. 23
   4.1.1 Selection criteria............................................................................................ 23
   4.1.2 European Clusters ......................................................................................... 23
   4.1.3 Non-European clusters ................................................................................. 24
4.2 structure/organisations of clusters, background, economic importance ...... 24
   4.2.1 European clusters characteristics ............................................................... 24
   4.2.2 US Clusters Characteristics .......................................................................... 27
   4.2.3 Asian Clusters Characteristics ..................................................................... 28
4.3 Conclusions ............................................................................................................ 29
5          Key success factors                                                                                                      31
5.1   Identification of key success factors .................................................................. 31
5.2   Analysis of Key Success Factors ......................................................................... 34
   5.2.1 Strength of cluster actors ............................................................................ 34
   5.2.2 Cluster-specific framework conditions ....................................................... 36
   5.2.3 Access to human resources ......................................................................... 36
   5.2.4 Access to finance ........................................................................................... 37
   5.2.5 Access to research and knowledge ............................................................. 38
   5.2.6 Regulation and public demand .................................................................... 39
   5.2.7 Entrepreneurship ........................................................................................... 40
   5.2.8 Quality of cluster management ................................................................... 41
5.3 Conclusions ............................................................................................................ 42
                                                                                                                                           3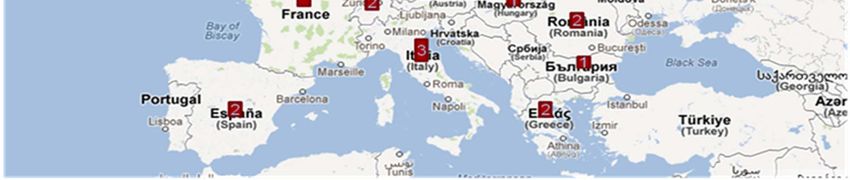
6          Analysis of Policy measures and funding schemes                                                                      43
6.1    Overview................................................................................................................. 43
6.2    Mapping of funding schemes and other cluster support measures ............... 43
   6.2.1 Policy Context ................................................................................................ 43
   6.2.2 Mapping Funding and support measures ................................................... 44
   6.2.3 Austria............................................................................................................. 49
   6.2.4 Belgium/Netherlands .................................................................................... 50
   6.2.5 Finland ............................................................................................................ 50
   6.2.6 France ............................................................................................................. 51
   6.2.7 Germany ......................................................................................................... 53
   6.2.8 Greece............................................................................................................. 55
   6.2.9 Hungary .......................................................................................................... 55
   6.2.10 Romania ...................................................................................................... 56
   6.2.11 UK ................................................................................................................ 56
6.3 Funding Measures of International Clusters ...................................................... 57
   6.3.1 Overview of Funding Measures ........................................................................ 57
   6.3.2 Chungnam & Daejeon, South Korea........................................................... 58
7          Recommendations                                                                                                      60
7.1   Innovation policy ................................................................................................... 60
7.2   R&D policy .............................................................................................................. 61
7.3   Financial policy ...................................................................................................... 63
7.4   Venture capital and high tech funding ............................................................... 63
7.5   ICT industry policy ................................................................................................ 65
7.6   Education and training.......................................................................................... 66
   7.6.1 Yang Tze River Delta..................................................................................... 67
   7.6.2 The US Northwest Silicon Forest................................................................. 68
7.7 Importance of funding sources ........................................................................... 70
   7.7.1 Survey results on Funding sources............................................................. 70
   7.7.2 Ranking of funding sources.......................................................................... 71
7.8 Conclusions ............................................................................................................ 72
8          Annexes                                                                                                              75
8.1   Web and literature summary............................................................................... 75
8.2   Glossary .................................................................................................................. 78
   8.2.1 Electronics manufacturing industry definition ........................................... 78
   8.2.2 Main Actors and Stakeholders ..................................................................... 78
   8.2.3 Sectors ............................................................................................................ 79
   8.2.4 Acronyms used in the document................................................................. 79
8.3 Methodology........................................................................................................... 80
   8.3.1 Identification and qualification of relevant clusters ................................. 80
   8.3.2 Web and literature review............................................................................ 81
   8.3.3 Cluster Survey ............................................................................................... 81
   8.3.4 Cluster Profiles............................................................................................... 83

              FIGURES
      Figure 1 - The Electronics Manufacturing Value Chain .......................................................... 17
      Figure 2 - The Semiconductor Value Chain ........................................................................... 19

                                                                                                                                       4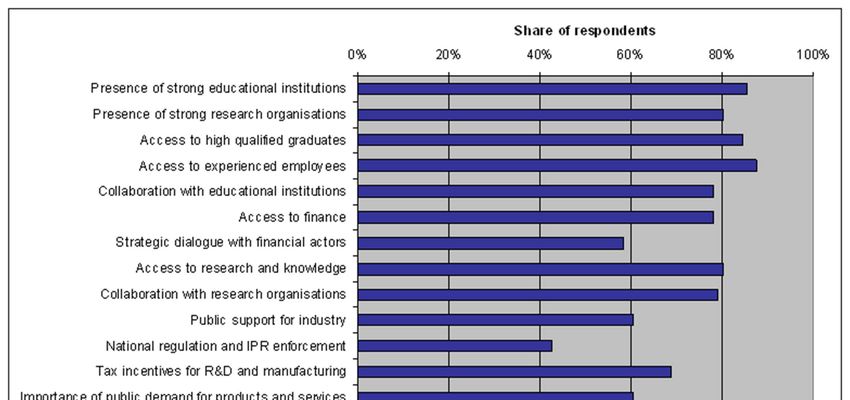
Figure 3 Worldwide Semiconductor Revenue Forecast 2011–2020
(€B)...................................................................................................................................... 19
Figure 4 Worldwide Semiconductor Market Revenue Forecast by
World Region, 2011-2020 (€B) ............................................................................................. 20
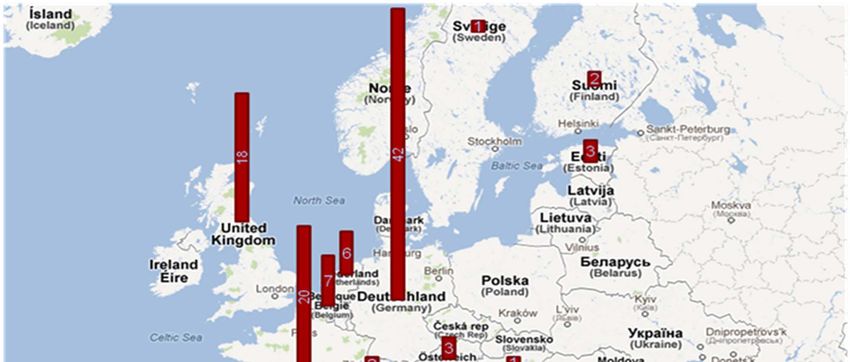
Figure 5 - Number of European Clusters analysed by country (EU +
Switzerland) ......................................................................................................................... 23
Figure 6 Number of non-European Clusters analyzed per Country ........................................ 24
Figure 7 Number of Clusters per segment of the ICT components
value chain ........................................................................................................................... 25
Figure 8 Distribution of Clusters by type of activity and country ............................................. 26
Figure 9 Innovation Performance of the main European ICT
components and systems manufacturing Clusters ................................................................ 32
Figure 10 Ranking the importance of the factors included in the
analytical model ................................................................................................................... 32
Figure 11 Importance of Strength of Cluster actors ............................................................... 34
Figure 12 Importance of Access to Human Resources .......................................................... 36
Figure 13 - Importance of access to finance ......................................................................... 38
Figure 14 Importance of access to research and knowledge ................................................. 39
Figure 15 Importance of regulation and public demand ......................................................... 39
Figure 16 - Importance of Entrepreneurship .......................................................................... 40
Figure 17 - Importance of Cluster Management .................................................................... 41
Figure 18 Share of Companies in individual clusters indicating that
they have received funding from central or regional government ........................................... 70
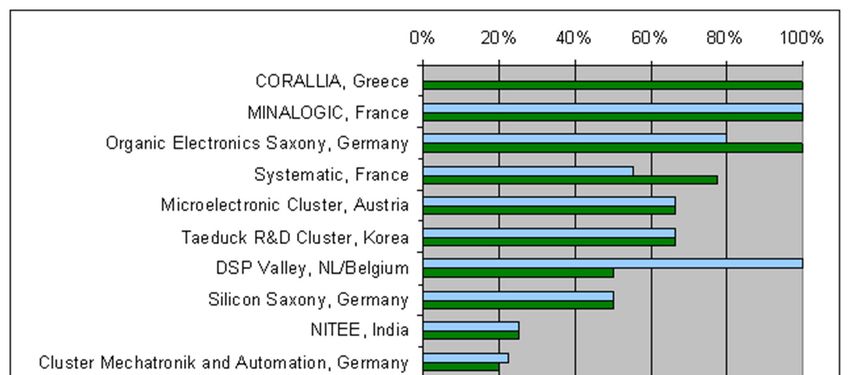
Figure 19 Share of companies in Individual clusters indicating that
they have received private funding ....................................................................................... 71
Figure 20 Average shares of cluster companies indicating that they
have received funding from specific sources ......................................................................... 71
Figure 21 Average share of cluster companies by type of funding
received - EU versus non-EU clusters .................................................................................. 72
TABLES
Table 1 - Overview of Main Public Funding Sources - EU Clusters ........................................ 46
Table 2 Overview of Main Public Funding Sources - International
Clusters ............................................................................................................................... 58
Table 3 Main References ...................................................................................................... 75
Table 4 Acronyms used in the report .................................................................................... 80
Table 5 EU Total Number of Interviews and Clusters covered by
Country ................................................................................................................................ 82
Table 6 World - Total Number of Interviews and International Clusters
covered ................................................................................................................................ 82
Table 7 Total Number of ICT Components Clusters Profiles .................................................. 83
5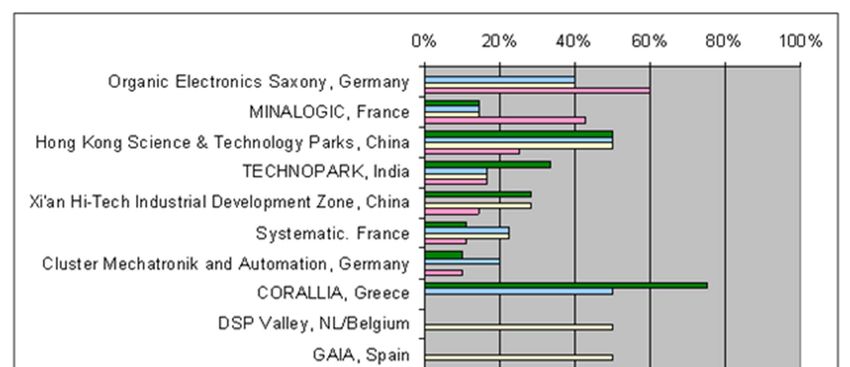
6
1.EXECUTIVE SUMMARY
The European electronics manufacturing industry is facing strong global competition in all
parts of the value chain, even where it used to be highly competitive. Overall, Europe has
a strong technological research base and global leadership in several KET application
areas such as automotive, aeronautics, health and energy. However, electronics   1

manufacturing has moved to Asia and Europe is struggling to preserve small advanced
manufacturing capacities. Most European IDMs (Integrated Device Manufacturers) have
moved to an asset-lite or fab-lite model, but their competitiveness is challenged by their
global competitors and technological innovation (including emerging technologies so
called “more than Moore”). According to the European Competitiveness Report 2010,
micro-electronic patent application intensities in East Asia are more than twice as high as
in North America or Europe. Moreover, Europe is facing an innovation challenge as
                                       2

global competitors are more successful in bringing research to the market in the form of
new products, services or processes.          3

European ICT components and manufacturing clusters have an important role to play to
develop EU competitiveness and contribute to win the innovation challenge, by focusing
on technology transfer and bringing research results to the market. This study has
identified and profiled 48 European clusters, focusing on their strengths and weaknesses
and their key success factors for innovation performance. A comparative analysis with 10
leading international clusters, from the US and Asia, has led us to identify the most
effective mix of policies and funding measures, able to support the successful
development of the clusters. The ultimate goal of the study is to sustain European
leadership in this area by suggesting the best way to coordinate national/regional level
policies for clusters and R&D policies, providing inputs for the strategic management of
the forthcoming Horizon 2020 programme.
The focus of the study is on the electronics manufacturing value chain developing,
designing, manufacturing and assembling high tech electronic devices and products. The
ICT components and systems value chain includes materials, semiconductors, active
components, product design and assembly of high tech devices and products.

      1.1. CLUSTERS' KEY CHARACTERISTICS
The study focused on 48 European clusters, of which 9 were analysed in-depth as case
studies. ICT components manufacturing clusters grow following a wide variety of
business and organizational models. Key considerations about the main drivers of their
development are the following:
 • Ability to leverage local strengths. The most effective world-class clusters have
    adopted an organisation respectful of typology of the local players, the way they
    interact with each other and with public organisations, leveraging local strengths
    (e.g. private and bottom-up initiatives in the US; local and coordinated initiatives
    with strong SME implications in Germany; national coordination and big R&D
    programs implicating multinational companies in France; coordination and
    cooperation between cities, foreign direct investment, and government support in
    China, etc.). The impact of these characteristics is strong on funding, administration
    of the clusters, and relationships between the players.
•      One size does not fit all, but the presence of market leaders is a strong
       driver of growth. Size does not appear to be a differentiator between the European
       and non-European clusters, as all categories of clusters, from small to very large,
1
    European Commission (2011): High-level Expert Group on Key Enabling Technologies – Final report.
2   European Commission (2010): European Competitiveness Report 2010.
3
    European Commission (2011): High-level Expert Group on Key Enabling Technologies – Final report.
                                                                                                       7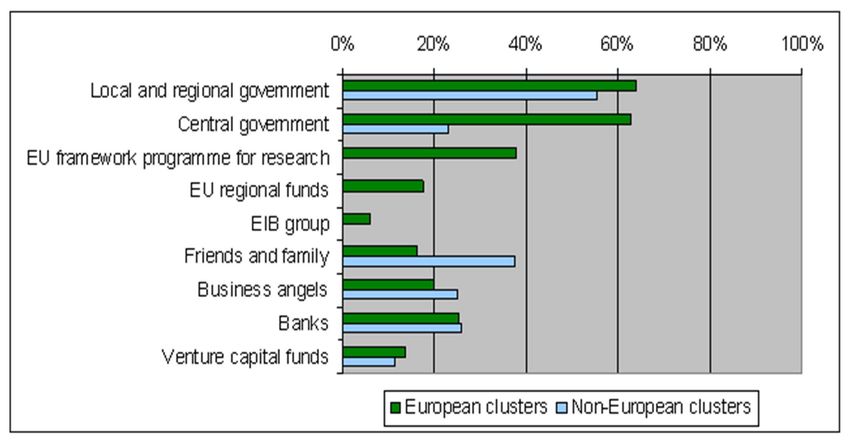
can be found in each region of the world. However, the pressure of globalisation is
    driving the need for clusters to have a more international presence, which may
    require supporting the growth of the cluster companies, increasing the size and reach
    of the cluster, expanding its partnerships, investing in its knowledge development
    with a wider horizon. The presence of major companies within clusters makes a
    difference, since it makes it easier to reach a critical mass of resources and
    investments. European clusters are potentially disadvantaged because only 2
    European players (ST Microelectronics and Infineon) rank in the top 15
    semiconductor suppliers worldwide. The US clusters for example benefit from the
    presence of multinational companies able to sustain a strong ecosystem of partners,
    distributors and universities, such as Intel in Arizona, Texas Instruments in Austin
    Texas, IBM in the North East and Intel/Microsoft in the North West clusters.
•   Need for a highly qualified workforce. The availability of high quality ICT skills is
    a key competitive factor. Clusters are paying increasing attention to the local
    presence of qualified people and the ability to mobilise talent for the upcoming
    technologies. For these reasons, the development of universities specialised in the
    ICT components field or the fame of its researchers are increasingly appreciated by
    cluster enterprises.
•   Relevant role of public funding. Every cluster tends to have a different mix of
    funding sources, depending on the national/regional policy strategies and the local
    socio-economic context. However, cluster organisations in Europe have to deal with a
    more severe legislation on state aid than US or Asian competitors; this limits their
    ability to access funding. The experiences with the Poles de Competitive initiative in
    France as well as regional initiatives such as Cluster Offensive Bayern in Germany
    suggest that financial support for the establishment of strong cluster organisations
    combined with funding for collaborative R&D&I projects is a successful approach to
    enable the growth of strong clusters in Europe.

    1.2.      MAIN SUCCESS F ACTORS
Every cluster is different, but performance always depends on a combination of factors
related with the so-called framework conditions (the socio-economic environment, the
regulatory environment, the business conditions); the strength of the cluster enterprises;
and the quality of cluster management (meaning the capability of cluster organizations to
coordinate and promote the activities of cluster members). The results of our survey with
cluster managers and enterprises (with a total of 123 interviews in Europe and 42 in Asia
and the US) confirm this view, indicating the access to high quality skills and to research
and knowledge among the most relevant framework conditions. While the sample is not
statistically representative of the thousands of enterprises present in European clusters,
the survey covered all the EU clusters active in ICT components manufacturing, targeting
key stakeholders, and can be considered qualitatively representative.
To deepen this analysis, we have compared the innovation performance of clusters
(measured through an objective indicator, the number of ICT patents per million
inhabitants) and the relevance of the main factors included in our analytical model
(based on survey results). The analysis was focused on 4 leading clusters, selected for
their achievements and their relevance: Minalogic and Systematic from France, and
Silicon Saxony and Mechactronics and Automation from Germany. Based on this, the
specific factors more strongly correlated with innovation performance are the following
ones:
 • The strength of cluster actors, meaning their market leadership and their
     entrepreneurial ability;
 • Access to high quality human resources;

                                                                                         8
•    Access to research and knowledge, meaning the presence in the cluster of leading
     universities and research centres;
 • The quality of cluster management, meaning the effectiveness of the cooperation
     and networking efforts of the cluster organization.
There is nothing particularly surprising in this list, however the important consideration is
that all these conditions must be present to insure the success of clusters; moreover,
their implementation is not as easy and straightforward as it may seem. These factors
should be prioritized by policies and initiatives aiming at developing world-class clusters
in the ICT component and systems manufacturing industry.

    1.3. ANALYSIS OF FUNDING MODELS
The analysis of funding and support measures has shown that there is a different mix of
policy tools in each country, used to support the emergence and development of the ICT
components clusters. However some common elements emerge:
Public funding is the main funding source for clusters
The two main funding sources are specific cluster programmes and R&D funding
(including EU funding). Regional/state funding plays a critical, but complementary role,
particularly to sustain facilities and infrastructures. The ERDF and programs such as
Interreg play an important role particularly in Eastern Europe (Hungary, Romania) and
for cross-border initiatives (the DSP valley for example). Tax incentives are not specific
for clusters, but are foreseen for R&D expenses of enterprises in most MS.
Clusters are becoming a channel for R&D funding
Clusters are becoming a favourite channel for national and EU R&D funding, thanks to
their ability to reach out to mixed stakeholder communities and to organize collaborative
research, as well as offer pragmatic services. National and EU governments are also
starting to leverage the clusters' capability to design roadmaps, select research priorities,
and act as intermediaries for competitive funding distribution to small enterprises. This is
particularly clear in France, where clusters such as Systematic even manage calls for
proposals and distribute funding to SMEs.
European vs non-European cluster models
Comparing European approaches to international approaches, we find that incentives for
ICT components and systems manufacturing in Europe do not match incentives in other
regions. As shown by the case studies on the Yang-Tze River Delta and Chungnam in
Korea, Both China and South Korea pursue regional development strategies driven by
lavish public funding both for research institutions and for enterprises, even though they
do not have cluster policies in the EU sense. Asiatic clusters are less specialised than EU
ones and can leverage both domestic and FDI capital. State aid provides strong support,
particularly in China, to factory and production lines building.
In the US state incentives to attract enterprises are much higher than usually perceived,
ranging from very high tax credits, to granting land or facilities almost for free. While no
specific funding measures for clusters are foreseen by federal policy, federal and national
policy support technology transfer from research to the market, by supporting research
centres and applied research labs, as well as R&D tax credit at federal and state level. In
addition, cluster enterprises have access to the richest venture capital and risk capital
market of the world, as well as to a wide variety of R&D funding programmes.
Need for joint prototyping facilities and pilot lines in Europe
In terms of EU funding, the interviews with experts and cluster managers suggested that
EU in the future could best support the competitiveness and growth of the ICT
components and systems manufacturing industry in Europe by providing financial support
for joint prototyping facilities and pilot lines that could help Europe keep its competitive
                                                                                           9
edge in advanced products and systems. Currently, the state aid regime in Europe
represents an effective constraint to funding actual production lines.
Support for cluster collaboration can help create critical mass
The strategic collaboration between Silicon Saxony cluster and the Grenoble cluster
constitutes a best practice case In Europe for cross-border cluster collaboration. The two
clusters have strengthened their cooperation in the area of nano-electronics and nano-
technologies focusing on education, research and development, industrial deployment,
SME coordination, and environment. This will strengthen the competitiveness of these
clusters vis-à-vis global competitors and for Europe the collaboration between the two
clusters is an important and inspiring example of how a joint strategy between clusters
can help create critical mass in Europe in key areas. The collaboration has now been
extended to include other European cluster through their involvement in a new large
project, Silicon Europe, funded through the EU Regions of Knowledge programme under
FP7. The EU could continue to support such initiatives in order to increase the
coordination of research and innovation efforts at cluster level to achieve critical mass at
EU level.
Furthermore, the targeted collaboration between clusters specialised in nanotechnology
and clusters representing relevant user-industries in the context of the Finnish
Nanotechnology Cluster Programme has been very successful in promoting innovation
and business collaboration. To promote innovation and business collaboration at
European level, the European Union could continue to support financially existing
platforms for cluster matchmaking activities, but focus activities more on matching
clusters representing technology-providers and relevant user-industries in Europe and
internationally.

   1.4. RECOMMENDATIONS
No single policy can guarantee the success of clusters: policy makers should be aware
that the most effective approach to clusters development is to select a portfolio of policy
instruments, tailored to the strengths and weaknesses of the different countries, regions
and clusters.
Based on our analysis, the following are the main policy dimensions relevant for clusters:
 • Innovation and R&D policy are the most relevant, shaping specific cluster policies
     and programs and determining the general context of clusters creation and
     development. These policies need to be harmonized at the EU, national and regional
     level;
 • ICT industry policy, Education and training policies and Financial policies (particularly
     for high tech funding) also need to be aligned with cluster policies, to make sure that
     cluster enterprises are not disadvantaged compared to global competition, have
     access to the necessary capital and to the right type of skills.
The EU and main MS already have a wide array of policies for clusters, many of whom
are well designed and should continue to be implemented. Our recommendations review
these main policy areas, highlighting the main gaps and weaknesses emerging from our
analysis which could be improved.
Innovation policy
Europe needs to better exploit research and knowledge by promoting collaboration
between industry and research, supporting spin-out activities from university and
industry, and providing support for entrepreneurs. Clusters constitute a strong
framework for these activities. With regard to the case studies carried out in this study,
the following recommendations should be considered:
 • Strengthen support for innovation and entrepreneurship in clusters
 • Increase focus on demand-side measures to support innovation in Europe, for
     example through pre-commercial public procurement
                                                                                         10
• Continue support for European platforms for cluster collaboration, such as the Silicon
Europe project
• Promote quality of cluster management, through co-funding for cluster organizations,
but also through evaluation and benchmarking of cluster performance.
R&D policy
The main challenges for the ICT components industry in Europe concern the need to
accelerate the commercialization of technology, improving technology transfer, capturing
growth opportunities and easing the handling of IP Rights. For these reasons, the
following recommendations have been suggested:
• Close the gap between Research and Innovation by combining R&D funding
instruments and industrial policy measures, including more generous tax incentives
for private R&D investments, as done in the US, China and South Korea;
• Establish a joint strategy between EU bodies and Member States for the ICT
Components and Systems Manufacturing sector;
• Enhance the Marie Curie programme to cater for advanced manufacturing careers, as
well as for research careers;
• Strengthen the attractiveness of micro and nano-electronics for European students
Financial Policy
A variety of funding instruments are already being used in EU member states to promote
R&D&I and manufacturing activities. However the share of public funding (such as
grants) is still much higher than private funding. A possible action could be the following
one:
• Promote the use of private funding sources by engaging with the private investor
community and establishing a co-investment vehicle targeting the European ICT
components and systems industry.
Venture Capital and High Tech Funding Policy
Very few European clusters stakeholders have access to venture capital funds, at the
same level as US or Asian clusters. With regard to these challenges, we suggest the
following actions:
• Support clusters in the development of strategies focused on the commercialisation
of the results of research, able to attract risk capital. This may require focusing on
smart design and small improvements of ICT Components, suitable to be brought to
the market with small amounts of capital.
• Develop funding measures helping universities/public labs to invest into cutting edge
research for ICT components (for example in the new materials and potentially
disruptive technologies such as graphene, or in next generation manufacturing of
450mm), as well as into the provision of prototyping facilities and pilot lines,
providing access to local enterprises, on the basis of public-private partnerships. This
may include allowing the industrial partners to buy into the equipment used, after a
pre-determined time.
ICT Industry Policy
China, South Korea, and the US at state level provide substantial incentives to attract
R&D facilities, as well as subsidies and tax credits to companies involved in ICT
components and systems manufacturing. European clusters need to be able to match
these business conditions in order to keep R&D and manufacturing activities in Europe.
The High Level Expert Group Report on Key Enabling Technologies (KET HLG, 2011) for
example recommended the introduction of a matching clause into general EU State Aid
rules, which would allow Member States to match funding up to the maximum levels of
support provided elsewhere for product development and manufacturing activities while
respecting WTO rules.
For these reasons, the following recommendations have been suggested:
11• Increase attractiveness of European clusters as a location for companies in entire ICT
components and systems value chain, developing FDI and local development
measures, suitable to attract multinational companies and support the growth of
local companies
• Adapt EU State Aid rules to allow funding and benefit packages for cluster
development
• Support scale-up activities and the industrialisation of emerging technologies
Education and Training Policy
World class ICT components clusters require high qualified engineers, and access to a
qualified work force is one of the key success factors, especially in the case of
establishing a new manufacture. For these reasons, the following recommendations have
been suggested:
• Enhance collaboration between universities and ICT companies focusing on
collaboration and inputs from the companies, development of shared facilities and
cross-investments and on training
• Develop a European education centre of excellence on ICT Components through
cross-university collaboration based on the EU University rankings established in
Europe 2020;
• Favour the development of specific training/education programs related to some key
issues for the success of ICT Components clusters.
1.5. BACKGROUND
This is the Final Report (D4) of the study "Strategies for Innovative and Effective ICT
Components and Systems Manufacturing in Europe" entrusted by the European
Commission DG Connect to IDC and FORA. The profiles of 48 European clusters and 10
international clusters are presented in a separate Annex report. The study was carried
out from January to December 2012, including desk research, a web survey, and a
telephone survey, resulting in 165 interviews to 70 clusters in total.
122 INTRODUCTION AND BACKGROUND
This is the Final study report (D4) of the Study "Strategies for innovative and effective
ICT Components & Systems Manufacturing in Europe". This study is entrusted by the
European Commission Directorate-General Connect, Components Unit (A4) to IDC and
FORA.
The main goal of this study is to provide recommendations to the EU's policy makers for
strengthening the competitiveness of European electronics manufacturing, with a focus
on development of European ICT components and systems manufacturing clusters. The
ultimate goal is to sustain European leadership in this area by suggesting the best way to
coordinate national/regional level policies for clusters and R&D policies, feeding into the
strategic management of the forthcoming Horizon 2020 programme. To do so, the study
identified and investigated the main ICT components manufacturing clusters, analysed
their main success factors, reviewed their funding and governance policies, and
compared them with those of selected initiative outside the EU.
2.1 POLICY CONTEXT OF THE STUDY
Europe 2020 — the European strategy for smart, sustainable and inclusive growth —
constitutes the main reference point for the EU in the years to come. The strategy
identifies innovation as a key driver for global competitiveness and economic growth in
the EU, and calls for stronger collaboration between Member States and regions to avoid
duplication of efforts and help create critical mass in Europe to meet the challenge of
increasing global competition in all parts of the value chain. The importance of European
clusters is explicitly mentioned in three of the flagships initiatives under Europe 2020:
"Innovation Union", "An industrial policy for the globalisation era", and "Digital Agenda
for Europe". For instance, the "Innovation Union" flagship initiative calls for more efforts
to support the emergence of world class clusters as well as increasing trans-regional
cooperation, and the "Digital Agenda for Europe" mentions innovation clusters along with
stronger e-Infrastructures as strategic elements in the building up of Europe's innovative
advantage in key areas.
The importance of clusters for innovation, growth and regional attractiveness was also
recognised by the Competitiveness Council (May 2010), which stated that "the efforts
need to be continued to remove barriers to trans-national cluster cooperation and to
encourage the emergence and consolidation of world-class competitive clusters across
Europe". Finally, the importance of clusters in regional smart specialisation strategies
4
has been emphasised in the recent Communication on "Regional Policy contributing to
smart growth in Europe 2020" (COM(2010) 553 final). 5
More specifically, the importance of manufacturing clusters in Europe for innovation and
competitiveness in the ICT component and systems manufacturing industry was
highlighted in the recent report "Exploring the potential of ICT Components and Systems
Manufacturing in Europe" by the VDIVDE and CEA Leti. With regard to main policy
recommendations, the study identified a need to:
• Close the gap between research and innovation through a well-coordinated set of
targeted support measures and smart incentives
• Develop a joint European strategy on electronics manufacturing
• Support all parts of the value chain and increase collaboration between actors along
the value chain
These recommendations also find support in a 2011 study on the deployment of key
enabling technologies (KETs), including micro- and nanoelectronics. This study addresses
4
http://www.consilium.europa.eu/uedocs/cms_Data/docs/pressdata/en/intm/114637.pdf
5European Commission (2010), http://ec.europa.eu/regional_policy/sources/
docoffic/official/communic/smart_growth/comm2010_553_en.pdf
13the challenges facing the EU with regard to KETs and concludes that EU member states
needs to develop a joint strategy for KETs which aligns and prioritizes resources to
achieve sufficient scale and critical mass in Europe, that there is a need to support
technology transfer and late-stage innovation processes (demonstration and
commercialisation activities), and increase access to risk capital as well as increase
support for all parts of the value chain . .6
2.2 CLUSTERS' DEFINITION
For the purpose of the study and in order to identify national and regional clusters for
electronic manufacturing in Europe, we have based our research on the definition of
innovation clusters as "groupings of independent undertakings — innovative start-ups,
small, medium, and large undertakings as well as research organisations — operating in
a particular sector and region and designed to stimulate innovative activity by promoting
intensive interactions, sharing of facilities and exchange of knowledge and expertise and
by contributing effectively to technology transfer, networking, and information
dissemination among the undertakings in the cluster."
In more general terms, clusters can be defined as a group of firms, related economic
actors, and institutions that are located near each other and have reached 7a sufficient
scale to develop specialised expertise, services, resources, suppliers and skills ."
A common element of most cluster definitions is the geographical concentration of one or
more sectors within a given region as well as the emphasis on networking and
cooperation between companies and institutions.
Based on this definition, several kinds of clusters have been identified:
• Immature clusters: this category refers to emerging or potential clusters
• Mature clusters, which refer to national or world-class established clusters
• In transition clusters: this category refers to declining clusters or clusters that need
to deeply redefine their strategy, goals or objectives
As this study aims at selecting and studying best practices, we have mainly focused on
mature clusters and excluded "in transition" clusters.
2.3 FOCUS AND SCOPE
The focus of the study was on European and international ICT components manufacturing
clusters. The clusters targeted belong to the electronics manufacturing industry and they
are active in one or more of the following market segments:
• Materials: selected clusters focus mainly on nanotechnologies research and
development.
• Semiconductors: selected clusters focus mainly on nano-electronics and micro-
electronics.
• Active components: selected clusters focus mainly on photonics and sensors.
• Products design and assemblies: selected clusters focus mainly on Mechatronics,
software / embedded system and systems design.
• Electronics high tech device and products: selected clusters focus mainly on
computers, peripherals, servers, storage, networking, telecommunication products
but also automotive, medical/health and industrial products integrating electronic
components.
The study team identified a long list of 1,307 EU clusters, of which 114 operate in the ICT
industry. A web research selected 46 clusters (plus 2 in Switzerland) as falling within the
6 European Commission (2011): Cross-sectoral Analysis of the Impact of International Industrial Policy on
Key Enabling Technologies, http://ec.europa.eu/enterprise/sectors/ict/files/kets/ket-report_en.pdf
7 Community Framework for State Aid for Research and Development and Innovation
14specific scope of the study, plus 10 international clusters from the US, China, Taiwan and
South Korea.
A survey carried out in two waves in May and October 2012 achieved a total of 165
interviews from these clusters, which complemented with desk research provided the
basis for the cluster profiles and the analysis of funding and support measures.
The following clusters were singled out for in-depth analysis in Europe:
• Cambridge Cluster, UK
• Cluster Mechatronik Automation, Germany
• Mi-Cluster (Corallia), Greece
• Me2C, Austria
• PrintoCent cluster, Finland
• Systematic Paris Region, France
The following international clusters were analysed in depth:
• Silicon Forest in the US NorthWest
• Yang-Tze River Delta in China
• Chungnam & Daejeon in South Korea
2.4 STRUCTURE OF THE REPORT
This report is structured as follows.
Chapter 1 – Executive Summary
This chapter briefly summarizes the key findings of the study:
• Key characteristics of clusters
• Key success factors for EU clusters
• Analysis of funding schemes
• Recommendations
Chapter 2 — Introduction and Background
This chapter illustrates the policy context of the study, the main goals and scope, and the
key definitions used in the study.
Chapter 3 — General approach
This chapter illustrates the main characteristics of the electronics manufacturing market
and the main challenges faced by the semiconductor industry in the research,
development and education fields.
Chapter 4 — Identification of national and regional clusters for electronics
manufacturing in and outside Europe
This chapter presents an overview of the ICT components clusters and provides the main
results of our survey on the clusters about their structure and organisation, their
specialisation, their background and economic importance.
Chapter 5 — Key success factors for European electronics manufacturing
clusters
This chapter analyses in detail which main factors have the highest relevance for the
success of clusters.
Chapter 6 — Analysis of funding schemes and other support instruments behind
the clusters
15This chapter provides a qualitative mapping of funding and support measures used by
the leading clusters and their relative importance for the clusters operations and
activities.
Chapter 7 — Recommendations
This chapter draws the final conclusions of the study and presents the main
recommendations for the policy mix best suited to drive the development of ICT
components clusters and improve the competitiveness of the EU electronics
manufacturing industry.
Annexes
The Annex integrated with this final report present:
• List of Main references
• The glossary of main terms, acronyms and abbreviations
• Methodology of Data Collection
A separate Annex report presents:
• In-depth profiles of 6 European and 3 international clusters
• Short, standardised profiles of 46 EU, 2 Swiss and 7 international clusters
163 GENERAL APPROACH
3.1 C HARACTERISTICS OF THE ELECTRONICS
MANUFACTURING MARKET
3. 1 . 1 D e f i ni ti o n a n d v a l u e c h a i n
Our working definition of electronics manufacturing industry is:
"The Electronics manufacturing industry is the manufacturing value chain developing,
designing, manufacturing and assembling High Tech devices and products."
The electronics manufacturing value chain includes a high number of actors, interacting
with different roles and responsibilities. The two main actors to be considered in this
study are the following:
• EMS providers (Electronics Manufacturing Services): Previously known as contract
manufacturers who provide outsourcing services that may include new product
introduction (NPI) services, manufacturing and assembly services, a variety of after-
market services and logistics and supply chain services. (Examples: Flextronics,
Sanmina-SCI, Celestica, Solectron.)
• ODM (Original Design Manufacturers): Manufacturers who provided design services,
support and products for OEMs. Many ODMs provide both design and manufacturing
services and may also sell their own branded products. (Examples: Quanta, Compal,
Arima, BenQ, ASUSTeK.)
The Electronics Manufacturing Value chain can be represented as following:
Figure 1 - The Electronics Manufacturing Value Chain
Note: IDC 2011 Annual exchange rate of 0.71897 Euros per dollar is assumed for the forecast
period.
Source: IDC, 2012
The EMS products sectors include:
• Client and Consumer devices:
o Computers: Mobile PC, Desktop PC, Thin Clients
17o Peripherals Copiers, Facsimiles, MFPs, Printers
o Consumer Devices : Digital entertainment, Digital camcorders/
cameras, Digital home, Gaming devices, Handsets/mobile phones,
Tablets, eReaders
• Enterprise and Infrastructure Products
o Servers and Storage: Servers/workstations, Disk & tape storage
systems
o Networking: LAN switches, Routers; Wireless LAN (WLAN)
o Telecommunications: Mobile wireless infrastructure, Broadband
and CPE, Traditional & IP telephony
• Emerging Products
o Automotive: Automotive control modules, Automotive
modules/subsystems, Infotainment
o Medical: Class I, II, III medical devices, Medical
Instrumentation/systems
o Industrial: Industrialized control systems, Semiconductor
equipment, Test, measurement, etc., Aerospace/Defence, Retail
Systems, Clean Tech
3.1.2 M a r k et f o r e c a s t s
For 2012, IDC is expecting the EMS industry to grow by 4%, due to weak growth
across most segments, especially PCs. The one bright area is tablets. Other consumer
opportunities have been mixed throughout the year, with increased outsourcing for
smartphones and TVs but weakening demand. The EMS sector should see 4% growth
in 2012, largely due to growth in tablets and smartphones, increased outsourcing for
TV production, and growth in the automotive segment. The ODM segment should fare
a little better, growing by 6% thanks to growth in consumer products. The ODM sector
in the PC segment was reduced slightly to account for tablet products that were
formerly included in the PC segment.
Beyond 2012, consumer devices will become the largest of the nine product segments.
This is driven by the growth of tablets and the expected growth in outsourcing rates
for smartphones and TVs. However, once these new product ramps are completed,
growth rates should slow to reflect end market growth. We also expect to see
increased outsourcing in Emerging Product segments for a variety of reasons,
including increased use of EMS/ODMs. The EMS industry CAGR for 2011 through 2016
should reach 6%.
Macroeconomic conditions are still weighing on the market, and while fears of a major
default in Europe are easing somewhat, Europe will remain weak through 2013. The
U.S., now past the elections, is still facing significant pressures from fiscal policy
uncertainty and enterprises are expected to decrease their spending.
OEMs are also becoming aware that poor working conditions at EMS/ODMs can
negatively affect their brand images, such as Apple following several reports on Hon
Hai. Also, costs continue to rise in China, which is putting pressure on OEMs to accept
higher pricing.
ODMs are selling directly to large datacenter owners for servers and to a lesser extent
storage systems. The consequences of this move are starting to emerge, as OEMs
threaten to pull orders.
183.2 S EMICONDUCTORS: A KEY SEGMENT OF THE
VALUE CHAIN
3. 2 . 1 A growing market
Semiconductors are at the heart of every major electronic system driving a rapid cadence
of investment and innovation. The semiconductor value chain is represented hereunder:
Figure 2 - The Semiconductor Value Chain
Source: IDC, 2012
In 2011, the industry surpassed €227 billion for the first time in history. In the period to
2020, we expect the semiconductor industry to add an additional €123 billion to the top
line; reaching €350 billion (Error! Reference source not found.).
Figure 3 Worldwide Semiconductor Revenue Forecast 2011–2020 (€B)
Note: IDC 2011 Annual exchange rate of 0.71897 Euro per dollar is assumed for the forecast
period.
19Figure 4 Worldwide Semiconductor Market Revenue Forecast by World Region,
2011-2020 (€B)
Note: IDC 2011 Annual exchange rate of 0.71897 Euro per dollar is assumed for the forecast
period.
Source: IDC, 2012
Moore's law has been instrumental in predicting the pace of performance and integration
for over 40 years in the semiconductor industry and has enabled billions of transistors on
a single chip possible in today's designs. IDC expects that Moore's law will continue to
dictate the pace of technology innovation over the next decade for leading semiconductor
suppliers. However, the key barrier to overcome will continue to be the growing cost of
process technology and cost to build a leading edge fabrication which today stands at
about $5 billion (€3.59 billion). By the second half of this decade, this cost is expected to
double, reaching nearly $10 billion (€7.19 billion), when the industry introduces 450mm
wafers in commercial volume. Only a handful of companies will be capable of investing at
these levels by the end of this decade.
The market trends by world regions are forecast in Error! Reference source not found..
The Asia/Pacific region, with Japan and China, is expected to continue to grow faster than
the others, with a share of worldwide semiconductor revenues increasing from 42% in
2016 to over 45% in 2020. The market share of the EMEA region (which includes the EU,
the other European countries, Africa, the Middle East, and the former Soviet Union) is
expected to decrease slightly, even though market revenues are expected to increase to
$90 billion by 2020.
Despite the ongoing global macroeconomic uncertainties, such as the Eurozone crisis,
lower global GDP growth, and economic slowing in the BRIC countries, current demand
remains strong for semiconductors in applications such as smartphones, media tablets,
and automotive electronics. Further, there are high expectations for the launch of
Microsoft's Windows 8 operating system and next-generation smartphones later this year,
which will accelerate semiconductor revenue growth in 2013 and beyond.
As IDC forecast earlier this year, the cyclical semiconductor downturn that started in the
middle of last year reached bottom in the second quarter of 2012.
Supply constraints on semiconductor products, such as smartphone applications
processors, and PC discrete graphics processors based on the most advanced process
technologies, are easing as foundries are bringing more capacity online. Also, the
semiconductor industry has recovered from the flooding in Thailand in 2011 that held
back the supply of hard drives and PCs. Leading-edge 22nm at Intel is ramping fast now,
while foundries and memory companies are getting ready to move to 20nm technology
node.
While all these point to strong semiconductor growth, IDC notes that near-term growth
will be slower than that of past semiconductor cycles due to macroeconomic weakness.
20Regionally, Europe continues to be weak across the board. In the U.S., consumer and
automotive markets are showing strong semiconductor demand. Although GDP growth
has slowed in China, India, and Brazil, demand for smartphones, tablets, and notebooks
remains strong.
3.2.2 A market creati ng and destructing value
Even though the semiconductor market is a growing market, and contributes a lot to the
global productivity of the worldwide economy, only a few players benefit from it and
generate economic value (i.e. net profits). Several factors can explain the challenges ICT
components manufacturers have to face and the fact that the industry destroys more
value for itself than it creates:
• Cyclicality: historically, the semiconductor industry has shown strong cyclical
behaviour. During a typical upturn of one to two years, most companies generate
profits, which they use to sustain their operations during the downturn. In addition,
many players use their strong performance during an upturn to attract investors in
the public markets or get new loans to fund capital investments; in many cases,
governments subsidize this refinancing. But precisely because investment runs ahead
of market demand in the upturn, the period is followed by a longer downturn or a
very slow growth period, during which poor performers struggle. Even though this
characteristic is moderating, it remains true in many cases.
• Rising costs in R&D: chip makers invest heavily, driven to meet the expectations
of Moore's Law. Costs have naturally risen along with the ever-increasing complexity
of the chips. In addition, the investment hurdle for building a state-of-the-art chip
fab continues to rise.
• Costs pressure: In response to these higher costs, many semiconductor companies
have resorted to "fab lite" strategies, outsourcing an increasingly large fraction of
their chip production to dedicated manufacturing foundries. Although this has
resulted in an overall net reduction of capital expenditure in the industry, it has also
led to intense cost pressure on chip makers that continue to handle all their
manufacturing in-house. The shift of manufacturing to Asia has created additional
cost pressures on those that have yet to transfer operations to lower-cost locations.
Prices also remain under pressure in the industry as consumer applications become
the main force driving the semiconductor market. The much higher elasticity of
demand as prices decline has further accelerated the erosion of average selling
prices. All these pressures are intensified by the shift in the end-user market to Asia.
3.3 GENERAL CHALLENGES IN RESEARCH,
DEVELOPMENT AND EDUCATION
Research and development is the lifeblood of the semiconductor industry, so it is no
surprise that R&D tends to be the highest-pressure corner of this high-intensity business.
Much of this pressure results from the fact that time to market is a crucial metric for
semiconductor makers: speed, specifically on-time delivery, is a key success factor in a
market characterized by tight design-in windows, shortening product life cycles, and
relentless price deflation. Two parallel challenges have been identified:
• Moore's Law still sets the industry's pace; ever-rising investments and technology
challenges, such as rising chip complexity, are also a factor.
• The second core challenge is mastering system design, which involves integrating
hardware and software blocks, as well as various films, coatings, and layers, and
ensuring they are customized to reflect customer and end-consumer preferences.
Indeed, a number of leading-edge wireless semiconductor players now employ twice
as many software engineers as traditional hardware engineers.
21You can also read