VITAL SIGNS 2020 The Health and Readiness of the Defense Industrial Base - National Defense Industrial Association
←
→
Page content transcription
If your browser does not render page correctly, please read the page content below

VITAL SIGNS 2020
    The Health and Readiness
  of the Defense Industrial Base

                                   Powered By
STAFFING
NDIA
Wesley Hallman                                                        Logan Stalter
Senior Vice President, Strategy & Policy                              Copywriter/Editor, Marketing & Communications
Editing                                                               Copyediting

Chris Smith                                                           Hannah Meushaw
Associate, Regulatory Policy                                          Senior Graphic Designer, Marketing & Communications
Data, Writing, and Editing                                            Layout and Design

Corbin Evans                                                          Shivani Soni
Director, Regulatory Policy                                           Graphic Designer, Marketing & Communications
Editing                                                               Layout and Design

Brian Boone                                                           Evamarie Socha
Junior Policy Fellow                                                  Director, Public Relations & Communications
Research Assistance                                                   Media Outreach

Kevin Merrick                                                         Aaron Cohen
Junior Policy Fellow                                                  President, Aaron Cohen PR
Research Assistance                                                   Media Outreach

Jens Pedersen-Giles
Junior Policy Fellow
Research Assistance

Govini
Matt Wiest                                                            Owen Munford
Engagement Manager                                                    Vice President, Marketing

Nate Lambeth                                                          Jim Mitre
Senior Analyst, National Security                                     Senior Vice President, Strategy & Analysis

Katrina Gross                                                         Kathryn Harris
Analyst                                                               Senior Vice President, Strategy & Growth

ABOUT NDIA
The National Defense Industrial Association (NDIA) drives strategic dialogue in national security by identifying key issues and leveraging
the knowledge and experience of its military, government, industry, and academic members to address them. NDIA, comprised of
its Affiliates, Chapters, Divisions, and 1,700 corporate and 70,000 individual members, is a non-partisan, non-profit, educational
association that has been designated by the IRS as a 501(c)3 nonprofit organization—not a lobby firm—and was founded to educate its
constituencies on all aspects of national security.

DISCLAIMER
The ideas and findings in this report should not be construed to be official positions of either any of the organizations listed as
contributors or the membership of NDIA. It is published in the interest of information exchange between government and industry,
pursuant to the mission of NDIA.

VITAL SIGNS 2020

TABLE OF CONTENTS
Foreword.. . . . . . . . . . . . . . . . . . . . . . . . . . . . . . . . . . . . . . . . . . . . . . . . . . . . . . . . . . . . . . . . . . . . . . . . . . . . . . . . . . . . . . . . . . . . . . . . 4

Executive Summary.. . . . . . . . . . . . . . . . . . . . . . . . . . . . . . . . . . . . . . . . . . . . . . . . . . . . . . . . . . . . . . . . . . . . . . . . . . . . . . . . . . . . 5

Introduction. . . . . . . . . . . . . . . . . . . . . . . . . . . . . . . . . . . . . . . . . . . . . . . . . . . . . . . . . . . . . . . . . . . . . . . . . . . . . . . . . . . . . . . . . . . . . 8

Section I: Competition Conditions.. . . . . . . . . . . . . . . . . . . . . . . . . . . . . . . . . . . . . . . . . . . . . . . . . . . . . . . . . . . . . . . . . . . 15

Section II: Production Inputs Conditions. . . . . . . . . . . . . . . . . . . . . . . . . . . . . . . . . . . . . . . . . . . . . . . . . . . . . . . . . . . 21

Section III: Demand Conditions.. . . . . . . . . . . . . . . . . . . . . . . . . . . . . . . . . . . . . . . . . . . . . . . . . . . . . . . . . . . . . . . . . . . . . 28

Section IV: Innovation Conditions. . . . . . . . . . . . . . . . . . . . . . . . . . . . . . . . . . . . . . . . . . . . . . . . . . . . . . . . . . . . . . . . . . . 32

Section V: Industrial Security Conditions. . . . . . . . . . . . . . . . . . . . . . . . . . . . . . . . . . . . . . . . . . . . . . . . . . . . . . . . . . . 38

Section VI: Supply Chain Conditions. . . . . . . . . . . . . . . . . . . . . . . . . . . . . . . . . . . . . . . . . . . . . . . . . . . . . . . . . . . . . . . . 42

Section VII: Political and Regulatory Conditions. . . . . . . . . . . . . . . . . . . . . . . . . . . . . . . . . . . . . . . . . . . . . . . . . . . 47

Section VIII: Productive Capacity and Surge Readiness.. . . . . . . . . . . . . . . . . . . . . . . . . . . . . . . . . . . . . . . . . . 52

Conclusion.. . . . . . . . . . . . . . . . . . . . . . . . . . . . . . . . . . . . . . . . . . . . . . . . . . . . . . . . . . . . . . . . . . . . . . . . . . . . . . . . . . . . . . . . . . . . 60

Appendix I. . . . . . . . . . . . . . . . . . . . . . . . . . . . . . . . . . . . . . . . . . . . . . . . . . . . . . . . . . . . . . . . . . . . . . . . . . . . . . . . . . . . . . . . . . . . . 62

Appendix II.. . . . . . . . . . . . . . . . . . . . . . . . . . . . . . . . . . . . . . . . . . . . . . . . . . . . . . . . . . . . . . . . . . . . . . . . . . . . . . . . . . . . . . . . . . . . 64

Data Sources. . . . . . . . . . . . . . . . . . . . . . . . . . . . . . . . . . . . . . . . . . . . . . . . . . . . . . . . . . . . . . . . . . . . . . . . . . . . . . . . . . . . . . . . . . 65

Endnotes.. . . . . . . . . . . . . . . . . . . . . . . . . . . . . . . . . . . . . . . . . . . . . . . . . . . . . . . . . . . . . . . . . . . . . . . . . . . . . . . . . . . . . . . . . . . . . . 67

                                                                                                    3
VITAL SIGNS 2020

FOREWORD
General Hawk Carlisle, USAF (Ret), NDIA President and CEO
For nearly 40 years, I had the honor to serve in the U.S. Air Force and fly some of the greatest machines built by human hands.
Those aircraft were superior in every way to those of our adversaries and competitors. In fact, the U.S. defense industrial base
has developed and produced the innovative, advanced, game-changing technologies and services enabling our armed forces
to enjoy significant capability advantages for over 80 years. Such superiority, however, is not a birthright. It takes long-term
investments in people, research, ideas, infrastructure, and—yes—companies.

Those investments are the result of trade-offs with investments in other priorities and, when done right, are the result of
deliberate strategies. Strategy comes from determining an endstate, identifying available resource means, and choosing various
ways in which those resources can be brought to bear… ends, ways, and means.

The 2018 National Defense Strategy has done just that by including a call for leveraging the defense industrial base to enable
a more lethal force. However, knowing where to invest in that base requires an understanding of its health and readiness to
respond to warfighter needs. To that end, the National Defense Industrial Association (NDIA) has completed this pilot of an
annual report we call Vital Signs.

As the non-partisan industry association representing all sectors of all sizes within the defense industrial base and chartered with
educating the national security community on industrial base issues, we are uniquely called upon to provide this report. I believe
it will serve as both an annual baseline for discussion and provide for trend analysis over time.

We hope and expect this report to be of value every year as the national security community debates the investments
(means) and policies (ways) to ensure our warfighters maintain and extend their qualitative advantages over any adversaries or
competitors while our nation remains strong and secure in the years and decades to come.

Tara Murphy Dougherty, Govini CEO
The defense industrial base has long underpinned the United States’ military strength. In World War II, America was the “arsenal
of democracy,” forging the armaments the Allies used to defeat the forces of fascism and militarism.i Technological advantage
enabled the U.S. and Allied militaries to offset superior Soviet numbers during the Cold War. Likewise, U.S. global military
dominance over the past 30 years has rested on innovations pioneered by U.S. industry. As America enters a new era of great
power competition, the defense industrial base remains essential to its security.

Harnessing technological innovations for application in warfare will be crucial—and may prove decisive—in the battle for military
advantage. China and Russia continue to modernize their militaries. In response, the Department of Defense (DoD) must
modernize to build a more lethal force. As the National Defense Strategy states, “We cannot expect success fighting tomorrow’s
conflicts with yesterday’s weapons or equipment.”ii

The United States, however, faces a different innovation landscape than it has in the past. Unlike the Soviet Union, China is a
rival economic power and is rapidly closing the gap in technological progress. DoD will not be able to simply spend its way to
technological preeminence and military dominance. Moreover, China’s efforts to exploit technological advancements made by
others for its own benefit threaten the security of the defense industrial base. At the same time, many of the leading innovators in
critical technology areas reside outside DoD’s traditional vendor base. As a result, DoD must expand the defense industrial base
and employ more nimble contracting mechanisms better suited for engaging with non-traditional defense partners.

Maintaining military advantage in an era of renewed strategic competition requires a healthy and vibrant defense industrial base.
Vital Signs 2020: The Health and Readiness of the Defense Industrial Base is an essential step towards ensuring that is the case.
Its holistic, data-driven approach to assessing the health of the industrial base replaces anecdotes with evidence while providing
a model for regular monitoring and assessment. In so doing, Vital Signs 2020 offers a necessary baseline of the current health of
the defense industrial base while also pointing the way forward.

                                                                 4
VITAL SIGNS 2020

EXECUTIVE SUMMARY
2018’s Executive Order 13806 report on production risks to critical defense industrial supply chains starkly framed the
health of the U.S. defense industrial base as key to the readiness of U.S. armed forces to confront near-term threats and
compete long-term against strategic adversaries. Despite its high-resolution snapshot of the defense industrial base’s
“unprecedented set of challenges,” the report does not provide the public and the defense policy community either an
unclassified summary measurement of the health and readiness of the defense industrial base or a simple way of tracking such a
measurement over time.iii

To fill this gap, the National Defense Industrial Association (NDIA) has piloted what is intended to become an annual project
by writing Vital Signs 2020. In order to provide a comprehensive assessment of the defense industrial base, our procedure
involved standardizing and integrating different elements of both the defense sector and the business environment that shapes
its performance.

2020’s mediocre “C” grade reflects a business environment characterized by highly contrasting areas of concern and
confidence. Deteriorating conditions for industrial security and for the availability and cost of skilled labor and materials emerge
from our analysis as areas of clear concern. Favorable conditions for competition in the defense contracting market and a
rising demand for defense goods and services reflect recent year-over-year growth in the defense budget. This first iteration of
an expected annual study contributes to the debate about national defense acquisition strategy by offering a common set of
indicators—vital signs—of what some have called America’s “sixth service,” the industrial partners who equip our warfighters
with their capability advantages.

Methodology
In order to complete this assessment, we conducted a months-long study of data related to eight different dimensions that
shape the performance capabilities of defense contractors: market competition, cost and availability of skilled labor and critical
materials, demand for defense goods and services, investment and productivity in the U.S. national innovation system, threats
to industrial security, supply chain performance, political and regulatory activity, and industrial surge capacity. We analyzed
over 40 longitudinal statistical indicators, converting each of them into an index score on a scale of 0 (bad) to 100 (excellent). By
evaluating three years of data for these indicators, we obtained a three-year running average and controlled for data spikes such
as the 2018-2019 government shutdown. Once we aggregated the individual indicator scores into scores for each dimension,
we did so into an overall composite score for the defense industrial base, which turned out to be 77 out of 100 for this year—a
passing C grade but with a worrying downward trend.

               COMPOSITE INDEX SCORES
               DIB Health Dimension                         2017        2018         2019        Change, 2017 – 2019
               Competition                                  94          95           96            +2
               Production Inputs                            70          68           68            -2
               Demand                                       78          84           94            +16
               Innovation                                   78          76           74            -4
               Industrial Security                          69          65           63            -6
               Supply Chain                                 83          83           68            -15
               Political and Regulatory                     92          89           79            -13
               Productive Capacity and Surge Readiness      68          70           77            +9
               Overall Health and Readiness                 79          79           77            -2

                                                            Source: NDIA

                                                                   5
VITAL SIGNS 2020

Areas of Concern
Our analysis reveals a stressed defense industrial base that is trending negative. Composite scores for four of the eight
dimensions eroded in 2019 since 2018. Meanwhile, six dimensions earned composite scores lower than 80 and three
dimensions earned scores below 70, which are failing grades. These scores suggest that the defense industrial base is
increasingly struggling to meet the ‘unprecedented’ challenges it faces.

Industrial security scored the lowest among the eight dimensions with a 63 for 2019. In fact, industrial security has gained
prominence as massive data breaches and brazen acts of economic espionage by state and non-state actors plagued defense
contractors in recent years. To assess industrial security conditions, we analyzed indicators of threats to information security
and to intellectual property (IP) rights. The indicators of global information security threats were already failing in 2017 and
scored even lower in 2019 given the rising annual average number of new cyber vulnerabilities documented by MITRE, which
almost doubled between 2016 and 2018 when compared to the period between 2014 and 2016. The score also incorporates
MITRE’s annual average of the threat severity of the new cyber vulnerabilities, which improved slightly between 2016 and 2018
but remains high. In contrast, threats to IP rights scored 100 out of 100 for 2019 as the number of new FBI investigations into IP
rights violations steadily declined since reaching an all-time high in 2011.

Defense industry production inputs also scored poorly in 2019 with a 68, exhibiting a decline from an already barely passing
score of 70 for 2017. Major production inputs include the skilled labor, intermediate goods and services, and raw materials used
to manufacture or develop end-products and services for Defense Department consumption. Relatively low 2019 index scores
for defense industry workforce size contributed to this dimension’s low score. Our estimate of the size of the defense industry
workforce, currently about 1.1 million, falls substantially below its mid-1980s peak size of 3.2 million.

Security clearance process indicators also contributed to the low overall composite score for production inputs as backlogs
shrink but persist. Onboarding new personnel in the defense industry often requires navigating the security clearance process.
Defense contractors face a security clearance management process that became more complicated from 2017 to 2019. The
index scores for the annual average number of pending security clearance investigations declined for 2019 with much of that
decline due to issues with initial top secret clearances.

Areas of Confidence
The state of defense contracting competition and the state of demand for defense goods and services offer the defense
industrial base a favorable outlook. An analysis of the top 100 publicly traded Defense Department contractors demonstrates
that competition conditions in the defense industrial base earned a composite index score of 96 for 2019. Several high-
scoring indicators drove the strength of market competition conditions, including the availability of cash assets, the low level of
market concentration of total contract award dollars, the relatively low share of total contract award dollars received by foreign
contractors, and the high level of capital expenditures. Additionally, the defense industrial base earned a solid score of 88 for
profitability for 2019 based on index scores for the average return on both sales and assets.

Demand for defense goods and services received a high score of 94 for 2019, which constitutes an increase of 16 points over
the year 2017. This result comes from an increasing financial volume of contract obligations issued by DoD. In fact, total contract
obligations issued by DoD grew from $306.7 billion in 2016 to $368.7 billion in 2018. Acquisition expenditures also grew in all
categories, rising by 11% for aircraft, ships, and land vehicles; by 33% for electronic and communication equipment; by 35% for
weapons and ammunition; by 39% for sustainment; and 23% for knowledge-based services. In the same way, foreign military
sales (FMS) in aircraft, ships, and land vehicles grew by 113% between 2016 and 2018 while related services grew by 100%.

Other Takeaways
Conditions in the other dimensions of the defense industrial base conform to the pattern of moderate but declining health
and readiness. For example, innovation conditions within the defense industrial base received a score of 74 for 2019, two
points down from its 2018 score. Accordingly, the U.S. share of international patent applications—a measure of innovation
competitiveness—received an index score of 69 for 2019, four points down from its 2018 score. Similarly, the share of global
research and development (R&D) comprised by U.S. R&D expenditures saw its index score decrease between 2018 and 2019
from 75 to 74.

Political and regulatory conditions earned an overall index score of 79 for 2019, dropping precipitously by 13 points from a
2017 index score of 92. Congressional defense budgeting process indicators contributed to this decline since their composite

                                                                  6
VITAL SIGNS 2020

index score decreased from 90 for 2017 to 77 for 2019. Congressional interest in major defense acquisition programs (MDAPs)
decreased over this same period as mentions of MDAPs in congressional hearings decreased from 86 in Fiscal Year (FY) 2016 to
18 in FY 2018, which is echoed in an index score drop from 97 in 2017 to 54 in 2019. Regulatory conditions also eroded between
2018 and 2019; the index score for our “red tape ratio” of nonrestrictive rules to new restrictive rules decreased by 18 points
from 100 to 82.

Can the Defense Industrial Base Meet Surge Demand?
The capacity of the defense industrial base to grow its output and fulfill a surge in military demand stands as a key test of its
health and readiness. Productive capacity and surge readiness earned an index score of 77 for 2019, a 9-point increase from its
2017 index score. Gains in output efficiency and stability in capacity utilization contributed to this rising trend. An assessment
of the surge capacity of the defense industrial base using industrial input-output analysis uncovers fewer shortages in critical
defense supplier industries than estimated for the defense industrial base of the early 1980s, which constitute the last era of
great power competition. The defense industrial base of that time operated under a dramatic “buildup” in defense spending and
force posture that began during the Carter Administration and accelerated throughout the Reagan Administration. The Carter-
Reagan buildup involved a 31% surge in DoD expenditures; we estimate that the defense industrial base circa 1980 experienced
shortages in the productive capacity of 54.5% (6 of 11) of critical defense supplier industries. Presently, 27.3% (3 of 11) of critical
defense supplier industries would likely experience shortages in the event of a surge in demand for combat-essential defense
programs equivalent to the Carter-Reagan buildup of the late 1970s through the mid-1980s. As a result, the industrial surge
capacity indicator scored 100 for 2019.

The health and readiness of the defense industrial base pose a challenge to the defense acquisitions community. With the
growing expectation of the defense industrial base to rise to unprecedented challenges, Vital Signs 2020 highlights several
hurdles that the defense industrial base will face in doing so. The overall defense industrial base’s health score of 77 out of 100
suggests a satisfactory ability to meet current mission requirements. However, the fast-moving era of great power competition
requires more, including the delivery of extraordinary capabilities to reverse the erosion of the capability advantages we hold over
our competitors. Further, the vulnerabilities shown in this study—industrial security and production inputs to include workforce—
indicate a need for urgent attention and action. It is fortunate that the areas of confidence highlighted herein should confirm that
the fundamentals of America’s defense industry remain a sound foundation on which to build.

                                                                   7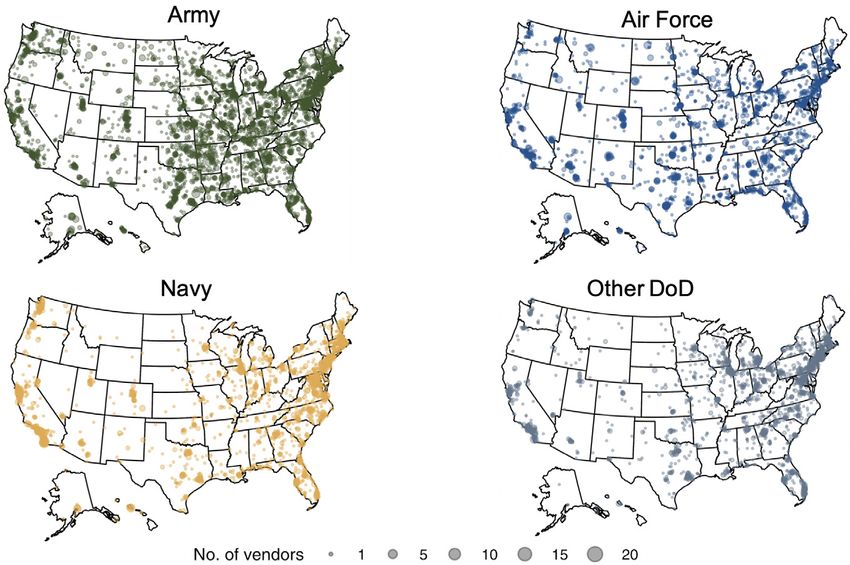
VITAL SIGNS 2020

INTRODUCTION
President Dwight D. Eisenhower’s 1961 farewell address famously warned against the creeping influence of the “military-
industrial complex.”iv Yet, a lesser known fact is that the same speech praises the important role of industry in keeping American
military arms “mighty, ready for instant action.”v The defense industrial base has provided the United States with a strategic
advantage over adversaries since the runup to World War II. American industry heroically mobilized and performed during that
global conflict, enabling the United States to supply the combined Allied forces by war’s end and, thereby, create the legendary
“Arsenal of Democracy.”vi Despite the vital and historical role of the defense industrial base in supporting America’s armed forces
during wartime, U.S. defense policy has not always recognized it. For example, congressional panels on the defense industrial
base convened by the House Armed Services Committee in 1980, 1992, and 2011 called attention to U.S. policy’s persistent
neglect of the defense industrial base and the potential tactical and strategic ramifications for the nation’s armed forces in a
conflict against a large, well-equipped, and determined adversary.vii Issued in 2017, Presidential Executive Order 13806 identified
important structural changes to the U.S. manufacturing sector that “raise[d] concerns about the health of the manufacturing
and defense industrial base” and called for a “comprehensive evaluation” to help guide future remedial policy actions.viii As the
executive order suggests, a key obstacle to sound a defense industrial base strategy is a common baseline understanding of the
overall health and readiness of the defense industrial base. Despite its high-resolution snapshot of the defense industrial base’s
present challenges, the subsequent Executive Order 13806 report released in 2018 fails to provide the public and the defense
policy community either an unclassified summary measurement of the health and readiness of the defense industrial base or a
simple way of tracking such a measurement over time.

The National Defense Industrial Association, in partnership with Govini, has completed a months-long pilot assessment of
the health and readiness of the defense industrial base to address this gap. By analyzing select statistical indicators, NDIA
developed a composite indicator that provides an integrated measure of the health and readiness of the U.S. defense industrial
base to meet the demands of the National Defense Strategy (NDS) and the needs of our warfighters. Given that this synoptic
indicator brings together data on multiple sets of factors affecting the defense industry, it facilitates a common, holistic
understanding of the state of the defense industrial base and its “vital signs.” In doing so, it will encourage conversations at all
levels about how to adjust policies and make investments that maintain the superior readiness of the American defense industrial
base while providing the advantages our nation and its warfighters have come to expect.

WHAT IS THE DEFENSE INDUSTRIAL BASE?
The nation-wide defense industrial base partners with the Department of Defense (DoD) to ensure the U.S. armed forces
enjoy decisive advantages. The defense industrial base encompasses manufacturers, systems integrators, service providers,
technology innovators, labs and research organizations, and other suppliers linked to one another by contracts into regional,
national, and global supply chains to provide America’s warfighters with superior tools, capabilities, and resources.ix The defense
industrial base includes more than just the producers of major capabilities vital for national defense.

In recent years, the U.S. domestic defense industrial base has declined in size despite growing demand for its output. The
Defense Department issued $364 billion worth of contract obligations during Fiscal Year (FY) 2018, which demonstrates an
increase of 10% over FY 2017. DoD currently manages approximately 350,000 active contracts.x However, it issued 9% fewer
prime contract obligations in FY 2018 than in FY 2017. Between FY 2015 and FY 2018, the total value of contract obligations
increased by 25% while the number of prime contract recipients decreased by 15%. In hindsight, these changes represent
the combined effects of the reduction of forces in Afghanistan and Iraq along with the 2011 Budget Control Act—both of
which contributed to the decline in the ranks of recipients of prime DoD contract awards from 78,500 to 61,700 between FY
2011 and FY 2017.

                                                                 8
VITAL SIGNS 2020

               TOP 10 DEFENSE CONTRACT SPENDING LOCATIONS
                                                                                       FY 2017 Defense
               County Name                  Metropolitan Statistical Area              Contracting Expenditures
                                                                                       (billions of dollars)
                                            Washington-Arlington-
               Fairfax County, VA                                                      13.7
                                            Alexandria, DC-VA-MD-WV
               Tarrant County, TX           Dallas-Fort Worth-Arlington, TX            13.0
               San Diego County, CA         San Diego-Chula Vista-Carlsbad, CA         9.2
               King County, WA              Seattle-Tacoma-Bellevue, WA                8.1
               St. Louis County, MO         St. Louis, MO-IL                           7.2
               New London County, CT        Norwich-New London, CT                     7.0
               Madison County, AL           Huntsville, AL                             5.7
               Los Angeles County, CA       Los Angeles-Long Beach-Anaheim, CA         5.3
               Middlesex County, MA         Boston-Cambridge-Newton, MA-NH             5.1
               Santa Clara County, CA       San Jose-Sunnyvale-Santa Clara, CA         4.8

                                        Source: Office of Economic Adjustment, 2019; NDIA

Defense supply chains touch every state in the Union. According to DoD’s Office of Economic Adjustment data, defense contract
spending in FY 2017 averaged over $5 billion per state although spending levels varied widely. For example, California receives
the most of all states with $35 billion in defense contract spending while Wyoming receives the least at approximately $100
million. The concentration of defense contract spending in major metropolitan areas supports clusters of defense industry
production, investment, and employment. Metropolitan areas such as Washington, DC, Dallas-Ft. Worth, San Diego, Seattle, St.
Louis, Los Angeles, Silicon Valley, and Boston host the country’s largest defense contracting clusters.

Historically, defense procurement has followed a decadal cyclical pattern, driven by events and policy change.xi The breakout
of major military conflict has prompted defense spending peaks with a typical concentration in the high-volume procurement
of major defense acquisition programs (MDAPs). Spending troughs have followed such peaks when military conflicts and
tensions have deescalated, driving industry consolidation. For the U.S. defense industrial base, these cyclical changes reflect
the challenges defense contractors have when maintaining thriving companies while also making critical investments in future
capabilities. The globalization and internationalization of supply chains have only served to exacerbate those challenges while
the increasing share of non-defense spending—especially that which is devoted to entitlements and interest on the debt—place
increasing pressure on overall defense spending.

                                                                9
VITAL SIGNS 2020

THE EVOLVING DEFENSE INDUSTRIAL BASE: FROM THE COLD WAR TO TODAY

            Source: National Defense Budget Estimates For FY 2020, Office Of The Under Secretary Of Defense (Comptroller)

            Source: National Defense Budget Estimates For FY 2020, Office Of The Under Secretary Of Defense (Comptroller)

The 2018 National Defense Strategy’s declaration of the re-emergence of an era of great power competition has held
significant implications for the defense industrial base. The NDS called for reforms to defense acquisition systems to ensure
the prompt delivery of important capabilities, services, and materials to U.S. warfighters in step with the changing strategic
environment. This era of great power competition presents the challenge of a multi-dimensional competition with near-peer
competitors, specifically China and Russia, the central dimension of which could be technology. Achieving decisive national
advantages across emerging technologies—artificial intelligence, hypersonic aviation, quantum computing, autonomous
vehicles, and human-machine teaming systems, etc.—will have significant implications for the future economic and strategic
balances of power.

This new era also challenges industry to achieve high levels of readiness to rapidly scale-up the production and deployment
of military hardware during a war against a competitor. Nevertheless, trends from previous eras will continue to affect the
defense industrial base. Consolidation among prime contractors can be expected to continue as risks of budget instability and
the pressure to deliver favorable quarterly returns lead companies seeking further competitive advantages to join forces. The
pressure to reduce costs and exploit international talent will encourage a more comprehensive globalization of supply chains.
Growing dangers to industrial security from cyber threats and traditional economic espionage will require defense contractors
to implement new and often costly security procedures and systems. Such dynamic and uncertain business conditions of this
emerging era will undoubtedly bring changes to both the organization and behavior of the defense industrial base.

                                                                 10
VITAL SIGNS 2020
UNDERSTANDING THE HEALTH OF THE DEFENSE INDUSTRIAL BASE
Despite their importance in achieving the U.S. national defense mission, many assessments of national defense capacities,
capabilities, and needs lack a broad consideration of the strengths and weaknesses of the defense industrial base. The Fiscal
Year 2017 Annual Industrial Capabilities Report, authored by the Office of the Under Secretary of Defense for Acquisition
and Sustainment, focused on cataloguing defense-related private manufacturing capabilities. Separately, the 2018 federal
interagency task force report entitled “Assessing and Strengthening the Manufacturing and Defense Industrial Base and Supply
Chain Resiliency of the United States,” initiated by Presidential Executive Order 13806, highlighted emergent risks to industrial
capabilities in various defense sub-sectors and weapons systems categories. Influential non-governmental analyses like those
within The Center for Strategic and International Studies’ annual “Acquisition Trends” reports tend to address the defense
industrial base health question from the perspective of trends in demand-side defense contracting flows. Although these studies
provide valuable insight into specific aspects of the health of the defense industrial base, they lack the breadth necessary to
develop a holistic understanding of the position of the defense industrial base with respect to peak performance standards.
To understand the current business environment of the defense industrial base in empirical terms, NDIA has developed a
composite index based on a diverse array of select statistical indicators. In general, statistical indicators provide summary
representations of statistical data, typically revealing directional trends or relative positions. Statistical indicators also provide
a structured and longitudinal manner of understanding the relative performance of the defense industrial base. The complexity
and scale of the defense industrial base mean that an array of statistical indicators may be useful for performance analysis
and interpretation. Composite index indicators simplify the challenge of interpreting multiple statistical indicators by combining
and integrating various statistical indicators into “a single index on the basis of an underlying model.”xii As a result, composite
indicators offer a better value for capturing multi-dimensional concepts, like defense industrial base health, for which single
indicators prove inadequate means of measurement. By enabling a simpler tracking of change over time, composite indicators
render modeling and other forms of advanced statistical analysis easier. Beyond their analytical benefits, composite indicators
facilitate broader, more inclusive public communication.
11VITAL SIGNS 2020
COMPETITION INDUSTRIAL SECURITY
• Industry financial performance • Cyber threats
• Structure of inter-firm • Intellectual property rights
competition threats
• Entrepreneurship environment
SUPPLY CHAIN
• Contract fulfillment
PRODUCTION INPUTS • Inventory capacity
• Workforce: supply, costs, skills, • Performance speed
and diversity • Schedule delays
• Raw and intermediate materials
costs
HEALTH
OF THE
DEFENSE POLITICAL AND REGULATORY
• Public opinion polling on
DEMAND INDUSTRIAL national defense
BASE
• Defense-related budgetary
• DoD procurement volume
activity
• International demand and
• Regulatory case activity
foreign military sales
PRODUCTIVE CAPACITY AND
SURGE READINESS
INNOVATION
• Output efficiency
• DoD innovation acquisition • Capacity utilization
volume • Industrial surge capacity of key
• Innovation productivity supplier industries
• Innovation investment
Source: NDIA
Descriptions of each of the eight dimensions follow below. The rest of Vital Signs 2020 presents the overall composite index
score and the underlying analysis for each dimension of the defense industrial base health model.
Competition
The state of competition between firms within the defense industrial base exerts a powerful influence on the productive
performance of firms within industry. A large population of firms of varying sizes, product and service specializations, and even
national origins competes for the same defense contracts. While such competition occurs, trends in financial performance
indicate the financial health of the involved firms. The competition between firms for contracts results in a pattern of market
concentration that illustrates the extent to which relatively few firms dominate defense contracting dollars. The entry of firms into
defense contracting provides insight into the openness of the defense contracting market to new sources of competition. This
section of the report informs our understanding of the health of competitive dynamics within the defense industrial base, partially
relying on the evaluation of financial data from the top 100 publicly traded defense contractors.
Production Inputs
The cost and availability of the inputs used in the production of goods and services also shape the performance of the defense
industrial base. Defense industry production relies heavily on inputs, including a wide variety of intermediate goods and services,
highly skilled labor, and rare raw materials. Trends in the cost and availability of these resources shed light on the ability of
defense contractors to acquire the inputs necessary for production.
12VITAL SIGNS 2020
Demand
The scale of defense contracting opportunities shapes the defense industrial base’s health. Companies in the defense
contracting market compete to provide goods and services to defense agencies and the military services. These contracts are
critical sources of capital for defense companies who use them to initiate R&D and production processes. The stability of this
demand affects the ability of companies to commit to and plan for defense-related production. This section of the report shows
trends in aggregate defense procurement and the distribution of contracting awards among different product categories.
Innovation
For decades, the National Defense Strategy has looked to the defense industrial base as an important source of technological
innovation. The manufacturing and services industries associated with the most technology-intensive goods and services
acquired by the Defense Department provide significant amounts of capital for research and development. They also generate
significant innovation productivity. Trends in industrial R&D investment and patenting activity help form a picture of the state of
private sector defense innovation.
Industrial Security
The security of industrial operations against information threats also contributes to a comprehensive portrait of the health of
the defense industrial base. American industry faces persistent, increasing threats of intellectual property theft, economic
espionage, cybercrime, and other forms of attacks to include the corruption of data necessary for production integrity or
operational security. Trends in the scale and severity of these threats indicate the intensity of industrial security challenges.
Supply Chain
The performance of the corporate supply chains that support industry’s supplier networks also factors into assessments of
the health of the defense industrial base. Defense supplier networks rely on well-functioning relationships among companies to
deliver products and services to government clients. The overall competency of these networks comes from the combination
of their track record of contract delivery, product flow, and speed of operation. This section of the report studies trends in
industry’s contract performance failures, inventory assets, program schedule integrity, and speed of operation.
Political and Regulatory
More than most industries, legislative and regulatory processes have a direct impact on defense industry productivity. Public
attitudes toward defense spending shape congressional interest in defense acquisition, ultimately affecting congressional
budgets. The time that Congress takes to authorize a budget for national defense programs affects capital availability and
the product delivery schedule of defense supply chains. Similarly, changes to defense acquisition regulations affect defense
contractors’ eligibility and administrative costs. In this way, policymakers can have a significant impact on the defense industry
in terms of the demand for goods and services, availability of inputs, conditions in related and supporting industries, and
structure of industry competition. This section of the report assesses political and regulatory trends that shape defense
industrial productivity.
Productive Capacity and Surge Readiness
Industrial productive capacity and surge readiness provide another important lens through which we can evaluate the health
of the defense industrial base. Conflicts often start suddenly, leaving defense suppliers little time to prepare and fulfill a surge
in demand for goods, services, or materials. Meeting surge demand requires leveraging the latent excess productive industrial
capacity in the national economy. In manufacturing industries, firms must activate unused industrial capital assets to reach
necessary levels of productivity. However, the complex structure of industrial supply chains means that flows of goods and
services between industries will limit the extent to which an increase in demand for industrial end-products translates into an
increase in industrial output. This section of the report analyzes trends in indicators of potential output, capacity utilization, and
the output of major defense platforms and systems.
13VITAL SIGNS 2020
HOW TO READ THIS REPORT
In the succeeding sections of this report, we present composite scores for each of the defense industrial base health dimensions
described above.
Our scores follow a nested approach, combining quantitative scores for each dimension’s conditions into an overall health score
on a 0-to-100 scale. The score for each set of conditions is itself a composite of scores for variables that contribute to health and
readiness in that area. To score each variable, we analyzed statistical indicators that serve as empirical proxies.
Indicator scores are calculated by comparing a three-year average of the indicator to a baseline value. Baseline values are either
historical peak values (a prior value of the indicator that represents the best recent performance given available data) or, when
conceptually appropriate, ideal standards. As a result, baseline values are chosen on a case-by-case basis, further depending
on data availability. For each indicator, we provide an analysis that incorporates the influence of contemporary contextual events
and forces that drive the indicator’s performance.
In each section of Vital Signs 2020, graphs depicting the recent trend line in the scores accentuate the discussion of variables
and indicators. Each section also includes a table detailing the current scores for each variable and indicator in addition to their
net change over the two previous years.
The indicators that form the basis of our analysis were constructed from multiple data sources. Furthermore, we developed
many indicators from public data sources. Our financial indicators are based on data obtained through the FTSE Russell Mergent
Online database. Several indicators, including those presented in the Demand Conditions section, are derived from custom data
provided by our research partner, Govini. Some indicators are based on estimates generated by NDIA. We reference indicator
data sources throughout the report. Readers will find reference information related to these data sources in the Data Sources
section of this report.
FOR THE FUTURE
As stated at the beginning of this introduction, Vital Signs 2020: The Health and Readiness of the Defense Industrial Base is
meant as a pilot of an annualized report. Of note, this project makes only conclusions on the overall health and readiness of
the defense industrial base. In it, we purposely do not make any policy recommendations, support any specific legislative or
regulatory changes, or advocate for any targeted investments. Our goal in this report is to provide a baseline reference for the
national defense community.
We believe an unclassified report like this will serve as an important annual touchpoint at the beginning of the policy cycle
by providing trend analyses that demonstrate the results of changes in the strategic environment, economy, policies, and
investments while ensuring a discussion of industrial base issues at the national level. In this way, we will be able to identify
what actions or decisions were successful and which ones were not. It will then be up to various stakeholders, organizations,
and policymakers to interpret and advocate for what they believe is in the best interest of defense industrial base health and our
overall national security posture.
As such, the National Defense Industrial Association looks forward to feedback from across the spectrum of thought leaders on
our study model, its methods and measures, and ways of ensuring its usefulness to the national defense resourcing community.
14VITAL SIGNS 2020
COMPETITION CONDITIONS
INTRODUCTION
The defense industrial base consists of thousands of companies competing for and performing on contracts with the
Department of Defense. The conditions that characterize and shape this competition help to determine the composition of the
industry and its performance outcomes. These conditions pertain to profitability, cash availability, capital investment, market
concentration, foreign ownership, and contract bidding intensity. By understanding the trends of these conditions, we can
determine whether the dynamics of the defense contracting marketplace are evolving in a healthy direction.
Indicator scores are determined by the ratio of an indicator’s average value to a baseline value.
Baseline values reflect historical peak values or ideal standard values, which means that they are
unique for each indicator. Ultimately, the availability of data in the public domain constrained the
selection of baseline values. The overall section score averages variable scores that, in turn, consist
of averages of indicator scores, which are capped at 100 to allow for a 0-to-100 scoring scale.
This section presents scores for indicators of the competitive dynamics within the defense industry. The indicators describe
key attributes of industry competition, including average firm profitability, cash availability, capital expenditures, market
concentration, extent of foreign ownership, and intensity of competitive bidding for defense contracts. NDIA calculated indicators
of profitability, cash availability, capital expenditures, market concentration, and foreign ownership using financial data for the
top 100 publicly traded DoD contractors, relying on data obtained from FTSE Russell’s Mergent Online business intelligence
database. NDIA calculated the score for competitive bidding with custom federal procurement data from Govini.
Key takeaways:
• Overall competition conditions scored a 96 for 2019
• Well-performing factors: profitability, cash availability, capital investment, overall market concentration, and low market
share for foreign-owned companies
• Poor-performing factors: return on assets and contract offers per contract action
COMPETITION SCORES
Factor Indicator 2019 Score Change, 2017 – 2019
Core operating margin (return on sales), weighted average 97 +5
Profitability
Return on assets, weighted average 76 +5
Overall Profitability 88 +3
Cash Availability Free cash flow, weighted average 100 +4
Overall Cash Availability 100 +4
Capital Investment Capital expenditures, weighted average 99 -1
Overall Capital Investment 99 -1
Market Concentration Level of market concentration (Herfindahl-Hirschman Index) 100 +0
Overall Market Concentration 100 +0
Share of total contract obligations awarded to
Foreign Ownership 100 +0
foreign-owned firms
Overall Foreign Ownership 100 +0
Contract Competition Offers received per contract action 88 +5
Overall Contract Competition 88 +5
Overall Competition Score 96 +2
Source: NDIA
15VITAL SIGNS 2020
PROFITABILITY
Source: NDIA
Industry’s profitability trended upward in 2019, rising three points over 2017 to 88. This score is based on industry’s achievement
of an average return on sales of 10.1% and an average return on assets of 7.6% in 2018.
Profitability describes the ability of defense contractors—given existing business lines—to generate revenue in excess of their
costs. Profitability matters because profits provide companies with the financial resources necessary to sustain and expand
their business operations. Additionally, profitability lures new entrants into the sector, ensuring that new ideas, capabilities, and
energy continue to revitalize it over time.
To assess industry profitability, NDIA estimated weighted averages of the return on both total sales and assets for a sample of
the top 100 publicly traded defense contracting companies. While return on sales indicates the amount of profit generated per
dollar of sales revenue, return on assets denotes the amount of profit earned per dollar value of business assets. These figures
do not separate defense-related revenues and costs from those derived from other sources. However, they provide a picture of
the average overall profitability of leading defense contractors. Return on assets was scored against a baseline value of 10%,
the average return on assets for leading defense companies reported in the landmark 1985 Defense Financial and Investment
Review (DFAIR) study.xiii On the other hand, return on sales was scored against a 2014 baseline value of 9.85%, the peak value
available in a limited data set.
Industry’s greater profitability reflects rising levels of corporate profitability throughout the national economy in 2018.xiv That year,
corporate profits grew by 3.4% across the U.S. economy.xv With regards to the defense industry, DoD budget increases for both
FY 2017 and FY 2018 boosted corporate returns.xvi Global accounting firm Price Waterhouse Coopers estimated record-breaking
growth for aerospace and defense companies in 2017 and 2018.xvii
CASH AVAILABILITY
Source: NDIA
16VITAL SIGNS 2020
Increasing four points over 2017, free cash flow scored 100 for both 2018 and 2019. These scores are based on the average free
cash flow of $3.5 billion and $2.9 billion for 2019 and 2017, respectively.
Free cash flow signifies the amount of the unobligated cash that is available for discretionary corporate use. Industry uses free
cash flow to achieve business objectives such as reducing liabilities, making capital investments, paying dividends, or fortifying
savings. The amount of cash assets held on hand can also indicate the quality of a company’s fiscal management over time.
To assess industry’s free cash flow, NDIA estimated a weighted average of the free cash flow reported annually by the top 100
publicly traded defense contracting companies. Free cash flow was scored against industry’s free cash flow level for FY 2014
of $3.1 billion.
Industry’s rising level of free cash flow follows years of defense budget instability in the aftermath of the 2011 Budget Control
Act. Defense contractors traditionally hold high free cash flow levels compared to contractors of other industries, making them
more attractive to investors.xviii The boost to contractor revenues from the Tax Cuts and Jobs Act of 2017 legislation and recent
increases in defense spending have enhanced free cash flow levels. Additionally, in the face of uncertainty about future interest
rates, industry has had an incentive to borrow before the Federal Reserve Board increases rates.
CAPITAL INVESTMENT
Source: NDIA
Industry’s capital investment achieved a score of 99 for 2019, which is one point less than its score for 2017. This score is based
on the average capital expenditures that were estimated at $1.3 billion.
Capital expenditures describe the amount of money spent on acquiring new plant facilities, durable property, and new capital
equipment. Companies procure new capital equipment in order to expand or sustain their productive capacity. As a result,
capital expenditure trends reflect evolving expectations about future demand for goods and services such as physical property,
equipment, physical plant infrastructure, software, and intangible intellectual property. Capital expenditures were scored against
a baseline of $1.34 billion—industry’s average capital expenditures for FY 2014.
Average capital expenditures have remained largely stable since FY 2014 despite expectations of an increase in defense
spending.xix Industry is divided in terms of how firms are to best spend greater cash assets. Although a few prominent firms
have targeted capital investment, others seek investment in research and development while some peg extra cash for dividends
to investors.xx
17VITAL SIGNS 2020
MARKET CONCENTRATION
Source: NDIA
Industry’s level of market concentration scored a 100 for 2019, maintaining its score for three consecutive years. The score is
based on NDIA’s calculation of the Herfindahl-Hirschman Index (HHI), which yields a relatively low value of 304 out of 10,000.
The defense industry score is far below the standard moderate-concentration threshold of 1500 defined by the HHI.
Market concentration delineates the degree to which an industry’s business activity is dominated by a few firms. Low market
concentration is generally preferable to high market concentration because low-concentration markets feature more competition,
leading to lower prices and more frequent innovation. Since the HHI is the standard statistical measure of market concentration,
it is widely used among federal policymakers.xxi NDIA calculated the HHI using the distribution of total contract obligation dollars
between FY 2015 and FY 2019 among the top 100 publicly traded defense contractors.
The steady trend in the score for market concentration indicates that total contract obligation dollars remain widely allocated
among contractors despite the large combined market share held by the “Big 6” defense contractors (36%). The high score
also suggests a high degree of competition for defense contracting business. With that being said, the outlook on market
concentration will differ by sector, sub-sector, industry, and specific industry category.xxii Calculating the HHI for companies
among the top 100 that specialize in manufacturing results in an HHI value of approximately 800. Limiting the HHI calculation
to companies that specialize in aerospace contracts results in an HHI value of nearly 1800. Thus, while the overall market
concentration indicates a competitive defense sector, concentration in critical subsectors merit concern.
FOREIGN OWNERSHIP
Source: NDIA
Industry’s level of foreign ownership earned a high score of 100 for 2019, equaling its score for 2017 and 2018. This score
is based on estimates finding foreign-owned firms receive 2% of the total contract obligation dollars awarded to the top 100
publicly traded contractors.
Foreign-owned defense contracting market share indicates lost economic opportunity for American-owned firms. Defense
contracting operates under a set of domestic content restrictions that plainly intend to provide American-owned firms with an
18VITAL SIGNS 2020
advantage in source selection decisions. Chief among these restrictions, the Buy American Act obligates contracting officials to
select domestic end-products for purchases exceeding the micro-purchase threshold. Federal statute 10 USC §2533b requires
that specialty metals used in military platforms and weapons systems must have a domestic manufacturing origin. Nevertheless,
contracts held by foreign-owned firms indicate a deficit among U.S.-based suppliers, presenting a security vulnerability in
defense supply chains because of the greater risk of improper foreign influence or control in the handling of sensitive information.
Notwithstanding, foreign-owned firms play an important part in the National Technology and Industrial Base, unifying the
productive capabilities of the United States, Canada, Australia, and the United Kingdom. NDIA calculated the score for foreign-
ownership based on a historical average of 9.4% reported by the Government Accountability Office in 1981 during the Carter-
Reagan military buildup.
The consistent trend in the foreign ownership score among defense contractors indicates that foreign involvement in the U.S.
defense industrial base is currently at a historic low. Although the number of contracts awarded to foreign-owned firms may still
be historically low, the potential for foreign involvement in supply chains only grows.
CONTRACT COMPETITION
Source: NDIA
The intensity of industry competition for defense contracts earned a score of 88 for 2019, which marks a five-point increase over
2017. This score is based on 4.57 competitive offers per DoD contract action submitted by industry.
The number of competitive offers per DoD contract demonstrates the intensity of competition among firms for defense contracts.
Many defense contracts are issued without competitive bidding. For example, DoD has awarded 67% of Major Defense
Acquisition Programs (MDAPs) on a non-competitive basis.xxiii Across the Department, agencies award just 51% of all contracts
on a competitive basis.xxiv Competitive bidding for contracts helps to improve defense procurement by ensuring that contracting
officials have the ability to make a comparative choice. The competitive bidding process can help the government to negotiate
better terms and better contract delivery requirements. NDIA’s data partner, Govini, analyzed federal procurement data from
USASpending.gov to calculate the number of bids received per DoD contract action. The ratios for bids per contract action were
scored against a recent peak in 2010 of 5.18 bids received per contract.
This upward trend in the number of bids per DoD contract action means that DoD’s contracting processes are growing more
competitive under the influence of several potential factors: government preferences, onerous requirements, or a haphazard and
poorly constructed acquisition process. Research by the Government Accountability Office has found that service contracts
receive more competitive interest on average than products (71% to 43%).xxv
With respect to contract competition, the difference per service department is noteworthy as the Department of the Army
consistently receives the most bids per contract while the Department of the Navy receives the least. Even more interestingly,
the so-called “fourth estate”—the portions of the DoD that are not the military services—received the most bids per contract
likely due to the nature of their service.
19VITAL SIGNS 2020
Source: Govini
CONCLUSION
2019’s score of 96 for competition conditions indicates a favorable landscape for firms engaged in the defense contracting
market. Competitive bidding improved to a score of 88, increasing five points above its 2017 score. Industry’s profitability also
scored an 88 on the strength of increasing profits relative to sales and assets. The availability of cash resources for industry
gained four points, reaching a score of 100 after 2017’s corporate tax cuts legislation and the rise of defense spending in
National Defense Authorization Acts (NDAAs)—congressional legislation usually passed annually that establishes new policies
and authorities for DoD and the military services—since FY 2016. Scores for capital investment, market concentration, and
foreign ownership held constant at or near the scoring upper bound of 100. With additional defense spending increases
expected for FY 2020, competition conditions within the defense industrial base are predisposed to continue ahead favorably.
20You can also read