2021 Drug Threat Assessment - ARC Associates
←
→
Page content transcription
If your browser does not render page correctly, please read the page content below
2021 Drug Threat Assessment

Bill Bryant                                                     Timothy Valenti
Chairman                                                        Executive Director
Arkansas State Police

Brad Byerley                                                    Chris Ortiz
Vice-Chairman                                                   Investigative Support Network
Drug Enforcement Administration                                 Manager
                                        June 2019

                                      June 1, 2020
                         2021 Gulf Coast HIDTA Drug Threat Assessment                Page |1
This page intentionally left blank.

   2021 Gulf Coast HIDTA Drug Threat Assessment   Page |2
UNCLASSIFIED

                                 Message from the Director
The Gulf Coast High Intensity Drug Trafficking Area (GC HIDTA) Drug Threat Assessment is produced
annually to identify, quantify, and prioritize the nature, extent, and scope of the threat of illegal drugs and
its impact on the GC HIDTA region. The GC HIDTA Drug Threat Assessment encompasses a six-state
area which includes the states of Alabama, Arkansas, Florida, Louisiana, Mississippi, and Tennessee.

A multi-agency team from each state prepares a draft state drug threat assessment which include the drug
situation in each state’s designated GC HIDTA counties/parishes. Each GC HIDTA State Committee
reviews and approves their respective state’s drug threat assessment. The GC HIDTA Investigative Support
Network (ISN) Network Coordination Group compiles and edits each team’s state drug threat assessment
into a comprehensive regional threat assessment that encompasses all GC HIDTA counties/parishes. As
mentioned in further detail in the Methodology (Appendix VII), the GC HIDTA utilizes drug surveys which
are distributed to law enforcement agencies and treatment/prevention professionals. The surveys aid in the
collection and analysis of information necessary to quantify the threat and identify trends.

The GC HIDTA Executive Board grants final approval of the regional drug threat assessment. Upon
approval, the GC HIDTA Drug Threat Assessment is forwarded to the Office of National Drug Control
Policy (ONDCP) as required by program guidance. The GC HIDTA Drug Threat Assessment adheres to
the guidelines set forth by ONDCP.

The 2021 GC HIDTA Drug Threat Assessment focuses on seven major drug categories: cocaine, controlled
prescription drugs, fentanyl and other opioids, heroin, marijuana, methamphetamine, and new psychoactive
substances. The identification of trends by drug type, as well as the developments and projections for the
future, are also included in the threat assessment. The threat assessment identifies the problems posed by
the threat and their anticipated impact on the GC HIDTA.

The GC HIDTA Threat Assessment is a reflection of the strong partnership between prevention, treatment,
and education professionals and the law enforcement community. Representatives from the prevention,
treatment, and education community are invited and routinely participate in state Information Sharing and
Intelligence Meetings held annually in each of the six states. As mentioned above, an independent survey
has been developed and deployed to capture their unique view of drug abuse.

Along with colleagues from Drug Free Communities (DFC) and Community-Based Coalitions across the
GC HIDTA, a strong affiliation has been developed with representative(s) from the Atlanta based Centers
for Disease Control and Prevention (CDC). Career CDC epidemiologists provide public health data sources
and analysis critical to an effective examination of drug abuse trends and patterns across the GC HIDTA.

Timothy D. Valenti
Executive Director
Gulf Coast HIDTA

                                  2020 Gulf Coast HIDTA Drug Threat Assessment                       Pa ge |3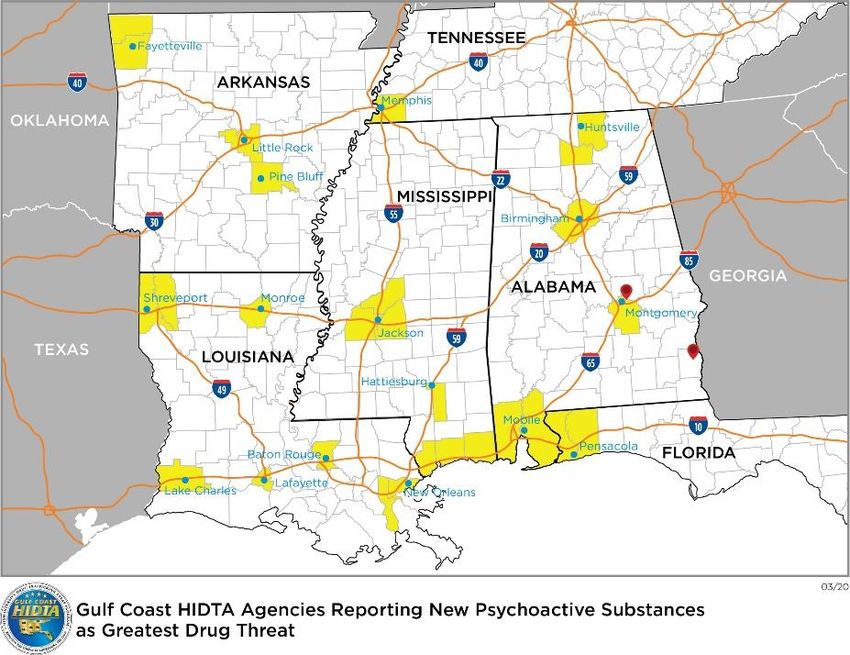
UNCLASSIFIED

I.           Scope ..............................................................................................................................6
II.          Executive Summary .......................................................................................................6
     A.      Drug Threats ............................................................................................................................. 7
     B.      Drug Trafficking Organizations (DTOs) .................................................................................. 9
     C.      Illicit Financing ......................................................................................................................... 9
     D.      Mail ........................................................................................................................................... 9
III.         The Gulf Coast HIDTA Region ................................................................................... 10
     A.      Demographics ......................................................................................................................... 10
     B.      Economics ............................................................................................................................... 11
IV.          Description of the Threat ............................................................................................ 12
     A.      Overall Scope of Drug Threat ................................................................................................ 12
     B.      Methamphetamine .................................................................................................................. 12
     C.      Fentanyl and Other Opioids ................................................................................................... 15
     D.      Heroin...................................................................................................................................... 18
     E.      Controlled Prescription Drugs ............................................................................................... 20
     F.      Marijuana ............................................................................................................................... 22
     G.      Cocaine and Crack Cocaine.................................................................................................... 26
     H.      New Psychoactive Substances ................................................................................................. 28
     I.      Drug Transportation Methods ............................................................................................... 30
V.           Drug Trafficking Organizations ................................................................................. 35
     A.      Overview ................................................................................................................................. 35
     B.      International DTOs ................................................................................................................. 35
     C.      Multi-State/Regional DTOs .................................................................................................... 36
     D.      Local DTOs ............................................................................................................................. 38
VI.          Money Laundering Organizations .............................................................................. 39
VII.         Forecast ........................................................................................................................ 43
VIII. Appendices ................................................................................................................... 45
     A.      Methodology ............................................................................................................................ 45
     B.      Source Consideration and Explanation .................................................................................. 45
     C. Appendix I: Agencies Participating in the 2021 Gulf Coast HIDTA Law Enforcement
     Survey .............................................................................................................................................. 47
     D. Appendix II: Agencies Participating in the 2021 Gulf Coast HIDTA Drug Treatment and
     Prevention Survey ........................................................................................................................... 49
     E. Appendix III: 2021 Law Enforcement Survey Notes (Printed as Reported by
     Agency/Department) ....................................................................................................................... 51

                                                                                                                                                 Pa ge |4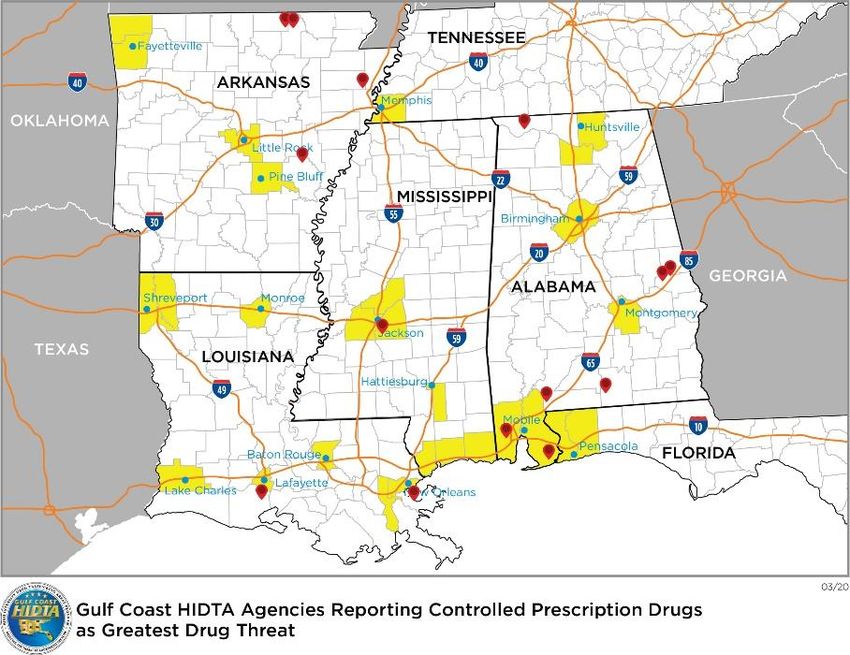
UNCLASSIFIED

F. Appendix IV: 2021 Treatment and Prevention Survey Notes (Printed as Reported by
Agency/Department) ....................................................................................................................... 55
G.     Appendix V: 2021 GC HIDTA Law Enforcement Survey Drug Availability Rates ............. 58
H.     Appendix VI: Crime Rates ..................................................................................................... 59
I.     Appendix VII: Threat Assessment Acronyms ........................................................................ 61
J.     Appendix VIII: Likelihood and Confidence Levels ............................................................... 62
K.     Endnotes .................................................................................................................................. 63

                                                                                                                                       Pa ge |5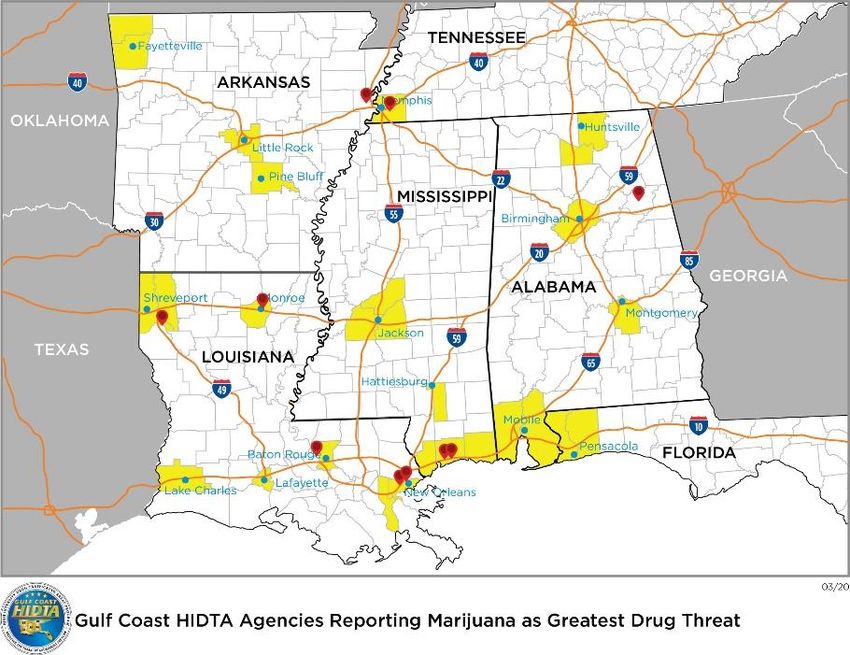
UNCLASSIFIED

I. Scope
The purpose of the 2021 Gulf Coast High Intensity Drug Trafficking Area Threat Assessment is to identify
current and emerging drug-related trends within the designated area, recognize the source locations and
organizations that traffic drugs into the area, and deliver accurate and timely strategic intelligence to assist
law enforcement agencies in the development of drug enforcement strategies. This assessment provides an
overview depicting the regional extent of illicit drug abuse and activities, actors and organizations,
transportation methods and routes, and evolutions in trends, tactics, and procedures. This document fulfills
statutory and grant requirements issued by the Office of National Drug Control Policy, and has been
approved by the Gulf Coast HIDTA Executive Board.

II. Executive Summary
The Gulf Coast High Intensity Drug Trafficking Area (GC HIDTA) encompasses a six-state area comprised
of 29 HIDTA designated counties/parishes; eight in Louisiana: Bossier Parish, Caddo Parish, Calcasieu
Parish, East Baton Rough Parish, Jefferson Parish, Lafayette Parish, Orleans Parish and Ouachita Parish;
eight counties in Mississippi: Forrest County, Hancock County, Harrison County, Hinds County, Jackson
County, Lafayette County, Madison County and Rankin County; six in Alabama: Baldwin County,
Jefferson County, Madison County, Mobile County, Montgomery County and Morgan County; four in
Arkansas: Benton County, Jefferson County, Pulaski County and Washington County; two in Florida:
Escambia County and Santa Rosa County; and Shelby County, Tennessee. Of the 29 counties/parishes, ten
are located along the Gulf Coast border. The GC HIDTA region serves as a gateway for drugs entering the
United States as well as a transit and staging area for drug distribution. The GC HIDTA interstate highways
are routinely utilized by major drug trafficking organizations (DTOs) to transport drugs and assets to and
from the Southwest Border (SWB). Accordingly, many of the larger drug and currency seizures are a result
of enforcement efforts coordinated by the HIDTA Domestic Highway Enforcement (DHE) Program. The
primary focus of the DHE program is to support the enforcement efforts of the local, state, and federal
member agencies of the GC HIDTA.

In addition to the region’s geographical proximity to the SWB, other factors contribute to and influence
drug-related crimes and social problems including the industrial, cultural, and economic diversity of the
region. The drug threat to GC HIDTA designated counties/parishes covers the full spectrum of drugs
trafficked and abused, trafficking modalities, and types of criminal organizations. This assessment details
the drug threat in Alabama, Arkansas, Louisiana, Mississippi, Northwest Florida, and Shelby County, TN.

This document is produced to assist in the planning of enforcement strategies, efficient and effective
utilization of available resources, and the budgeting and staffing for future operations. The following table
lists the drugs in order of their assessed threat.

                                                                                                      Pa ge |6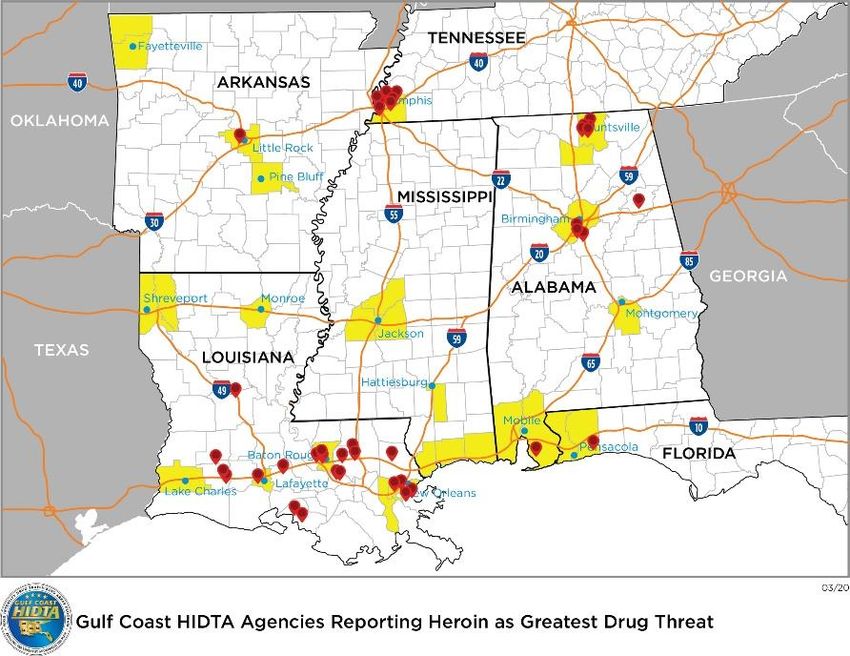
UNCLASSIFIED

    A. Drug Threats

                        2021 GC HIDTA Law Enforcement Survey Ranking
     Ranking                 Drug                                    Impact
                                               Most significant threat in the GC HIDTA;
                                               leading contributor to violent crime, property
         1       Methamphetamine               crime, and law enforcement resources used.
                                               Ranked alongside marijuana as most available
                                               drug in the GC HIDTA.
                                               Significant increase in availability, demand,
                                               distribution, transportation, and fentanyl-related
         2       Fentanyl and Other Opioids
                                               overdose deaths. Greater threat in urban areas of
                                               Gulf Coast.
                                               Continued increase in availability, demand,
                                               distribution, and transportation; second greatest
         3       Heroin                        contributor to violent crime and law enforcement
                                               resources used. Greater threat in urban areas of
                                               Gulf Coast.
                                               High availability, abuse, and demand. Moderate
         4       Controlled Prescription Drugs levels of transportation and distribution across
                                               the Gulf Coast.
                                               Most abused drug and ranked alongside
                                               methamphetamine as most available drug in
                                               region. Moderate demand, distribution, and
         5       Marijuana
                                               transportation. Marijuana and THC products
                                               most commonly seized along highways in the
                                               GC HIDTA.
                                               Moderate availability; remains a consistent drug
         6       Cocaine and Crack Cocaine     of abuse. Third greatest contributor to violent
                                               crime in the GC HIDTA.
                                               Abuse rates are relatively low, though the threat
         7       New Psychoactive Substances
                                               still persists.

Methamphetamine’s continued increase in availability, demand, distribution, and transportation makes it
the primary drug threat in the Gulf Coast region. It remains of the upmost concern to both law enforcement
and the public. According to the 2021 Gulf Coast HIDTA Law Enforcement Survey (hereafter referred to
as the Law Enforcement Survey), the majority of respondents listed methamphetamine as the greatest drug
threat (57 percent), as well as the drug that contributed the most to violent crime (53 percent), property
crime (58 percent), and law enforcement resources used (51 percent). Local methamphetamine producers
use the one-pot method and obtain precursor materials by circumventing state precursor laws and traveling
to out-of-state or multiple pharmacies to make purchases. The majority of law enforcement respondents
claimed not encountering methamphetamine production and conversion laboratories. This is because most
of the methamphetamine in this region is thought to originate from Mexico as drug cartels can produce vast
quantities of the drug at a higher purity and lower cost than domestically-produced methamphetamine. The
DEA Methamphetamine Profiling Program reported an average of 97.5 percent purity of methamphetamine
samples in the second half of 2018.1

Fentanyl and other synthetic opioids are considered the second greatest drug threat to the region. In recent
years, fentanyl has been found more frequently in DHE stops, as well as a cutting agent in heroin and
counterfeit pharmaceuticals. Eighteen percent of respondents to the Law Enforcement Survey reported

                                                                                                  Pa ge |7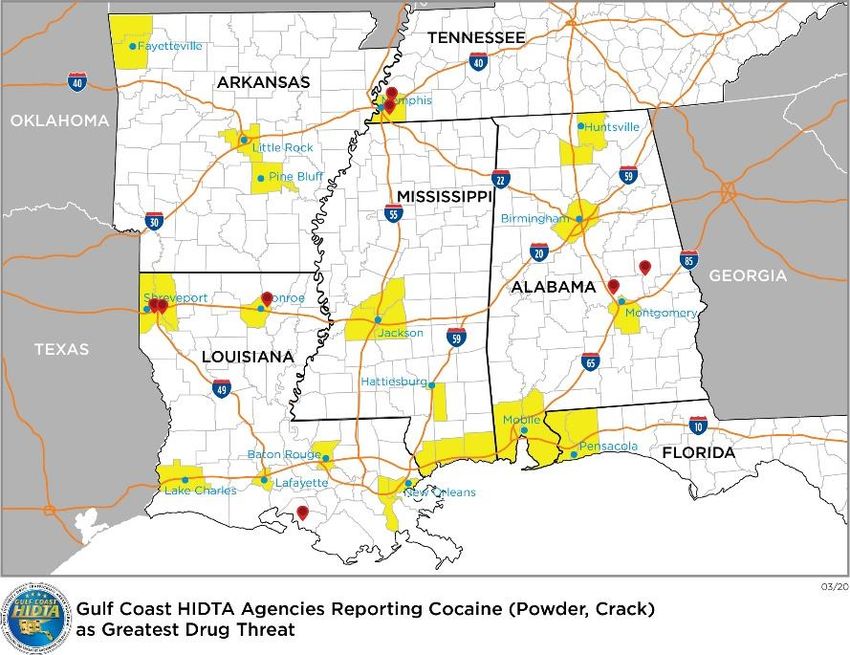
UNCLASSIFIED

fentanyl as their greatest drug threat, while this increased to 33 percent in highly urban areas of the GC
HIDTA (Memphis, TN and New Orleans, LA). Fifty-four percent of those same respondents claimed an
increase in availability over the past 12 months.

Heroin trafficking and abuse remained a serious threat over the past year. Every state in the GC HIDTA
listed heroin in their top drug threats. Dallas and Houston, along with Atlanta are the key distribution hubs
for the Gulf Coast; while New Orleans remains a heroin source city for Southeast Louisiana and Southern
Mississippi. Heroin abuse and availability are higher in urban areas of the Gulf Coast. Heroin-related
overdose deaths remain a concern across the GC HIDTA. Forty-six percent of respondents to the 2021 Gulf
Coast HIDTA Drug Treatment and Prevention Survey (hereafter referred to as the Treatment and
Prevention Survey) reported a high level of heroin abuse in the GC HIDTA. Many Black American DTOs
have chosen heroin as their primary commodity. Using this approach, distributors acknowledge that they
can achieve a higher profit margin while simultaneously transporting smaller quantities of product. As the
price of opioid-based pharmaceuticals rises, the demand for heroin continues to increase.

The diversion, abuse, and misuse of controlled prescription drugs (CPDs) remain a significant problem in
the area. Twenty-two percent of the Law Enforcement Survey participants identified CPDs as increasing in
availability, while only four percent reported a decrease. Area youth experiment with CPDs as opposed to
other illicit drugs but often switch to heroin because of availability restrictions. Respondents from both the
Law Enforcement survey and Treatment and Prevention Survey report Hydrocodone (e.g., Vicodin, Lorcet,
Lortab) to be the most frequently diverted CPDs in the GC HIDTA. This is closely followed by Oxycodone
(e.g., Percocet, OxyContin), Alprazolam (e.g., Xanax), and Suboxone. Respondents to the Treatment and
Prevention Survey indicated that the main sources of diverted pharmaceuticals are street dealers, followed
by friends, family members, theft from family members/friends, and doctor shopping. Additionally,
respondents reported that the level of CPD abuse in the region is high, at 51 percent.

Marijuana is the most abused drug in the GC HIDTA and has for the past several years been the most
available drug in the region. However, in 2019, law enforcement personnel ranked marijuana alongside
methamphetamine as the most available drug in the GC HIDTA. Historically, the majority of grow sites
have been located on public lands, federal reserves, clear cuts, or on large tracts owned by the timber
industry. This trend continues, although law enforcement officials believe marijuana cultivators are moving
their operations indoors for several reasons. These include attaining a higher THC level, seasonal drought
that affects portions of the GC HIDTA, and greater profits associated with higher quality marijuana.
Domestically-produced marijuana accounts for the majority of the drug available in the GC HIDTA. DHE
stops along major interstates continue to yield large quantities of high-grade marijuana originating from
western states; particularly California, Texas, and Colorado. The availability of domestic, high-grade
hydroponic, BC Bud, and other high-grade marijuana continues to rise within the GC HIDTA.

Cocaine and its derivative, crack cocaine, remain a steady threat and are ranked as the sixth greatest drug
threat in the GC HIDTA. Cocaine is of moderate availability and is steadily abused throughout the six-
states. Cocaine was listed as the third greatest drug contributor to violent crime by nine percent of Law
Enforcement Survey respondents. Cocaine is transported into the GC HIDTA in private and commercial
vehicles via the interstate highway system, express mail service, and commercial and private sea-going
vessels by Mexican poly-drug DTOs. Local Black American DTOs, often affiliated with neighborhood
criminal groups, are the primary distributors of crack cocaine. Only one percent of our treatment and
prevention partners reported cocaine as the primary drug of abuse in their area and the majority report that
inpatient admissions have remained the same.

The abuse of new psychoactive substances (NPSs), including MDMA, hallucinogens, inhalants, and
anabolic steroids, remains steady. MDMA use was traditionally limited to college towns due to higher
concentrations of bars and nightclubs. The Law Enforcement Survey indicates that Caucasian Americans

                                                                                                    Pa ge |8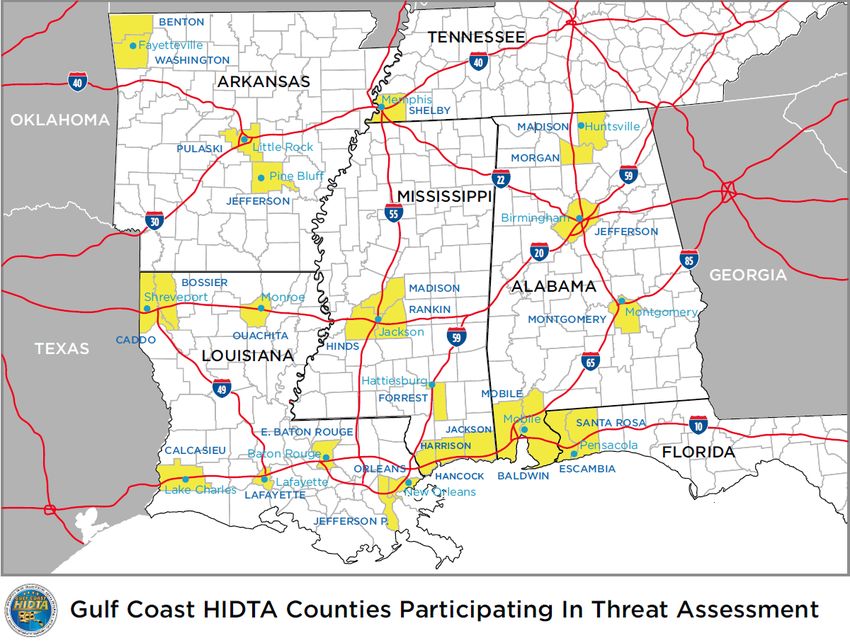
UNCLASSIFIED

are the primary transporters, wholesale distributors, and retail distributors of MDMA. Synthetic
cannabinoids and cathinones are chemically infused herbal mixtures aimed at mimicking the effects of
marijuana and LSD; the abuse of which remains a threat to the GC HIDTA. Users commonly dub these
drugs as “synthetic marijuana” or “bath salts.” These products have risen in popularity since their debut in
2008, particularly in the 12-29 age group. Sold as herbal incense, products such as K2, Spice, Cloud 9, and
Mojo are readily available in head shops and convenience stores throughout the region.

    B. Drug Trafficking Organizations (DTOs)

Mexican DTOs pose the greatest criminal drug threat to the Gulf Coast HIDTA. The proximity of the SWB
to the Gulf Coast positions the region as a key drug trafficking route. Mexican DTOs are responsible for
the importation and transportation of illicit and diverted drugs throughout the Gulf Coast states. Caucasian
American DTOs are involved in the transportation and distribution of virtually every drug category in the
area of responsibility. Black Americans overwhelmingly dominate the retail distribution sector and are also
the primary transporters of cocaine and marijuana. These criminal networks rely upon organizational
strength as well as violence, coercion, and intimidation to maintain control of illicit drug markets.

    C. Illicit Financing

Law enforcement across the GC HIDTA encounter an assortment of money laundering methods. Cash-
intensive businesses utilized by DTOs for money laundering include nail salons, restaurants, bars,
nightclubs, casinos, check-cashing businesses, and the fishing industry. Casinos have become less popular
for laundering money due to the collaborative relationship between casino security and law enforcement,
although it continues to occur in lesser amounts than the past. The real estate market is another popular
method of money laundering. Mortgage loan fraud is also prevalent along the Gulf Coast. Money launderers
purchase real estate properties to renovate and resell or rent in order to clean the money. All of these
methods make the region conducive for money laundering and other illicit financing. With the advent of
virtual currency, such as Bitcoin, a type of unregulated, digital money issued and controlled by its
developers, traffickers are able to promote their illegal enterprises with increased anonymity.

    D. Mail

Express mail/parcel post services have remained a popular method for DTOs to transport illicit drugs and
currency. DTOs use variations of packaging and concealment methods to thwart law enforcement detection.
This allows for quick, reliable, low-risk delivery of drugs and currency. Memphis is considered the world’s
largest cargo hub, with approximately 2.5 million packages transiting the Federal Express Hub (FedEx)
daily. Homeland Security Investigations (HSI) and Customs and Border Protection (CBP) use sophisticated
enforcement protocols to locate suspect packages originating from outside of the United States. The Drug
Enforcement Administration (DEA) conducts investigations involving domestic currency and drug seizures
while HSI conducts investigations regarding international currency seizures. In addition to federal presence,
the Memphis Police Department and the Shelby County Sheriff’s Office conduct investigations at the
FedEx Hub in Memphis as part of a Shelby County HIDTA Initiative.

                                                                                                   Pa ge |9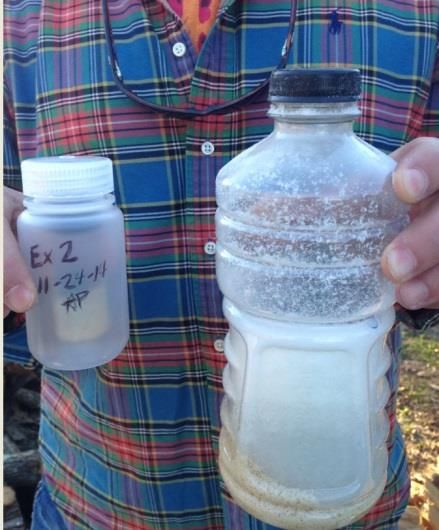
UNCLASSIFIED

III.      The Gulf Coast HIDTA Region

             Regional Characteristics                                           Description
    Designated Counties                                                              29
    2019 United States Census Estimate HIDTA
                                                                                16,976,579
    Population2
    HIDTA Initiatives                                                                41
    Law Enforcement Partner Agencies                                                182

      A. Demographics

According to the 2010 United States Census Bureau statistics, the GC HIDTA area encompasses 195,239
square miles. Based on the most recent July 2019 census estimates, there are approximately 16.98 million
people residing within the GC HIDTA’s area of responsibility. Within Alabama, Arkansas, Louisiana,
Mississippi, Northwest Florida, and Shelby County, TN, there are 32 metropolitan statistical areas.a The

a
 Metropolitan statistical areas are based on United States Census Bureau population estimates as of July 1, 2018.
They include the population of at least one urbanized area of 50,000 or more inhabitants. Metropolitan statistical
areas in the GC HIDTA include: Anniston-Oxford-Jacksonville, AL; Auburn-Opelika, AL; Birmingham-Hoover,
AL; Daphne-Fairhope-Foley, AL; Decatur, AL; Dothan, AL: Florence-Muscle Shoals, AL; Gadsden, AL;

                                                                                                          P a g e | 10
UNCLASSIFIED
United States Census Bureau reports approximately 62 percent of residents are White, 28 percent are Black,
five percent are Hispanic or Latino, and two percent are Asian within the GC HIDTA.3
B. Economics
According to the most recent 2018 United States Census Bureau estimates, Alabama’s median household
income is $48,486 and approximately 17 percent of the population lives in poverty. Leading employers in
the state include manufacturing jobs, retail sales, and health care services.
The state of Arkansas is predominately rural, agricultural, and impoverished. According to the 2018 United
States Census Bureau estimates, Arkansas’s median household income is $45,726 and approximately 17
percent of the population lives in poverty. A major cotton-producing state in the 19th century, Arkansas
has since diversified its agricultural production and overall economy. The state's most important mineral
products are petroleum, bromine, bromine compounds, and natural gas, and it is the nation's leading bauxite
producer. Principal manufactures are food products, chemicals, lumber, paper goods, electrical equipment,
furniture, automobile, airplane parts, and machinery. Also contributing to the Arkansas economy are the
military installations of Pine Bluff Arsenal, Little Rock Air Force Base, Camp Robinson, and Fort Chaffee.
The economy of Northwest Florida is driven substantially by the numerous military bases in the region,
tourism, and the hospitality industry. According to 2018 United States Census Bureau estimates, 15 percent
of Escambia County is considered to be below the poverty level with a median household income of
$49,286. Santa Rosa County has a median household income of $66,242 and approximately ten percent of
its population living below the poverty level.
Louisiana’s economy is made up of agriculture, fishing, manufacturing, mining, and service-oriented
businesses. The 2018 United States Census Bureau estimates that the median household income is $47,942
and approximately 19 percent of the population lives below the poverty line.
According to the United States Census Bureau estimates, Mississippi’s 2018 household median income is
$43,567 and approximately 20 percent of the population lives below the poverty line. Agriculture is
Mississippi’s number one industry, employing 30 percent of the state’s workforce either directly or
indirectly. Mississippi has diversified its economy by concentrating on a broader spectrum of business,
industrial and technical operations, to include the Stennis Space Center, Toyota and Nissan plants, and
casinos along the Mississippi River and Gulf Coast.
Shelby County, Tennessee is home to three Fortune 500 company headquarters and a variety of businesses
involved in banking, finance, and real estate. According to the 2018 United States Census Bureau statistics,
the median household income is an estimated $49,782. Approximately 22 percent of Shelby County’s
population lives below the poverty level. Top ranked industries in Shelby County include educational
services, health care, social assistance, transportation, warehousing, and utilities.
Huntsville, AL; Mobile, AL; Montgomery, AL; Tuscaloosa, AL; Hot Springs, AR; Jonesboro, AR; Little Rock-
North Little Rock-Conway, AR; Pine Bluff, AR; Fayetteville-Springdale-Rogers, AR; Fort Smith, AR; Pensacola-
Ferry Pass-Brent, FL: Alexandria, LA; Baton Rouge, LA; Hammond, LA; Houma-Thibodaux, LA; Lafayette, LA;
Lake Charles, LA; Monroe, LA; New Orleans-Metairie, LA; Shreveport-Bossier City, LA; Gulfport-Biloxi, MS;
Hattiesburg, MS; Jackson, MS; Memphis, TN.
P a g e | 11UNCLASSIFIED
IV. Description of the Threat
A. Overall Scope of Drug Threat
As it relates to abuse, violence, and drug-related crime, methamphetamine poses the greatest drug threat
within the GC HIDTA, followed by fentanyl and other opioids, and heroin. Controlled prescription drugs,
marijuana, and cocaine pose a moderate threat, while new psychoactive substances pose a low threat. The
majority of these drugs are transported into the GC HIDTA from Mexico via the SWB. DTOs utilize the
interstate highway system crossing the GC HIDTA as a conduit to move illicit drugs to destination/hub
cities in the Midwest and East Coast of the United States.
B. Methamphetamine
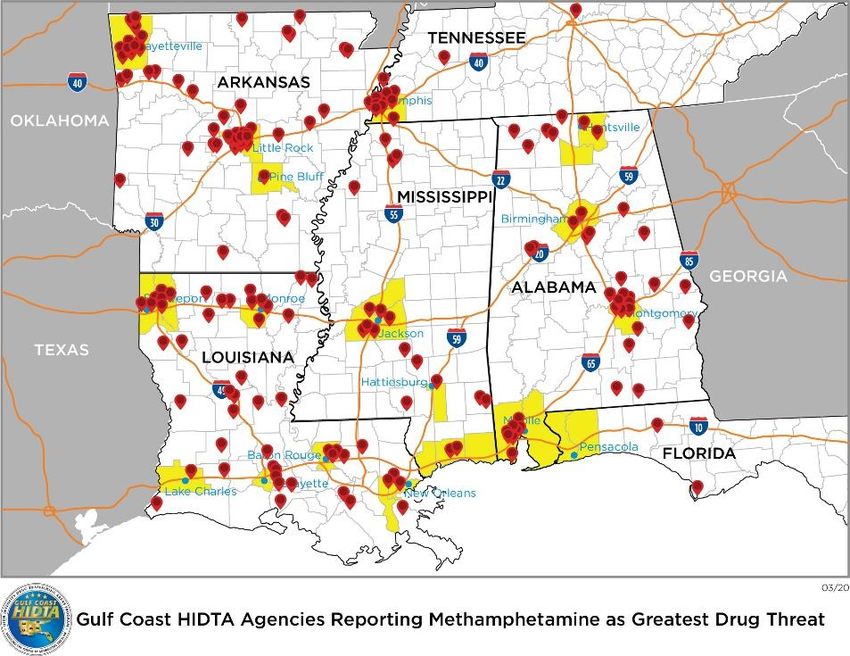
I. Overview
Based on intelligence reports, law
enforcement data, and treatment
and prevention information,
methamphetamine is the greatest
drug threat in the GC HIDTA.
Methamphetamine is ranked the
greatest drug threat in Alabama,
Arkansas, Louisiana, Mississippi
and Tennessee. The figure to the
right demonstrates the law
enforcement agencies throughout
the GC HIDTA reporting
methamphetamine as the greatest
drug threat. In February 2020,
DEA identified the New Orleans
Field Division (Alabama,
Arkansas, Louisiana, and
Mississippi) as one of the major
methamphetamine transportation
hubs in the US to the steady increase in methamphetamine trafficking through the region. In addition, the
majority (51 percent) of law enforcement officials indicated methamphetamine to be the drug that takes up
the most law enforcement resources and the primary drug contributing to violent crime and property crime.
Law enforcement agencies across the GC HIDTA report decreasing numbers of methamphetamine
laboratory seizures in recent years, hypothesized to be due to the increased volume of Ice methamphetamine
imported from Mexico.
II. Availability
In the past several years, marijuana was the most available drug in the GC HIDTA; however, in 2019,
methamphetamine and marijuana were equally ranked by law enforcement officials as the most available
drugs. Eighty-five percent of law enforcement officials reported a high availability of methamphetamine,
compared to 76 percent in 2018. Additionally, 66 percent reported an increase in availability from 2018.
Fifty-nine percent of those same respondents also believed the demand for the drug had increased in the
past year.
While methamphetamine is ranked as the second greatest drug threat in Northwest Florida, it is the most
commonly submitted drug to the National Forensic Laboratory Information System (NFLIS) database.
P a g e | 12UNCLASSIFIED
Drug submissions identified as methamphetamine in Northwest Florida accounted for 42.39 percent of all
NFLIS submissions in 2019, an increase from 37.52 percent in 2018.4
Methamphetamine is available from two primary sources: locally produced for personal consumption and
Mexico-produced. Over 70 percent of Law Enforcement Survey respondents indicated a decrease or no
encounters of one-pot and traditional methamphetamine laboratories; supporting the idea that the majority
of methamphetamine is now imported from Mexico. Mexico-produced methamphetamine is transported
via the Interstate Highway System from the SWB and California in larger, wholesale quantities.
Methamphetamine in pill form, resembling MDMA, Adderall, and other pharmaceutical tablets, had been
identified in several states in 2019. Methamphetamine pills were reported by law enforcement in Central
Florida and have the potential to infiltrate the GC HIDTA. 5
III. Use
Methamphetamine abuse and trafficking is the leading drug contributor to both violent and property crime
in the GC HIDTA. Fifty-three percent of law enforcement officials reported methamphetamine as the
primary contributor to violent crime and 58 percent reported it as the primary contributor to property crime
in 2019. This represents an ongoing upward trend since 2013.
Seventy-four percent of respondents to the Treatment and Prevention Survey stated that methamphetamine
use is high in their areas. Of those same respondents, 60 percent noted an increase in inpatient admissions
for methamphetamine in their areas. GC HIDTA treatment and prevention partners reported that
methamphetamine is often combined with other drugs to achieve a wide range of effects, most commonly
marijuana, heroin, cocaine, and alcohol.
Based on TEDS data in the table to the right,
the number of patients seeking treatment for Treatment Episode Data Sets (TEDS)
amphetamine abuse in Arkansas increased Amphetamines
from 2018 to 2019. In 2019, admissions Alabama Arkansas Louisiana Mississippi
declined for Alabama and Mississippi. 2015 1,504 3,510 1,106 1,020
2016 2,041 3,844 1,025 1,360
The most recent psychostimulant overdose
2017 2,481 3,832 1,651 1,689
death statistics from the CDC show that in 2018
there were 170 deaths in Alabama, 148 in 2018 3,081 3,794 2,060 1,456
Arkansas, 172 in Louisiana, and 101 in 2019 2,773 4,371 N/A 1,371
Mississippi.7 The Medical Examiner in Source: Center for Behavioral Health Statistics and Quality,
Northwest Florida reports indicated 67 Substance Abuse and Mental Health Services
methamphetamine/amphetamine-related Administration, Treatment Episode Data Set (TEDS).6
deaths in 2019 compared to 37 related such
deaths in 2018.8
IV. Price
The importation of high-grade Mexican methamphetamine has driven down the cost of the drug. An ounce
of Ice methamphetamine can retail between $300 and $600. An ounce of powder methamphetamine can
cost between $100 and $1,000 and a kilogram between $4,000 and $8,500.9
V. Transportation
Fifty-nine percent of Law Enforcement Survey respondents indicated that methamphetamine distribution
increased in 2019 and 53 percent indicated that transportation increased. Mexican DTOs are the dominant
producers of both powder and Ice methamphetamine and the SWB remains the main entry point for the
majority of methamphetamine entering the United States. From 2013 to 2018, methamphetamine seizures
P a g e | 13UNCLASSIFIED
along the SWB increased 246 percent.10 EPIC reports 5,757 total methamphetamine seizures at the SWB
in 2019, compared to 4,990 in 2018 and 3,758 in 2017.
Once brought across the SWB into the United States, Caucasian American DTOs are the primary
transporters, wholesale distributors, and retail distributors of methamphetamine in the GC HIDTA. Mexican
DTOs are ranked second by Law Enforcement Survey participants as transporters, wholesale distributors,
and retail distributors of methamphetamine, followed by Black American DTOs. According to GC
BLOC/HIDTA Watch Center data, DHE seized 1,302 pounds of methamphetamine in 2019, an increase
from 807.9 pounds in 2018.
As Mexican DTOs become more influential in the production and wholesale distribution of
methamphetamine, concealed methamphetamine in solution (i.e., Liquid Meth) encounters along eastbound
interstate highways have become commonplace. Methamphetamine is mixed with a solvent, typically
methanol, acetone, or water, and then reconstituted into powder or crystal form before ingested.
Methamphetamine in solution poses a threat to law enforcement and border security agents because of a
drug trafficker’s ability to disguise the drug as ordinary items, such as antifreeze, apple juice, dish soap,
and multipurpose cleaner bottles. 11 There were 66 reports of methamphetamine in solution seizures at the
SWB, as reported by EPIC in 2019.12 Eleven percent of Law Enforcement Survey respondents indicated an
increase in methamphetamine in solution. There were no domestic methamphetamine conversion
laboratories reported to EPIC from the GC HIDTA in the past 10 calendar years.
VI. Production
Law enforcement continues to see an influx in Mexico-produced
methamphetamine and a decline in the number of reported traditional
methamphetamine laboratories seized in the GC HIDTA. Law
enforcement officials who encounter methamphetamine laboratories
risk injury by exposure to hazardous materials during production and
booby traps. Anyone in close proximity to methamphetamine
laboratories can be exposed to poisonous gases, hazardous waste,
and potential explosions. There was one individual injured by a
methamphetamine lab in the GC HIDTA during 2019, as reported by
EPIC.
In 2019, 11 methamphetamine clandestine laboratory seizures were
reported to EPIC in the GC HIDTA: two in Alabama, three in
Arkansas, one in Santa Rosa County Florida, and five in Shelby
County Tennessee. Seven of these methamphetamine laboratories
used the one-pot method, which typically produces less than two
ounces of methamphetamine per production cycle. The one-pot
method, also referred to as “shake and bake,” has traditionally been
favored by local methamphetamine producers because it requires
fewer ingredients and can be easily created inside a plastic container.
Precursor chemicals are mixed together prior to the addition of
ammonia nitrate, a substitute for anhydrous ammonia. Ephedrine, Top photo: Average yield from one-
pseudoephedrine, and phenylpropanolamine are the most common pot method.
precursor chemicals used in manufacturing methamphetamine. Bottom photo: Two of the precursor
There were 10 precursor/chemical laboratories (e.g., ammonium chemicals used in the manufacturing
nitrate, sodium hydroxide, lithium metal, Coleman fuel) reported to process.
EPIC in 2019 in the GC HIDTA: five in Shelby County Tennessee,
four in Alabama, and one in Arkansas. In addition to EPIC reports, the Mississippi Bureau of Narcotics
reported seizing two methamphetamine labs in the state in 2019.13
P a g e | 14UNCLASSIFIED
State laws require the documentation of all pseudoephedrine purchases and limit the availability of these
chemicals at retail stores, causing methamphetamine producers to establish new methods of securing
precursors. Chemicals such as anhydrous ammonia are clandestinely produced, purchased, or stolen from
fixed tanks throughout the GC HIDTA. The number of anhydrous ammonia labs has continued to decrease
throughout the GC HIDTA due to the ease and mobility of the one-pot production method. Only one
anhydrous ammonia labs were reported to EPIC in 2019 in the GC HIDTA.14
Producers also employ “smurfing” or purchasing from multiple pharmacies and traveling to out-of-state
pharmacies to obtain the necessary ingredients for methamphetamine production and avoid legal limitations
placed on the purchasing of precursor materials.
VII. Intelligence Gaps
Methamphetamine laboratory seizure data in the GC HIDTA has been assigned a moderate level of
confidence. Due to the sporadic underreporting of laboratory seizures reported to the GC BLOC/HIDTA
Watch Center, regional law enforcement agencies, and EPIC, it is difficult to establish with any certainty
the level of clandestine laboratory activity.
C. Fentanyl and Other Opioids
I. Overview
Fentanyl is a potent synthetic
opioid used for pain management
that has rapid onset properties. It is
estimated to be 50 times more
potent than pure heroin and 80 to
100 times stronger than morphine.
Pharmaceutically, it is allotted on a
microgram scale, as a dose of two
milligrams or more is considered
lethal to humans. Many times
fentanyl is used in combination
with another drug or completely
disguised in a pill form. Fentanyl-
laced heroin is worsening the
national overdose crisis as
numerous drug dealers are using
fentanyl to increase the potency of
diluted heroin in order to maximize
profit margins.
II. Availability
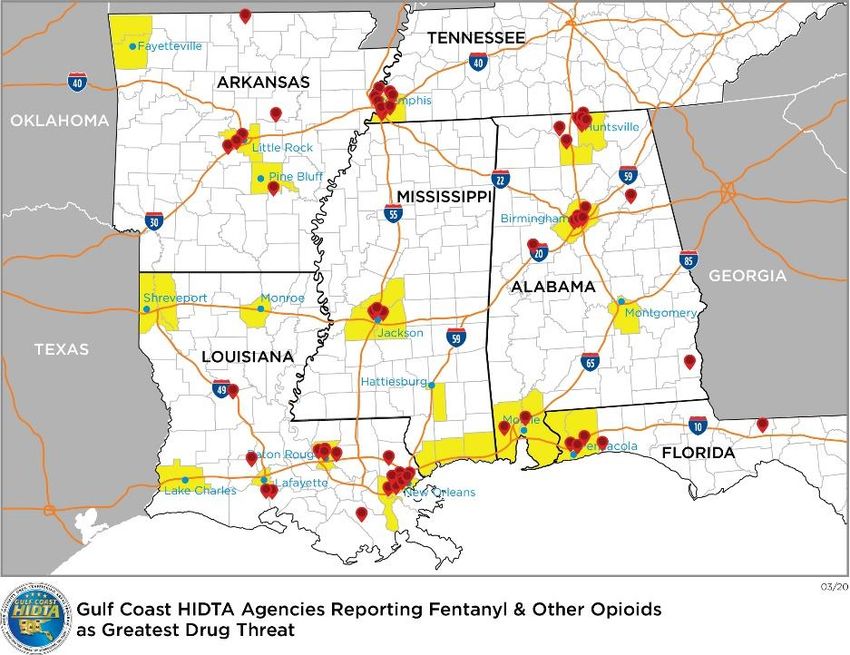
The above map demonstrates each law enforcement agency that recorded fentanyl and other opioids as their
primary drug threat. This figure and the table below demonstrate that this drug threat is even greater in
urban areas of the Gulf Coast region. Thirty-three percent of Law Enforcement Survey respondents in urban
areas (greater Memphis, TN and greater New Orleans, LA) indicated fentanyl and other opioids was the
greatest drug threat, compared to 18 percent across the entire GC HIDTA.
P a g e | 15UNCLASSIFIED
Fentanyl and Other Opioids Threat by Population Density
Percent of Respondents
Percent of Respondents Percent of Respondents
Indicating Fentanyl and
Indicating Fentanyl and Indicating Fentanyl and
Other Opioids Contribute to
Other Opioids are Other Opioids are
Most Use of Law
Greatest Drug Threat Highly Available
Enforcement Resources
Gulf Coast Region 18% 36% 12%
Urban Areas* 33% 55% 18%
Semi-Urban Areas** 28% 49% 19%
Source: 2021 GC HIDTA Law Enforcement Survey
*Urban areas include Memphis, TN (July 2018 United States Census population estimate of 650,618) and New
Orleans, LA (July 2018 United States Census population estimate of 391,006)
**Semi-urban areas include populations over 180,000: Memphis, TN; New Orleans, LA; Baton Rouge, LA (July
2018 United States Census population estimate of 221,599); Birmingham, AL (July 2018 United States Census
population estimate of 209,880); Montgomery, AL (July 2018 United States Census population estimate of
198,218); Little Rock, AR (July 2018 United States Census population estimate of 197,881); Huntsville, AL ( July
2018 United States Census population estimate of 197,318); Mobile, AL (July 2018 United States Census
population estimate of 189,572).
Population density also affects the availability of fentanyl and other opioids. Thirty-six percent of law
enforcement respondents across the Gulf Coast region indicate that fentanyl and other opioids are highly
available, while 55 percent of those in urban areas indicate the drug is highly available.
III. Use
Fifty percent of Treatment and Prevention Survey respondents indicated fentanyl and other opioid usage as
high. Furthermore, 54 percent indicated an increase in inpatient admissions for fentanyl and other opioids
in 2019.
The CDC reports that in 2018, synthetic opioid overdose deaths totaled 150 in Alabama, 96 in Arkansas,
220 in Louisiana, and 72 in Mississippi.15 Preliminary data from the Louisiana Department of Health for
the first quarter of 2019 demonstrates that there were 58 synthetic opioid-involved deaths in Louisiana,
compared to 215 throughout 2018.b This represents an annual increase since 2014 across the state, as well
as an increased number of synthetic opioid-involved deaths in urban parishes (e.g., Jefferson, St. Tammany,
Orleans parishes). Jefferson Parish accounted for 77 of the 215 synthetic opioid-involved deaths in
Louisiana in 2018, St. Tammany Parish accounted for 27, and Orleans Parish accounted for 19. 16 Other
urban areas of the GC HIDTA also report high opioid-involved overdose deaths, such as Shelby County,
TN. Preliminary data from January through September 2019 demonstrates there were 90 suspected
overdose-related deaths in Shelby County, a 62 percent increase from January through September 2018.
Further, 89 percent of these deaths occurred within Memphis.17
The lethality of fentanyl is leading to an increase in fentanyl-related overdose deaths, as well as harming
first responders. In December 2018, three first responders were sent to the hospital after fentanyl exposure
during a traffic stop in Northwest Florida. Two of the first responders were taken to the hospital and while
there were no lasting injuries or deaths, this is an example of the dangers of fentanyl for law enforcement
and the public in the GC HIDTA.18
In alignment with the increase in fentanyl availability and its lethal exposure, some states have taken
measures to further criminalize this dangerous drug. For example, in August 2018, Louisiana enacted an
b
Overdose death data reported by state health departments may differ slightly from CDC reporting due to variations
in drug categorization.
P a g e | 16UNCLASSIFIED
amendment to House Bill 165, which strengthens the criminal penalties for the manufacture, distribution,
and possession with intent to distribute fentanyl and fentanyl analogues. 19
Additionally, GC HIDTA has identified other emerging opioid threats, such as U-47700. This opioid
analgesic drug with approximately 7.5 times the potency of morphine and can be encountered as a single
substance, but is often unknowingly mixed with other drugs, including fentanyl and heroin. For example,
“gray death,” which is a combination of varying amounts of heroin, fentanyl, fentanyl analogues (e.g.,
Carfentanil), and U-47700. Gray death emerged in St. Mary and St. Landry parishes, Louisiana in January
and February 2020. As with other synthetic and analogous drugs, the lack of regulation ensures that there
is virtually no quality control and that dosages and product purity remain inconsistent.
Carfentanil is a fentanyl analogue and is considered to be the most potent opioid used commercially. It is
approximately 10,000 times stronger than morphine. It is primarily used as a tranquilizer for large animals
and a small dose is reportedly powerful enough to sedate an elephant. In November 2019, two kilograms
of Carfentanil were seized by the DEA Huntsville Resident Office.
IV. Transportation
The majority of law enforcement believe that most fentanyl and fentanyl analogues are imported into the
United States from Canada, China, and Mexico. Forty percent of Law Enforcement Survey respondents
recorded an increase in fentanyl and other opioid transportation and 49 percent indicated an increase in
distribution. Caucasian American DTOs were ranked as the primary transporters, wholesale distributors,
and retail distributors of the drug in 2018. Black American DTOs were ranked as the second most identified
transporters and distributors. Fentanyl and its analogues are largely transported into the United States
through border checkpoints, the Interstate Highway System, and mail carrier services. There were 1,211
separate incidents along the SWB involving fentanyl in 2019, with over 1,807.45 kilograms and an
additional 902,296.75 dosage units seized. 20 The GC BLOC/HIDTA Watch Center reported one fentanyl
DHE seizure (4.9 kg) in 2019, compared to three in 2018. Additional reported DHE seizures of other illicit
drugs, including heroin and oxycodone, were laced with fentanyl.
In August 2018, law enforcement agencies based in New Orleans, Louisiana completed an investigation
into a China-based fentanyl supplier, “Diana.” Between November 2017 and January 2018, more than 20
million doses of fentanyl bound for the United States were seized and 21 people were arrested. 21 In April
2019, Chinese authorities announced that all varieties of fentanyl will be controlled substances. While this
move has potential to greatly reduce the amount of fentanyl smuggled into the United States, law
enforcement emphasizes the need for Chinese authorities to regulate illicit production of fentanyl as well
as the precursor materials used to produce it. 22
V. Production
There were no clandestine fentanyl manufacturing sites discovered in the Gulf Coast region in 2019.23
VI. Intelligence Gap
The absence of a standardized overdose death investigation protocol makes it challenging to compare
overdose death data with data from other coroner’s offices. With the opioid crisis in particular, many
coroners are not able to specifically test for fentanyl or fentanyl analogues unless there is a reason to do so.
Because of this, many fentanyl-related overdoses are underreported. Additionally, pricing information for
fentanyl is not included as there were not sufficient documented purchases or other reliable source
information to establish a retail value of the drug.
P a g e | 17UNCLASSIFIED
D. Heroin
I. Overview
In the past, law enforcement officials
within the GC HIDTA had reported
low levels of heroin availability
across the region with the exception
of several major metropolitan areas.
Thirteen percent of Law
Enforcement Survey respondents
reported heroin as the greatest drug
threat. Law enforcement officials
report that young adults who abuse
pharmaceuticals often switch to
heroin when pharmaceuticals such as
oxycodone, hydrocodone, and
hydromorphone are not available or
become too expensive.
II. Availability
Heroin availability is increasing within the GC HIDTA region overall, with 53 percent of Law Enforcement
Survey respondents indicating an increase in 2019. Similar to other opioids, heroin is a heightened drug
threat and more highly available in urban areas throughout the GC HIDTA. Forty-three percent of Law
Enforcement Survey participants identify it as highly available, while this increases to 68 percent in urban
areas of the region.
Heroin Threat by Population Density
Percent of Percent of Percent of
Percent of
Respondents Respondents Respondents
Respondents
Indicating Indicating Heroin Indicating Heroin is
Indicating Heroin
Heroin is Highly is Greatest Drug Greatest Drug
is Greatest Drug
Available Contributor to Contributor to
Threat
Violent Crime Property Crime
Gulf Coast Region 13% 43% 10% 14%
Urban Areas* 23% 68% 15% 43%
Semi-Urban Areas** 18% 58% 13% 22%
Source: 2021 GC HIDTA Law Enforcement Survey
*Urban areas include Memphis, TN (July 2018 United States Census population estimate of 650,618) and New
Orleans, LA (July 2018 United States Census population estimate of 391,006)
**Semi-urban areas include populations over 180,000: Memphis, TN; New Orleans, LA; Baton Rouge, LA (July
2018 United States Census population estimate of 221,599); Birmingham, AL (July 2018 United States Census
population estimate of 209,880); Montgomery, AL (July 2018 United States Census population estimate of
198,218); Little Rock, AR (July 2018 United States Census population estimate of 197,881); Huntsville, AL (
July 2018 United States Census population estimate of 197,318); Mobile, AL (July 2018 United States Census
population estimate of 189,572).
III. Use
It is evident that a large percentage of heroin abuse in the GC HIDTA occurs in metropolitan areas. Heroin
data from Law Enforcement Survey participants indicates that it is the second largest drug contributor to
violent crime. Heroin is also the number one drug contributing to property crime in urban areas according
to the Law Enforcement Survey and second overall for the Gulf Coast region.
P a g e | 18UNCLASSIFIED
Fifteen percent of participants in the Treatment and Prevention Survey reported heroin as the greatest drug
threat. Additionally, 46 percent of respondents indicated high levels of heroin abuse and 60 percent
indicated an increase in inpatient admissions. Law enforcement around the country report that many drug
users, who think they are buying pain pills such as OxyContin or Percocet, are unknowingly buying heroin
or other opioids in pill form. In addition, it is also likely that users are purchasing heroin in pill form out of
disdain for intravenous consumption or to Treatment Episode Data Sets (TEDS)
avoid the social stigma associated with Heroin
heroin use. Alabama Arkansas Louisiana Mississippi
2015 859 132 1,033 235
According to TEDS data, the total number 2016 1,018 211 1,102 299
of individuals seeking treatment for 2017 1,258 251 1,204 525
heroin abuse decreased for Alabama and 2018 2,810 305 1,452 590
Mississippi in 2019 after trending upward 2019 2,395 367 N/A 486
since 2015. However, treatment Source: Center for Behavioral Health Statistics and Quality,
admissions for heroin in Arkansas Substance Abuse and Mental Health Services Administration,
continued to trend upward since 2015. Treatment Episode Data Set (TEDS). 24
The CDC reports heroin overdose deaths in 2018 included 140 in Alabama, 19 in Arkansas, 173 in
Louisiana, and 39 in Mississippi. 25 Preliminary Louisiana Department of Health data from the first quarter
of 2019 demonstrates that there were 46 heroin-involved deaths in Louisiana, compared to 178 in all of
2018. This represents an annual increase since 2014 across the state, as well as an increased number of
heroin-involved deaths in urban parishes (e.g., Jefferson, St. Tammany, Orleans parishes). Jefferson Parish
accounted for 55 of the 178 heroin-involved deaths in Louisiana, St. Tammany Parish accounted for 31,
and Orleans Parish accounted for 16. 26 The Florida Medical Examiner’s Office in Northwest Florida
reported 32 heroin-related deaths in 2019, compared to 24 in 2018.27
Historically, heroin may contain adulterants that have the potential for increased potency or harm to the
user. This is one of many factors responsible for increased overdose incidents and deaths in the GC HIDTA.
Due to the danger from drug exposure experienced by paramedics and other EMS teams, many law
enforcement officers are now being trained to administer naloxone. Naloxone (sold under the brand name
Narcan) is a medication used to block the effects of opioids and is specifically designed to reverse opiate
and opioid-related overdoses. Following the trend of increased heroin abuse in urban areas of the GC
HIDTA, the Memphis Fire Department, Emergency Medical Services Dispatch reported 2,317 Naloxone
administrations for January through September 2019, an increase of about 18 percent compared to January
through September 2018.28 In addition, Jefferson Parish Sheriff’s Office, Louisiana reported administering
66 Naloxone doses in 2019.
IV. Price
Mexican brown heroin powder costs between $1,400 and $1,800 for an ounce and Mexican white powder
heroin costs approximately $1,000 for an ounce. 29 The most common unit of heroin sold at the retail level
in New Orleans is referred to as a bag or paper (i.e., 0.3 to 0.5 gram quantities individually wrapped in
small foil packages).
V. Transportation
Forty-six percent of Law Enforcement Survey respondents indicated an increase in the distribution of heroin
and 40 percent indicated an increase in transportation. The GC BLOC/HIDTA Watch Center reported that
84 pounds of heroin were seized in 2019 along the region’s interstates. Black American DTOs were ranked
as the primary transporters and wholesale and retail distributors of heroin in the Gulf Coast region as a
whole. Caucasian American DTOs closely follow in transportation and distribution of heroin. Black
American DTOs in the New Orleans area continue to transport and distribute heroin as their principle
product due to increased profit margins and availability. New Orleans is known as a heroin source city for
P a g e | 19UNCLASSIFIED
Southeast Louisiana and Southern Mississippi. The majority of the heroin found in greater New Orleans is
of South American origin, while Mexican brown heroin is usually found in the remaining areas of the GC
HIDTA.
VI. Production
Heroin is neither produced nor cultivated in the six-state region.
VII. Intelligence Gaps
Due to the end of DEA’s Heroin Domestic Monitoring Program, it is unclear whether the purity of heroin
samples across the GC HIDTA have increased or decreased from previous years. In addition, it is unclear
where heroin is cut with other drugs (e.g., fentanyl), making it difficult to prosecute in poly-drug cases.
E. Controlled Prescription Drugs
I. Overview
Forty-seven percent of Law
Enforcement officials surveyed
reported a high availability of
controlled pharmaceutical drugs
(CPDs). While five percent of Law
Enforcement Survey respondents
across the region ranked CPDs the
greatest drug threat, this number was
greater in Alabama (9 percent) and
Arkansas (9 percent), and among
treatment and prevention providers
(12 percent). The 2021 Mississippi
Threat Assessment ranks CPDs as a
primary drug threat due to their
widespread abuse.
II. Availability
Based on results from the Law Enforcement Survey, 24 percent of respondents identified CPDs as having
increased in availability. Respondents from both the Law Enforcement survey and Treatment and
Prevention Survey report Hydrocodone (e.g., Vicodin, Lorcet, Lortab) to be the most frequently diverted
CPDs in the GC HIDTA. This is closely followed by Oxycodone (e.g., Percocet, OxyContin), Alprazolam
(e.g., Xanax), and Suboxone.
III. Use
Data suggests that pharmaceuticals may be emerging as an initial drug of abuse among young adults,
becoming as common as marijuana, alcohol, and tobacco. This conclusion is based upon the increase in
routine encounters of teenagers in possession of CPDs by law enforcement and treatment professionals.
Twelve percent of treatment and prevention providers reported that pharmaceuticals are their greatest threat
and 51 percent reported CPD abuse as high. Forty-four percent indicated an increase in inpatient
admissions for CPDs in 2019. More specifically, respondents reported highest increases in inpatient
admissions for Oxycodone, Hydrocodone, Suboxone, and Fentanyl.
As pharmaceutical use increased, so have emergency room visits, overdoses, and drug-related deaths. The
abuse of pharmaceuticals without knowledge of their side effects and their combination with alcohol
accounts for the increase. According to TEDS data, the total number of patients seeking treatment for opiate
P a g e | 20UNCLASSIFIED
addiction (including methadone, Treatment Episode Data Sets (TEDS)
oxycodone, hydrocodone, Other Opiates**
hydromorphone and morphine) Alabama Arkansas Louisiana Mississippi
decreased for Alabama and
2015 1,895 1,666 997 762
Mississippi, but rose for Arkansas in 2016 1,487 1,573 749 696
2019. 2017 1,662 1,303 825 1,001
2018 3,894 1,260 757 1,003
Treatment and prevention providers 2019 2,752 1,422 N/A 524
report the majority of their clients **Other Opiates include: Non-heroin opiates include methadone,
obtain CPDs through street dealers, codeine, Dilaudid, morphine, Demerol, oxycodone, and any other drug
followed by friends, family members, with morphine-like effects.
theft from family members/friends, Source: Center for Behavioral Health Statistics and Quality, Substance
and doctor shopping. While CPDs are Abuse and Mental Health Services Administration, Treatment Episode
not a leading contributor to violent Data Set (TEDS).30
crime, these diversion methods are commonly encountered across the Gulf Coast and remain a concern for
law enforcement. For example, the Mississippi Bureau of Narcotics documented 32 pharmacy burglaries
or attempted burglaries in 2019 in Mississippi, an increase from 25 in 2018.31
In order to better track CPDs reported as lost or stolen, the DEA Office of Diversion maintains a database
of reported losses by registered handlers. The below chart shows the most common form of loss in the GC
HIDTA is overwhelmingly via break-ins/burglaries, followed by employee theft, robbery, and then
customer theft. In addition, DEA reports a number of CPDs as being lost in transit. The most commonly
diverted drug in the DEA drug theft losses report is Hydrocodone, followed by Oxycodone.
Theft Loss Reporting in 2019
800
700
600
500
400
300
200
100
0
Escambia
Shelby and Santa
Alabama Arkansas Louisiana Mississippi County, Rosa
Tennessee Counties,
Florida
Break-in/Burglary 699 323 117 114 47 0
Customer Theft (Or Non-Employee) 8 1 12 2 2 6
Employee Theft (Or Suspected) 265 222 227 107 131 21
Robbery 133 57 116 0 46 0
Source: DEA Office of Diversion
IV. Price
The price of Hydrocodone pills vary from $5 to $10, Xanax pills vary from $5 to $7, Adderall pills vary
from $5 to $7, Oxycodone pills vary from $1 to $35, OxyContin pills vary from $1 to $40, Suboxone pills
vary from $20 to $40, Dilaudid pills vary from $10 to $40, and Ritalin pills vary from $5 to $7. There is no
accurate data on the pricing of other CPDs.32
P a g e | 21You can also read