Skills Policies for Economic Diversification in the Former Yugoslav Republic of Macedonia-Enhancing local skills policies for the food and tourism ...
←
→
Page content transcription
If your browser does not render page correctly, please read the page content below
Munich Personal RePEc Archive

Skills Policies for Economic
Diversification in the Former Yugoslav
Republic of Macedonia- Enhancing local
skills policies for the food and tourism
sectors

Mojsoska Blazevski, Nikica and Kostadinov, Aleksandar and
Gregg, Con and Uexkull, Erik von

ILO Decent Work Technical Support Team and Country Office for
Central and Eastern Europe, University American College Skopje,
Macedonia

2012

Online at https://mpra.ub.uni-muenchen.de/42654/
MPRA Paper No. 42654, posted 18 Nov 2012 13:52 UTC
International
                                                                                  Labour
                                                                                  Organization

 EmploymEnt
  promotion

                SKILLS POLICIES FOR ECONOMIC
                DIVERSIFICATION IN THE
                FORMER YUGOSLAV REPUBLIC
                OF MACEDONIA
                Enhancing local skills policies
                for the food and tourism sectors

              Associate Prof. Nikica Mojsoska-Blazevski, PhD
              Junior consultant: Aleksandar Kostadinov, MA
              With contributions from Con Gregg and Erik von Uexkull

decent work technical support team and country office for central and eastern europe
Skills Policies for Economic
    Diversification in the
    former Yugoslav Republic
    of Macedonia
    Enhancing local skills policies
    for the food and tourism sectors
    Prepared by: Associate Prof. Nikica Mojsoska-Blazevski, PhD
    Junior consultant: Aleksandar Kostadinov, MA
    With contributions from Con Gregg and Erik von Uexkull

ILO Decent Work Technical Support Team and Country Office for Central and Eastern Europe
Copyright © International Labour Organization 2012
First published 2012
Publications of the International Labour Office enjoy copyright under Protocol 2 of the Universal Copyright
Convention. Nevertheless, short excerpts from them may be reproduced without authorization, on condition that the
source is indicated. For rights of reproduction or translation, application should be made to ILO Publications (Rights and
Permissions), International Labour Office, CH-1211 Geneva 22, Switzerland, or by email: pubdroit@ilo.org. The Interna-
tional Labour Office welcomes such applications. Libraries, institutions and other users registered with reproduction
rights organizations may make copies in accordance with the licences issued to them for this purpose. Visit www.ifrro.
org to find the reproduction rights organization in your country.
ILO Cataloguing in Publication Data
Mojsoska-Blazevski, Nikica; Kostadinov, Aleksander; Gregg, Con; Von Uexkull, Erik; Mechkaroska-Sim-
janoska, Natasha
Skills policies for economic diversification in the former Yugoslav Republic of Macedonia: enchancing
local skills policies for the food and tourism sectors / prepared by: Associate Prof. Nikica Mojsoska-Blazevski,
Junior Consultant: Aleksander Kostadinov, with contributions from Con Gregg and Erik von Uexkull ; ILO
Decent Work Technical Support Team and Country Office for Central and Eastern Europe. - Skopje: ILO, 2012
1 v.
ISBN: 9789221258858; 9789221258865 (web pdf)
ILO DWT and Country Office for Central and Eastern Europe
food industry / beverage industry / tourism / industrial production / production diversification / trade /
human capital / skilled worker / skill requirements / employment / wages / Macedonia,former Yugoslav Republic
08.06.1
The designations employed in ILO publications, which are in conformity with United Nations practice, and the
presentation of material therein do not imply the expression of any opinion whatsoever on the part of the International
Labour Office concerning the legal status of any country, area or territory or of its authorities, or concerning the delimi-
tation of its frontiers.
The responsibility for opinions expressed in signed articles, studies and other contributions rests solely with their
authors, and publication does not constitute an endorsement by the International Labour Office of the opinions ex-
pressed in them.
Reference to names of firms and commercial products and processes does not imply their endorsement by the
International Labour Office, and any failure to mention a particular firm, commercial product or process is not a sign of
disapproval.
ILO publications and electronic products can be obtained through major booksellers or ILO local offices in many
countries, or direct from ILO Publications, International Labour Office, CH-1211 Geneva 22, Switzerland. Catalogues or
lists of new publications are available free of charge from the above address, or by email: pubvente@ilo.org
Visit our website: www.ilo.org/publns
2CONTENTS
1. Introduction ............................................................................................................ 9
2. Macro and Business Environment .......................................................................... 10
2.1. Economic development ................................................................................ 10
2.2. Trade Developments ..................................................................................... 13
2.3.Employment and Wages ................................................................................ 19
2.4.Trade Environment and Institutions ............................................................. 21
2.5.Enabling Legal and Regulatory Environment ............................................... 23
3. Human Capital ....................................................................................................... 25
4. Food Industry .......................................................................................................... 27
4.1. Production and Trade ................................................................................... 27
4.2 Employment and Skills................................................................................... 31
4.3. Case Study: Sheep Meat Industry................................................................. 34
4.4. Strategic Direction for the Food Sector ...................................................... 41
5. Tourism .................................................................................................................... 43
5.1. Tourism sector developments.................................................................... 43
5.2. Employment and Skills.................................................................................. 52
5.3. Government Policy and Institutional Set-up ............................................... 55
5.4. Strategic Direction for the Tourism Sector ................................................. 57
5.5. Case Study – Ireland ...................................................................................... 59
6. Conclusions ............................................................................................................. 61
References ................................................................................................................... 64
Annex 1: Focus groups ................................................................................................ 65
Anex 2: Draft Local action plans ............................................................................... 68
3Abbreviations
ECTM - Economic Chamber for Tourism of Macedonia
ETF - European Training Foundation
EU – European Union
FDI – Foreign Direct Investments
FTA – Free Trade Agreement
GCI – Global Competitiveness Index
HoReCa – Hotels, restaurants and catering services
HOTAM - Hotel Association of Macedonia
IHRA - International Hotel and Restaurant Association
SAA – Stabilisation and Association Agreement
SEE – South-Eastern Europe
SITC - System of International Trade Classification
VET – Vocational Education and Training
4Figures
Figure 1 Real GDP 1990-2010 ..............................................................................................................................10
Figure 2:Technological Level of Domestic Production, NACE rev1...................................................................12
Figure 3: Exports, Imports (mln. US$) and Trade Balance (% GDP) ...................................................................13
Figure 4: Exports by Country, Share of Total Exports in 2010 ..........................................................................14
Figure 5: Structure and Development of Exports (mln. US$), 2000-2010.........................................................15
Figure 6:High-Technology Exports (% of manufactured exports), 2006-2009 ..................................................16
Figure 7: Structure and Development of Imports (mln. US$), 2000-2010 ........................................................18
Figure 8: Gross and Net Wage Developments, January 2006-May 2011 ...........................................................20
Figure 9: Industrial Production Index, Total Manufacturing and Food Processing (2005=100) ......................27
Figure 10:Main Exporting Food Products, 2000-2010 .......................................................................................28
Figure 11: Main Food Export Destinations, 2010 ...............................................................................................29
Figure 12: Main Import Food Products, 2000-2010............................................................................................30
Figure 13: Real Gross Investment, Total and by Sector, 2000-2009 ..................................................................31
Figure 14:Production, Employment and Productivity Index for Food Industry (2005=100)............................31
Figure 15: Net Wages 2004-2010, in MKD ...........................................................................................................32
Figure 16: Educational Structure of Employees in Manufacturing, 2010.........................................................33
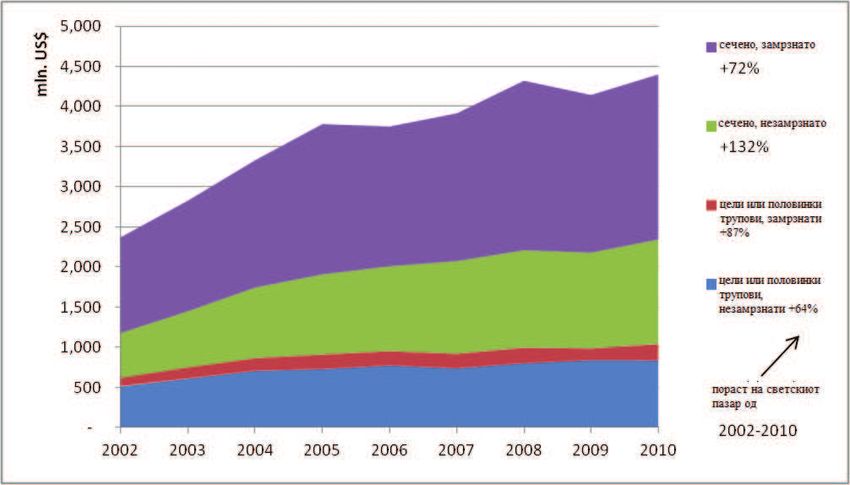
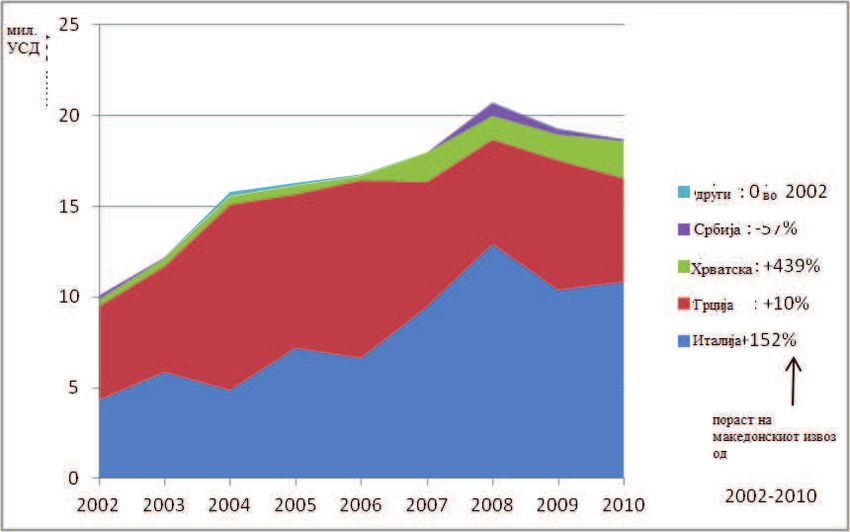
Figure 17: Exports of Sheep Meat by Destination .............................................................................................35
Figure 18: World Imports of Sheep Meat by Product .........................................................................................36
Figure 19: 2010 Imports of Sheep Meat by Product and Largest Importers ....................................................36
Figure 20: 2010 Exports of Sheep Meat by Product and Largest Exporters ....................................................37
Figure 21: Export and Import of Travel Services and Contribution of HoReCa in GDP...................................44
Figure 22: Number of Domestic and Foreign Tourist Arrivals and Overnights (000s), 1990-2010 ..................46
Figure 23:Structure and Number of Domestic and Foreign Tourist Arrivals and Overnights, 2010 ...............47
Figure 24: Structure of Foreign Tourists by Country of Origin, 2010 ...............................................................47
Figure 25: Visits by Domestic and Foreign Tourists, by Type of Resorts, 2010 ................................................50
Figure 26: Gross Capacity Utilization of Capacities by Resorts ........................................................................51
Figure 27: Employees in Hotels and Restaurants, Administrative and LFS data .............................................52
Figure 28: Education Structure of Employees in HoReCa .................................................................................53
Figure 29: Wages in Hotels and Restaurants by Wage Range, 2010 ..................................................................53
5Tables
Table 1: Quarterly GDP Growth by Production Sectors .......................................................................... 11
Table 2: FDI Inflows in the former Yugoslav Republic of Macedonia and Neighbouring Countries
(in US$, per cent of GDP)............................................................................................................. 13
Table 3: Employment by Sectors, LFS and Administrative Source, 2010 .............................................. 19
Table 4: Tariff structure (2011).................................................................................................................. 22
Table 5 Trading Across Borders:
the former Yugoslav Republic of Macedonia and some Peer Countries.................................. 24
Table 6 Top 5 Ranked Issues for Businesses ............................................................................................. 24
Table 7: Tariff Barriers (ad valorem equivalents) on Imports of Sheep Meat in Major Markets............ 38
Table 8: Economic Data on Tourism,
the former Yugoslav Republic of Macedonia and the Region .................................................. 45
Table 9: Trends in Tourist Arrivals by Origin .........................................................................................48
Table 10: Number of Tourists by Type of Board and Lodging Establishments in 2010* ....................... 49
6FOREWORD
This report presents an application of the ILO’s Skills for Trade and Economic Diversification (STED)
methodology to two sectors – tourism and food industries – of the economy of the former Yugoslav Republic
of Macedonia. The STED methodology provides strategic guidance for the integration of skills development
in sectoral policies. It is designed to support growth and decent employment creation in sectors that have
the potential to increase exports and to contribute to economic diversification. It has been developed in
recognition of the fact that having the right skills among workers is crucial for firms or industries to succeed
in trade, and because understanding trade is important to providing workers with the right skills. Availability
of skilled workers contributes to higher and more diversified exports, more FDI, higher absorption of
technology, and more sustainable growth and productive employment creation. At the same time, skills are
the key determinant for a worker’s success in finding a good job and making a living.
Employment promotion and defining the priority sectors for future economic development in terms of
skills is still a challenging task for many of the institutions and stakeholders in the former Yugoslav Republic
of Macedonia. In this context, investment in human resources is central and formulating up-to-date policy
advice on how to increase economic diversification through strengthening the business enabling environment
with a focus on skill endowments and export orientation is key to fostering employment generation. While
analysis at the national level can give useful directions for sustainable growth and employment creation, an
in-depth analysis of individual sectors is useful – and indeed necessary – in order to design concrete policy
proposals. It is for these reasons that two sectors - Tourism and Food Industries - were analysed in some
detail. The analysis describes the obstacles to enhanced economic diversification and sustainable growth
in terms of the business environment, the availability of skills, and the situation of global markets for
Macedonian exports. A particular emphasis was put on identification of skill needs at regional and local level
through the creation of two working groups representing trend-setting companies from each selected sector,
employers’ organizations, workers’ organizations, practitioners and teachers. The results of the analysis have
been incorporated in local action plans for employment, using the LED approach, for the regions of Krushevo,
Prilep and Resen.
A workshop with representatives from national and local government and relevant educational
institutions as well as employers‘ and workers‘ representatives from the respective sectors was organized in
Skopje in September 2011 to discuss and validate initial findings of the draft research paper and promote
skills dialogue among stakeholders. Members of the working groups attended a training on Local Initiatives for
Economic Development at the ILO International Training Centre in Turin (19-23 September 2011) to discuss
how the findings of the report could be translated into concrete policy outcomes and recommendations
for employment promotion and local economic development. Conclusions of these events have been
incorporated into the final version of the paper that was presented and discussed at a National Seminar on
“Local action plans for economic development in the sectors of tourism and food processing” which was held
in Bitola, 6-7 December 2011.
This report was prepared by Prof. Nikica Mojsoska Blazevski, Dean of the School of Business Economics
and Management, University American College, Skopje with substantial contributions from Erik von Uexkuell
(ILO Trade and Employment Programme) and Con Gregg (ILO Skills and Employability Department). Aleksandar
Kostadinov, labour market expert, provided data analysis for this report. Comments on the earlier draft
were provided by Natalia Popova (Senior Employment Specialist, ILO DWT/CO-Budapest) and Marion Jansen
(Coordinator of the Trade and Employment Programme, ILO Geneva).
7We would like to express our appreciation to all those who have made a valuable contribution to this
report: Yordanka Tzvetkova and Martin Gasser of the ILO International Training Center in Turin; and members
of the working groups from Krushevo, Prilep and Resen.
We are also grateful to Emil Krstanovski, ILO National Coordinator in the former Yugoslav Republic of
Macedonia, his assistant Marija Gjorgievska and Agnes Fazekas, Programme Assistant at the ILO DWT/CO-
Budapest for their excellent administrative support provided throughout the project.
Mark Levin
Director
ILO Decent Work Technical Support Team and
Country Office for Central and Eastern Europe
Budapest
81. Introduction
The former Yugoslav Republic of Macedonia is a country with a small and open economy. Its trade
represents about 90 per cent of the country’s GDP. Thus, exports play an important role in the country’s
economic development, and the development of a successful export sector which can compete in foreign
markets is critical given the small size of the domestic market (Kathuria, 2008). Consequently, the focus of
government economic policies in recent years has been on improving the business environment, attracting
Foreign Direct Investment (FDI), and promoting exports. Trade ‘openness’ has been extended over the last
decade through the reduction of Most Favoured Nation (MFN) tariffs and preferential liberalization of trade
with regional trading partners and the EU.
A liberal trade environment creates both opportunities and challenges. Openness to trade and FDI alone
are unlikely to create a thriving export sector if they are not accompanied by advancements in several key
areas, including infrastructure, national legislation, institutional structure and capacity, and the availability
of appropriately skilled workers. The latter is of utmost importance along all levels of the value chain, from
small scale producers to factory workers, service providers, machine operators and so on all the way up to
senior management levels of exporting firms. The degree to which the educational and training system is
capable of providing the skills required at all levels of the economy is a key determinant of competitiveness
in today’s knowledge-based global economy, and at the same time, a crucial precondition for the creation of
decent and productive employment.
Achieving success as an export-based economy is a highly dynamic process, which involves regular
adjustment to the realities of the global market and in particular the discovery and development of new export
opportunities. This process of industrial upgrading can mean significant external impacts upon companies.
This often requires a pro-active role for the government to encourage and support the development of new
industries (Lin 2011).
Skills development is among the most important areas where the public and private sectors have to
work together to identify current and future needs of emerging industries and ensure that these will be met
as those industries develop. This idea is the rationale for the ILO’s Skill for Trade and Economic Diversification
(STED) approach, which is applied in this report to two sectors, food production and tourism.
The function of determining just exactly which sectors should assume priority for future economic
development, and analyzing their skills requirements remains a highly challenging task for the relevant
institutions and stakeholders in the former Yugoslav Republic of Macedonia.
The first aim of this study is to support this process by an in-depth analysis of two important sectors
of the economy, and to propose concrete policies for both skills development and other key elements of the
business environment to unlock their potential. The second aim is to demonstrate the relevance of this type
of research in order to encourage stakeholders in these and other sectors to engage more actively in the
preparation of strategic targets for their industries, and how skills development can be incorporated in an
overall strategy to achieve them.
The structure of this report is as follows. In section 2, we outline the main macroeconomic developments
as well as the business climate in the former Yugoslav Republic of Macedonia which set the background for
the development of any export industry. In section 3, we provide an overall sketch of human capital in
the country and explain the institutional setup of the education and skills forecasting systems. Section 4
applies the STED methodology to the food and beverages sector by analyzing the industry’s current domestic
and global market position, analyzing the availability of appropriately skilled labour and sector specific
educational institutions, and highlighting its likely development and key challenges for the future. Section 5
applies the same methodology to the tourism sector. We offer our conclusions in section 6.
92. Macro and Business Environment
2.1. Economic development
After the collapse of Yugoslavia, the transition of the former Yugoslav Republic of Macedonia was
followed by geopolitical external events that shaped the process of economic transition to a market economy,
and the political transition to pluralism.
Those events were: i) the UN embargo imposed on the Republic of Yugoslavia and the consequent
interruption of trade and business relations; ii) trade sanctions imposed by neighboring Greece due to
the dispute over the country’s name; and iii) the NATO bombing of Serbia and Montenegro in 1999 and
the consequent Kosovo1 refugee crisis in the former Yugoslav Republic of Macedonia. Such geopolitical
instability in the region affected the country’s economic performance on a great scale and deterred foreign
direct investment (FDI) from the region. Further, in 2001, economic development and political stability were
impeded by internal ethnic conflict.
At the onset of transition, the former Yugoslav Republic of Macedonia was the least developed country
within ex-Yugoslavia and, at about 20%, had the largest unemployment rate amongst all socialist countries.
The initial years of transition were characterised by a decline in both GDP (see Figure 1) and employment.
Initially, the reduction in GDP was mainly driven by a substantial decline in industrial production, which
recovered again later. Agricultural gross output fluctuated in this period (Mojsoska-Blazevski, 2011).The
economy settled on a positive growth path from 1996 onwards but this was interrupted in 2001, the year of
internal civil conflict. With such GDP developments, the country reached the pre-transition level of real GDP
only in 2006.
Figure 1 Real GDP 1990-2010
300,000
6
250,000 4
200,000 2
150,000 0
-2
100,000
-4
50,000 -6
0 -8
GDp in 1995 constrant prices, real growth rate
in mill. den.
Source: State Statistical Office, National Accounts, various years.
Table 1 represents quarterly real GDP growth rates for 2006-20102. The economy grew quite steadily in
2007 and 2008, when high annual growth rates peaked at end-2007 and beginning of 2008. This period was
interrupted by the global economic crisis that impacted on the economy from 2008Q4 when growth slowed
down, and then went into negative rates for three consecutive quarters.
1
As defined by UN Security Council Resolution 1244, hereafter Kosovo.
2
We cannot present quarterly data and growth rates for 2004 and before because of recent revision of GDP data by the State
Statistical Office, when quarterly data were revised only from 2005 onwards.
10However, the negative effect was more moderate than those experienced by most countries of Central
and South Eastern Europe. In 2009, real GDP declined by a relatively modest 0.9%. The decline in domestic
production did not have a strong effect on the labour market, notwithstanding its typical poor performance.
This relatively good performance of the economy can be attributed to several factors. Significantly, the
intensive structural reforms implemented in the pre-crises period as well as tax reforms and prudent fiscal
policy with low pre-crisis deficits and debt, prevented the global downturn from turning into a domestic
financial crisis in the country.
Table 1:Quarterly GDP Growth by Production Sectors
Agriculture and Mining, Manufacturing
GDP Construction Services
Fishery (A+B) and Electricity
2006-Q1 6,1 2,3 -5,9 30,2 10,6
Q2 3,6 8,5 -3,2 21,9 3,6
Q3 6,7 6,7 7,9 1,1 4,8
Q4 4,0 2,4 10,7 -15,8 3,5
2007-Q1 6,6 7,2 21,3 -6,2 1,1
Q2 5,1 1,1 10,7 -1,2 6,8
Q3 5,5 -5,1 10,3 6,0 7,4
Q4 7,4 -8,8 10,1 11,8 9,7
2008-Q1 6,2 1,4 8,0 -6,3 10,2
Q2 6,6 7,0 5,8 -5,3 8,8
Q3 5,8 13,0 4,8 -11,2 6,5
Q4 1,7 1,9 -7,5 0,6 3,9
2009-Q1 -1,4 2,7 -13,5 4,4 1,8
Q2 -2,4 -2,3 -12,2 8,6 -0,1
Q3 -2,1 3,6 -14,8 2,0 1,4
Q4 2,0 5,6 -2,2 2,7 -0,2
2010-Q1 -0,5 4,5 -5,8 4,7 -0,9
Q2 1,5 4,4 -1,4 -9,0 1,4
Q3 2,1 4,2 -0,1 21,6 0,2
Q4 3,8 4,6 -1,9 38,2 3,4
Average growth 3,4 3,2 1,1 4,9 4,2
Source: State Statistical Office, National Accounts, various years.
Manufacturing was hardest hit by the global crises through reduced external demand for the country’s
products. For instance, in 2009 industrial production declined by about 11% year-on-year. Growth weakened
in services, whereas construction and agriculture production was preserved by government-financed large
infrastructure projects, and by increasing subsidies to agriculture.
As a positive development in terms of the long-term growth of the country, the share of gross investments
in GDP increased from 20.3 per cent in 2005 to 26.8 per cent in 2008, though declined slightly to 24.8 per
cent in 2010. This improvement is a result of changes in the profit tax system introduced in 20093, increased
inflows of FDI, and more intense credit activity.
3
From 2009, profit tax is paid only on distributed profits.
11Most of the national production (measured as gross output at basic prices) is based on a low technology
content (45 per cent); 43 per cent is medium-low technology production and only 1 per cent is high technology
production. This structure of domestic production is reflected in the country exports, which are dominated
by low-value added products (see section 2.2).
Figure 2:Technological Level of Domestic Production, NACE rev1
High medium-high-
technology technology
1% 11%
low technology
45%
medium-low-
technology
43%
Source: Author’s calculation, SSO, based on NACE rev 1.
As in most South Eastern European countries (SEE)4, in the last couple of years before the crisis,
domestic growth in the former Yugoslav Republic of Macedonia was driven by increased exports (mainly
due to favourable terms of trade) and improved domestic demand fuelled by foreign direct investment (FDI)
inflows, remittances, and credit expansion (Bartlett and Monastiriotis, 2010). However, this growth pattern
put considerable pressure on the current account deficit (see Figure 3).
The deteriorating global financial and economic environment in 2008/9 dampened national exports
and inflows of FDI. In 2008 and 2009, exports declined by 22.5% cumulatively, while imports declined by
14.2% (see section 2.3). Hence, net exports had a negative contribution to the GDP growth. In 2007 and
2008, FDI inflows to the former Yugoslav Republic of Macedonia picked up, reaching 699 million US$ and
587 million US$, respectively. The global economic crisis prompted tighter international capital markets and
this affected the FDI flows into the country. In 2009, FDI declined to 197 million US$, although in 2010 they
increased slightly to 296 million US$. Table 2 shows that the former Yugoslav Republic of Macedonia has
been a poor performer in the region in attracting FDI, both measured as percentage of GDP and per capita.
Moreover, some of the countries in the region, Albania and Montenegro, managed to increase the inflow of
FDI even during the global crisis.
4
SEE countries include: Albania, Bulgaria, Bosnia, Croatia, the former Yugoslav Republic of Macedonia, Kosovo, Montenegro,
Romania, Serbia and Turkey.
12Table 2: FDI Inflows in the former Yugoslav Republic of Macedonia and Neighbouring Countries
(in US$, per cent of GDP)
2009
2007 2008 2009
per capita in USD
Albania 6.1 7.5 8.1 209.1
Bosnia and Herzegovina 13.6 5.0 1.4 97.8
Croatia 8.4 8.7 4.7 481.1
Kosovo .. 9.0 7.5 157.8
The former Yugoslav Republic of
8.8 6.2 2.7 70.7
Macedonia
Montenegro 25.3 19.9 32.0 1705.7
Serbia 8.8 6.1 4.5 187.8
Source World Bank, National Statistics offices and own calculation.
The largest stocks of FDI in the former Yugoslav Republic of Macedonia are held by investors from the
Netherlands (17%), Greece (13%) and Slovenia (12%)5, with virtually all significant investors currently in the
country coming from the EU or Balkan region. Between 2003 and 2008 (last year with data availability) most
FDI inflows went into Electricity, Gas and Water (29%), Manufacturing (25%) and the Financial Sector (15%).
Hotels and Restaurants only received 2% of total FDI inflows over this period.6
After a period of sluggish economic growth, GDP picked up in 2011-Q1, with an increase of 5.1 per cent
quarter-on-quarter, mainly driven by high growth in construction (21.2 per cent) and industry (13.7 per cent).
The main drivers of growth on the expenditure side were investment and exports which grew by 60 per cent
and 35 per cent quarter-on-quarter, respectively.
2.2. Trade Developments
As a small economy, the former Yugoslav Republic of Macedonia is inevitably focussed on international
trade. Trade openness (defined as (imports + exports)/GDP) increased over most of the decade and reached
110% in 2008, but contracted during the global economic crisis of 2008/9 and reached 96% in 2010.
Figure 3: Exports, Imports (mln. US$) and Trade Balance (% GDP)
8000 0
7000 -5
6000
-10
5000 Trade deficit as per
-15 of GDP (right axis)
4000 Export
-20
3000
-25 Import
2000
1000 -30
0 -35
2000 2001 2002 2003 2004 2005 2006 2007 2008 2009 2010
Source: National Bank of Republic of Macedonia, www.nbrm.mk.
5
Data source: National Bank of Republic of Macedonia.
6
Data source National Bank of Republic of Macedonia.
13Exports peaked in 2008, when they reached 4bil.US$ (Figure 3). Increased exports reflected intensified
domestic production in 2007 and 2008, improved terms of trade, and new exports under new FDI projects. At
the same time however, imports increased even faster due mainly to the FDI-related importation of capital
equipment, together with high consumer demand and confidence. Hence, the trade balance and current
account deficit in 2008 widened to 29 per cent of GDP and 16.6 per cent of GDP respectively. As global
demand recovered, exports rebounded with a 23.4% increase, while imports grew by 10.9%. This improved
performance was mainly attributable to an unexpectedly sharp increase in world trade volume of 14.5% in
2010. As the crisis led to a steeper decline in imports than in exports, the trade balance and current account
deficit in 2010 declined to 23.5 per cent and 2.9 per cent of GDP respectively.
Figure 4 shows the geographical distribution of exports in 2010. The largest share of products were
exported to Germany (21 per cent), followed by Kosovo (13.3 per cent), Bulgaria (8.9 per cent) and Serbia
(8.2 per cent). With the exception of China, all other top 10 trading partners are in the EU or Balkan region,
illustrating the high share of regional concentration exports, with about 60 per cent of the exports of the
former Yugoslav Republic of Macedonia directed towards the EU and 30 per cent towards Western Balkan
countries.
Figure 4: Exports by Country, Share of Total Exports in 2010
B&H, 2.6 Belgium, 2.4
China, 2.7
Croatia, 3.7
Italy, Germany,
7.1 21.0
Greece,
7.4
Kosovo,
13.3
Serbia, Bulgaria,
8.2 8.9
Source: National Bank of Republic of Macedonia, www.nbrm.mk.
Figure 5 shows the top 20 export categories and their development since 2000. The major export from
the former Yugoslav Republic of Macedonia in 2010 was iron and steel which, together with the related
category Metalliferous Ores and Metal Scrap, accounted for 30% of total exports. The data clearly shows
the very strong growth prior to the global economic crisis of 2008/9, which to a large extent was driven by
soaring world market prices. It also shows the subsequent decline in 2009. 2010 only saw a partial recovery,
and the current export value remains significantly below its 2008 peak. The Clothing industry, accounting for
17% of total exports, was also affected by the global economic crisis. The decline in 2009, while less dramatic
than for Iron and Steel, seems to have persisted in 2010. Exports in the Chemical Materials and Products sec-
tor went from almost zero to 230 million US$ in 2010. Unfortunately, official trade statistics do not provide
detailed information for certain export products considered confidential, and it is not possible to evaluate
more closely what is behind this surge.
14Apart from these large export sectors, substantial contributions to overall export growth since 2000
came from a number of smaller sectors, including Fruits and Vegetables, Medical and Pharmaceutical
Products, Cereals and Cereal Preparations, General Industrial Machinery, and Furniture. Figure 5 also shows
that while most export sectors suffered a decline in 2009, some were much quicker to recover than others
in 2010.
Figure 5: Structure and Development of Exports (mln. US$), 2000-2010
Iron and steel
Clothing
Chemical materials and products, n.e.s.
Petroleum and petroleum products
Metalliferous ores and metal scrap
Fruits and vegetables
Tobacco and tobacco manufactures
Beverages
Medical and pharmaceutical products
Footwear
Non-metalic manufactures, n.e.s.
Textile yarn, fabrics, made-up articles and
related products
Manufactures of metals, n.e.s.
Electrical machinery, apparatus and appliance
Cereals and cereals preparations
General industrial machinery
Meat and meat preparations
Crude fertilizers and crude minerals
Furniture and parts there of
Electric energy
Other
Source: National Bank of Republic of Macedonia
15Low-value added, unskilled labour and natural resource-intensive goods dominate exports (Ministry of
Economy, 2010). 45 per cent of exports in 2010, classified by economic use, were in the category of raw
materials. In addition, Figure 6 shows that the former Yugoslav Republic of Macedonia has a very small share
of high-technology exports compared to its regional peer countries.
Figure 6:High-Technology Exports (% of manufactured exports), 2006-2009
30
25
20
2006
15
2007
2008
10 2009
5
0
Albania Bosnia and Bulgaria Croatia Hungary macedonia, Fyr oECD members Slovenia European Union
Herzegovina
Source: World Bank
An overreliance on both world market prices for metals and on price competitiveness makes the
country’s exports vulnerable to competition. Hence, enhancing value added of exports and accelerating the
diversification of the export structure are among the desired goals of the recently prepared Export Promotion
Strategy, which currently awaits government approval. Inter alia, the Strategy recommends diversification of
exports by increasing foreign returns from the tourism sector.7
The predominance of low-value added products in total exports reflects very low domestic spending on
R&D, at 0.22 per cent of GDP in 2008, compared to the EU average of 1.92 and the 3 per cent target of Europe
2020. Of the total expenditures on R&D, just over 20 per cent represents business-financed R&D. In 2011, the
government prepared the first draft Strategy for Scientific-Research and Development Activity 2011-2020,
which is currently undergoing a consultation process.
A significant body of research and literature indicates higher income vulnerability to external shocks in
the case where there is higher commodity and/or geographical concentration of exports (Malik and Temple,
2006; Haddad et al., 2009; Hamid, 2010; ILO, 2010). Moreover, Malik and Temple (2006) argue that landlocked
countries like the former Yugoslav Republic of Macedonia are more likely to experience concentrated exports,
which makes them vulnerable to external economic shocks. The former Yugoslav Republic of Macedonia had
a Herfindahl index of export product concentration above 0.22 in the whole period from 1998 to 2008,
which put in in the upper segment of the category “moderate export concentration”8. The Herfindahl index
7
A draft version of the Strategy can be found on http://www.economy.gov.mk/Uploads/files/%D1%81%D1%82%D1%80%D0%
B0%D1%82%D0%B5%D0%B3%D0%B8%D0%B8/Export%20Strategy.pdf.
8
A Herfindahl index between 0.15 to 0.25 (or 1,500 to 2,500) indicates moderate concentration, below 0.15-non-concentrated
export, and above 0.25-concentrated export.
16declined to 0.18 in 2009 and 2010, driven partly by the decline in traditional exports of Iron and Steel. On the
other hand, the Herfindahl index of geographical concentration shows a rather high concentration of the
country’s exports. This can be expected given the high share of exports directed towards EU and Western
Balkan countries. The concentration slightly decreased in 2009 and 2010, when the Herfindahl index equalled
0.47 in 2010 from 0.51 in 2007. Still, such a high geographical concentration makes national income from
exports vulnerable to external shocks, especially to the EU demand.
While there is some room for greater diversification of exports by product, there is a greater need to
expand exports to new countries or regions in order to ease income volatility. In addition, and significantly,
the country’s export achievements are dependent on the performance of foreign-owned companies which
contribute about two-thirds of total exports (Ministry of Economy, 2010).
Figure 7 shows a breakdown of imports across the top 20 categories. Not unusually, imports are much
more dispersed across sectors than exports, so a large share falls into categories other than the top 20. The
main import categories are Petroleum and Petroleum Products, Textiles, Road Vehicles, and Iron and Steel. The
declines in Petroleum and Iron and Steel imports in 2009 to a large extent reflect declines in world market
prices during the crisis. It is interesting to note that F the former Yugoslav Republic of Macedonia is engaged
in rather substantial intra-industry trade for Iron and Steel, which ranks high as both an import and an export
product. High imports of Textiles demonstrate the strong linkages between the import of intermediate goods
and exporting in the clothing sector (which also suggests that domestic value addition per unit of output
in this sector is relatively low as several inputs are being imported). With the exception of Meat and Meat
Preparations, no food related sectors are among the top 20 importing categories. Trading partners on the
import side are similar to destinations of exports, with the exception that Russia (10%) and Turkey (5%) rank
among the top trading partners for imports, but only receive a very small share of the country’s exports.
17Figure 7: Structure and Development of Imports (mln. US$), 2000-2010
Petroleum and petroleum products
Textil yarn, fabrics, made-up articles and
related products
Road vehicles
Iron and steel
Metalliferous ores and metal scrap
Electrical machinery, apparatus and
appliance
Non-ferrous metals , n.e.s
Miscellaneous manifactured articles , n.e.s
Tellecomunication apparatus and
equipment
Medical and pharmacutical products
General industrial machinery
Inorganic chemical
Non-metalic manufactures, n.e.s.
Meat and meat preparations
Electric energy
Paper, paperboard and articles of paper
pulp
Machinery specialized for particular
industries
Manufactures of metals, n.e.s.
Essential oils and perfume materials, toilet,
preparations
Other
Извор: Народна банка на Република Македонија
Source: National Bank of Republic of Macedonia
182.3.Employment and Wages
The labour market is characterised by high and persistent unemployment. It reached 32.0 per cent
in 2010, while employment rates remained low at 38.7 per cent, and participation rates at 56.9 per cent.
Labour Force Survey (LFS) data show that in 2010-Q4 there were about 660,000 employees in the former
Yugoslav Republic of Macedonia. This figure is 50 per cent higher than employment data from the annual
State Statistical Office report on employees and net wages (hereafter called, administrative source9). Table
3 shows employment by sectors by these two sources, though the methodology behind them is different and
hence the data are not fully comparable. The striking difference in employment can be seen in agriculture
which is probably due to high levels of informal employment and seasonal work, as well as unpaid work.
Given that LFS data by employment sector are published on a more aggregated level, we have to rely on
administrative data to assess employment in the two sectors of our interest, Manufacturing of Food and
Beverages and Hotels and Restaurants. However, we would like to point out that in the sector Hotels and
Restaurants, LFS employment is 61.3 per cent higher than administrative employment, which can at least be
partly explained by informal jobs. We expand this discussion in section 5.2. We cannot assess the extent of
informal employment in Manufacturing of Food and Beverages since there are no data for this sub-sector in
LFS, but we can use as a proxy the difference of 25.6 per cent for the whole manufacturing sector.
Table 3: Employment by Sectors, LFS and Administrative Source, 2010
Difference LFS
2000 2010 2010-Q4 Change Structure
and admin. (in
(admin.) (admin.) (LFS) 2010/2000 2010 (in %)
per cent)
Agriculture, hunting and forestry 15.579 12.989 126.928 -16,6 877,2 3,0
Fishing 389 110 67 -71,7 -39,1 0,0
Minerals and stone mining 6.595 3.702 4.389 -43,9 18,6 0,9
Manufacturing 107.936 102.474 128.727 -5,1 25,6 23,5
Of which: Manufacturing of food and
12.423 13.369 n.a. 7,6 n.a. 3,1
beverages
Electricity, gas and water supply 14.240 13.342 15.542 -6,3 16,5 3,1
Construction 27.658 22.850 40.366 -17,4 76,7 5,2
Wholesale and retail and for households 18.896 78.230 104.824 314,0 34,0 18,0
Hotels and restaurants 6.515 13.371 21.573 105,2 61,3 3,1
Transport, storage and communication 19.744 26.580 34.930 34,6 31,4 6,1
Financial intermediation 5.651 8.405 10.333 48,7 22,9 1,9
Real estate and renting 6.952 26.628 21.038 283,0 -21,0 6,1
Public administration and defense,
14.333 42.478 45.915 196,4 8,1 9,8
compulsory social Security
Education 28.689 35.169 39.914 22,6 13,5 8,1
Health and social work 29.508 32.122 36.283 8,9 13,0 7,4
Other activities of communal, cultural,
9.031 17.074 26.369 89,1 54,4 3,9
general and personal services
Private households n.a. n.a. 1.766 - n.a. n.a.
Exterritorial organisations and bodies n.a. n.a. 592 - n.a. n.a.
Total 418.192 435.524 659.556 4,1 51,4 100,0
Note: From 2004, the bi-annual publication of Employees and Net Wages became an annual publication. In addition,
employees of the Ministry of Defence and Ministry of Internal Affairs were added. Hence, data between 2000 and 2010
are not fully comparable.
Source: State Statistical Office, “Employees and Net Wages 2010” and “Labour Force Survey, 2010-Q4”.
9
Data from administrative sources are from an annual enterprise survey called Employees and NetWages, and are stock data
in October, each year. In 2010, for instance, the survey was conducted on 7,856 business units with a response rate of 75 per
cent. Data are afterwards weighted.
19The structure of employment in 2010 shows that employment in both Manufacturing of Food and
Beverages and in Hotels and Restaurants each accounted for 3.1 per cent of total employment. Between
2000 and 2010, total employment increased by only 4.1 per cent, whereas employment in Manufacturing of
Food and Beverages increased by 7.6 per cent, and that in Hotels and Restaurants more than doubled.
The average gross wage at the end of 2010 was 31.435 MKD (677 US$), whereas the average net
wage was 21.454 MKD (462 US$). The spike in wage growth in January 2009 (see Figure 8) was due to the
implementation of the so-called ‘gross wage reform’ that, inter alia, incorporated previously non-taxed travel
and food allowances into the wage. Given that the reform reduced the tax wedge (through lower social
contributions rates), part of the “saved” taxes were used to increase the net wage. Hence, the growth of the
net wage outpaced the gross wage growth.
Figure 8: Gross and Net Wage Developments, January 2006-May 2011
Source: State Statistical Office, various years.
The effect of high unemployment on workers’ incentives to acquire or upgrade their skills is ambiguous.
While greater competition between workers for scarce jobs may motivate workers to acquire greater (and
better) skills, the overall dissatisfaction and discouragement from the low probability of finding a job might
dampen the motivation for education. Still, some studies show that education pays off in the former Yugoslav
Republic of Macedonia, that is to say workers with higher education are more likely to find a job and to
receive a wage premium (Mojsoska-Blazevski, 2005).
In recent years, an increase in subsidies to attend public higher education institutions and a reduction
in costs for studying has led to increasing enrolments and graduation from tertiary education (see section 3).
In just 4 years, from 2005/06 to 2008/09, the number of students that graduated per year rose by 74 per cent.
Moreover the number of students that achieved Masters’ degrees increased by 109 per cent, and PhD’s by 40
per cent. In the academic year 2009/10, there were slightly less than 60,000 tertiary students in all higher
education institutions. This represents an increase of 22 per cent over numbers in 2005/06 (56 per cent
compared to 2000/01). Despite this trend, the share of 30-34 years-olds with completed tertiary education
is well below the EU-27 average (see section 3). In addition, the unemployment rate of tertiary educated
workers increased between 2005 and 2010, from 20.4 per cent to 21.8 per cent, in lieu of declining overall
unemployment, which indicates the economy’s inability to generate skilled jobs.
202.4.Trade Environment and Institutions
The former Yugoslav Republic of Macedonia has eased its import restrictions over the past decade.
Between 2004 and 2010, the simple average MFN tariff declined from 9.2 to 6.7%. However, most trade
takes place with preferential trading partners, which leads to a much lower average tariff rate of 3.6% once
preferences are taken into account.10 At the same time, the country’s access to overseas markets improved
with the trade weighted average tariff that exporters faced declining from 5.0% to 0.9% between the periods
2000/04 and 2009/10.11
The country has so far signed two preferential regional trade agreements: i) the Stabilisation and Associ-
ation Agreement (SAA) with the EU in 2001 (entry into force in 2004), establishing political and economic con-
ditionality for the development of bilateral relations with Western Balkan countries, and ii) the CEFTA-2006
agreement with the SEE countries.12The SAA improved the existing autonomous trade preferences for the
Western Balkan countries, and provided autonomous trade liberalisation for 95% of all their exports to the
EU. Hence the exports of the former Yugoslav Republic of Macedonia to the EU are without quantitative
restrictions or measures having equivalent effect and are exempt from customs duties and charges having
equivalent effect. The exemption from these general conditions applies to a limited number of products such
as baby beef, wine and fishery products. On the other hand, the country accepted a complete abolition of
quantitative restrictions and gradual reduction of its custom duties over a (maximum) period of 10 years, for
industrial products, textile, steel, agriculture and processed agricultural products from the EU.
The CEFTA-2006 is a comprehensive free trade agreement (FTA) between SEE countries signed in 2001
and implemented in April 2004. It provides fully liberalised trade in manufactured goods and largely free
trade in agricultural goods. The Agreement augmented some 32 earlier bilateral FTAs between SEE coun-
tries. The effect of the CEFTA in terms of exports of the former Yugoslav Republic of Macedonia to other
CEFTA members is ambiguous. Though in the years after 2007, the country’s exports to the other CEFTA-2006
countries increased more than overall trade, this might be an effect of the recession in the EU economies.
Indeed, Mojsoska-Blazevski and Petreski (2011) concluded that CEFTA-2006 did not lead to significant gains
in intra-regional trade which could be attributed to increased significance of non-tariff barriers. Similarly,
Handziskiet al. (2010) argue that the use of technical, sanitary and phytosanitary measures for constraining
trade increased in lieu of eliminated tariffs and quotas. While there are arguments for promoting regional
trade, some authors (for example, Tantisantiwong, 2010) argue that intra-regional trade integration does not
reduce export and income volatility. As a consequence, countries should consider targeting export diversifi-
cation globally rather than greater regional integration, in order to ease external vulnerability. However, as
we argued in section 2.2, exports suffer from a relatively high geographical concentration of exports.
The remaining tariff structure varies substantially across sectors. The highest levels of protection are
found for Footwear, Headgear, and a number of similar articles (MFN13 tariff 22.8%) as well as for Prepared
Food, Beverages, and Tobacco (MFN tariff 21.3%). A number of other industries related to food are also highly
protected, including Vegetable Products (16.0%) and Live Animals and Animal Products (11.7%). These food
related industries are also the only parts of the economy that still enjoy substantial levels of protection
against imports from the EU under the phased implementation of the SAA.
10
TRAINS database
11
World Bank, Trade at a Glance for Macedonia
12
Members of CEFTA-2006 are Albania, Kosovo, the former Yugoslav Republic of Macedonia, Montenegro, Moldova, Croatia,
Serbia and Bosnia and Herzegovina. Bulgaria and Romania, that were signatory parties to the CEFTA agreement, left when
they joined the EU in 2007, 1 January.
13
The Most Favoured Nation (MFN) tariff is the tariff rate WTO members such as FYR Macedonia apply to imports from all WTO
members except for those with which they have preferential trade agreements.
21Table 4: Tariff structure (2011)
Product description MFN CEFTA EU
Footwear, headgear, umbrellas, sun umbrellas, walking-sticks, seat-
sticks, whips, riding-crops and parts thereof; prepared feathers and
articles made therewith; artificial flowers; articles of human hair 22.81% 0.00% 0.00%
Prepared foodstuffs; beverages, spirits and vinegar; tobacco and
manufactured tobacco substitutes 21.35% 2.70% 14.54%
Arms and ammunition; parts and accessories thereof 16.35% 0.00% 0.00%
Vegetable products 16.01% 2.09% 12.76%
Textiles and textile articles 13.59% 0.00% 0.00%
Raw hides and skins, leather, furskins and articles thereof; saddlery
and harness; travel goods, handbags and similar containers; articles
of animal gut (other than silkworm gut) 13.50% 0.00% 0.00%
Articles of stone, plaster, cement, asbestos, mica or similar
materials; ceramic products; glass and glassware 11.89% 0.00% 0.00%
Live animals; animal products 11.72% 2.41% 6.57%
Natural or cultured pearls, precious or semi-precious stones,
precious metals, metals clad with precious metal, and articles
thereof; imitation jewellery; coin 11.43% 0.00% 0.00%
Miscellaneous manufactured articles 7.19% 0.00% 0.00%
Works of art, collectors' pieces and antiques 7.00% 0.00% 0.00%
Mineral products 6.33% 0.00% 0.00%
Vehicles, aircraft, vessels and associated transport equipment 5.78% 0.00% 0.00%
Animal or vegetable fats and oils and their cleavage products,
prepared edible fats; animal or vegetable waxes 4.24% 0.69% 3.27%
Plastics and articles thereof; rubber and articles thereof 4.09% 0.00% 0.00%
Machinery and mechanical appliances; electrical equipment; parts
thereof; sound recorders and reproducers, television image and
sound recorders and reproducers, and parts and accessories of such
articles 3.29% 0.00% 0.00%
Base metals and articles of base metal 3.21% 0.00% 0.00%
Products of the chemical or allied industries 2.55% 0.00% 0.00%
Wood and articles of wood; wood charcoal; cork and articles of cork;
manufactures of straw, of esparto or of other plaiting materials;
basketware and wickerwork 2.02% 0.00% 0.00%
Pulp of wood or of other fibrous cellulosic material; recovered
(waste and scrap) paper or paperboard; paper and paperboard and
articles thereof 1.92% 0.00% 0.00%
Optical, photographic, cinematographic, measuring, checking,
precision, medical or surgical instruments and apparatus; clocks and
watches; musical instruments; parts and accessories thereof 1.52% 0.00% 0.00%
Source: ITC Market Access Map.
22The institution responsible for international trade, including exports, and for the design and
implementation of policies for enhancing competitiveness is the Ministry of Economy, with some coordinating
activities performed by the Deputy Prime-Minister for Economic Affairs. Recently, the Agency for Foreign
Investments (known as Invest Macedonia) that was renamed to Agency for Foreign Investments and Export
Promotion (Official Gazette No. 57/2010) began to develop its capacity as a focal point for export promotion,
in addition to its role in attracting and assisting foreign investors.
The system of international trade in the country was improved in 2009 when a one-stop-shop system
was launched for registering trade flows electronically. The system is designed to provide online licenses
for exports, imports and goods transit upon requests from companies, thus simplifying procedures and
costs. Since the launch of the system, 78.5% of all applications (56,781 out of 72,354) have been processed
electronically (www.exim.gov.mk). However, international comparisons presented in section 2.5 show that
exporting and importing in the former Yugoslav Republic of Macedonia remains relatively expensive.
2.5.Enabling Legal and Regulatory Environment
The enabling legal and regulatory environment, security of property rights, competition and access to
finance and political stability are very important factors for starting or expanding a business, including for
increasing diversification of the production in an economy (Klapper et al., 2008; ILO, 2010).
The former Yugoslav Republic of Macedonia has improved its regulatory environment for businesses
in recent times, as assessed by the World Bank’s Doing Business Report. The reforms implemented in the
country from 2006 onwards saw the country twice recognised among the top 10 business reformers; (ranked
4th place for 2006/07 reforms, and 3rd place in the ranking for the period 2008/09). During the period of
the recession, the government proceeded with reforms but at a slower pace. This saw the country’s ranking
downgraded from 36th place (out of 183 economies) in 2009 to 38th place in 2010.
The country had a very good rating in 2010 in start-up of a business (being ranked 5th in the world), and
in paying taxes. On the other hand, its ranking is poor for construction permit processing, being ranked at
136th place, because of the high cost of obtaining a construction permit. In terms of closing a business, the
ranking is 116th place, for the low recovery rate and high cost. This poor performance in closing a business
means that there are a large number of inactive enterprises in the country. The 5-year reform change score
of Doing Business 2011 ranks the former Yugoslav Republic of Macedonia at 11th place.14
Positive initiatives which have meant a reduction in both the cost and time it takes to start a business,
have led to an increase in the number of firms entering the market. The entry density increased from 5.66
in 2006 to 6.80 in 2008, though it drifted back to the 2006-level during the 2009-recession (http://econ.
worldbank.org/WBSITE).15 The country is the leader in the region in the business entry indicator.
In the specific indicator Trading Across Borders of the Doing Business Report, the former Yugoslav
Republic of Macedonia was ranked at 66th position in 2010.
Table 5 shows comparative data between the former Yugoslav Republic of Macedonia and certain peer
countries on the sub-indicators of trading. The former Yugoslav Republic of Macedonia is a relatively good
performer, except for the cost to export and import, especially if the cost is adjusted to take account of living
standards in the countries. The best performer among neighbouring countries and EU-12 is Montenegro,
ranked at 34th place.
14
The 5-year change score measures the level of change of the regulatory environment for local entrepreneurs for all Doing
Business indicators for a five year period, between Doing Business 2006 and 2011. The change score ranged between -0.1 and
0.54, whereas Macedonia had a score of above 0.2. The best ranked are Georgia, Ruanda and Belarus.
15
The number of newly registered limited liability companies per 1,000 working-age people (those ages 15-64).
23You can also read