2ND GLOBAL CRYPTOASSET BENCHMARKING STUDY - Michel Rauchs, Apolline Blandin, Kristina Klein, Dr. Gina Pieters, Martino Recanatini, Bryan Zhang ...
←
→
Page content transcription
If your browser does not render page correctly, please read the page content below
2ND GLOBAL CRYPTOASSET
BENCHMARKING STUDY
Michel Rauchs, Apolline Blandin, Kristina Klein,
Dr. Gina Pieters, Martino Recanatini, Bryan Zhang
December 2018
The Cambridge Centre for Alternative Finance (CCAF) is an international and interdisciplinary research centre based at the
University of Cambridge Judge Business School. It is dedicated to the study of innovative instruments, channels, and systems
emerging outside of traditional finance. This includes, among others, crowdfunding, marketplace lending, alternative credit
and investment analytics, alternative payment systems, cryptoassets, distributed ledger technology (e.g. blockchain) as well as
related regulations and regulatory innovations (e.g. sandboxes and RegTech).
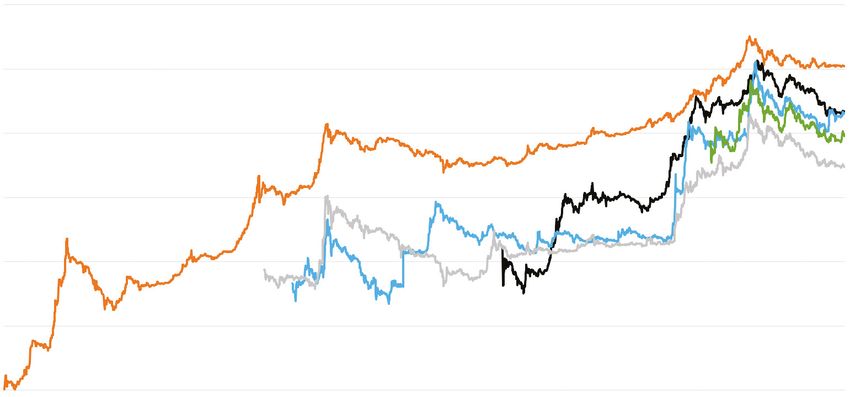
TABLE OF CONTENTS
FOREWORD.......................................................................................................................................5
RESEARCH TEAM.............................................................................................................................6
ACKNOWLEDGMENTS.................................................................................................................7
EXECUTIVE SUMMARY ............................................................................................................. 10
METHODOLOGY........................................................................................................................... 14
SETTING THE SCENE................................................................................................................... 17
Focus on the Data Layer................................................................................................................................................................17
The Year in Review...........................................................................................................................................................................17
SECTION 1: THE CRYPTOASSET INDUSTRY.................................................................... 19
1.1 Segments......................................................................................................................................................................................19
Industry Structure............................................................................................................................................................................... 19
Mining Segment................................................................................................................................................................................... 20
Storage Segment.................................................................................................................................................................................. 21
Exchange Segment.............................................................................................................................................................................. 22
Payments Segment............................................................................................................................................................................. 24
Horizontal Expansion: The Growth of Multi-Segment Firms ....................................................................................... 25
1.2 Industry Growth........................................................................................................................................................................26
1.3 Geography...................................................................................................................................................................................28
A Global Industry................................................................................................................................................................................. 28
Legal Headquarters and Operations.......................................................................................................................................... 28
SECTION 2: GLOBAL USAGE.................................................................................................... 30
2.1 Towards a Multi-Coin Universe...........................................................................................................................................30
2.2 Who Is Using Cryptoassets?.................................................................................................................................................31
Total Users.............................................................................................................................................................................................. 32
User Types............................................................................................................................................................................................... 34
User Activity ......................................................................................................................................................................................... 35
User Location........................................................................................................................................................................................ 35
2.3 Cryptoasset Usage Characteristics...................................................................................................................................37
On-chain Payments............................................................................................................................................................................ 37
Off-chain Payments............................................................................................................................................................................ 39
Decentralised Applications and Timestamping.................................................................................................................... 40
Speculation and Investment........................................................................................................................................................... 40
SECTION 3: GATEWAYS AND ECONOMIC CONNECTIONS..................................... 42
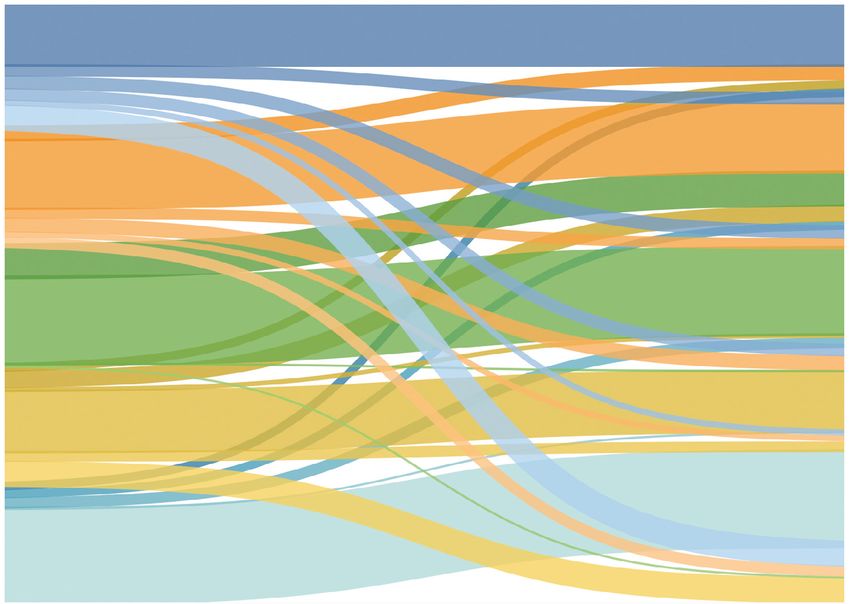
Connecting the Ecosystems........................................................................................................................................................... 42
On-Ramps and Off-Ramps.............................................................................................................................................................. 43
Internal Cryptoasset Ecosystem Flows.................................................................................................................................... 45
Managing Volatility ............................................................................................................................................................................ 47
SECTION 4: STORAGE AND CUSTODY SEGMENT ....................................................... 49
         Cryptoasset Custody......................................................................................................................................................................... 49
         Source Code........................................................................................................................................................................................... 51
         Key Storage Can Take Different Forms ................................................................................................................................... 52
         Multi-Signature.................................................................................................................................................................................... 53

SECTION 5: REGULATIONS AND COMPLIANCE............................................................ 54
5.1 The Impact of Regulations.....................................................................................................................................................54
     User Impact of Regulations............................................................................................................................................................ 54
     Industry Reactions to Regulations.............................................................................................................................................. 55
     Cryptoasset Firms Collaborate Directly with Regulators............................................................................................... 56
5.2 KYC/AML Policies.....................................................................................................................................................................57
     Implementation.................................................................................................................................................................................... 57
     Criteria...................................................................................................................................................................................................... 58
     Account Suspensions and Closures............................................................................................................................................ 59
5.3 Compliance Team......................................................................................................................................................................60
5.4 Licensing.......................................................................................................................................................................................61

SECTION 6: IT SECURITY........................................................................................................... 63
         Stolen Funds Remain a Major Issue............................................................................................................................................ 63
         IT Security Team................................................................................................................................................................................... 64
         Security Audits...................................................................................................................................................................................... 65
         Internal Policies.................................................................................................................................................................................... 67

SECTION 7: MINING SEGMENT.............................................................................................. 68
7.1 The Power of Miners...............................................................................................................................................................68
     Cryptoasset Selection....................................................................................................................................................................... 68
     Influence on Decision-Making Process.................................................................................................................................... 70
     Concentration Concerns................................................................................................................................................................. 71
7.2 Hardware Manufacturing......................................................................................................................................................72
     Mining Equipment and Algorithms............................................................................................................................................. 73
     Distribution Channels....................................................................................................................................................................... 75
     How Concentrated Is Manufacturing?...................................................................................................................................... 75
7.3 Mining Facilities........................................................................................................................................................................77
    Meet the Hashers................................................................................................................................................................................ 77
    Facility Set-up Decision Factors................................................................................................................................................... 77
    Distribution of Mining Facilities................................................................................................................................................... 78
    How Much Energy Does Cryptoasset Mining Consume?............................................................................................... 81
    How Wasteful Is Cryptoasset Mining? ..................................................................................................................................... 83
    What Do Miners Think?.................................................................................................................................................................... 85
7.4 Pool Operators...........................................................................................................................................................................86
     Pool Operations.................................................................................................................................................................................... 86
     Pool Concentration............................................................................................................................................................................. 87

FUTURE OUTLOOK...................................................................................................................... 90
APPENDIX: SENTIMENT QUESTIONS................................................................................. 94

                                                                                                           4
FOREWORD

     It is my great pleasure to announce the release of the second Global Cryptoasset
     Benchmarking Study produced by the Cambridge Centre of Alternative Finance
     based at the University of Cambridge Judge Business School. It examines
     significant developments in the global cryptoasset ecosystem that have occurred
     since the publication of our initial benchmarking study of cryptocurrencies in April
     2017. The emphasis on ‘global’ in the title of this study is critically important given
     the increasingly fluid, borderless nature of the cryptoasset industry. It also reflects
     a core competence of our research centre, which is engaging in empirical research
     investigating global technology-enabled financial innovation emerging outside of
     the incumbent financial system. For our 2nd cryptoasset report the research team
     spent several months collecting data from more than 180 entities in 47 different
     countries, which represents a 25% increase in both the number of participants
     and countries represented in comparison to our 2017 benchmarking report.

     Our series of benchmarking studies analysing emerging forms of alternative
     finance provides a comparative global snapshot of rapidly developing ecosystems
     impacting the incumbent financial system. Our goal from the outset was that
     these periodic reports would become a valuable reference for a wide audience
     of actors in the financial system, including disruptive product and service
     innovators, incumbent financial services firms, investors, academics, regulators
     and policymakers, and the general public. Each of these constituents deserves
     to be heard in debates about financial innovation, and few finance innovations
     have been as controversial and attracted as much misinformed opinion as the
     developments associated with cryptoassets. Our aim is to inform these voices
     by providing empirically-based evidence of developments to provide common
     points of reference to build upon. Sometimes this challenges prevailing wisdom.
     For example, the analysis of excess renewable energy used by a share of mining
     facilities suggests that the negative environmental externalities – and associated
     costs – of the energy consumed by proof-of-work consensus systems could be
     lower than previous estimates. We continue to believe that good research should
     generate at least as many new questions as it answers, and we hope this report
     passes that test.

     Dr. Robert Wardrop
     Director
     Cambridge Centre for Alternative Finance

                                    5
RESEARCH TEAM

Michel Rauchs: Michel is the Lead in Cryptocurrency and Blockchain at the Cambridge Centre for
Alternative Finance. He co-authored the inaugural benchmarking studies on the cryptoasset and
enterprise blockchain industries, and was the Project Lead of the Distributed Ledger Technology Systems:
A Conceptual Framework report.
    m.rauchs@jbs.cam.ac.uk		                 @mrauchs

Apolline Blandin: Apolline is a Research Manager in Cryptocurrency and Blockchain at the Cambridge
Centre for Alternative Finance. Prior to joining CCAF, she graduated from Peking University and the
London School of Economics with a dual Master’s degree in International Affairs. Her research has
mainly focused on mobile finance and financial inclusion in China.
    a.blandin@jbs.cam.ac.uk		                @ApollineBlandin

Kristina Klein: Kristina is a Visiting Student at the Cambridge Centre for Alternative Finance. She is
pursuing a Master’s degree in Management and Technology at the Technical University of Munich (TUM)
and focuses on entrepreneurship and computer science.
    k.klein@jbs.cam.ac.uk		                  @kklein93

Dr. Gina Pieters: Gina is a Lecturer at the Department of Economics at the University of Chicago and a
Research Fellow at the Cambridge Centre for Alternative Finance. Her research examines the economic
implications and behaviour of cryptocurrencies across different currencies and monetary systems.
    gcpieters@uchicago.edu		                 @ProfPieters

Martino Recanatini: Martino is a Visiting Student at the Cambridge Centre for Alternative Finance. He
is pursuing a Master’s degree in Finance and Banking at the Politecnica delle Marche University in Italy.
His Master’s thesis assesses the potential impact of DLT systems on securities post-trading services.
    m.recanatini@jbs.cam.ac.uk		             @marecanatini

Bryan Zhang: Bryan is the Executive Director and a Co-Founder of the Cambridge Centre for
Alternative Finance. He has co-authored more than 20 reports on financial innovation and regulatory
innovation.
    b.zhang@jbs.cam.ac.uk		                  @BryanZhangZ

                                                     6
ACKNOWLEDGMENTS

We would like to thank Liu Feng and the ChainNews team for providing a Chinese version of the surveys,
Miguel Klaggues from the Asociación Bitcoin Chile for translating the surveys into Spanish, as well as
Kim Cheol Hwan and Seowon Park from the Korean Blockchain Industry Promotion Association (KBIPA)
for the Korean survey version. Nick Chong (Quoine) and Fiorella Velazquez (BitInka) provided helpful
comments and undertook significant efforts in helping distribute the surveys.

Special thanks go to Keith Bear (CCAF) and Kathryn Vagneur (CCAF) for providing invaluable feedback
in terms of survey design, data analysis, and report structure, Louise Smith for the beautiful design of the
report, as well as Derek Snow for his thorough review of an early draft. Our interns Hatim Hussain, Jaya
Lalwani, Jinjun Liu, Thomas Eisermann, Ouafaa Hmaddi, and Sabine Damborska deserve special thanks
for their tireless work and efforts in helping make this report happen. Finally, we would like to thank the
entire CCAF team – and Kate Belger in particular – for their continuous support and assistance.

We would also like to thank the following organisations for helping distribute the surveys to potential
respondents in their respective countries and regions:

Asociación Bitcoin Chile, Associação Brasileira de Criptoeconomia (ABCripto), Association of Cryptocurrency
Enterprises and Startups Singapore (ACCESS Singapore), Bitcoin Argentina, ChainNews, ChainTech, Colombia
Fintech, Estonian Cryptocurrency Association, Ghana Blockchain Society, Israeli Blockchain Association, the
Korean Blockchain Industry Promotion Association (KBIPA), the Bitcoin Foundation, and the Nordic Blockchain
Association.

                                                      7
This research study would not have been possible without the generous support and participation
from industry actors: we would like to express our gratitude to the following cryptoasset entities for
contributing to this research study by completing our surveys. Some survey respondents prefer not to
publicly disclose their participation.

 BELEM

                                                    8
9
EXECUTIVE SUMMARY

Since the publication of the first Global Cryptocurrency Benchmarking Study in April 2017, the
cryptoasset ecosystem has undergone significant changes: the aggregate market capitalisation of
cryptoassets skyrocketed from $30 billion to more than $800 billion at its peak in early January 2018,
until coming down again to hover at around $200 billion.

The surge in prices and subsequent fluctuations was accompanied by growing interest and attention
from the general public and media, driving in new retail investors, speculators, and institutional investors.
The industry was confronted with massive inflows of new users and funds, a situation not all actors had
adequately prepared for. Growing interest from the institutional side contributed to the emergence of
custom services tailored to meet the needs and requirements of this new type of demand, leading to a
deeper interweaving of the industry and the incumbent financial system.

Between May and July 2018, the research team collected survey data from over 180 start-ups,
established companies, and individuals from 47 different countries across all major regions. The objective
of the study is to provide new insights into the current state of the ecosystem and, in combination with
publicly available data sources, capture major trends of the rapid market development. The analysis
focuses in particular on the following four key industry segments: mining, exchange, storage, and
payments.

The analysis reveals six main findings:

      •   Millions of new users have entered the ecosystem, but most remain passive
          Total user accounts at service providers now exceed 139 million with at least 35 million
          identity-verified users, the latter growing nearly 4X in 2017 and doubling again in the first
          three quarters of 2018. Only 38% of all users can be considered active, although definitions
          and criteria of activity levels vary significantly across service providers.

      •   Firms are increasingly operating across segments
          The cross-segment expansion observed in 2017 has continued: 57% of cryptoasset service
          providers are now operating across at least two market segments to provide integrated
          services for their customers, compared to 31% in early 2017.

      •   Multi-coin support is rapidly expanding
          Multi-coin support has nearly doubled from 47% of all service providers in 2017 to 84% in
          2018; a trend primarily driven by the emergence of common standards on some cryptoasset
          platforms (e.g. ERC-20 on Ethereum) that has resulted in a rapid increase in the supply of
          tokens.

      •   The majority of identified mining facilities use some share of renewable energy sources as
          part of their energy mix
          The study estimates that as of mid-November 2018, the top-6 proof-of-work cryptoassets
          collectively consume between 52 and 111 TWh of electricity per year. The mid-point of the
          estimate (82 TWh) is the equivalent of the total energy consumed by the entire country of
          Belgium – but also constitutes less than 0.01% of the world’s global energy production per
          year. A notable share of the energy consumed by these facilities is supplied by renewable
          energy sources in regions with excess capacity.

      •   Mining is less concentrated than commonly perceived
          Cryptoasset mining appears to be less concentrated geographically, in hashpower ownership,
          and in manufacturer options than commonly depicted: the mining map exhibits that hashing

                                                      10
2nd Global Cryptoasset Benchmarking Study
facilities and pool operators are distributed globally, with growing operations in the USA and
Canada.
• Self-regulatory efforts reflect growing industry maturity
Industry actors are pro-actively adopting measures that appear to comply with existing
regulation despite not necessarily being explicitly subject to regulations. The increasing number
of self-regulatory initiatives, combined with the emergence of sophisticated and professional
services, reflect the growing maturity of the industry.
Other notable findings include the following (ordered by section):
The Cryptoasset Industry
• The industry has experienced substantial growth in terms of full-time equivalent (FTE)
employees: 2017 year-on-year growth rates reached 164%, driven primarily by the
exchange and storage segments.
• Firm size has also increased significantly: the average firm now employs a median number of
20 staff, up from five employees in 2016.
• While 21% of surveyed firms have their legal HQ in a different country than their
operational HQ, only 7% have their legal HQ in a different geographic region, suggesting
that while organisations may be willing to locate to nearby countries to exploit regulatory
arbitrage, many are not willing to move too far afield.
Global Usage
• Individuals constitute the largest share of the user base (primarily served by exchanges and
multi-segment firms); payment service providers and storage providers have the highest
share of business users among service providers (26% and 32%, respectively).
• Firms predominantly serve customers based in the region where they have their operational
HQ.
• Both on-chain and off-chain transaction volumes have significantly increased in 2017;
behaviours consistent with speculation and long-term investment still account for the vast
majority of cryptoasset usage.
• The share of high-value transactions (i.e. above $1,000) for cross-border payments
processed off-chain rose from 34% in 2016 to 46% in 2017, a trend that is mirrored by on-
chain transactions as well.
• While Bitcoin’s median on-chain transaction size has consistently grown since 2016, other
cryptoasset systems have declining median amounts per transaction.
Gateways and Economic Connections
• The cryptoasset ecosystem is becoming more connected to traditional finance due to the
emergence and growth of gateways bridging both systems, as well as growing regulatory
clarity. The relatively small size of the industry in the global financial market poses no
systemic risk at this time.
• Fiat-to-cryptoasset (and vice-versa) trades are allowed on some exchanges and payment
platforms, but not allowed on others. For fiat-supporting exchanges, these fiat-to-
cryptoasset trades make up the majority of trading volumes, demonstrating continuous
in- and outflows from the cryptoasset ecosystem to the incumbent financial system and the
real economy.
• Bank wires dominate supported methods for both deposits and withdrawals; the use of
physical cash is more popular in Asia-Pacific than in other world regions.
11Executive Summary
• Service providers support a greater number of deposit options than withdrawal options,
suggesting that entering the ecosystem is generally easier than exiting.
• 69% of surveyed payment service providers have existing relationships with established
traditional payment networks, but difficulties of entering and maintaining good banking
relationships remain a primary concern, particularly for exchanges.
Storage and Custody Segment
• Custody of cryptoassets is diverse: 62% of large entities retain control over customer funds
compared to only 30% of small firms. Similarly, firms operating across multiple segments
tend to take user funds into custody more often than companies specialised in one segment.
• Two-thirds of specialised custodial exchanges do not have a refund procedure in the case of
customer funds getting lost or stolen.
• The share of funds held in cold storage has slightly decreased over 2017 to enable quick on-
demand access, but is still above 80% of all funds.
Regulations and Compliance
• Cryptoasset service providers are fostering their compliance efforts, even when not
explicitly subject to regulatory oversight: 37% of cryptoasset-only service providers have an
in-house compliance team and more than half perform KYC/AML checks.
• While an average of 14% of KYC/AML checks result in service providers not opening new
accounts or closing existing accounts, some firms claim figures between 50% and 80% - well
above comparable traditional finance benchmarks.
• The majority of surveyed companies rely on traditional services for third-party support in
conducting KYC/AML checks rather than specialised blockchain analytics providers.
• Only 5% of surveyed cryptoasset-only service providers hold an operating license for their
jurisdiction, as opposed to 39% of fiat-supporting entities. However, 30% of cryptoasset-
only service providers are planning to apply for a license or register with local authorities,
which reflects the industry’s willingness to proactively engage with compliance.
• There are active efforts at industry self-regulation, with most of entities collaborating with
regulators and policymakers to address regulatory issues.
• Changes in the regulatory environment have a measurable impact on operations: 38% of
fiat-supporting service providers have closed a location as a result of regulatory actions.
However, overall changes in the regulatory environment appear to have a greater impact on
encouraging location openings rather than causing closures.
IT Security
• With more than $1.5 billion stolen from cryptoasset exchanges and storage providers alone
to date, IT security has become a crucial operational aspect: specialised storage providers
take the highest security precautions of all surveyed firms and dedicate the largest
headcount and budget share to IT security of all firms.
• Providing regular training programmes for staff has become a common industry standard
as a substantial number of breaches have been caused by employee wrongdoing and/or
negligence.
• We observe a lack of transparency on both external and internal security audits: more than
80% of firms do not publicly share information about security audits, indicating a general
unwillingness to divulge security-critical information.
122nd Global Cryptoasset Benchmarking Study
Mining Segment
• Miners’ concerns about the three main types of mining concentration (control over
hashpower, geographic distribution of hashpower, and the geographic distribution of
hardware manufacturing) have grown in 2017.
• China remains in the top-3 countries to host mining farms; but the USA and Canada have
witnessed a rapid growth of mining farm openings over the past year, often associated with
the availability of cheap hydroelectric power.
• Access to high-volume and low-cost electricity as well as stable political and friendly
regulatory environments are the major determining factors for hashers to choose an
operational location.
• Over half of identified mining facilities, weighted by megawatts of electricity consumed,
have some share of renewable energy as part of their total energy mix. An increasing
number of hashing facilities are moving to regions with abundant low-cost electricity
generated by hydroelectric power.
• Whilst many miners acknowledge the issue of environmental impact of PoW, most would
not advocate for switching to a new, less resource-intensive consensus algorithm.
• The total number and geographic distribution of mining pools greatly varies from one
cryptoasset to another. While a third of surveyed pools are fully controlled by a single
person, past events show that low switching costs keep a check on operator behaviour.
• A small share of pool members provides the majority of total pool hashpower: on average,
the top-10% of users contribute 68% of the pool’s hashrate (top-1% contributes one third of
pool hashpower).
• ASIC mining hardware manufacturing is dominated by a few producers; Ethash, SHA-256
and Equihash are the most supported mining algorithms.
Future Outlook
• The trend towards increased multi-coin support is likely to continue: all single-coin storage
providers plan to support more cryptoassets in the near future.
• Innovations in trust-minimised off-chain payment networks (“layer-2 solutions” such as
Bitcoin’s Lightning Network) are thought to have the largest impact on service providers’
business models and operations.
• Storage providers and multi-segment firms see stablecoins as a business-enhancing
opportunity, whereas non-fungible tokens (e.g. digital collectibles such as game items) are
generally thought to have a limited impact in the coming 12 months.
13Methodology
METHODOLOGY
The Cambridge Centre for Alternative Finance carried out two online surveys between May and July
2018 via secure web-based questionnaires. The Cryptoasset Service Providers Survey was directed at
organisations operating in one or more segments of the cryptoasset industry as defined by our taxonomy
(specifically exchange, storage and payments), whereas the Cryptoasset Mining Survey targeted both
organisations and individuals involved in mining activities.1
The research team used various channels to disseminate the surveys globally in order to gather a
representative sample of the industry geographic dispersion. Both surveys were available in English,
Chinese, Spanish, and Korean. Surveys were distributed directly via email invitations to industry
contacts, as well as indirectly by sharing public links on social networks (e.g. Twitter, LinkedIn) and
Internet forums (e.g. Reddit, Bitcointalk). The research team also partnered with several national
cryptoasset associations to advance survey dissemination locally. The collected data was encrypted
and safely stored, accessible only to the authors of this study. All individual company-specific data was
anonymised and analysed in aggregate by industry segment, organisation size, supported assets, custody
types, and region.
Data was collected from more than 180 entities globally across 47 countries
For cases in which currently active major companies did not contribute to our study, the dataset
was supplemented with additional desktop research and web scraping using commonly applied
methodologies. Furthermore, publicly available data from a variety of sources was used to complement
survey data.
In total, survey data was collected from more than 180 entities across 47 countries and five world
regions: 127 firms participated in the Cryptoasset Service Providers Survey and 57 entities (22
organisations and 35 individuals) completed the Cryptoasset Mining Survey.2 Follow-up phone calls or
emails were used to clarify survey responses if needed, with further quality assurance provided by
comparing results to available public data if feasible.
We estimate that our benchmarking study captures more than 75% of the global
economic activity in the four cryptoasset industry segments covered in this report
Figure 1 provides a breakdown of survey participants by geographic region and firm age for each
dataset. Both samples reflect the global nature of the industry and incorporate a mix of new entrants
and incumbent firms. It is worth noting that the Bitcoin white paper was posted online just 10 years ago,
with the first large Bitcoin businesses established only 8 years ago: any firm 5 years or older has been in
existence for nearly the entirety of the life of the cryptoasset industry.
1 Other segments of the industry (e.g. Initial Coin Offerings/ICOs) are not covered by this analysis. All data points presented in the
following pages will be based on survey data, unless explicitly stated otherwise.
2 This represents an increase of 36 firms relative to the 2017 benchmarking survey. While the survey sample represents less than
25% of all identified entities in the four segments, we estimate that the study captures 75% of economic activity in the industry.
142nd Global Cryptoasset Benchmarking Study
Figure 1: The organisations in this study sample represent both industry veterans and new entrants
from around the world
Service Provider Study Sample Mining Study Sample
9% 12%
24%
17%
40%
Geographic 21%
Distribution
6%
2%
43%
25%
Asia Pacific Europe Middle East and Africa North America South America
7% 7%
24% 13%
40% 27%
Firm Age
14%
22% 7%
21% 7%
13%
New entrants 1 year 2 years 3 years 4 years 5+ years
Note: individual miners have been removed from the firm age calculation in the mining sample.
European companies dominate the service provider study sample, while individuals and mining
organisations based in Asia-Pacific take 40% of the mining study sample. Relative to last year, the survey
received more responses from each region, with firms from South America as well as the Middle East
and Africa (MEA) representing a small but growing share of respondents in both mining and service
providers.3 Some respondents expressed their reluctance to participate in the study because of changes
in their immediate regulatory environment.
3 We only provide geographic breakdown of results if it does not compromise survey anonymity.
15Methodology
Classification Terminology:
• Large firms: entities with 40 or more full-time equivalent employees.4
• Cryptoasset-only firms: entities that exclusively handle cryptoassets.
• Fiat-supporting firms: entities that handle both cryptoassets and fiat currencies.
• Multi-segment firms: entities that operate in multiple industry segments.
• Custodians: entities that keep customer funds in custody.
• Non-custodians: entities that do not keep control of customer funds.
4 An exception has been made for mining organisations, where FTE size is a less important indicator of relative economic influence
and position within the segment. Large and small miners are differentiated based on considerations of their hashpower,
importance to the ecosystem, or reputational prominence.
162nd Global Cryptoasset Benchmarking Study
SETTING THE SCENE
Focus on the Data Layer
The recently published study Distributed Ledger Technology Systems: A Conceptual Framework laid the
foundation for a comprehensive framework and terminology for the cryptoasset, blockchain and
distributed ledger technology (DLT) fields. 5 It introduces a conceptual framework that divides a given
DLT system into a set of three layers: protocol, network, and data.
The primary focus of this study will be on the intermediaries (service providers and miners) that interact
with the data layer. 6 This includes cryptocurrencies that play an essential role in the incentive design of
their respective DLT system as well as tokens that grant their holder with the right to access specific
functionalities of applications runnings on an existing DLT system.
From Cryptocurrencies to Cryptoassets
The astute reader may have noticed that this year’s edition of the study uses the term
cryptoasset rather than cryptocurrency in the title. 2017 has seen a tremendous explosion
in the number of tokens that have been issued on top of existing platforms rather
than coming with their own, custom distributed ledger. This trend requires expanding
the vocabulary to move the discussion from cryptocurrencies to the broader term of
cryptoassets, which appears to have become the commonly-accepted umbrella term when
referring to the ensemble of (public) blockchain-based tokens, including cryptocurrencies.
The study will provide an empirical analysis of the four key cryptoasset industry segments (mining,
exchange, storage, and payments). The report will only sporadically touch on the underlying protocol and
network layers.
The Year in Review
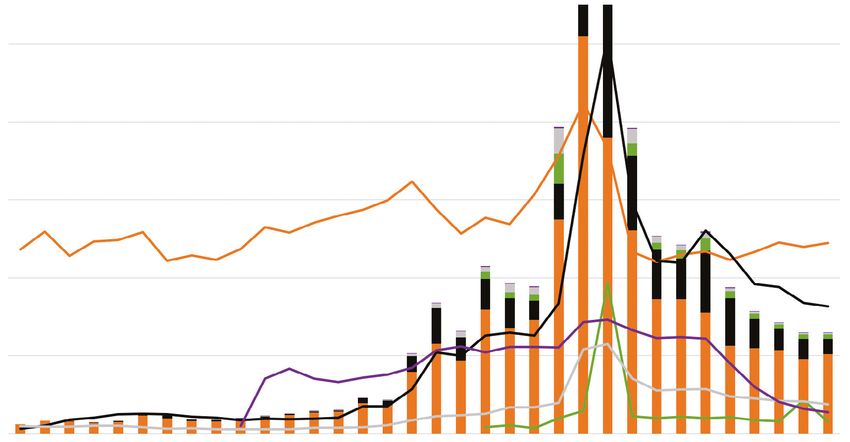
During 2017, the total cryptoasset market capitalisation climbed from $18 billion in January to a
staggering $600 billion in December, raising questions about the cryptoasset market as a whole being
a giant bubble.7 The desire to be an early investor in “the next Bitcoin” further fueled speculative
investment. However, prices across the entire cryptoasset ecosystem started to tumble in January 2018,
moving downwards uniformly across all cryptoassets. Despite a few rebounds in early 2018, the price
decline has continued throughout the year and resulted in the evaporation of more than $600 billion of
market capitalisation. 8
5 The study, authored by an interdisciplinary team of academics and industry experts, was published in September 2018: Rauchs,
M., Glidden, A., Gordon, B., Pieters, G., Recanatini, M., Rostand, F., Vagneur, K., and Zhang, B. (2018) Distributed Ledger Technology
Systems: A Conceptual Framework. Available at: https://www.jbs.cam.ac.uk/faculty-research/centres/alternative-finance/
publications/distributed-ledger-technology-systems/ [Accessed: 02 December 2018].
6 The data layer covers the nature and meaning of the final records produced by the DLT system. In the case of open, public, and
permissionless systems, these records primarily refer to the creation, transfer, and “destruction” of native cryptoassets.
7 The term “market bubble” generally refers to a situation where assets are traded at prices that substantially exceed their
fundamental value. In the case of cryptoassets, the definition of a fundamental value is both difficult and controversial to define
and determine.
8 Market capitalisation as a measure of network value is incomplete and relatively easy to manipulate. It thus bears the question
how much of the $600 billion in lost market capitalisation had been “real” gains in the first place.
17Setting The Scene
The rapid increase in Bitcoin prices spilled over to other cryptoassets and brought both sustained
media attention and new speculative investors (retail and institutional). The entry of traditional financial
services firms into the cryptoasset market and new offerings such as Bitcoin futures, specialised custody
solutions, and dedicated cryptoasset hedge funds further fuelled the expansion of the industry. However,
this also brought with it increased regulatory attention.
Tokens became more popular in the ecosystem as well, primarily driven by the wide adoption of the
ERC-20 standard on the Ethereum network and the resulting proliferation of Initial Coin Offerings
(ICOs). This led to a boom in token-based fundraising and a flurry of ICO activities globally. Blockchain
forks9 also became more common in 2017, further increasing the number of offerings in the cryptoasset
ecosystem by splitting existing coins into separate cryptoassets.10 The increase in interest – and
subsequent usage – brought into the foreground limitations of base layer scaling and led to the launch of
so-called “layer-2 solutions”, such as the eagerly-awaited Lightning Network on Bitcoin.11
These developments have left a mark on industry actors: according to data collected from survey
participants in both 2017 and 2018, their views on various topics have changed considerably.
Particularly operational risks are perceived to have significantly increased: exchange operators consider
all listed risk factors more urgent in 2018 than the year before, whereas miners also tend to be faced
with increasing challenges (Tables 6 and 9 in Appendix).
9 A hard fork constitutes a controversial change to the protocol rules of a DLT system that causes the network to split into two
separate systems, each having their own cryptoasset.
10 Bitcoin alone had at least eleven known hard forks in 2017: Bitcoin Cash, Bitcoin Gold, Bitcoin Diamond, Super Bitcoin, Bitcoin
Platinum, Lightning Bitcoin, Bitcoin God, Bitcoin Uranium, Bitcoin Cash Plus, Bitcoin Silver, and Bitcoin Atom. Most of these forks
have seen negligible activity and adoption.
11 During the height of the boom, the Bitcoin blockchain experienced significant delays in processing transactions, with average fees
rising to levels above $50. Similarly, the Ethereum blockchain was clogged for a few days because of a single gaming application
that suddenly became popular (CryptoKitties). Layer-2 solutions refer to a variety of techniques that aim to materially increase
transaction speed and throughput as well as substantially decrease transaction costs by moving payments off-chain in a trust-
minimised manner.
182nd Global Cryptoasset Benchmarking Study
SECTION 1:
THE CRYPTOASSET INDUSTRY
1.1 Segments
Industry Structure
In the ten years since the publication of the Bitcoin whitepaper, an entire industry has evolved around
cryptoasset systems to build and maintain basic infrastructure as well as to facilitate the use of the
platforms and their assets. While there are several smaller segments comprising a great variety of
additional services such as blockchain analytics, data, and ICO services, this study will limit its focus to
four key industry segments: mining, storage, exchange, and payments (Figure 2).
Figure 2: The cryptoasset industry can be broken down into four key segments
Key Cryptoasset Industry Segments
Share of service providers
Storage providing direct services
61%
Enabling the secure management
of wallets storing cryptoassets
Mining Payments
Receiving newly minted
Facilitating the use of
cryptoasset units as a reward
cryptoassets for all types
for processing transactions
of payments
on the network
49%
Providing a platform for the exchange
of one cryptoasset for another asset
72%
Exchange
Note: firms can operate in multiple segments.
19Section 1: The Cryptoasset Industry
The study further distinguishes between direct and outsourced services. Most entities are providing
direct services in the exchange segment (72%), followed by storage (61%) and payments (49%) segment.
In some cases, service providers partner with a third party to outsource specific activities – often those
that belong to a different segment. For instance, a storage provider may decide to partner with a third-
party exchange to offer in-wallet purchases and sales of cryptoassets. In such instance, the third party is
responsible for providing the exchange services – and consequently for abiding by applicable regulations
as well. Among respondents, 12% of exchanges, 17% of storage providers, and 23% of payment service
providers are contracting out to an external party. The remainder of the report focuses on entities only
providing direct services.
Mining Segment
The mining segment comprises agents performing specific operations for the processing of public
blockchain transactions (Figure 3). During this process, new units of a specific cryptoasset can be
created.
Figure 3: Miners operate across a sophisticated value chain of distinct activities
The Mining Value Chain
Pool Operators
Mining Hardware Hashing
Manufacturers Service combining
Process of running mining
computational resources
Entities designing and equipment to generate
from multiple hashers
building specialised hashes for finding a valid
and distributing
mining equipment proof-of-work
rewards
Cloud Mining Remote Hosting
Proprietary Mining Services Services
Miners operating Services renting out Services hosting
mining equipment hashpower generated and maintaining
on their own behalf by own equipment to customer-owned
customers mining equipment
The majority of mining organisations tend to specialise in a specific activity (46% of small miners and
56% of large miners). In contrast, a small number of large firms have pursued a continuous vertical
integration strategy that covers the entire value chain. Large firms tend to be older, whereas the majority
of individuals and half of small miners in the sample are new entrants.
Note: Section 7 covers the cryptoasset mining segment in greater detail.
202nd Global Cryptoasset Benchmarking Study
Storage Segment
Cryptoassets can be moved by signing transactions using private keys – these keys are stored using
wallet softwares. Initially, wallets were simple software programs handling key management, but they
have evolved over time to support a variety of technical and commercial services. Many solutions provide
an easy-to-use interface for the end-user that abstracts away the complexity of key management.
Figure 4: Mobile wallets remain the most supported format; web wallet support has significantly
increased
Share of storage providers
supporting the listed formats
2017 2018
Mobile Mobile wallets are smartphone applications that store
Wallets cryptoassets on mobile devices. 65% 62%
Web Web wallets are online applications that can be accessed
Wallets from any connected device via a browser. 38% 53%
Desktop Desktop wallets are key management software
Wallets programmes that run locally on a computer. 40% 42%
Tablet Tablet wallets are applications that enable users to store
Wallets cryptoassets on tablets. 24% 31%
Vault Vault services provide sophisticated key management and
Services custody solutions combining multiple layers of security. 31%
Hardware Hardware wallets are small devices that securely store
Wallets private keys without exposing them to connected machines. 23% 24%
Figure 4 shows the evolution of wallet options between 2017 and the second quarter of 2018. Mobile
and web wallets are the most widely offered storage formats, though cold-storage vault services have
gained in popularity in late 2017 with the influx of institutional investors, such as hedge funds. No
storage format has seen a decrease in support in 2018, indicating that the various forms of storage
options are not yet cannibalising each other.
Large storage providers support an average of three of the above types, compared to an average of two
types supported by small wallet providers. Storage-only service providers are more likely to specialise in
a particular activity, as opposed to multi-segment entities that often support multiple wallet formats.
Note: more detailed information on cryptoasset storage and custody is available in Section 4.
21Section 1: The Cryptoasset Industry
Exchange Segment
Exchanges serve as on-off ramps for users to buy and sell cryptoassets - either in exchange for fiat
currency (“fiat-supporting”), another cryptoasset (“cryptoasset-only”), or other assets such as gold.
There are a variety of activities in the exchange segment that facilitate trade in different ways.
Figure 5: Brokerage services, order-book exchanges, and over-the-counter (OTC) trading desks are
the three major activities performed in the exchange segment.
Share of exchanges engaged
in the listed activities
2017 2018
Brokerage Brokerage services let users conveniently acquire
Services and/or sell cryptoassets at a given price. 57% 49%
Order-Book Order-book exchanges are platforms that use a trading
Exchanges engine to match buy and sell orders from users. 57% 48%
Over-the-counter (OTC) desks enable users to engage
OTC
Desks
in bilateral trades outside of formal trading venues in 18% 45%
order to avoid moving the market too much.
Advanced Advanced trading services allow users to buy portfolio
Trading bundles and get access to more sophisticated tools such 41% 31%
Services as trading on margin.
“Decentralised” exchanges facilitate the trading of
“Decentralised”
cryptoassets without a central point of control. However, the
Exchanges
term is often loosely used to refer to different concepts.
4% 7%
Physical ATMs let users buy (and generally sell)
ATMs No ATM service providers were surveyed
cryptoassets using physical cash.
Figure 5 shows that brokerage services, order-book exchanges, and OTC desks are offered by almost
half of all exchanges, with OTC desks greatly increasing in popularity since 2017. Exchanges exclusively
engages in a single activity are primarily providing order-book exchange services, brokerage services, or
OTC trading desks.
“Decentralised” exchanges continue to be a small, but growing, share of exchanges. While 7% of
respondents claimed to be decentralised - or P2P - exchanges, definitions of a decentralised exchange
vary widely: it is hence possible that the growth reflects a change in definition, rather than a true
increase in decentralised exchanges. Their rise in popularity may explain why surveyed P2P exchanges
are a lot more concerned about competition than centralised exchanges.
222nd Global Cryptoasset Benchmarking Study
Decentralised Exchanges (DEX) Rise in Popularity
Most exchanges are centralised businesses with dedicated operators, and therefore more
easily subject to regulations unlike direct peer-to-peer, blockchain-based trades. More
recently a number of “decentralised exchanges” (or DEXes) have emerged, promising
to provide a decentralised and trust-minimised alternative to traditional third-party
exchanges.
However, at present nearly all existing exchanges labelling themselves as DEX rely
on some degree of centralised control over certain exchange processes (e.g. order
matching) which raises questions whether they can claim to be “decentralised”.12 Table 1
deconstructs exchange processes into three categories to classify the four exchange types.
Table 1: Decomposing exchange types - from custodial exchanges to DEXes
3. CLEARING &
EXCHANGE TYPE 1. CUSTODY OF FUNDS 2. ORDER MATCHING
SETTLEMENT
a. Custodial Exchange Exchange Exchange
b. Non-custodial Users Exchange Exchange
c. P2P Users/Exchange Users/Blockchain Exchange
d. DEX Users Blockchain Blockchain
Most self-labelled “DEXes” would be considered non-custodial exchanges (users retain full
control over their funds, but the exchange handles order matching and/or clearing and
settlement centrally) or P2P exchanges (primarily provide a flexible user matching platform
where users can decide whether to store funds at the exchange and perform the actual
trade outside of the platform).
In contrast, a true DEX uses a public blockchain for both order matching as well as clearing
and settlement while allowing users to maintain control of their funds for the entirety of
the trading process. While a DEX may pose a challenge for regulators, it is worth noting
that current implementations are cumbersome, expensive, and inefficient as they require
multiple on-chain transactions for a single exchange trade.
Of the surveyed exchanges, 41% are involved in only a single activity, while 59% are involved in two
activities or more. No respondent engages in more than four activities. Large exchanges tend to be
engaged in more activities than small exchanges (75% in two activities or more).
12 For a discussion on the multi-dimensional concept of “decentralisation”, please see p. 44 of the Distributed Ledger Technology
Systems: A Conceptual Framework report. Available at: https://www.jbs.cam.ac.uk/faculty-research/centres/alternative-finance/
publications/distributed-ledger-technology-systems/ [Accessed: 02 December 2018].
23You can also read


