Long-term observations of cloud condensation nuclei over the Amazon rain forest - Part 2: Variability and characteristics of biomass burning ...
←
→
Page content transcription
If your browser does not render page correctly, please read the page content below
Atmos. Chem. Phys., 18, 10289–10331, 2018
https://doi.org/10.5194/acp-18-10289-2018
© Author(s) 2018. This work is distributed under
the Creative Commons Attribution 4.0 License.

Long-term observations of cloud condensation nuclei over the
Amazon rain forest – Part 2: Variability and characteristics
of biomass burning, long-range transport, and pristine
rain forest aerosols
Mira L. Pöhlker1 , Florian Ditas1 , Jorge Saturno1,a , Thomas Klimach1 , Isabella Hrabě de Angelis1 ,
Alessandro C. Araùjo2 , Joel Brito3,b , Samara Carbone3,c , Yafang Cheng1 , Xuguang Chi1,d , Reiner Ditz1 ,
Sachin S. Gunthe4 , Bruna A. Holanda1 , Konrad Kandler5 , Jürgen Kesselmeier1 , Tobias Könemann1 ,
Ovid O. Krüger1 , Jošt V. Lavrič6 , Scot T. Martin7,8 , Eugene Mikhailov9 , Daniel Moran-Zuloaga1 , Luciana V. Rizzo10 ,
Diana Rose11,e , Hang Su1 , Ryan Thalman12,f , David Walter1 , Jian Wang12 , Stefan Wolff1 , Henrique M. J. Barbosa3 ,
Paulo Artaxo2 , Meinrat O. Andreae1,13 , Ulrich Pöschl1 , and Christopher Pöhlker1
1 Multiphase   Chemistry and Biogeochemistry Departments, Max Planck Institute for Chemistry, 55020 Mainz, Germany
2 Empresa    Brasileira de Pesquisa Agropecuária (EMBRAPA), Trav. Dr. Enéas Pinheiro, Belém, PA, 66095-100, Brazil
3 Institute of Physics, University of São Paulo, São Paulo 05508-900, Brazil
4 EWRE Division, Department of Civil Engineering, Indian Institute of Technology Madras, Chennai 600036, India
5 Institut für Angewandte Geowissenschaften, Technische Universität Darmstadt, Darmstadt, Germany
6 Department of Biogeochemical Systems, Max Planck Institute for Biogeochemistry, 07701 Jena, Germany
7 John A. Paulson School of Engineering and Applied Sciences, Harvard University, Cambridge, MA, USA
8 Department of Earth and Planetary Sciences, Harvard University, Cambridge, MA, USA
9 St. Petersburg State University, 7/9 Universitetskaya nab, St. Petersburg, 199034, Russia
10 Instituto de Ciências Ambientais, Químicas e Farmacêuticas, Universidade Federal de São Paulo

(UNIFESP), Diadema, SP, Brazil
11 Institut für Atmosphäre und Umwelt, Goethe Universität, 60438 Frankfurt, Germany
12 Biological, Environmental & Climate Sciences Department, Brookhaven National Laboratory,

Upton, NY 11973-5000, USA
13 Scripps Institution of Oceanography, University of California San Diego, La Jolla, CA 92037, USA
a now at: Physikalisch-Technische Bundesanstalt, Bundesallee 100, 38116 Braunschweig, Germany
b now at: Laboratoire de Météorologie Physique, Université Clermont Auvergne, Aubière, France
c now at: Institute of Agrarian Sciences, Federal University of Uberlândia, Uberlândia, Minas Gerais, Brazil
d now at: Institute for Climate and Global Change Research & School of Atmospheric Sciences,

Nanjing University, Nanjing, 210093, China
e now at: Hessian Agency for Nature Conservation, Environment and Geology, Rheingaustr. 186,

65203 Wiesbaden, Germany
f now at: Department of Chemistry, Snow College, Richfield, UT, USA

Correspondence: Mira L. Pöhlker (m.pohlker@mpic.de) and Christopher Pöhlker (c.pohlker@mpic.de)

Received: 10 September 2017 – Discussion started: 10 October 2017
Revised: 8 May 2018 – Accepted: 17 May 2018 – Published: 19 July 2018

Published by Copernicus Publications on behalf of the European Geosciences Union.
10290            M. L. Pöhlker et al.: Long-term observations of cloud condensation nuclei over the Amazon rain forest

Abstract. Size-resolved measurements of atmospheric                largely internal mixing for the PR aerosols (narrow κ dis-
aerosol and cloud condensation nuclei (CCN) concentrations         tribution) and more external mixing for the BB, LRT, and
and hygroscopicity were conducted over a full seasonal cy-         MPOL aerosols (broad κ distributions).
cle at the remote Amazon Tall Tower Observatory (ATTO,                The CCN spectra (CCN concentration plotted against wa-
March 2014–February 2015). In a preceding companion pa-            ter vapor supersaturation) obtained for the different case
per, we presented annually and seasonally averaged data and        studies indicate distinctly different regimes of cloud forma-
parametrizations (Part 1; Pöhlker et al., 2016a). In the present   tion and microphysics depending on aerosol properties and
study (Part 2), we analyze key features and implications of        meteorological conditions. The measurement results suggest
aerosol and CCN properties for the following characteristic        that CCN activation and droplet formation in convective
atmospheric conditions:                                            clouds are mostly aerosol-limited under PR and LRT con-
                                                                   ditions and updraft-limited under BB and MPOL conditions.
  – Empirically pristine rain forest (PR) conditions, where
                                                                   Normalized CCN efficiency spectra (CCN divided by aerosol
    no influence of pollution was detectable, as observed
                                                                   number concentration plotted against water vapor supersatu-
    during parts of the wet season from March to May. The
                                                                   ration) and corresponding parameterizations (Gaussian error
    PR episodes are characterized by a bimodal aerosol size
                                                                   function fits) provide a basis for further analysis and model
    distribution (strong Aitken mode with DAit ≈ 70 nm
                                                                   studies of aerosol–cloud interactions in the Amazon.
    and NAit ≈ 160 cm−3 , weak accumulation mode with
    Dacc ≈ 160 nm and Nacc ≈ 90 cm−3 ), a chemical com-
    position dominated by organic compounds, and rel-
    atively low particle hygroscopicity (κAit ≈ 0.12, κacc
                                                                   1   Introduction
    ≈ 0.18).
  – Long-range-transport (LRT) events, which frequently            Clouds are a key factor in the Earth’s atmosphere and climate
    bring Saharan dust, African biomass smoke, and sea             system (Bony et al., 2015). Thus, sound scientific knowledge
    spray aerosols into the Amazon Basin, mostly during            on the life cycle and highly dynamic properties of clouds is of
    February to April. The LRT episodes are character-             significant importance for our understanding of atmospheric
    ized by a dominant accumulation mode (DAit ≈ 80 nm,            cycling and climate change (Seinfeld et al., 2016). A num-
    NAit ≈ 120 cm−3 vs. Dacc ≈ 180 nm, Nacc ≈ 310 cm−3 ),          ber of recent overview studies summarize the various facets
    an increased abundance of dust and salt, and rela-             of aerosol–cloud–precipitation–climate interactions in a de-
    tively high hygroscopicity (κAit ≈ 0.18, κacc ≈ 0.35).         tailed and comprehensive way (e.g., Andreae and Rosenfeld,
    The coarse mode is also significantly enhanced during          2008; Tao et al., 2012; Rosenfeld et al., 2014).
    these events.                                                     The Amazon Basin and its unique rain forest ecosys-
                                                                   tem are fundamentally shaped by the intense and large-scale
  – Biomass burning (BB) conditions characteristic for             (re)circulation of water between biosphere and atmosphere.
    the Amazonian dry season from August to Novem-                 Accordingly, the life cycle of shallow and deep convective
    ber. The BB episodes show a very strong accu-                  clouds in the Amazon has been subject of numerous previ-
    mulation mode (DAit ≈ 70 nm, NAit ≈ 140 cm−3 vs.               ous studies (e.g., Andreae et al., 2004; Freud et al., 2008;
    Dacc ≈ 170 nm, Nacc ≈ 3400 cm−3 ), very high organic           Rosenfeld et al., 2016; Wendisch et al., 2016; Braga et al.,
    mass fractions (∼ 90 %), and correspondingly low hy-           2017). In particular, the extent of anthropogenic influence
    groscopicity (κAit ≈ 0.14, κacc ≈ 0.17).                       on the cloud life cycle through continuous land use change
                                                                   and combustion-related aerosol emissions has been actively
  – Mixed-pollution (MPOL) conditions with a super-
                                                                   debated (e.g., Roberts et al., 2003; Davidson et al., 2012;
    position of African and Amazonian aerosol emis-
                                                                   Goncalves et al., 2015). It is well established that the proper-
    sions during the dry season. During the MPOL
                                                                   ties and dynamics of clouds can be fundamentally altered by
    episode presented here as a case study, we ob-
                                                                   changing cloud condensation nuclei (CCN) regimes, which
    served African aerosols with a broad monomodal
                                                                   are a fraction of the total (tropospheric) aerosol population
    distribution (D ≈ 130 nm, NCN,10 ≈ 1300 cm−3 ), with
                                                                   (e.g., Rosenfeld et al., 2008; Reutter et al., 2009).
    high sulfate mass fractions (∼ 20 %) from vol-
                                                                      To explore essential biogeochemical processes, such as
    canic sources and correspondingly high hygroscopic-
                                                                   aerosol–cloud interactions, in the Amazon rain forest, the
    ity (κ< 100 nm ≈ 0.14, κ> 100 nm ≈ 0.22), which were pe-
                                                                   Amazon Tall Tower Observatory (ATTO) was established in
    riodically mixed with fresh smoke from nearby fires
                                                                   2010/11 (for details see Andreae et al., 2015). The central
    (D ≈ 110 nm, NCN,10 ≈ 2800 cm−3 ) with an organic-
                                                                   Amazon Basin is characterized by a pronounced seasonality
    dominated composition and sharply decreased hygro-
                                                                   in atmospheric composition in response to the north–south
    scopicity (κ< 150 nm ≈ 0.10, κ> 150 nm ≈ 0.20).
                                                                   oscillation of the Intertropical Convergence Zone (ITCZ).
   Insights into the aerosol mixing state are provided by par-     During the wet season, the ATTO site receives compara-
ticle hygroscopicity (κ) distribution plots, which indicate        tively clear air masses of marine origin from the northeast

Atmos. Chem. Phys., 18, 10289–10331, 2018                                          www.atmos-chem-phys.net/18/10289/2018/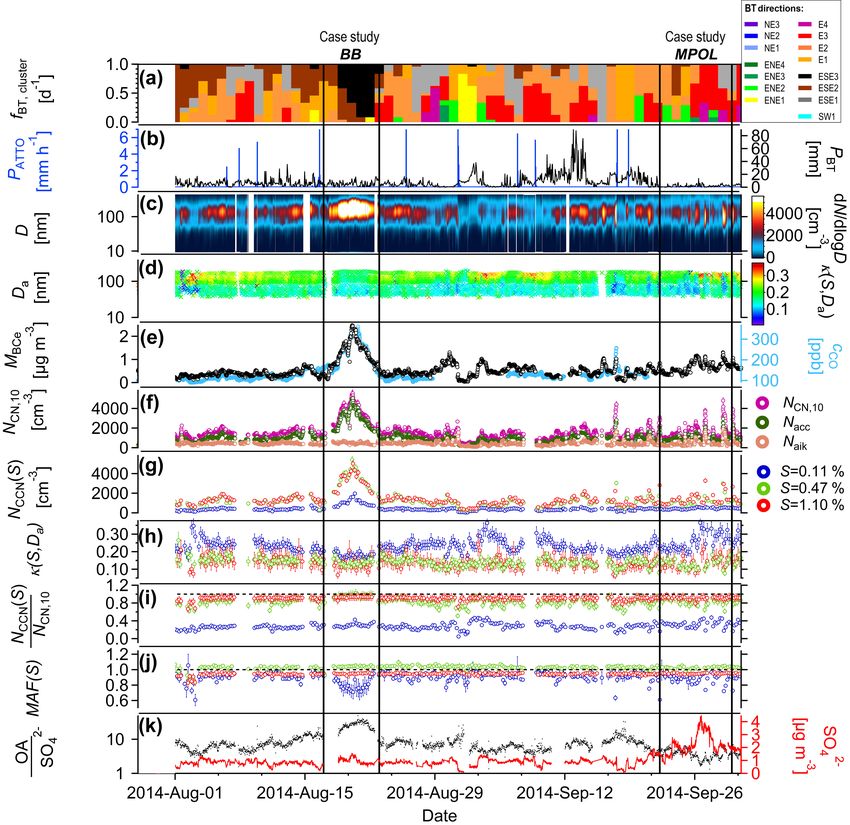
M. L. Pöhlker et al.: Long-term observations of cloud condensation nuclei over the Amazon rain forest                       10291

that travel over mostly untouched rain forest areas, whereas       1.1   Brief summary of the Part 1 companion paper
during the dry season strongly polluted air masses are ad-
vected from the southeast, originating from numerous fires         The Part 1 paper (Pöhlker et al., 2016) focuses on the multi-
in the Amazon’s arc of deforestation (for details see C. Pöh-      month variability in the Amazonian CCN population by
lker et al., 2018). Detailed information on characteristic dif-    presenting data from a full seasonal cycle. In particular, it
ferences in the atmospheric state and processes for the con-       presents annual averages of the key CCN parameters, a de-
trasting wet- vs. dry-season conditions in the ATTO region         tailed analysis of the specific seasonal as well as diurnal cy-
can be found in a number of recent studies (e.g., Nölscher et      cles, and a systematic analysis of different CCN parametriza-
al., 2016; Pöhlker et al., 2016; Moran-Zuloaga et al., 2017;       tion schemes to represent the Amazonian CCN cycling in
Saturno et al., 2017a; Yañez-Serrano et al., 2018).                modeling studies.
   In terms of microphysical processes in cloud forma-                The major findings of Part 1 can be summarized as fol-
tion and development, the number concentration of CCN,             lows: (i) the CCN population in the central Amazon is pre-
NCCN (S), and the peak water vapor supersaturation, S, at the      dominantly defined by the overall aerosol concentration as
cloud base play a key role. Here, S is predominantly deter-        well as the shape of the characteristic bimodal aerosol size
mined by the updraft velocity, wb , of the adiabatically rising    distribution. Accordingly, a key property that has to be taken
air parcel at the cloud base. The relevant peak S levels in the    into account for the interpretation of the CCN results is the
Amazon are assumed to range from ∼ 0.1 to ∼ 1.0 % (e.g.,           relative proportion of the Aitken and accumulation modes
Andreae, 2009; Reutter et al., 2009; Pöschl et al., 2010; Pöh-     (mode maxima at DAit ≈ 70 and DAcc ≈ 150 nm). (ii) The
lker et al., 2012; Farmer et al., 2015; Pöhlker et al., 2016).     hygroscopicity parameters, κ(S, Da ) with Da as the mid-
Moreover, a recent study suggests that substantially higher S      point activation diameter, of the two modes were found to
( 1 %) can also be reached in deep convective clouds under        be remarkably stable for most of the observation period
certain conditions (Fan et al., 2018). However, a systematic       (κAit = 0.14 ± 0.03 vs. κAcc = 0.22 ± 0.05), with only weak
and quantitative assessment of relevant peak S distributions       seasonal and no diurnal variability. Accordingly, we con-
in the Amazonian atmosphere is still lacking (see discussion       cluded in Part 1 that the shape of the aerosol size distribu-
in Sect. 3.9). Depending on NCCN (S) and S, a certain number       tion is the predominant factor, whereas κ(S, Da ) is only of
of cloud droplets at the cloud base, Ndb , are formed (Rosen-      secondary importance for the variability in the Amazonian
feld et al., 2016). In the Amazon Basin, Ndb ranges from a         CCN population, in agreement with previous studies (see ref-
few hundred droplets per cubic centimeter for clean condi-         erences in Pöhlker et al., 2016). (iii) Furthermore, Part 1 sum-
tions to 1000 and 2000 cm−3 for polluted conditions (Pöschl        marizes the CCN key parameters that allow for efficient mod-
et al., 2010; Rosenfeld et al., 2016; Braga et al., 2017). Upon    eling of the Amazonian CCN population. The prediction of
cloud development and rising air masses, the initial droplets      CCN concentrations is particularly reliable when time series
grow by condensation of water vapor, which can be observed         of total aerosol concentration and/or the aerosol size distri-
as changes in the cloud drop size distribution (DSD). Thus,        bution are available.
the DSD is a function of thermodynamic parameters (i.e.,              We emphasized CCN efficiency spectra, which can be re-
the updraft velocity, wb ), aerosol conditions (i.e., NCCN (S)),   garded as CCN signatures for a particular aerosol population,
and the cloud evolution (i.e., the cloud depth, H ). Important     by describing their behavior for the atmospherically relevant
bulk DSD properties are, in particular, the droplet number         S range. Here, a rather simple analytical expression (i.e.,
concentration, Nd , and the effective droplet radius, re . For     single- or double-error-function fits) suffices to represent the
re > 11 µm, the probability of droplet collision and coales-       essence of the CCN-relevant properties of an aerosol popu-
cence processes increases to significant levels, and warm rain     lation, which includes the characteristic shape of the aerosol
formation is initiated (Cecchini et al., 2017a).                   size distribution and the κ(S, Da ) size dependence. Further-
   A detailed analysis of the properties and variability of the    more, the CCN efficiency spectra are independent of the total
Amazonian CCN population is a prerequisite for the under-          aerosol number concentration (in contrast to CCN spectra)
standing of cloud cycling in this region. However, the CCN         and, thus, can be flexibly scaled to the concentration range
data from the basin is still sparse. Therefore, we conducted       of interest to obtain CCN concentrations at a certain S level.
a systematic characterization of the trends and properties of      Finally, and beyond their potential use in models as CCN
the central Amazonian CCN population at the ATTO site.             parametrization, the shape of the CCN efficiency spectra is
The first half of this study has been published recently as        very instructive for visualization of the specific behavior of
Part 1 (Pöhlker et al., 2016). The present paper represents        contrasting aerosol population in cloud formation. This as-
Part 2 and focuses on the variability and properties of peri-      pect will be one focal point of the present study.
ods and conditions that are characteristic for the Amazonian
atmosphere.                                                        1.2   Aims and scope of this study

                                                                   To complete the analysis started in Part 1, this paper analyzes
                                                                   the CCN variability at the original time resolution (∼ 4.5 h),

www.atmos-chem-phys.net/18/10289/2018/                                           Atmos. Chem. Phys., 18, 10289–10331, 2018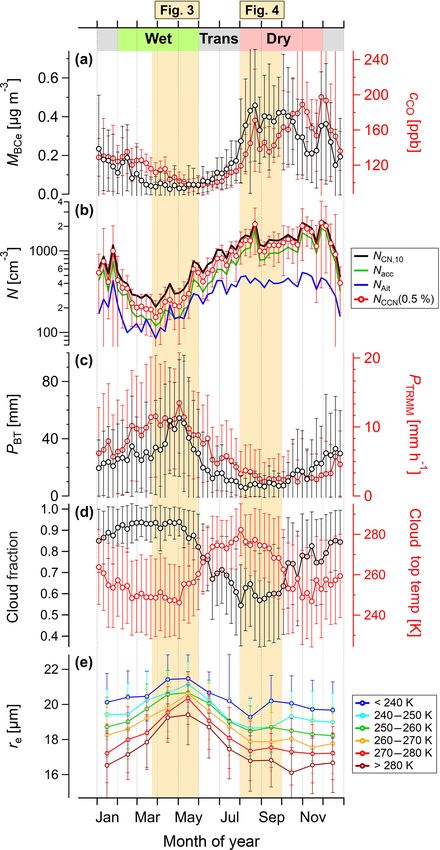
10292            M. L. Pöhlker et al.: Long-term observations of cloud condensation nuclei over the Amazon rain forest

which is sufficient to resolve its short-term variability in re-          Accordingly, the MPOL case study is an example of a
lation to air mass changes as well as aerosol emission and                complex aerosol mixture due to alternating African vs.
transformation processes. In the present work, we will zoom               local/region influences during the dry season.
into specific periods of the 1-year CCN data set in two steps:
                                                                   In summary, the overall purpose of this study is to link the
first, we discuss the aerosol and CCN variability for two con-
                                                                   measured CCN abundance and properties with the character-
trasting 2-month periods that characterize the pollution min-
                                                                   istic emissions and transformation processes that govern the
imum and maximum in relation to complementary trace gas
                                                                   Amazonian aerosol population. With the CCN parametriza-
and aerosol parameters. Second, we analyze the following
                                                                   tion strategies developed in Part 1, we provide a basis for ef-
four case studies, which represent characteristic events and
                                                                   fective CCN prediction under characteristic aerosol and CCN
conditions in the central Amazon region:
                                                                   conditions in the Amazon Basin.
  – During certain wet-season episodes, when no tracers of
    pollution aerosols are detectable anymore, the aerosol
    population can be regarded as empirically not distin-          2     Experimental section
    guishable from pristine, i.e., completely unpolluted rain
                                                                   2.1    Aerosol and trace gas measurements at the ATTO
    forest conditions. This empirically pristine state of the
                                                                          site
    rain forest (PR) aerosol prevails during 10 to 40 days
    per year (depending on PR definition; see Sect. 2.7).          The present study is mostly based on in situ measurements at
  – Long-range-transport (LRT) aerosol advection during            the remote ATTO site, which has been described in detail by
    the wet season brings Saharan dust, African biomass            Andreae et al. (2015). Further relevant information regarding
    burning smoke, and marine aerosol particles from the           the site, the measurement period, and the aerosol and trace
    transatlantic passage. The LRT case study represents           gas instrumentation can be found in the Part 1 paper by Pöh-
    conditions that prevail between 50 and 60 days per year        lker et al. (2016). The time frame of the present analysis,
    (see Moran-Zuloaga et al., 2017).                              including the four in-depth case studies, overlapped with the
                                                                   two intensive observation periods (IOPs) of the international
  – Biomass burning (BB) smoke from man-made forest                Green Ocean Amazon 2014/5 (GoAmazon2014/5) campaign
    fires in the various deforestation hot spots in the basin      (Martin et al., 2016a, b). Specific details on the measure-
    influences the atmospheric state at ATTO almost perma-         ments of equivalent black carbon (BCe ) mass concentrations,
    nently during the dry season and for extended episodes         MBCe , with the Multiangle Absorption Photometer (MAAP)
    during the transition periods (> 100 days per year) (Sat-      can be found in Saturno et al. (2017a, c). Specific details on
    urno et al., 2017a). The BB case study in this work ana-       the measurements of the mole fraction of carbon monoxide
    lyzes large deforestation fires in the southeastern basin,     (CO), cCO , with a G1302 analyzer (Picarro Inc. Santa Clara,
    whose smoke reached ATTO after a few days of at-               CA, USA) can be found in Winderlich et al. (2010).
    mospheric processing. Accordingly, the BB case study              Details on the Aerosol Chemical Speciation Monitor
    characterizes the typical conditions of aged smoke in-         (ACSM, Aerodyne Research Inc., Billerica, MA, USA) mea-
    fluencing the atmospheric state at ATTO.                       surements – which provide online information on the mass
  – Mixed pollution (MPOL) from African LRT and lo-                concentrations, Mspecies , of organics (OA), sulfate (SO2− 4 ),
    cal/regional fires represents a frequent aerosol scenario      nitrate (NO−                     +                   −
                                                                                3 ), ammonium (NH4 ), and chloride (Cl ) – can
    at ATTO (Saturno et al., 2017a). The advected African          be found in Ng et al. (2011). A detailed description of the
    aerosols mainly comprise biomass and fossil fuel com-          long-term operation of the ACSM at the ATTO site can be
    bustions emissions, although the exact composition of          found in Carbone et al. (2017). For the selected case study
    these dry-season LRT plumes is still poorly analyzed.          and seasonal time frames, we calculated the mean values of
    The MPOL case study focuses on a period when African           Mspecies as well as corresponding mass fractions, fspecies , ac-
    volcanogenic aerosols were advected to ATTO – an               cording to
    event that has been well documented in Saturno et                                          Mspecies
    al. (2017b). We selected this episode since the mi-            fspecies =                                         . (1)
                                                                                MOA + MSO4 + MNH4 + MNO3 + MCl + MBCe
    crophysical properties of the volcanogenic aerosol are
    characteristic enough to discriminate them from the            Furthermore, predicted hygroscopicity parameters, κp , were
    local/regional smoke emissions. Accordingly, the al-           calculated based on the ACSM and MAAP results according
    ternating pattern of LRT vs. local/regional pollution          to the following procedure adapted from Gunthe et al. (2009),
    can be clearly resolved for the MPOL period. How-              Rose et al. (2011), and Pöhlker et al. (2016):
    ever, note that volcanogenic plumes are comparatively          κp = fOA · 0.1 + finorg · 0.71 + fBCe · 0,                  (2)
    rare events, whereas African combustion emissions,
    which are much harder to discriminate from the lo-             with finorg including SO2−    −       +          −
                                                                                           4 , NO3 , NH4 , and Cl . Note that
    cal/regional emissions, are a more common scenario.            MNH4 ranged below its detection limit (i.e., 0.28 µg m−3 , for

Atmos. Chem. Phys., 18, 10289–10331, 2018                                           www.atmos-chem-phys.net/18/10289/2018/
M. L. Pöhlker et al.: Long-term observations of cloud condensation nuclei over the Amazon rain forest 10293
30 min averaging time) during the clean Amazon wet-season fit (mode = 2) is represented by the function
months, making the obtained results unreliable (the ques-
ln SS1 ln SS2
! !
tionable periods are marked in Table 3, which is discussed NCCN (S) a1 a2 a1 − a2
= + · erf + · erf , (4)
later in this study). For these periods with questionable re- NCN,10 2 2 w1 2 w2
sults, MNH4 was omitted in the calculation of the mass frac- with index 1 and 2 specifying the variables for both modes.
tions, which has to be kept in mind in the interpretation of To simplify the fitting procedure, a1 = 1 was assumed.
the results. MCl and MBCe were also below detection limits Note further that in Part 1 we tested different reference
for certain conditions. Accordingly, κp was calculated with- aerosol number concentrations, NCN,Dcut (e.g., NCN,10 and
out MNH4 , MCl- , and/or MBCe . The nominal size range of the NCN,50 ), for the CCN efficiency spectra parametrization. In
ACSM spans from 75 to 650 nm, and the measurements are this study, we use only one reference concentration for clar-
conducted size-integrated. Accordingly, the ACSM results ity – namely NCN,10 . The choice of NCN,10 can be explained
tend to be dominated by larger particles with relatively high by the fact that it is experimentally rather easily accessi-
masses, which makes the Mspecies results mostly represen- ble (e.g., via condensation particle counter, CPC, measure-
tative for the accumulation mode composition. Accordingly, ments), whereas reference concentrations such as NCN,50 re-
the calculated κp was compared to the hygroscopicity param- quire more elaborated experimental setups (e.g., Scanning
eter for the lowest measured S level, κ(0.11 %), correspond- Mobility Particle Sizer, SMPS, data).
ing to the largest measured critical diameter (Da ≈ 170 nm). The κ distributions were calculated according to the pro-
cedure reported in Su et al. (2010) for every individual CCN
2.2 CCN measurements and data analysis measurement cycle and subsequently averaged for time peri-
ods of interest. The corresponding NCN κ distributions were
A detailed description of the operation of the CCN counter obtained by multiplication of the average κ distributions with
(CCNC) and the subsequent data analysis can be found in the average NCN size distributions within the same time
the companion paper (Pöhlker et al., 2016), which is the ba- frame. The entire CCN analysis was conducted in IGOR Pro
sis for the present study. Briefly, size-resolved CCN mea- (Wavemetrics, Inc., Portland, OR, USA).
surements were conducted using a continuous-flow stream-
wise thermal-gradient CCN counter (model CCN-100, DMT, 2.3 Backward trajectories
Longmont, CO, USA) in combination with a differential
mobility analyzer (DMA, model M, Grimm Aerosol Tech- The backward-trajectory (BT) analysis and classification in
nik, Ainring, Germany) and a condensation particle counter this study has been adopted from C. Pöhlker et al. (2018),
(Grimm Aerosol Technik). The DMA-selected size range where an in-depth description of the procedure can be found.
spans from 20 to 245 nm. The analyzed supersaturation range Briefly, the BT analysis is based on the Hybrid Single Particle
spans from 0.11 to 1.10 %. A complete measurement cycle Lagrangian Integrated Trajectory Model (HYSPLIT, NOAA-
with scanning of all particle diameters and supersaturations ARL) with meteorological input data from the Global Data
took ∼ 4.5 h. For further CCN-relevant information, we refer Assimilation System (GDAS1) (Draxler and Hess, 1998).
the reader to Rose et al. (2008) and Krüger et al. (2014). Three-day BTs have been calculated every 1 h with a start-
The CCN efficiency spectra parameterization as intro- ing height of 1000 m above ground level (a.g.l.) at the ATTO
duced in Part 1 plays a key role in the present paper. Note site for the time period of 1 January 2008 until 30 June 2016.
that we slightly revised and improved the fitting procedure A sensitivity test confirmed that starting heights of the BTs at
from the Part 1 companion paper. The main change implies 200 and 1000 m a.g.l. gave similar results. Accordingly, the
that the fits are now forced through zero, which is physically chosen start height at 1000 m appears to be a good represen-
more plausible and makes the single-error-function (erf) fit tation of the origin of the boundary layer (BL) air masses at
parametrization more applicable for modeling studies. The ATTO. Subsequently, the resulting ensemble of 74 496 indi-
erf fit (mode = 1) is represented by the following function: vidual BTs was classified into 15 clusters with k-means clus-
ter analysis (CA). Figure S1 in the Supplement shows a map
ln SS1
! of the northeastern Amazon Basin with the ATTO site and
NCCN (S) a1 a1
= + · erf , (3) the mean track of the 15 BT clusters. It illustrates that the air
NCN,10 2 2 w1 masses arrive almost exclusively in a rather narrow easterly
wind sector (between 45 and 120◦ ). Within this sector, four
with a1 as a prefactor; S1 as the supersaturation, at which main directions of air mass advection can be identified: (i) a
half of the maximum activated fraction (MAF) of the aerosol northeasterly (NE) track including the clusters NE1, NE2,
particles acts as CCN (e.g., 50 % for a1 = 1); and w1 as the and NE3; (ii) an east-northeasterly (ENE) track including the
width of the erf fit. To simplify the fitting procedure, a1 = 1 clusters ENE1, ENE2, ENE3, and ENE4; (iii) an easterly (E)
was assumed. For a1 = 1 the erf converges against unity, cor- track including the clusters E1, E2, E3, and E4; and (iv) a
responding to an activation of all particles as CCN at high S, group of “inland” trajectories in east-southeasterly (ESE) di-
which is adequate in most cases. Analogously, the double-erf rections including clusters ESE1, ESE2, and ESE3 as well as
www.atmos-chem-phys.net/18/10289/2018/ Atmos. Chem. Phys., 18, 10289–10331, 201810294 M. L. Pöhlker et al.: Long-term observations of cloud condensation nuclei over the Amazon rain forest
one cluster towards the southwest (SW1). For a detailed char- (NAit ), and in the total particle population (NCN,10 ), 4–
acterization of the land cover, including potential trace gas, 6 years of ATTO site measurements were available. Addi-
aerosol, and CCN sources, within the BT-derived footprint tionally, MBCe data measured at the ZF2 site, located 40 km
region of the ATTO site, we refer the reader to C. Pöhlker et northwest of Manaus, were used to reflect the conditions
al. (2018). back to 2008 (e.g., Martin et al., 2010a). In terms of sources
and conditions, the ATTO and ZF2 sites are comparable (Sat-
2.4 Satellite data and analysis urno et al., 2017a; C. Pöhlker et al., 2018). Accordingly,
combined MBCe time series from ATTO and ZF2 spanning
The satellite data products used in this study were obtained from January 2008 to May 2017 were included here. The
from the NASA Giovanni web interface (http://giovanni.gsfc. cCO data include ATTO measurements from March 2012 to
nasa.gov/; last access: 26 May 2017), developed and main- April 2017. The Nacc , NAit , and NCN,10 data are based on
tained by the NASA Goddard Earth Sciences Data and Infor- SMPS measurements at ATTO from February 2014 to Jan-
mation Services Center (GES DISC) (Acker and Leptoukh, uary 2017.
2007). The following satellite products were used:
– Cloud top temperature data (AIRX3STD_v006 product) 2.6 Aerosol sampling and scanning electron
from the atmospheric infrared sounder (AIRS) instru- microscopy with X-ray spectroscopy
ments on board the satellites Terra and Aqua (data in-
cluded from 4 July 2002 to 30 June 2016). For the cor- Aerosol samples for electron microspectroscopy were col-
responding time series in this study, the Aqua and Terra lected by impaction. A homemade single-stage impactor
data were averaged per day for a representative region (flow rate = 1–1.5 L min−1 ; nominal cut-off: Dcut ≈ 500 nm)
(i.e., ROIATTO ; see below). was used for collection. The collection efficiency below Dcut
decreases steeply; however, a certain fraction of particles in
– Cloud cover data were obtained by the Moderate Res- this size range is still collected. Moreover, a fraction of very
olution Imaging Spectroradiometer (MODIS) on board small particles is additionally collected via diffusive depo-
the Terra and Aqua satellites (included data from 4 July sition and therefore available for the microscopic analysis.
2002 to 30 June 2016). The obtained Aqua and Terra Aerosol particles were deposited onto silicon nitride sub-
time series were averaged for the ROIATTO . Note that strates (Si3 N4 ; membrane width: 500 µm; membrane thick-
cloud cover strongly depends on the spatial resolution nesses: 100 or 150 nm; Silson Ltd., Northhampton, UK). Im-
of the instrument as outlined in King et al. (2013). mediately after sampling, samples were stored in airtight
– Cloud droplet effective radius, re , data were calculated containers at −20 ◦ C.
from MODIS products (included data from 4 July 2002 Without further treatment like sputter coating, particles
to 30 June 2016) for the ROIATTO . Since re varies with were analyzed in a high-resolution scanning electron micro-
vertical cloud development and total CCN abundance, scope (SEM; FEI Quanta 200F, FEI, Eindhoven, the Nether-
we filtered the re data by cloud top temperature (King lands). An acceleration voltage of 12.5 kV with a spot size of
et al., 2013). approximately 3 nm was used. X-ray emission was analyzed
using energy-dispersive X-ray analysis (EDX; Edax Gene-
– Precipitation rate data, PTRMM , are obtained from the sis, Edax Inc.). The system is able to record characteristic
Tropical Rainfall Measuring Mission (TRMM) within X-ray emissions for all elements with Z > 5. Obviously, in
the ROIATTO . The TRMM_3B42_Daily_v7 product was the present work Si could not be quantified due to the Si3 N4
used for the time period 1 January 1998 until 30 June substrate (Kandler et al., 2011).
2016.
The satellite data were used as time series of area-averaged 2.7 Definition of empirically pristine rain forest aerosol
data products within a region of interest around the ATTO conditions at ATTO
site (ROIATTO : 3.5◦ S–2.4◦ N, 59.5–54◦ W) as specified in
Fig. S1. The term pristine is bound to a pre-human reference state
with prevailing natural atmospheric conditions, in the ab-
2.5 Seasonal cycles of remote-sensing and in situ data sence of any anthropogenic influences. Andreae (2007)
pointed out that in the present-day atmosphere “there are no
To provide an overall picture of the seasonal cycle of selected places where we can expect to find truly pristine conditions”.
aerosol, meteorological, and cloud microphysical parame- This is particularly true with respect to long-lived trace gases,
ters representative for the ATTO region, various multi-year such as CO2 and CH4 , which have accumulated in the at-
data sets were analyzed and compared. Remote-sensing data mosphere due to man-made activities. However, the aerosol
products were used in the time frames outlined in Sect. 2.4. abundance and composition are also substantially perturbed
For MBCe , cCO , and the particle concentrations in the ac- by anthropogenic emissions. This also includes aerosols at
cumulation mode range (Nacc ), in the Aitken mode range remote locations, which are altered to varying degrees by a
Atmos. Chem. Phys., 18, 10289–10331, 2018 www.atmos-chem-phys.net/18/10289/2018/M. L. Pöhlker et al.: Long-term observations of cloud condensation nuclei over the Amazon rain forest 10295
globally pervasive background pollution. It has been contro- NCN in the upper troposphere (UT) reaching above
versially debated if and to what extent certain marine and 10 000 cm−3 ; Andreae et al., 2018). Accordingly, NCN
remote continental locations still approximate pristine atmo- is also not a good stand-alone PR filter. However, with
spheric conditions (e.g., Andreae, 2009; Martin et al., 2010b; respect to the “typical” Amazonian aerosol concentra-
Pöschl et al., 2010; Chi et al., 2013; Hamilton et al., 2014). tions in the boundary layer (i.e., a few hundred up to
Frequently, conditions with low anthropogenic influences are few thousand particles per cubic meter), the total par-
characterized as “clean” or “near pristine”, although these ticle concentrations provide at least a helpful reference
terms are rather differently and often vaguely defined. The level for the extent of pollution.
discussion is inherently difficult since truly pristine condi-
tions are not available anymore to quantify how close the – BC-based definition of PR, called PRBC : BC repre-
present-day atmosphere still gets to its original pre-human sents a unique indicator for combustion aerosol parti-
state. Accordingly, truly pristine conditions remain hypothet- cles, which in the Amazon Basin almost entirely orig-
ical, and any degree of a near-pristine state has to be defined inate from anthropogenic sources (i.e., fossil fuel and
indirectly with respect to the absence of man-made emis- biomass burning in South American and Africa). Ac-
sions. cordingly, we defined PRBC episodes by means of
In the Amazon Basin, aerosol conditions during most of the absence of detectable BCe . Petzold and Schön-
the wet season are comparatively clean with low – though linner (2004) determined the detection limit of the
detectable – concentrations of background pollution. Dur- MAAP “as the minimum resolvable absorbance” by
ing the multi-month wet-season period that can overall be considering “the variability of blank filter optical prop-
characterized as near pristine, certain episodes can be iden- erties”. The detection limit corresponds to the re-
tified where pollution concentrations drop even further and sulting mean absorbance of the blank filter +3×
below analytical detection limits. Under these conditions, the the standard deviation (SD) resulting in an absorp-
aerosol composition can be regarded as empirically undis- tion coefficient of 0.132 Mm−1 for 30 min averages.
tinguishable from a pristine state. The present study uses The MBCe was calculated by using mass absorption
these episodes to operationally define a pristine state of the cross sections (MACs) retrieved by fitting MAAP ab-
aerosol composition and properties in a tropical rain forest sorption coefficients at 637 nm and Single Particle
environment, which we call empirically pristine rain forest Soot Photometer (SP2) rBC mass measurements dur-
(PR) aerosol. ing the different seasons as explained in Saturno et
The selection of a robust marker is crucial for the assess- al. (2017a, c). Using the MAC values measured at
ment of the PR state. In previous studies, the concentrations ATTO (MAC for the wet season: 11.4 ± 1.2 m2 g−1 ;
of BC, CO, and CN as well as the air mass origin by means of MAC for the dry season: 12.3 ± 1.3 m2 g−1 ), the con-
BTs have been used as corresponding markers at other loca- version to MBCe corresponds to 0.011–0.012 µg m−3 .
tions; however all of them are characterized by certain limi- Note that this threshold would be higher if a “tradi-
tations (Hamilton et al., 2014, and reference therein). For the tional” MAC value of 6.6 m2 g−1 were used to calculate
present study, we explored the suitability of BC, CO, CN, and MBCe (∼ 0.019 µg m−3 ). Here, we selected a threshold
BTs as well as combinations of them as PR markers. Their concentration of MBC ∗ = 0.01 µg m−3 when the ATTO-
e
strengths and limitations can be summarized as follows: specific MAC values are taken into account. Accord-
ingly, PRBC periods fulfill the criterion MBCe < MBC ∗
– BT-based PR filter: BTs help to identify periods with e
for ≥ 6 h (after applying a five-point running average to
comparatively clean air mass advection due to fact that
the 1 h MBCe data).
the BTs which reach furthest to the northeast across
the South American continent overpass the largest frac-
– CO-based definition of PR, called PRCO : the BC ap-
tion of uninhibited and, thus, untouched forest regions
proach has the potential drawback that it may overem-
(C. Pöhlker et al., 2018). Accordingly, a BT filter allows
phasize periods with strong precipitation, since heavy
local and regional sources of anthropogenic pollution to
rain removes the BC/aerosol content in actually pol-
be excluded. However, BTs do not allow long-range-
luted air masses irrespective of the gas phase composi-
transport aerosols to be filtered out reliably, particularly
tion (see Hamilton et al., 2014). Accordingly, the PRCO
from African sources. Accordingly, BTs are not suitable
filter is based on the gas phase combustion marker, CO.
as a stand-alone PR filter; however, they are useful in
In our definition, PRCO conditions prevailed during pe-
combination with other PR markers as outlined below.
riods in which the ATTO cCO concentrations dropped
– CN-based PR filter: the total particle concentration per below the monthly background CO levels at the follow-
se is not a good filter for clean or (near-)pristine states ing reference stations (https://www.esrl.noaa.gov/gmd/
since natural aerosol conditions range from very low dv/site/CPT.html; last access: 7 April 2018): whenever
(e.g., NCN in Antarctica reaching down to 10 cm−3 ; the ATTO cCO data were associated with northern hemi-
Fiebig et al., 2014) to very high concentrations (e.g., spheric (NH) BTs (i.e., NE or ENE BT clusters, Fig. S1)
www.atmos-chem-phys.net/18/10289/2018/ Atmos. Chem. Phys., 18, 10289–10331, 201810296 M. L. Pöhlker et al.: Long-term observations of cloud condensation nuclei over the Amazon rain forest
and dropped below the average of the monthly CO lev- 0.6
els obtained at the three background stations at Ragged 2012–2016:
Point in Barbados (RPB), Assekrem in Algeria (ASK),
PRBC
and Izaña in Cape Verde (IZO), the episode was flagged 0.5
PRCO
as PRCO . Analogously, whenever the ATTO cCO data
were associated with southern hemispheric (SH) BTs PRBC COU
0.4 PRBC U CO
(i.e., E and ESE BT clusters) and dropped below the
monthly CO levels obtained at the background sta-
tion on Ascension Island (ACS), the episode was also 0.3
f
flagged as PRCO . Note that the time series of monthly
cCO levels from the reference stations was linearly inter-
polated to hourly values for the comparison with ATTO 0.2
cCO data. The BTs from the northern hemisphere (i.e.,
NE and ENE BT clusters) account for ∼ 70 % of all BTs
during the wet season. Among these ∼ 70, ∼ 30 % can 0.1
be attributed to the NE BT clusters. The locations of the
CO background stations, the wet-season ATTO BT en- dat
0.0
semble, and the hemispheric CO distribution are shown Jan Mar May Jul Sep Nov
in Fig. S2.
Month of year
Figure 1. Seasonality of frequency of occurrence, f , of empirically
The seasonality in the frequency of occurrence, f , of the pristine rain forest (PR) aerosol conditions at ATTO by means of
PRBC and PRCO filters is generally very similar, as shown in PRBC , PRCO , PRBC ∩ CO , and PRBC ∪ CO filters (see Sect. 2.7).
Fig. 1: the first PRBC and PRCO episodes occur in February. PRBC ∩ CO as the most robust case is used as the main PR filter
Their highest f is reached around the second half of April throughout this work. Data are shown as weekly averages for the
and the first half of May. Afterwards, f decreases steeply time period from March 2012 until June 2016. An analogous repre-
and PR conditions occur only occasionally in June and July. sentation for the year 2014 as the CCN focal period of this study is
Overall, PRBC and PRCO episodes overlap ∼ 25 % of the to- shown in Fig. S4.
tal time that is flagged by at least one of the two filters. Since
both approaches are associated with certain limitations and
uncertainties, we further analyzed two combinations of PRBC experimentally accessible as outlined in this work, the dry-
and PRCO : the union of both sets (PRBC ∪ CO ) and the inter- season PR state appears to be entirely swamped by pollution.
section of both sets (PRBC ∩ CO ) as shown in Fig. 1. For the The primary filters are based on the combustion markers
in-depth analysis of aerosol and CCN properties in this work, BC and CO, which do not allow a discrimination between
we chose the PRBC ∩ CO filter, which we consider as the most wildfires and man-made fires. Accordingly, the contribution
strict and, thus, robust since the criteria of both filters have to of wildfire emissions, which were part of an originally pris-
be fulfilled. tine atmosphere in the Amazon, is erroneously filtered out.
With respect to the PR filters, the following aspects are Generally, wildfires in the tropical Amazonian forests are
worth mentioning: PR episodes at ATTO exclusively occur rare events due to the fact that the dense and moist canopies
during the wet season due to a combination of two effects. – if unperturbed – effectively maintain a fire-immune state
First, the ATTO site is very remote and the characteristic (e.g., Cochrane, 2003; Nepstad et al., 2008). Nevertheless,
wet-season air mass advection occurs mostly over uninhab- wildfires play a certain, although minor, role for the ATTO
ited areas (see C. Pöhlker et al., 2018). Second, the high pre- observations, since the wet-season BTs cover the Guianan
cipitation rates entail strong scavenging and, thus, relatively savanna ecoregions that account for ∼ 8 % of the ATTO foot-
short aerosol particle lifetimes, which reduces the long-range print region (Olson et al., 2001; C. Pöhlker et al., 2018).
transport of the background pollution aerosol load. In con- Within these regions, the infrequent occurrence of wildfires
trast, dry-season PR episodes have almost never been ob- is part of the savanna-specific fire regime (de Carvalho and
served at ATTO due to the extensive biomass burning emis- Mustin, 2017). Figure S3 illustrates the relevance of wildfires
sions in South America and Africa in combination with low for ATTO under wet-season conditions.
scavenging rates and, thus, long atmospheric aerosol life- Moreover, Saharan dust as well as marine aerosols from
times. This is relevant since wet- vs. dry-season conditions the Atlantic Ocean are advected towards the ATTO region via
were likely associated with different atmospheric states, for wet-season LRT plumes, which are most frequent in Febru-
example with respect to volatile organic compound (VOC) ary and March (Moran-Zuloaga et al., 2017). Saharan dust
concentrations and aerosol populations as well as photo- and marine aerosols can also be considered as part of an orig-
chemical conditions. While wet-season PR states are still inal pristine atmospheric state in the Amazon. However, all
Atmos. Chem. Phys., 18, 10289–10331, 2018 www.atmos-chem-phys.net/18/10289/2018/M. L. Pöhlker et al.: Long-term observations of cloud condensation nuclei over the Amazon rain forest 10297
LRT plumes arriving at ATTO are filtered out by the PRBC
and PRCO approaches due to the fact that virtually all LRT
plumes contain a substantial fraction of smoke from mostly
man-made fires in West Africa (Moran-Zuloaga et al., 2017).
Accordingly, the role of the present-day LRT plumes arriv-
ing at ATTO has to be differentiated carefully as they repre-
sent a (partly internal) mixture of natural and anthropogenic
aerosols.
3 Results and discussion
3.1 Aerosol and cloud microphysical seasonality in the
Amazon
Prior to the in-depth analysis of the aerosol and CCN cy-
cling for characteristic conditions, this section provides an
overview of the aerosol and cloud microphysical seasonality
in the ATTO region. The pollution markers cCO and MBCe
in Fig. 2a show a pronounced seasonal cycle with a preva-
lence of clean conditions in the wet season vs. the biomass-
burning-related pollution maximum in the dry season (An-
dreae et al., 2015). The annual minimum in MBCe levels
occurs at the end of April (with weekly MBCe means of
∼ 0.03 µg m−3 ), whereas its highest concentrations were ob-
served in August and September (with weekly MBCe means
of ∼ 0.40 µg m−3 ). The seasonal cycle of cCO shows a tem-
poral shift of about 1 month with its minimum in the begin-
ning of June (with weekly cCO means ∼ 100 ppb) and largest
values from October to December (with weekly cCO means
∼ 200 ppb). The phase shift between the cCO and MBCe sea-
sonality can be explained by the spatiotemporal interplay of
combustion-related BC and CO sources, aerosol wet scav-
enging, and alternating advection of NH vs. SH air masses
(Martin et al., 2010b; Andreae et al., 2012, 2015). Simi-
lar to the MBCe trends, the total aerosol particle concentra-
tion, NCN,10 , tracks the seasonality in biomass burning ac-
tivities (in South America and Africa) with lowest concen-
trations in March and April (NCN,10 weekly means from
200 to 300 cm−3 ) and highest values between August and Figure 2. Seasonal cycle of selected trace gas, aerosol, and cloud
November (NCN,10 weekly means from 1000 to 2000 cm−3 ) microphysical parameters. (a) Pollution tracers, MBCe and cCO .
as shown in Fig. 2b. The CCN concentrations at a supersat- (b) Total aerosol number concentration, NCN,10 ; Aitken mode
uration of 0.5 %, NCCN (0.5 %), which were calculated based number concentration, NAit ; accumulation mode concentration,
on long-term SMPS data and the κ-Köhler parametrization Nacc ; and CCN number concentration at S = 0.5 %, NCCN (0.5 %).
as outlined in our Part 1 paper, mostly tracked the sea- (c) Precipitation products, PBT , representing cumulative pre-
cipitation along BT tracks, and PTRMM , representing TRMM-
sonal trends in NCN,10 . Its minimum around March and April
derived precipitation within the ROIATTO as defined in Fig. S1.
showed weekly mean NCCN (0.5 %) values around 200 cm−3 ,
(d) Satellite-derived cloud fraction and cloud top temperature
whereas the maximum showed values between 1000 and within the ROIATTO . (e) Satellite-derived cloud droplet effective ra-
2000 cm−3 . dius, re , within the ROIATTO . For a detailed characterization of the
Figure 2c shows the seasonal cycles of two precipitation land use and recent land use change in the ATTO footprint, includ-
data products: first, PTRMM data represent the area-averaged ing the ROIATTO , we refer to C. Pöhlker et al. (2018). Data in (a) to
precipitation rate in the ROIATTO (see Fig. S1). The PTRMM (d) are shown as weekly averages. Data in (e) are shown as monthly
data reveal a rather broad wet-season precipitation maximum averages. Error bars represent 1 standard deviation. Vertical orange
from March to May. The smallest precipitation rates are ob- shading represents 2-month time in 2014 frames of representative
served from September to November. Second, the PBT data clean and polluted conditions as shown in detail in Figs. 3 and 4.
www.atmos-chem-phys.net/18/10289/2018/ Atmos. Chem. Phys., 18, 10289–10331, 201810298 M. L. Pöhlker et al.: Long-term observations of cloud condensation nuclei over the Amazon rain forest
represent the cumulative precipitation along the BTs arriving this time of the year, biogenic aerosols from the surround-
at ATTO (for details see C. Pöhlker et al., 2018). Thus, PBT ing rain forest ecosystem, such as secondary organic aerosol
represents a measure for the extent of rain-related aerosol (SOA) from the oxidation of biogenic volatile organic com-
scavenging – particularly of long-range-transport aerosols – pounds (BVOCs) as well as primary biological aerosol par-
during air mass transport towards ATTO. A pronounced max- ticles (PBAP), prevail (Pöschl et al., 2010; Huffman et al.,
imum in PBT and the related scavenging is observed for the 2012; Yañez-Serrano et al., 2015). However, the regionally
months April and May, which coincides with the minimum in and biogenically dominated background state of the atmo-
aerosol parameters (i.e., MBCe and NCN,10 ) (see also Moran- sphere is frequently perturbed by the episodic advection of
Zuloaga et al., 2017). LRT aerosols from Africa in air masses that bypass the major
Figure 2d shows the seasonal cycles in cloud fraction and rain fields and, therefore, “survive” the intense scavenging
cloud top temperature within the ROIATTO . Both are pre- (Moran-Zuloaga et al., 2017). The frequent intrusion of LRT
dominantly influenced by the position of the ITCZ with its aerosols is a characteristic feature during the Amazonian wet
belt of extended deep convective cloud systems and strong season and represents a strong and important influence on the
precipitation (e.g., Moran-Zuloaga et al., 2017). According rain forest ecosystem (e.g., Chen et al., 2009; Bristow et al.,
to Fig. 2d, the densest cloud cover and deepest convection 2010; Baars et al., 2011; Abouchami et al., 2013; Yu et al.,
(represented by lowest cloud top temperature) occurs upon 2015; Rizzolo et al., 2017). These LRT plumes mostly com-
northerly passage of the ITCZ in the middle of the wet sea- prise a complex mixture of Saharan dust, African biomass
son (i.e., March and April) as well as upon southerly passage burning smoke, and marine aerosols from the transatlantic air
of the ITCZ at the end of the dry season (around Novem- passage (e.g., Talbot et al., 1990; Swap et al., 1992; Gläser et
ber). The maximum in deep convection in March and April al., 2015).
– expectedly – corresponds to the peak in PTRMM . A global The 2-month period in Fig. 3 can be regarded as represen-
picture of the spatiotemporal trends in cloud microphysical tative for typical wet-season conditions in the ATTO region
properties can be found in King et al. (2013). as it includes both scenarios: periods with a prevalence of
Figure 2e presents the satellite-derived effective radius, re , the local (biogenic) background aerosol and episodes under
of liquid cloud droplets that links the seasonality in aerosol the influence of LRT plumes, as well as intermediate states.
and cloud properties. The re data have been filtered by cloud In general, the wet season of 2014 showed average hydro-
top temperature to discriminate the different re growth states logical conditions without significant precipitation anomalies
at different heights of the convective clouds. It is well es- within the ROIATTO , which is in stark contrast to 2015/16
tablished that increased CCN loads entail an influence on with its pronounced El Niño influence and an associated
cloud properties, which typically results in a corresponding negative precipitation anomaly (see C. Pöhlker et al., 2018;
decrease in droplet diameter (e.g., Freud et al., 2008; Stevens Saturno et al., 2017a). Furthermore, the pollution tracers –
and Feingold, 2009). Figure 2e underlines this behavior by NCN,10 , MBCe , and cCO – showed comparatively low val-
means of a clear seasonality in re with its maximum during ues with concentrations around NCN,10 = 330 ± 130 cm−3 ,
the clean wet season (i.e., April and May) and its minimum MBCe = 0.03 ± 0.05 µg m−3 , and cCO = 110 ± 10 ppb (given
during the polluted dry season (i.e., August to November). A as mean ± 1 SD for the entire time period in Fig. 3) in agree-
detailed understanding of the impact of the CCN loading on ment with previous studies (e.g., Andreae et al., 2012, 2015;
the cloud microphysical properties, however, is the subject of Artaxo et al., 2013). In terms of atmospheric circulation,
ongoing studies at ATTO and further locations worldwide. the first half of the 2-month time frame was dominated by
In essence, Fig. 2 provides a coherent picture of the backward-trajectory arrivals from the northeast (blue and
aerosol, cloud, and precipitation seasonality as well as their green BT clusters; see Figs. 3a and S1), whereas during the
corresponding linkages. The following sections will zoom second half the dominant wind direction shifted towards east-
into this overall picture by presenting detailed aerosol and erly directions (orange and red BT clusters; see Figs. 3a
CCN data from characteristic wet- and dry-season conditions and S1) (compare Andreae et al., 2015; Moran-Zuloaga et
of the year 2014. al., 2017). This gradual swing of the dominant wind direc-
tion from NH to SH relates to the northwards movement of
3.2 Aerosol and CCN time series for representative the ITCZ.
wet-season conditions In Fig. 3, the orange background shading emphasizes sev-
eral episodes with detectable LRT influence, according to
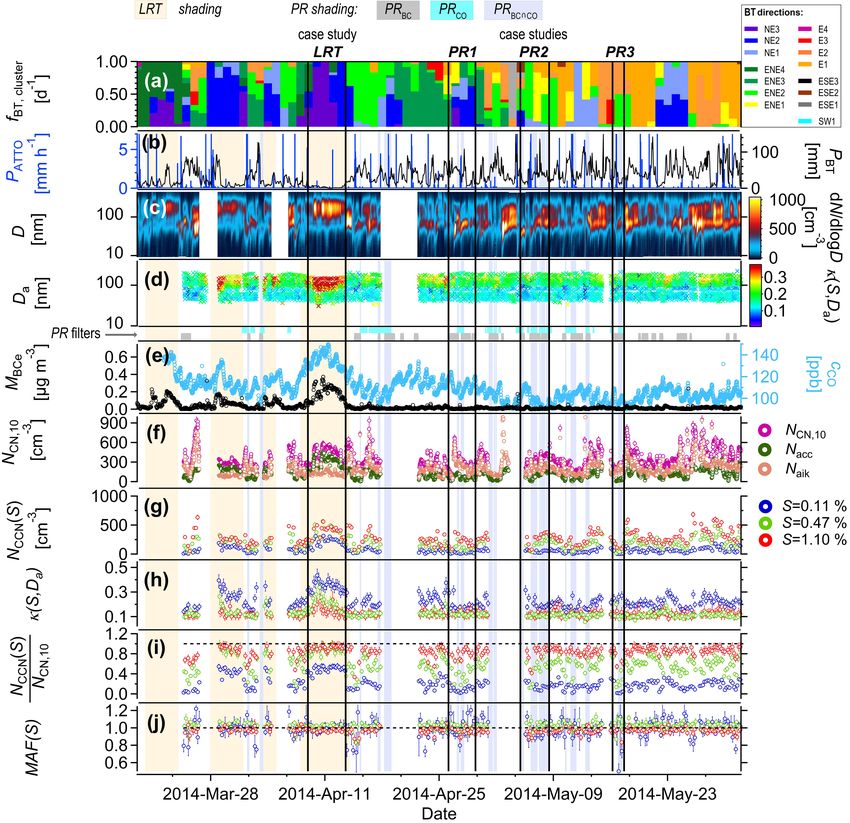
During the Amazonian wet season (February to May), the Moran-Zuloaga et al. (2017). A comparatively strong LRT
influence of local and regional anthropogenic pollution (i.e., plume at ATTO – labeled as LRT case study in Fig. 3 – is
from biomass burning) decreases to a minimum, and simul- the subject of a detailed CCN analysis in Sect. 3.5. The in-
taneous strong precipitation causes efficient aerosol scav- terested reader will find further in-depth analysis of this par-
enging (see Fig. 2). The combination of both effects re- ticular LRT event in Moran-Zuloaga et al., 2017 (where it
sults in a comparatively clean state of the Amazonian atmo- is discussed as event “2014_7”). Andreae et al. (2012) ar-
sphere (Martin et al., 2010b; Andreae et al., 2015). During gued that the “atmospheric state and processes in the Ama-
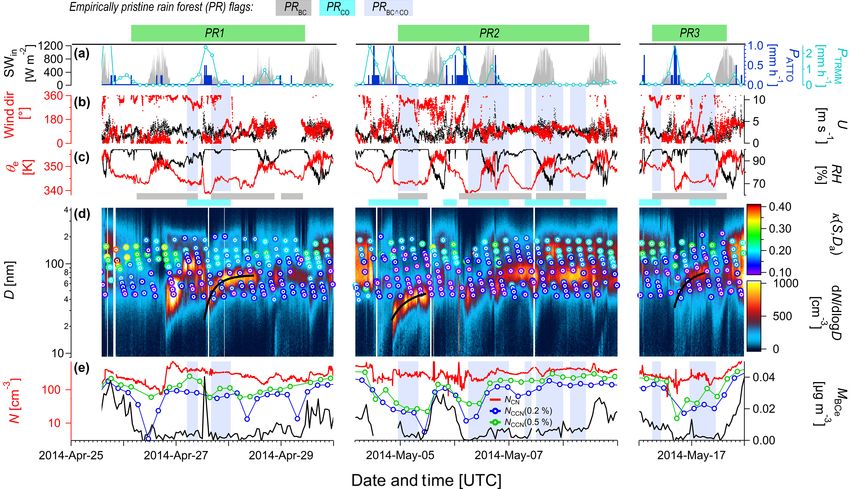
Atmos. Chem. Phys., 18, 10289–10331, 2018 www.atmos-chem-phys.net/18/10289/2018/M. L. Pöhlker et al.: Long-term observations of cloud condensation nuclei over the Amazon rain forest 10299 Figure 3. Overview plot illustrating selected meteorological, trace gas, aerosol, and CCN time series for representative wet-season conditions in the central Amazon. The shown time period from 23 March to 31 May covers a comparatively clean and extended time frame throughout the entire CCN measurement period. Individual panels represent (a) daily frequency of occurrence of 15 different BT clusters, fBT,cluster , with color code corresponding to Fig. S1; (b) precipitation rate (PATTO ) measured locally at ATTO and cumulative precipitation from BT analysis (PBT ) as a measure for aerosol wet deposition; (c) SMPS-derived time series of number size distributions spanning nucleation, Aitken, and accumulation modes; (d) CCNC-derived time series of κ(S, Da ) size distributions; (e) concentrations of biomass burning tracers, CO mole fraction (cCO ) and BCe mass concentration (MBCe ); (f) total number concentrations of the entire aerosol population (NCN,10 ), Aitken mode particles (NAit ); and accumulation mode particles (Nacc ); (g) CCN concentrations, NCCN (S), for selected supersaturations S; (h) hygroscopicity parameter, κ(S, Da ), for selected S; (i) CCN efficiencies, NCCN (S)/NCN,10 , for selected S; and (j) maximum activated fraction, MAF(S), for selected S. All CCN data are provided at the original time resolution of about 4.5 h. Light blue vertical shadings represent empirically pristine rain forest (PR) aerosol conditions according to the PRBC ∩ CO filter as defined in Sect. 2.7. Vertical lines highlight PR1, PR2, and PR3 periods selected for detailed analysis in Sect. 3.4. Light orange shading represents LRT episodes according to Moran-Zuloaga et al. (2017). Vertical lines highlight LRT case study for detailed analysis in Sect. 3.5. www.atmos-chem-phys.net/18/10289/2018/ Atmos. Chem. Phys., 18, 10289–10331, 2018
10300            M. L. Pöhlker et al.: Long-term observations of cloud condensation nuclei over the Amazon rain forest

zon Basin cannot be understood without the consideration of        3.3   Aerosol and CCN time series for representative
pollutant inputs by long-range transport”. This is evidently             dry-season conditions
true for the major LRT plumes in Fig. 3 with MBCe reach-
ing up to 0.3 µg m−3 as well as associated increases in Nacc .     During the dry season (August to November), the central
However, a closer analysis of the extended and relatively          Amazon is under continuous influence of pronounced anthro-
clean period from 14 April until 31 May 2014 also re-              pogenic pollution. The predominant type is biomass burning
veals that during ∼ 85 % of the time detectable amounts            smoke from deforestation fires, which led to the coining of
of background pollution were present (i.e., MBCe exceed-           the term “biomass burning season” (Freud et al., 2008). In ad-
ing MBCe ∗; see Sect. 2.7). Although (highly) diluted, the ad-     dition, various urban and industrial emission sources in east-
vected aerosols can impact the CCN population, as discussed        ern and southern Brazil as well as southern Africa may also
in Sect. 3.4. Only when pollution levels actually drop below       contribute by hard-to-define quantities (e.g., Andreae et al.,
detection limits and the conditions satisfy our rather strict      1994; Saturno et al., 2017a). The minimum in precipitation
PRBC ∩ CO filter do empirically pristine aerosol conditions        rates and, thus, in aerosol scavenging fosters the distribution
prevail, which are emphasized by a blue shading in Fig. 3.         of pollution aerosols over large areas by extending their at-
A statistical overview of the relative fraction of PR episodes     mospheric lifetime (see Fig. 2).
for the years 2012 to 2016 is shown in Fig. 1. It shows that          Figure 4 represents the dry-season counterpart of Fig. 3
PR conditions typically occur from March to May, with their        and shows the corresponding time series for a characteristic
highest abundance around late April and early May, when            dry-season period from 1 August until 30 September 2014.
weekly frequencies of occurrence reach up to ∼ 20 %, ac-           The BT clusters in Fig. 4a show that easterly and southeast-
cording to the strict PRBC ∩ CO filter, or even higher. Note       erly BTs prevailed, since the ITCZ was located north of the
that the PR episodes in 2014 mostly occurred in April and          ATTO site. The BT clusters which are most characteristic for
May (compare Figs. 3 and S4), which is in good agreement           the dry season approached the Amazon River delta from the
with the multi-year observations.                                  South Atlantic and then followed the river in a westerly di-
   The following picture emerges for the CCN parameters:           rection towards ATTO (red and orange clusters; see Fig. S1).
the time series of the κ(S, Da ) size distributions in Fig. 3d     These “dry-season river BTs” are the subject of a more de-
clearly illustrates the different κ(S, Da ) of Aitken and accu-    tailed discussion in the case study in Sect. 3.7. For certain
mulation modes as discussed in our Part 1 study (Pöhlker et        episodes, the wind swings further to southeasterly directions
al., 2016). Overall, κ(S, Da ) shows a clear variability for low   and brings air masses from inland directions (black, brown,
S, representing the accumulation mode, and rather stable val-      and grey BT clusters; see Fig. S1). These “dry-season inland
ues for higher S, representing the Aitken mode (see Fig. 3h).      BTs” are further discussed in the case study in Sect. 3.6.
The occurrence of the LRT plumes stands out clearly by                In contrast to the wet season, the accumulation mode
causing a significant enhancement of κ(S, Da ), with κAcc          clearly dominates the size distribution, which explains the
reaching 0.4 and κAit reaching 0.25 (see Fig. 3d and h).           increased CCN efficiencies, particularly at low S (Fig. 4c
Moreover, the LRT events are also associated with increased        and i). The frequent “pulses” in the accumulation mode
NCCN (S) and NCCN (S)/NCN values (Fig. 3g and i). Note that        concentration can be attributed to (aged) biomass burning
the occurrence of the LRT events precisely coincides with the      plumes, which impact the ATTO site episodically, typically
minima in PBT and, thus, “windows” in aerosol scavenging           for few days (see Freitas et al., 2005). The MBCe , NCN,10 ,
(see Moran-Zuloaga et al., 2017).                                  and cCO levels are typical for dry-season conditions in the
   For the extended and comparatively clean period from 14         northeast Amazon Basin with MBCe = 0.55 ± 0.35 µg m−3 ,
April until end of May, the SMPS contour plot (Fig. 3c) re-        NCN,10 = 1520 ± 780 cm−3 , and cCO = 140 ± 50 ppb (given
veals equally strong Aiken and accumulation modes as well          as mean ± 1 SD for the time period in Fig. 4) (e.g., Rissler
as a “patchy” appearance, due to frequent rainfall causing         et al., 2004; Andreae et al., 2012, 2015; Artaxo et al., 2013;
(local) aerosol scavenging. As outlined in Part 1, the aerosol     Saturno et al., 2017a).
abundance in the particle size range > 40 nm predominantly            The most obvious event in Fig. 4 is the advection of a
defined the measured CCN population (Pöhlker et al., 2016).        strong BB plume from 17 to 23 August 2014, the highest
Accordingly, the NCCN (S) and NCCN (S)/NCN time series             pollution levels that were observed during the entire CCN
directly track the SMPS-derived patchy pattern. The low S          measurement period. This event can be recognized by means
levels (i.e., NCCN (0.11 %)), which do not activate Aitken         of strong pulses in NAcc , MBCe , and cCO as well as a dip
mode particles, closely followed the accumulation mode con-        in κ(S, Da ). The ACSM-derived organic-to-sulfate ratio con-
centration, Nacc , time series, whereas the higher S levels        firms that the biomass burning pulse comprised a predom-
(i.e., NCCN (1.10 %)), which also activated particles in the       inantly organic aerosol. In general, the measured κ(S, Da )
Aitken mode, closely tracked NCN,10 (= NAit + Nacc ). Two          levels respond inversely to the organic-to-sulfate ratio, con-
of the subsequent case studies will focus in more detail on        firming previous studies which stated that organic matter and
the specific CCN properties of the PR (Sect. 3.4) and LRT          sulfate constituents mostly define the aerosol’s hygroscopic-
(Sect. 3.5) conditions (see also Table 1).                         ity in the Amazon (Roberts et al., 2002; Gunthe et al., 2009).

Atmos. Chem. Phys., 18, 10289–10331, 2018                                          www.atmos-chem-phys.net/18/10289/2018/
You can also read