Surface deformation relating to the 2018 Lake Muir earthquake sequence, southwest Western Australia: new insight into stable continental region ...
←
→
Page content transcription
If your browser does not render page correctly, please read the page content below
Solid Earth, 11, 691–717, 2020
https://doi.org/10.5194/se-11-691-2020
© Author(s) 2020. This work is distributed under
the Creative Commons Attribution 4.0 License.

Surface deformation relating to the 2018 Lake Muir earthquake
sequence, southwest Western Australia: new insight into stable
continental region earthquakes
Dan J. Clark1 , Sarah Brennand1 , Gregory Brenn1 , Matthew C. Garthwaite1 , Jesse Dimech1 , Trevor I. Allen1 , and
Sean Standen2
1 Positioning
            and Community Safety Division, Geoscience Australia, GPO Box 378 Canberra ACT, Australia
2 Faculty
        of Science, School of Earth Sciences, The University of Western Australia, 35 Stirling Hwy,
Crawley, Western Australia, Australia

Correspondence: Dan J. Clark (dan.clark@ga.gov.au)

Received: 24 July 2019 – Discussion started: 23 August 2019
Revised: 1 March 2020 – Accepted: 25 March 2020 – Published: 30 April 2020

Abstract. A shallow Mw 5.3 earthquake near Lake Muir in          mapped using topographic signature prior to the historical
the stable continental region (SCR) crust of southwest West-     event. Consistent, though fragmentary, evidence exists from
ern Australia on the 16 September 2018 was followed on           analogous regions worldwide. Our analysis of the Lake Muir
the 8 November by a proximal Mw 5.2 event. Focal mech-           earthquake sequence therefore provides constraint on models
anisms produced for the events suggest reverse and strike-       describing mechanisms for strain accumulation and localized
slip rupture, respectively. Field mapping, guided by Sentinel-   release as earthquakes in non-extended SRC crust.
1 InSAR data, reveals that the first event produced an ap-
proximately 3 km long and up to 0.4–0.6 m high west-facing
surface rupture, consistent with reverse slip on a moder-
ately east-dipping fault. The InSAR data also show that the      Copyright statement. The works published in this journal are
surface scarp relates to a subsurface rupture ∼ 5 km long,       distributed under the Creative Commons Attribution 4.0 License.
                                                                 The author’s copyright for this publication is transferred to the
bound at its northern and southern extremities by bedrock
                                                                 Commonwealth of Australia. The Creative Commons Attribution
structures. The November event produced a surface defor-         4.0 License and the Commonwealth of Australia are interoperable
mation envelope that is spatially coincident with that of the    and do not conflict with, reduce or limit each other.
September event but did not result in discrete surface rup-
ture. Almost 900 aftershocks were recorded by a tempo-           © Commonwealth of Australia (Geoscience Australia) 2020
rary seismometer deployment. Hypocentre locations corre-
late poorly with the rupture plane of their respective main-
shocks but correlate well with regions of increased Coulomb      1   Introduction
stress. The spatial and temporal relationships between the
Mw > 5.0 events and their aftershocks reveals dependencies       Within the stable continental regions (SCRs) of the world,
with implications for how other less well-documented SCR         defined by Johnston et al. (1994) as “areas where the con-
earthquake sequences could be interpreted. Furthermore, the      tinental crust is largely unaffected by currently active plate
September Mw 5.3 Lake Muir earthquake was the ninth event        boundary processes”, large and potentially damaging earth-
documented to have produced surface rupture in Australia in      quakes are rare (Johnston, 1994b; Schulte and Mooney,
historical times. These nine ruptures are located exclusively    2005). Consequently, mechanisms for strain accumulation
in the Precambrian non-extended SCR rocks of central and         and localized release as earthquakes are poorly understood
western Australia, and none could have been identified and       (Talwani, 2014; Calais et al., 2016; Craig et al., 2016; Liu
                                                                 and Stein, 2016; Salditch et al., 2020), and the epistemic

Published by Copernicus Publications on behalf of the European Geosciences Union.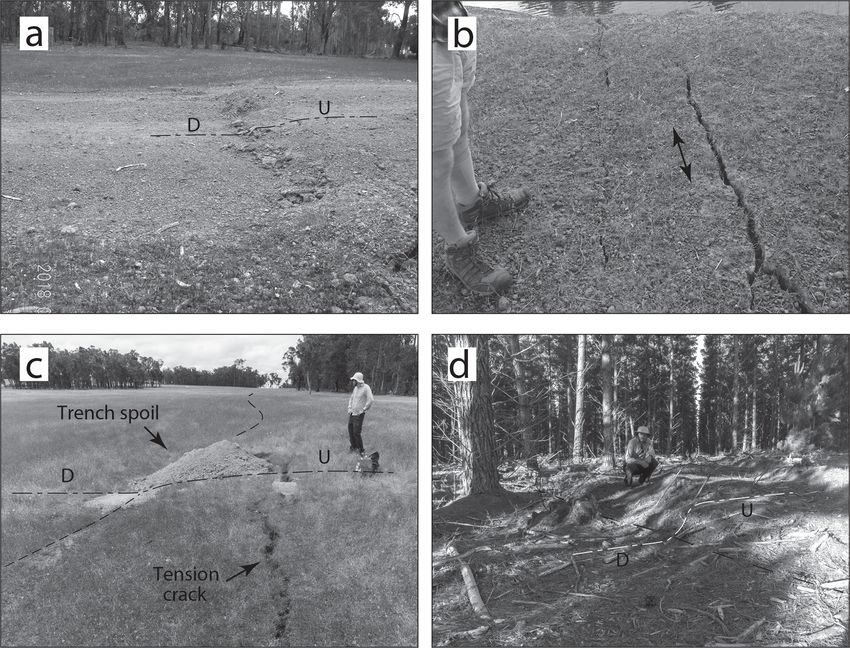
692                           D. J. Clark et al.: Surface deformation relating to the 2018 Lake Muir earthquake sequence

uncertainty associated with fault-displacement hazard (e.g.         and Phanerozoic elements based on differences in seismo-
Moss and Ross, 2011; Moss et al., 2013) and the recur-              genic potential implied by the character of neotectonic fea-
rence and fault-source model components of seismic-hazard           tures (after Clark et al., 2012; Fig. 1). The older crust was as-
assessments (e.g. Stein, 2007; Leonard et al., 2014; Grif-          sociated with a lower seismogenic potential, consistent with
fin et al., 2020; Allen, 2020) is large. Constraint can be          the hypothesis proposed by Mooney et al. (2012) that seis-
provided by the analysis of moderate-magnitude historical           mogenic potential is inversely proportional to lithospheric
earthquake sequences supplemented by the palaeoseismic              thickness. Perhaps counterintuitively, the historical record
record of large surface-deforming events. Historical surface-       of seismicity and surface rupture is particularly rich in the
deforming earthquakes are particularly valuable in this re-         Australian Precambrian non-extended SCR (Leonard, 2008;
spect in that they allow for a more robust interpretation of        Clark, 2010; Leonard and Clark, 2011), which has hosted
the palaeoseismic record (e.g. through calibration of scal-         nine of the 15 historical earthquakes documented to have
ing relationships between surface rupture length and earth-         produced surface ruptures in SCR crust globally (Table 1,
quake magnitude; Wells and Coppersmith, 1994; Clark et al.,         Fig. 1).
2014b), and a broad range of tools exist with which to char-           In this paper we report on the geological setting and char-
acterize the surface deformation and so deduce source prop-         acteristics of the most recent of the nine surface rupturing
erties (e.g. interferometric synthetic aperture radar – InSAR)      earthquakes in the Australian Precambrian SCR crust; this
and pixel tracking techniques for determining vertical and          includes the 2018 Mw 5.3 Lake Muir earthquake. The earth-
horizontal coseismic displacements; Massonnet et al., 1993;         quake was followed by an extensive aftershock swarm and
Klinger et al., 2018; Zhou et al., 2018; Gold et al., 2019).        a proximal Mw 5.2 earthquake 51 d after the 16 Septem-
   Broad agreement exists that SCR crust is not homo-               ber event, which deformed but did not break the surface.
geneous with respect to seismogenic potential (Johnston,            InSAR observations of surface deformation relating to both
1994a; Mooney et al., 2012; Clark et al., 2012). The majority       Mw > 5.0 events were validated using field observations, un-
of historical moment release in SCR settings is preferentially      manned aerial vehicle (UAV)-acquired high-resolution dig-
located in failed rifts of Cretaceous to Paleogene age (e.g.        ital elevation data and hypocentres calculated from a local
Johnston, 1994a; Schulte and Mooney, 2005; Bonini et al.,           seismic network deployed in the days following the first,
2012; Talwani, 2014) and associated with pronounced lateral         Mw 5.3, event. Analysis of the Lake Muir earthquake se-
gradients in lithospheric thickness such as at the boundaries       quence provides guidance as to how other moderate- to large-
of cratons (e.g. Mooney et al., 2012) (Table 1). The largest        magnitude SCR seismic sequences might be interpreted (e.g.
recorded historical SCR earthquakes have occurred in failed         Adams et al., 1992; Bent, 1994; Baumbach et al., 1994) and
rift settings; this includes within the Reelfoot Rift (Mueller      further constraint for models describing localized strain re-
and Pujol, 2001) and the Rann of Kachchh (Rajendran et al.,         lease as earthquakes in non-extended SCR crust worldwide.
2008). While typically being characterized by a lack of sig-
nificant neotectonic relief (White et al., 2009; Talwani, 2014;     1.1   The Lake Muir Earthquake Sequence
Goedhart and Booth, 2016; Hornsby et al., 2019), there are
notable exceptions where evidence is preserved for strain lo-       The Ml 5.7 (Mw 5.3) Lake Muir earthquake occurred at
calization over many seismic cycles; typically but not exclu-       04:56:24 UTC on 16 September 2018 in a rural area of south-
sively associated with the bounding faults of the failed rifts.     west Western Australia, ∼ 60 km east of the town of Man-
Examples include the Rann of Kachchh in India (Rajendran            jimup and a similar distance north of the town of Walpole
et al., 2008; Rastogi et al., 2014), the Tapti Fault in peninsu-    (Fig. 2). Approximately 20 km from the epicentre, relatively
lar India (Copley et al., 2014), the Reelfoot Rift in the cen-      modest Modified Mercalli Intensity (MMI) values of VI were
tral United States (van Arsdale, 2000; Cox et al., 2013), and       reported (Allen et al., 2019). With the exception of one un-
the Otway, Flinders and Strzelecki ranges of eastern Aus-           occupied dwelling in the immediate epicentral area, which
tralia (Sandiford, 2003a, b; Celerier et al., 2005; Quigley et      was extensively damaged, only minor damage and no in-
al., 2006; Hillis et al., 2008; Braun et al., 2009; Clark et al.,   juries were reported. The event was widely felt throughout
2012) (Fig. 1).                                                     the Perth Basin, including the Perth metropolitan region, over
   While accounting for less than 10 % of historical global         300 km away. Focal mechanisms suggest a reverse faulting
SCR moment release (Schulte and Mooney, 2005), non-                 mechanism, with a minor dextral transcurrent component and
extended SCR crust accounts for more than two-thirds of the         moderately east and northwest dipping nodal planes (Fig. 2,
surface-deforming earthquakes documented (Table 1) and              Table 2). Geoscience Australia recorded a magnitude Ml 3.4
is locally associated with a rich palaeoseismic record (e.g.        foreshock 3 d prior to the mainshock. A protracted aftershock
Crone and Machette, 1995; Rajendran et al., 1996; Crone             sequence, comprising hundreds of located events, was punc-
et al., 2003; Wheeler, 2006; Clark et al., 2008, 2012, 2015;        tuated by a Ml 4.6 event on 12 October at 16:31:30 UTC
Estrada, 2009; Quigley et al., 2010; Clark, 2010; Zellman           (Fig. 3, Table 2). Almost 2 months after the 16 Septem-
and Ostenaa, 2016). Within the Australian SCR, Leonard et           ber Mw 5.3 event, a Ml 5.4 (Mw 5.2) event occurred on the
al. (2014) divided the non-extended part into Precambrian           8 November at 21:07:01 UTC. Within the error estimates of

Solid Earth, 11, 691–717, 2020                                                                www.solid-earth.net/11/691/2020/
D. J. Clark et al.: Surface deformation relating to the 2018 Lake Muir earthquake sequence                                                                                    693

Table 1. Historical earthquake events known to have produced surface rupture in stable continental region crust (expanded after Crone et
al., 1997; Clark et al., 2014b). Cells in italic font are events for which an InSAR image was produced. NT: Northern Territory; SA: South
Australia; and WA: Western Australia.

  Event (setting)                         Year       Magnitude         Mapped surface          Mechanism           Max vertical         Deformation reference
  e = extended,                                          (Mw )         rupture length                                    surface
  n = non-extended,                                                    (km)b                                       displacement
  b = lithospheric boundary                                                                                                  (m)
  Reelfoot Thrust, USA (e)                1812           7.2–7.3       blind (61)              R                               ∼2       Mueller and Pujol (2001)
  Kutch, India (e)                        1819        7.25–8.25        blind (> 90)            R                               7–9      Rajendran et al. (2008)
  Accra, Ghana (e)                        1939                6.5      9–17                    SS                             0.46      Bates (1941), Yarwood and
                                                                                                                                        Doser (1990)
  Republic of the Sudan (e)               1956                5.1      6                       SS                                 0     Qureshi and Sadig (1967)
  Meckering, WA (n)                       1968               6.58      37                      R                               2.5      Gordon and Lewis (1980),
                                                                                                                                        Clark and Edwards (2018)
  Calingiri, WA (n)                       1970               5.46      3.3                     R                               0.4      Gordon and Lewis (1980)
  Cadoux, WA (n)                          1979               6.13      14                      R                               1.4      Lewis et al. (1981)
  Guinea (e)                              1983                6.2      9.4                     SS                             0.13      Langer et al. (1987)
  Marryat Creek, SA (n)                   1986               5.74      13                      R                               0.9      Machette et al. (1993)
  Tennant Creek, NTa (n)                  1988               6.76      36                      R                               1.8      Crone et al. (1992, 1997)
  Ungava, Canadaa (n)                     1989                6.3      8.5                     R                               0.8      Bent (1994)
  Killari, India (n)                      1993                6.1      3 (7–15)                R                               0.5      Rajendran et al. (1996),
                                                                                                                                        Satyabala (2006)
  Bhuj, India (e)                         2001                7.7      blind (60)              R                               3.0      Schmidt and Burgmann (2006),
                                                                                                                                        Rajendran et al. (2008)
  Kallanie, WA (n)                        2005                4.4      blind                   R                            0.027       Dawson et al. (2008)
  Hatanbulag, Mongolia (n,b)              2005                5.2      blind                   R                              0.01      Amarjargal et al. (2013)
  Katanning, WA (n)                       2007               4.73      0.2 (1.26)              R                               0.1      Dawson et al. (2008)
  Ernabella (Pukatja),                    2012               5.37      1.5                     R                               0.5      Clark et al. (2014b)
  SA (n,b)
  Petermann Ranges,                       2016               6.10      15 (20)                 R                               1.0      King et al. (2018), Polcari et
  NT (n,b)                                                                                                                              al. (2018), Wang et al. (2019)
  Botswana (n,b)                          2017                6.5      blind                   N                              0.04      Gardonio et al. (2018)
  Lake Muir, WA (n,b)                     2018               5.30      3.2 (7)                 R                               0.4      this article
  Lake Muir, WA (n,b)                     2018               5.20      Blind (4)               SS                                 0     this article
  Tennant Creek, NT (n)                   2019                5.3      Blind                   R                              0.04      https://twitter.com/sotisvalkan/
                                                                                                                                        status/1158362851930726400
                                                                                                                                        (last access: 1 March 2020)
  Montélimar, France (e)                  2019                4.9      < 1?(5)                 R                              0.08      https://twitter.com/sotisvalkan/
                                                                                                                                        status/1194539703858606080
                                                                                                                                        (last access: 1 March 2020)
a The Ungava surface rupture formed as the result of two events 0.9 sec apart (Bent, 1994), and Tennant Creek surface rupture was produced by three events in a 12 h period
(Bowman, 1992). b Values in brackets estimate the surface rupture length from surface deformation (e.g. InSAR data).

www.solid-earth.net/11/691/2020/                                                                                                      Solid Earth, 11, 691–717, 2020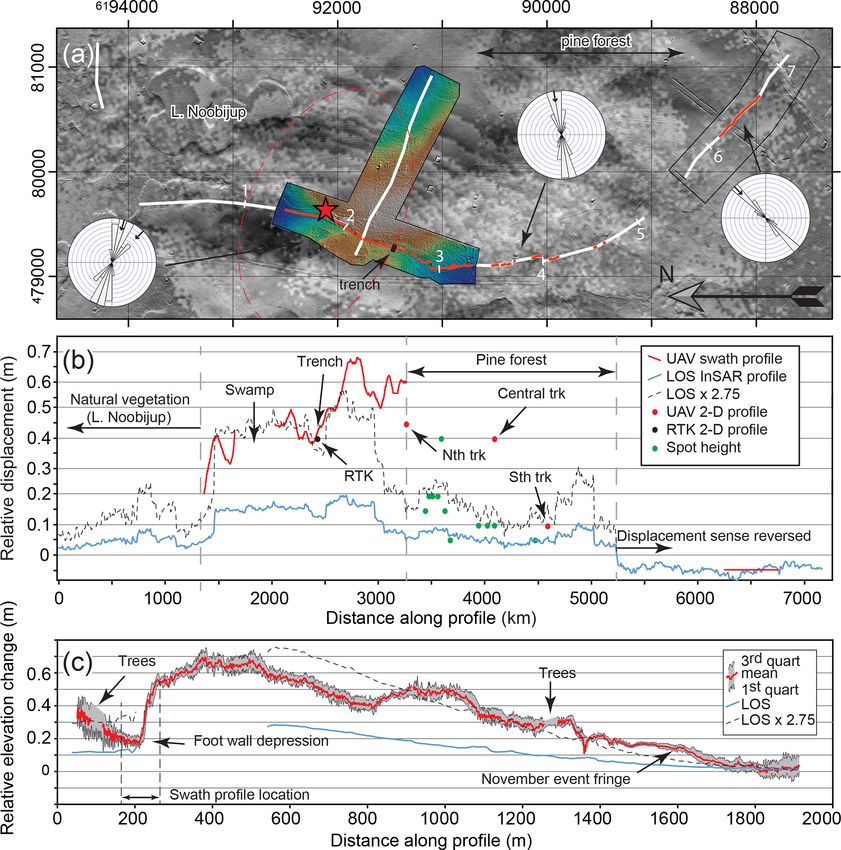
694                             D. J. Clark et al.: Surface deformation relating to the 2018 Lake Muir earthquake sequence

Figure 1. An example of heterogeneity in seismogenic potential within stable continental region (SCR) crust from Australia. Base map
shows neotectonic superdomains (after Leonard et al., 2014) and the outlines of Australian states and territories. Neotectonic features (red
lines) from the Australian Neotectonic Features Database (Clark et al., 2012; Clark, 2012). Historical surface ruptures shown as red dots
labelled with the year of the event. Note all historical surface ruptures have occurred in Precambrian non-extended stable continental region
crust (Johnston et al., 1994). Key locations include a: Roopena scarp; b: Hyden scarp, c: Lort River scarp; and d: Dumbleyung scarp.

the original hypocentral determinations, this event was collo-           1.2   Geological and seismotectonic setting of the Lake
cated with the 16 September event (see weblinks in Table 2).                   Muir earthquake sequence
The focal mechanisms calculated for the November event in-
dicate predominantly dextral strike-slip faulting, with steeply          The Lake Muir earthquake sequence occurred within 1700–
northwest and southwest dipping nodal planes. The percent-               1600 Ma rocks of the Biranup Zone of the Proterozoic
age double-couple from the U.S. Geological Survey (USGS)                 Albany–Fraser Orogen (Fitzsimons and Buchan, 2005; Spag-
W-phase moment tensor solution is 31 % (Fig. 2, Table 2).                giari et al., 2009) (Fig. 2). During the Mesoproterozoic
This event was felt much more strongly and widely than                   Albany–Fraser Orogeny these rocks were thrust to the north
the slightly larger first event, with MMI of VII to VIII be-             over the 3000–2600 Ma rocks of the Northern Foreland of
ing recorded close to the epicentre. There are several factors           the Albany–Fraser Orogen (the portion of the Archaean Yil-
that might explain the relatively greater number (and den-               garn Craton that was reworked during the Albany–Fraser
sity) of felt reports from the 8 November earthquake, includ-            Orogeny) along moderately south-dipping faults. In the Lake
ing the following:(1) the time of day, which was early morn-             Muir region, the dominant east- to east-southeast-striking
ing, when people are more likely to be stationary and thus               structural grain is associated with the major structures bound-
more likely to perceive ground shaking; (2) differences in               ing these thrust sheets. East-striking structural and litholog-
the ground motion radiation pattern and/or stress drop of the            ical trends relating to the Albany–Fraser Orogen are tran-
earthquake that may have yielded greater shaking in popu-                sected by northwest-trending structures related to Protero-
lation centres at perceptible frequencies; and/or (3) greater            zoic to earliest Phanerozoic movement on the Darling Fault
community awareness of the earthquake sequence and where                 Zone to the west (Janssen et al., 2003). The Boyagin dike
to find sources of further information. Surface rupture relat-           swarm cuts across much of the southwest, including the Yil-
ing to the September event was initially identified with In-             garn Craton and Albany–Fraser Orogen (Prider, 1948; My-
SAR (Fig. 2) and has been subsequently verified by ground                ers, 1990; Harris and Li, 1995), and is subparallel to this
survey (this paper).                                                     structural trend. Minor north- and northeast-trending struc-
                                                                         tures may relate to the Gondwana breakup or later move-
                                                                         ment focused on the Darling Fault, parallel structures to the

Solid Earth, 11, 691–717, 2020                                                                       www.solid-earth.net/11/691/2020/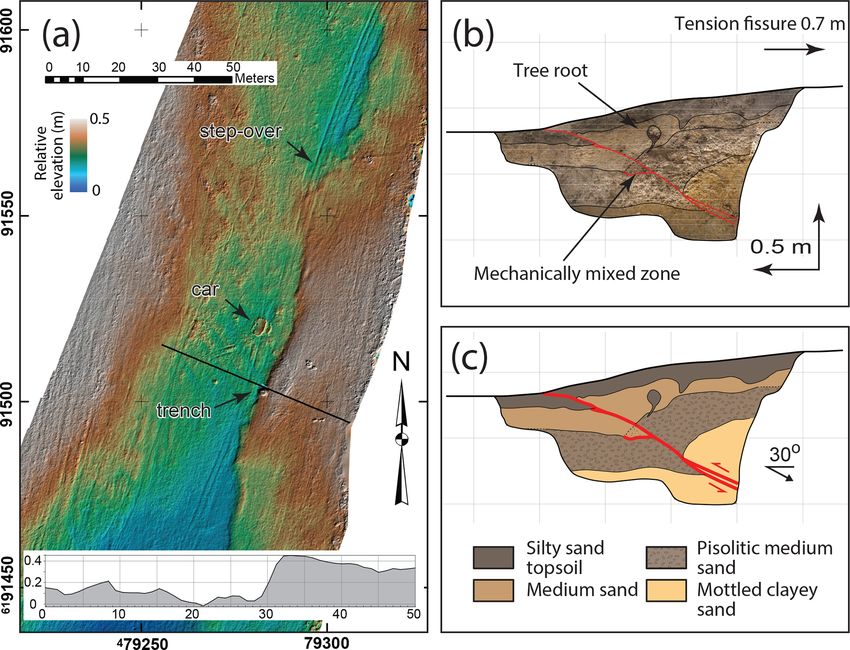
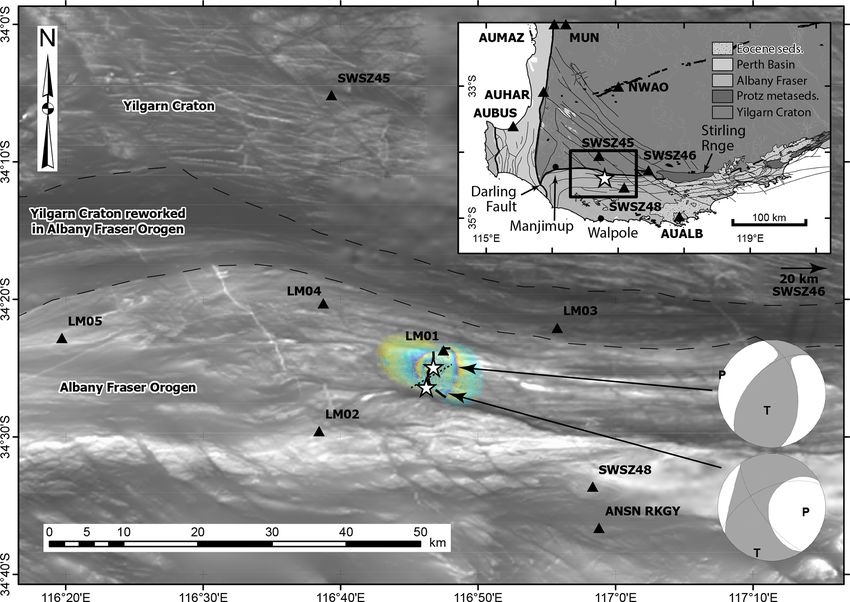
D. J. Clark et al.: Surface deformation relating to the 2018 Lake Muir earthquake sequence                                             695

Figure 2. Location and geological setting of the 2018 Lake Muir earthquake sequence in southwest Western Australia. Inset shows Precam-
brian basement geology and overlying Phanerozoic Perth Basin and Eocene rocks (modified after Geological Survey of Western Australia,
2016). Proterozoic and younger faults and dikes are shown as thick and thin black lines, respectively. Base map in the main frame shows
reduced-to-pole total magnetic intensity data (Milligan and Nakamura, 2015). Black triangles show the locations of seismic recording sta-
tions (rapid deployment kits are prefixed with LM) and GPS stations (SWSZ prefix). The location of the two M > 5 earthquake epicentres
are shown by white stars, with arrows indicting the associated focal mechanisms (see Table 2 for source). The surface rupture trace from the
September event and the surface deformation front from the November event are shown by solid and dashed black lines, respectively (see
text for details). The InSAR phase image for the September Mw 5.3 earthquake is overlain to demonstrate the scale of surface deformation.

west thereof (e.g. the Dunsborough and Busselton faults)                the SWSZ appears to have increased significantly since the
and associated oblique structures (Harris, 1996; Olierook et            1940s (Leonard, 2008), and it has generated five of the nine
al., 2015). Eocene alluvial sediments (Werillup Formation)              known Australian historic surface ruptures (all associated
and marine siltstone and sandstone (Pallinup Formation) lo-             with reverse faulting, Table 1). In addition to large shallow
cally infill topography in the crystalline basement (Wilde and          events and scattered smaller events, the SWSZ has produced
Walker, 1984). Deposits have been correlated to map a Pa-               several dozen earthquake swarms in the last 40 years, includ-
leogene palaeo-channel system (Smith, 2010). These sed-                 ing the Burakin swarm of 2000–2002 during where ∼ 18 000
iments and ferricrete developed within them are reported                events of mixed focal mechanism (including six events in
to be locally faulted by up to 5–7 m vertically based upon              the magnitude range Mw 4.0–4.6) were recorded in a period
evidence from drill holes (Chakravartula and Street, 2000;              of only a few months (Leonard, 2002; Allen et al., 2006;
Smith, 2010). The sparsity of boreholes precludes determi-              Dent, 2016). While most swarm centres occur within the
nation of fault orientation.                                            SWSZ, they have a broader distribution across the southwest
   The Lake Muir region lies near to the southern bound-                of Western Australia (Dent, 2016), with an essentially ran-
ary of a broad band of relatively high seismicity crossing              dom pattern that is similar to fault scarps relating to prehis-
the southwest corner of Western Australia known as the                  torical events (Clark, 2010; Clark et al., 2012). The relatively
Southwest Seismic Zone (SWSZ; Doyle, 1971), which is                    uniform spatial distribution of north-trending reverse fault
one of the most seismically active regions in Australia (e.g.           scarps is consistent with scarp formation under conditions
Leonard, 2008; Allen et al., 2018). Earthquake activity in              imposed by the contemporary east–west oriented compres-

www.solid-earth.net/11/691/2020/                                                                        Solid Earth, 11, 691–717, 2020
696 D. J. Clark et al.: Surface deformation relating to the 2018 Lake Muir earthquake sequence
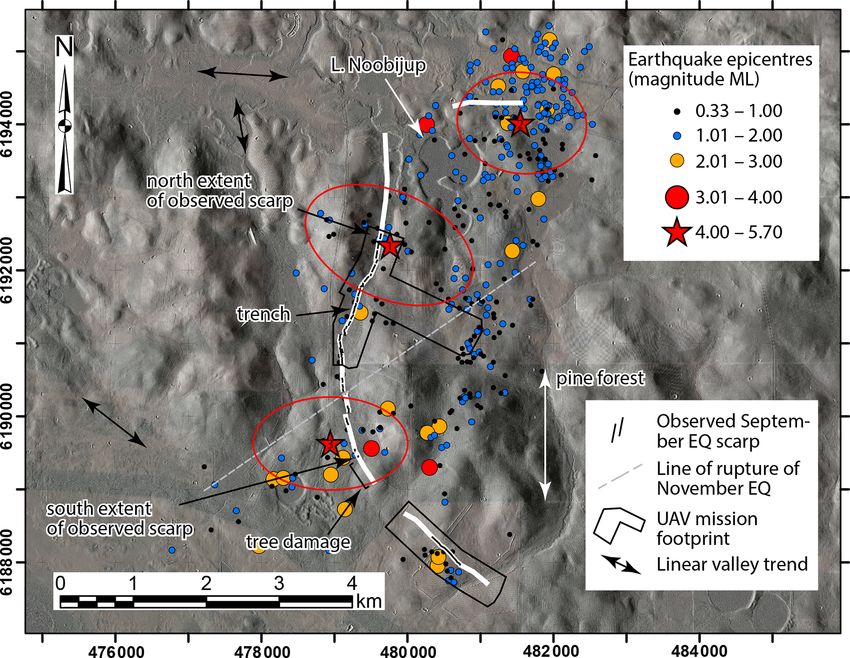
Figure 3. Map of the Lake Muir surface ruptures and associated seismicity. Background map is part of the Western Australian Department
of Biodiversity, Conservation and Attractions lidar holdings (https://www.dbca.wa.gov.au/contact-us, last access: 27 September 2018) with
Esri world imagery overlain at 75 % transparency. White line shows the extent of the discrete surface rupture relating to the September event,
as mapped from InSAR. Superposed black lines are scarp segments mapped on the ground. Grey dashed line shows the discrete line of
deformation relating to the November event, as mapped from InSAR. The three largest events and their uncertainty ellipses, 16 September
Mw 5.3, 12 October Ml 4.6 and 8 November Mw 5.2, are consecutively numbered (see Table 2).
sive crustal stress regime (e.g. Rajabi et al., 2017b) and sug- stances to be rejuvenating the drainage within flat-bottomed
gests that seismogenic strain release is uniformly distributed valleys, resulting in the removal of valley-fill sediments and
over the Yilgarn Craton over the timescale recorded in the the accentuation of structural trends evident in the align-
land surface (ca. 100 kyr or more) (Leonard and Clark, 2011). ment of adjacent linear ridges. There is no landscape evi-
dence for sharp vertical dislocations of valley floor sediments
1.3 Landscape context of the Lake Muir earthquake that might relate to Late Pleistocene or Holocene surface-
sequence rupturing seismic events.
Examination of a 2012 lidar dataset (see the Supplement) re- 2 Methods
vealed the presence of an alignment of valleys and ridges
that mimics structural trends evident in the continental- and 2.1 InSAR processing method
regional-scale magnetic data (cf. Figs. 2 and 3) (Chakravar-
tula and Street, 2000; Milligan and Nakamura, 2015). The Since the 1992 Mw 7.3 Landers earthquake (Massonnet et
main ridge-line, valley and drainage trends in the study area al., 1993), remote sensing techniques have been shown to be
are broadly to the east-southeast and north, with a subordi- valuable tools for observing surface deformation and dam-
nate northwest trend (black double-ended arrows in Fig. 3). age patterns relating to earthquakes in a range of tectonic
Ridges are subdued, broad and undulating. Valley floors are settings (e.g. Livio et al., 2017; Klinger et al., 2018; Wang
flat-bottomed and are locally occupied by lakes and swamps, et al., 2019; Gold et al., 2019; Scott et al., 2019). Interfer-
implying the presence of significant sedimentary infill (cf. ometric Synthetic Aperture Radar (InSAR) in particular has
Commander et al., 2001; Smith, 2010). Lunettes are devel- greatly improved the detectability of surface faulting and sur-
oped on the east and southeast sides of most lakes, often face deformation, especially relating to small- to moderate-
with evidence for minor remobilization into parabolic dunes. sized earthquake sequences in remote or poorly instrumented
Knickpoint retreat from a regional topographic low to the areas, such as SCRs (Satyabala, 2006; Dawson et al., 2008;
southwest occupied by Lake Muir is observed in several in- Amarjargal et al., 2013; Livio et al., 2017; Gardonio et
Solid Earth, 11, 691–717, 2020 www.solid-earth.net/11/691/2020/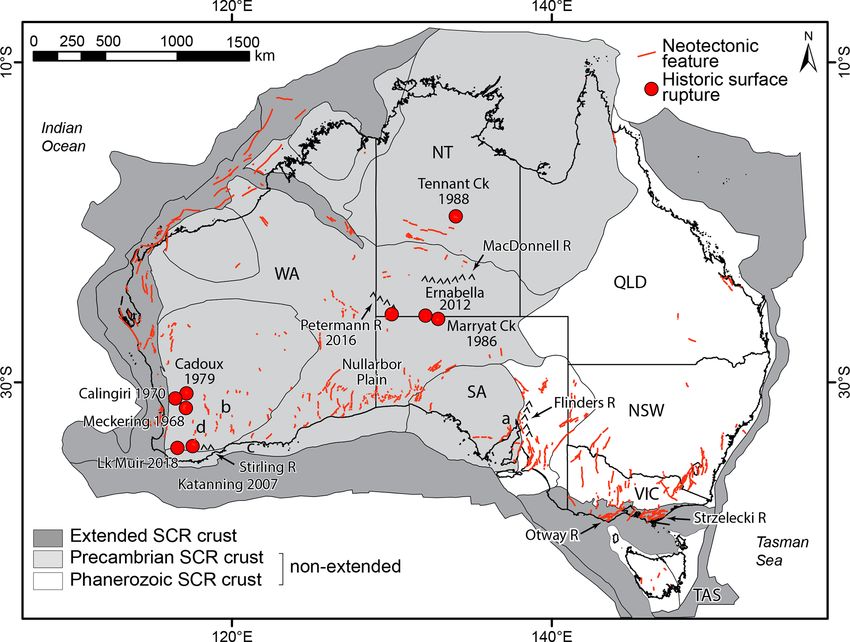
D. J. Clark et al.: Surface deformation relating to the 2018 Lake Muir earthquake sequence 697
al., 2018). Surface deformation relating to 11 SCR earth-
quakes has been imaged using InSAR (Table 1). Following
the launch of Sentinel-1A and Sentinel-1B missions in 2014
Event page (USGS for moment tensors) (last access: 23 June 2019)
and 2016, respectively, there is now a near-global coverage
https://earthquake.usgs.gov/earthquakes/eventpage/us2000hfcw
https://earthquake.usgs.gov/earthquakes/eventpage/us1000hpej
of SAR acquisitions every 12 d (https://sentinel.esa.int/web/
sentinel/missions/sentinel-1/overview, last access: 23 June
2019). The availability of this rich dataset has enabled global
https://earthquakes.ga.gov.au/event/ga2018wamvnf
systematic studies of earthquake detectability in InSAR data
https://earthquakes.ga.gov.au/event/ga2018sfzeme
https://earthquakes.ga.gov.au/event/ga2018ucpciy
(e.g. Barnhart et al., 2019; Funning and Garcia, 2019) and,
for the first time in an SCR setting, has allowed us to con-
struct coseismic interferograms for two events within the
same SCR seismic sequence.
For each of the two earthquake events we generated a co-
seismic interferogram from two Sentinel-1 interferometric
wide-swath SAR images (earthquake 1: 14 and 26 Septem-
ber 2018; earthquake 2: 1 and 13 November 2018) using a
standard interferometric SAR processing workflow imple-
mented with the Gamma software (Wegmüller and Werner,
1997). The topographic component of the phase signal was
Table 2. Selected source parameters and resource links for the three largest events in the Lake Muir earthquake sequence.
removed using a 1 arcsec Shuttle Radar Tomography Mis-
sion (SRTM) digital elevation model (Geoscience Australia,
2011), and the orbital component was removed using pre-
cise orbital ephemerides (POE) products. Each interferogram
was subsampled (multi-looked) eight times in range and two
5.71
4.6
5.40
Ml
times in azimuth to reduce phase noise. An adaptive spatial
filter (Goldstein and Werner, 1998) with exponent 0.5 was
5.32
5.19
Mw
applied to each interferogram to further reduce phase noise
prior to automatic unwrapping using a minimum-cost flow
Depth uncert.
(km)
1.92
1.90
1.46
algorithm (Costantini, 1998). The automatically unwrapped
interferogram for the September earthquake had significant
errors due to poorer phase coherence around the surface rup-
ture zone. A manual approach to unwrapping this interfer-
ogram was therefore applied using the branch-cut method
(Goldstein et al., 1988).
Depth
(km)
1.72
5.77
3.02
2.2 Field observation and UAV digital terrain models
Max horiz.
uncert. (km)
1.19
0.88
1.05
The epicentral regions of the earthquakes were visited over
3 d (12–14 November 2018), less than a week after the
November event. The scarp produced by the September event
was mapped, and evidence for rejuvenation of the scarp dur-
Longitude
116.7792
116.7988
116.7704
ing the November event was assessed. A hand trench was
excavated across the central section of the September scarp
to assess fault dip and displacement.
Because InSAR captures a single displacement vector in
Latitude
−34.4102
−34.3953
−34.4347
the radar line of sight (LOS) and commonly decorrelates in
regions close to earthquake surface ruptures where displace-
ment gradients exceed the Nyquist sampling rate or cause
pixels to no longer overlap (e.g. Hamling et al., 2017; Met-
16 September 2018
zger et al., 2017; Gold et al., 2019), it is desirable to ob-
8 November 2018
12 October 2018
tain independent validation data. In order to recover part of
Date (UTC)
the surface vertical deformation envelope associated with the
events, aerial photographs were acquired with a DJI Phan-
tom 4 unmanned aerial vehicle (UAV) in an approximately
500 m wide swath along a 2 km length of the September event
www.solid-earth.net/11/691/2020/ Solid Earth, 11, 691–717, 2020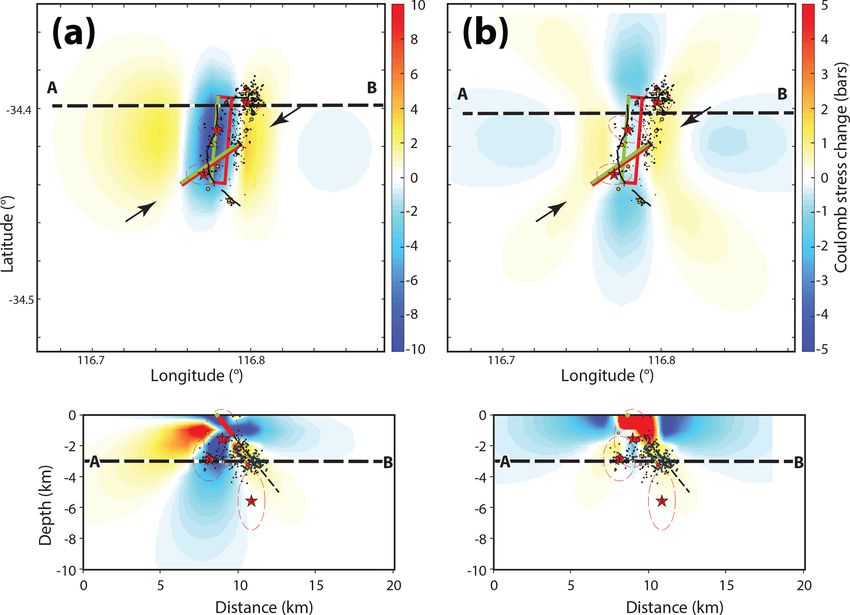
698 D. J. Clark et al.: Surface deformation relating to the 2018 Lake Muir earthquake sequence
scarp. An approximately 2 km long cross line was also flown, 2.3 Rapid deployment aftershock kits
extending eastward from the scarp across the region of most
significant surface deformation indicated in the InSAR im- Within 5 d of the 16 September event five seismic rapid de-
agery (Fig. 3). Ground control was provided by an RTK GPS, ployment kits (RDKs) and three GPS kits were deployed
with mean horizontal and vertical measurement uncertainties in the epicentral region (Fig. 2). The seismic sensors in-
of 0.026 ± 0.025 and 0.056 ± 0.055 m, respectively. A third cluded four short-period Lennartz LE-3Dlite seismometers
mission covered the southern extent of surface deformation and one Trillium Compact seismometer. The short-period in-
indicated in the InSAR imagery (Fig. 3). The results of this struments were paired with Nanometrics Titan accelerome-
mission are presented in the Supplement (Fig. S1). ters recording at 200 Hz to capture any strong ground mo-
The image dataset was processed using a structure-from- tions from the aftershock sequence. The RDK locations (pre-
motion (SfM) and multi-view stereo approach, implemented fixed LM on Fig. 2) were selected to maximize azimuthal
in the software Agisoft Photoscan Pro 1.4.3 (Agisoft LCC, coverage of the study area, taking into account the loca-
2018). The resulting dense point cloud achieved a stan- tion of one permanent Australian National Seismic Network
dard deviation of the location differences between it and (ANSN) station near Rocky Gully (RKGY), fortuitously lo-
the control points of 0.09 m in the horizontal and 0.01 m cated 24 km from the epicentre of the 16 September earth-
in the vertical, which is comparable to other studies us- quake. The network geometry also considered the capture of
ing similar ground control point (GCP) densities (e.g. Gin- ground-motion data at a range of source–receiver distances
draux et al., 2017). Several studies of factors impacting lo- for subsequent attenuation studies. One RDK (LM01) was
cal photogrammetry-derived digital terrain model (DTM) ac- deployed at the initial epicentral location of the 16 Septem-
curacy (e.g. Tonkin and Midgley, 2016; Gindraux et al., ber event. Waveform data were telemetered in real-time to
2017) report a vertical accuracy decrease of ∼ 0.1 m for ev- the National Earthquake Alerts Centre at Geoscience Aus-
ery 100 m increase in the distance to the closest GCP. In our tralia to support real-time aftershock detection and analysis.
study the maximum distance from a control point is on the The RDK locations therefore required adequate connection
order of 200–300 m. A 6 cm resolution DTM was produced to local 3G and 4G telecommunication networks. Additional
from the dense point cloud. factors considered in the deployment configuration were the
The elevation values from a lidar dataset collected by the local site geology, availability of sunlight to power the sen-
Western Australian Government Department of Biodiversity, sors and land access.
Conservation and Attractions in 2012 were subtracted from The three GPS kits were deployed on existing survey
the UAV DTM produced in this study, to produce a DTM of marks within a broader network covering the SWSZ, one
difference (DoD; Williams, 2012). The average magnitude of of which was last occupied in 2012. The survey marks used
the uncertainties associated with the elevation values for the (SWSZ45, SWSZ46 and SWSZ48) were approximately 36,
lidar dataset is reported as 0.063 ± 0.074 m. The combined 65 and 25 km away from the epicentral region, respectively
location uncertainty in the DoD might therefore be expected (Fig. 2). Processing of the acquired GPS data from the
to be on the order of 0.1–0.2 m. Details of the processing SWSZ46 site produced an anomalous vertical displacement
steps are presented in the Supplement. signal indicating 12 mm of subsidence. This signal could not
The focal mechanism computed for the September earth- be reconciled with the surface deformation related to the
quake (Fig. 2) indicates almost pure reverse motion. In this earthquakes, which was constrained to a near-field region
instance, the majority of landscape change would be ex- smaller than 10 km from the surface rupture (Fig. 2), and so
pected to be vertical and so detectable in the DoD. In con- it is not discussed any further here.
trast, the November earthquake was dominantly strike-slip
(Fig. 2). The deformation envelope detectible with the de-
ployed technologies should therefore relate almost exclu- 3 Results
sively to the September reverse faulting event, with further
deformation from the November event remaining largely un- 3.1 Field observations
detected. To quantify vertical surface displacement associ-
ated with the September earthquake, we extracted swath pro- Initial reports from local residents following the September
files through the DoD (and the unwrapped InSAR images) earthquake indicated the presence of west-facing fault scarps
parallel and perpendicular to the rupture using the swath intersecting several farm tracks (e.g. Fig. 4a), loss of ten-
profiler tool for Esri ArcGIS (Pérez-Peña et al., 2017). The sion in an east–west running fence line (GDA94/MGA50;
swath profiles sample the topography perpendicular to the 479590 m E, 6192140 m N) and cracking in farm dam walls
profile to a set on distance either side of the profile line. A related to lateral spreading (Fig. 4b). Field investigation
range of statistics (percentiles, quartiles and max/min/mean) demonstrated that the track intersections could be linked to
might then be assessed in order to account for the noisy char- form an approximately 3 km long, concave-to-the-east, west-
acter of the UAV-derived DTM. facing crescentic scarp (Fig. 3). In detail, the scarp comprises
a series of left- and right-stepping en échelon segments 100–
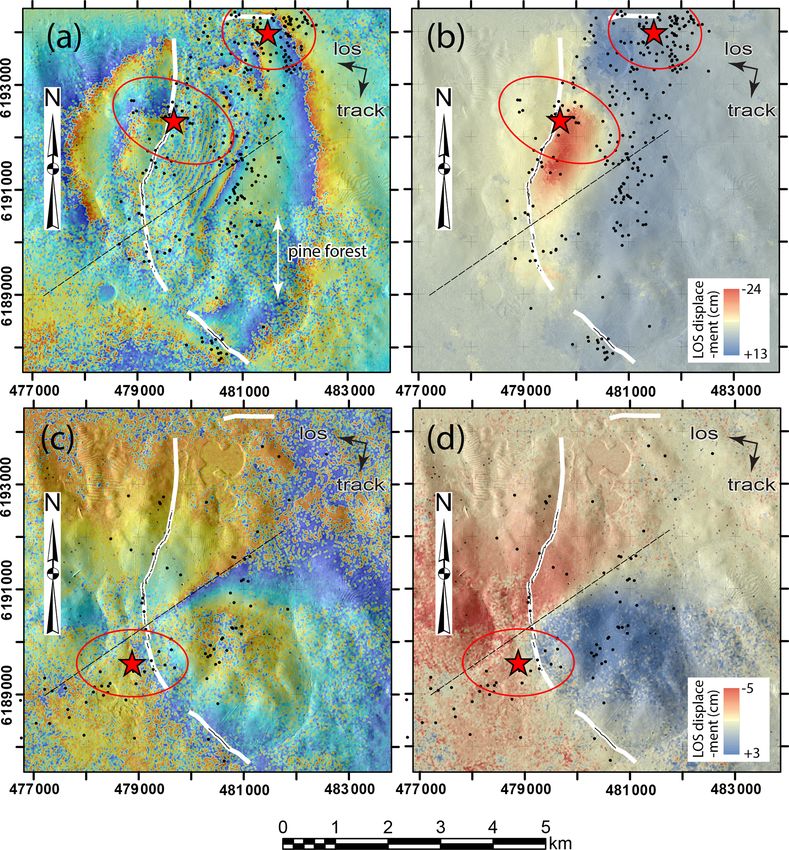
Solid Earth, 11, 691–717, 2020 www.solid-earth.net/11/691/2020/D. J. Clark et al.: Surface deformation relating to the 2018 Lake Muir earthquake sequence 699 200 m long. In the central 2 km of the scarp, each segment ers report that there was a “freshening” (rejuvenation) of the is associated with up to 20–40 cm of vertical displacement scarp at this location following the November event. The (Fig. 4c, d). The morphology of individual scarp segments presence of fine cracking details in November, given there show little evidence for a strike-slip component to motion, were significant rainfall events in October, support these varying between discrete thrust surface rupture with local anecdotes. The observations are consistent with a reverse fault-parallel folding and cracking and discrete thrust sur- oblique (sinistral) reactivation of this segment of the scarp. face rupture with mole tracks (cf. Lin et al., 2004) and exten- South of the track intersection, the scarp is lost in bushland. sional fissuring associated with topographic bulges. Where However, heavy tree limb fall and the occasional toppled tree the scarp crossed drainage lines, presumably associated with was observed along strike for a further ∼ 400 m to the south- metres of sandy alluvial sediments, it becomes a broad warp, east, suggesting strong localized ground shaking during the often associated with extensional fissuring parallel to the September event (Fig. 3). warp-crest and warp-perpendicular cracking at step overs. A hand trench 2.3 m long and 1.2 m deep was excavated 3.2 Wrapped and unwrapped Sentinel-1 perpendicular to the scarp trace at a location where the ver- interferograms for both events tical displacement was on the order of 0.3–0.4 m (Figs. 4c and 5). Here, the scarp has an average trend of 25◦ , and scarp The wrapped interferogram for the September event shows segments are right stepping (GDA94/MGA50; 479290 m E, an extent of surface deformation ∼ 12 km in an east–west di- 6191500 m N). The exposed stratigraphy consists of an ap- rection and ∼ 8 km in a north–south direction (Figs. 2, 6a). proximately 0.10–0.12 m thick organic-rich grey brown silty A linear surface deformation front relating to the rupture can sand overlying ∼ 0.4 m of pale grey medium sand that be- be traced for approximately 5 km. The central ∼ 3 km cor- comes pisolitic with depth (Fig. 5b, c). This layer in turn responds to the fault scarp mapped on the ground. The un- overlies an orange/red mottled grey clayey sand to the bot- wrapped interferogram (Fig. 6b) shows a broad shallow lobe tom of the trench. We interpret the profile to reflect an in of negative line of sight (LOS) change that extends from the situ weathering profile developed in Albany–Fraser Oro- west to the surface scarp (equivalent to ∼ 2.5 fringes in the gen bedrock. Approximately 0.18–0.20 m of the pre-event wrapped image). From the east, a broad shallow lobe of pos- organic-rich sandy soil had been over thrust along a 20◦ east- itive LOS change (∼ 2 fringes in the wrapped image) transi- dipping reverse fault that steepened to 30◦ towards the base tions to a tight (∼ 1.5 km wide) band of negative LOS change of the trench (Fig. 5c). A vertical scarp-parallel tension fis- characterized by at least 10 fringes. The images lose coher- sure ∼ 0.7 m east of the trench suggests that the fault dip ence in the 200–300 m east of the scarp and in proximity to steepens again at shallow depth (Fig. 4c). Drag of layering in Lake Noobijup (cf. Fig. 3). Coherence is also partly lost be- the hanging wall along the fault resulted in the formation of a neath an approximately 2 km wide (N–S) easterly trending prominent hanging-wall fold. The total vertical deformation band of pine forest (see Figs. 3 and 6a for location). at this site is shared approximately equally between discrete The unwrapped interferogram for the September event slip across the fault plane and folding. (Fig. 6b) shows a maximum LOS displacement towards the South of 479130 m E, 6191120 m N (GDA94/MGA50) the satellite of approximately 0.20–0.24 m along the eastern side scarp steps 50 m to the west, the general scarp strike is 355◦ , of the central ∼ 1.5–2.0 km of the scarp. These values are and scarp segments become left stepping. The scarp is as- approximately half of the maximum scarp height recorded sociated with a 0.2–0.3 m vertical landscape step which ex- by UAV field measurement and approximately one-third the tends some 400 m south from this location, before entering maximum magnitude of slip along the fault plane that might dense pine plantation and becoming difficult to follow due to be calculated from the trench exposure (see also next sec- extensive landscape disturbance (e.g. furrowing) and a thick tion). The southern 1.3 km of scarp mapped on the ground layer of organic matter cloaking the ground surface (Fig. 4d). occurs mainly beneath pine forest, and the unwrapping al- Within the pine forest, the scarp maintains a vertical displace- gorithm failed to reproduce measured scarp heights of 20– ment of 0.2–0.4 m, before stepping again 50 m to the west at 40 cm in this area. Similarly, the unwrapping algorithm per- 479190 m E, 6190050 m N (GDA94/MGA50). formed poorly in the swampy vegetated land proximal to The segments south of the step-over strike ∼ 340–350◦ Lake Noobijup. and decrease in vertical displacement from ∼ 0.3 to ∼ 0.1 m The hanging wall uplift diminishes to the east of the scarp at the most southerly intersection of the scarp with a and is fringed by a broad region of positive LOS change, farm track (GDA94/MGA50; 479320 m E, 6189440 m N). At corresponding to depression of the land surface. The deep- this track intersection, observed after the November event, est region of depression of the ground surface is centred on the scarp comprises dominant southeast-trending elements Lake Noobijup (∼ 13 cm LOS increase). This area also cor- which are locally offset (left stepping) across east-trending responds to the highest density of aftershocks following the lineaments. These become tensional fissures on the eastern September mainshock (Figs. 3 and 6b). The depressed region up-thrown side of the scarp. The vertical displacement across has well-defined northern and southern extents, terminating the scarp at this location is approximately 0.1 m. Landown- at east- and southeast-trending structures, respectively. The www.solid-earth.net/11/691/2020/ Solid Earth, 11, 691–717, 2020
700                             D. J. Clark et al.: Surface deformation relating to the 2018 Lake Muir earthquake sequence

Figure 4. Photographs of the surface rupture: (a) 13 cm high scarp crossing farm track. Photo taken by Roger Hearn on 27 September
2018. Looking north (479101 m E, 6190727 m N); (b) east-trending tension fissures relating to lateral spread into a farm dam (479588 m E,
6192126 m N); (c) 40 cm high scarp and hanging wall tension fissure at the hand trench location (see Fig. 5). Looking north (479285 m E,
6191496 m N); (d) 40 cm high scarp in pine plantation. Looking northeast (479112 m E, 6190422 m N). GD94/MGA50.

Figure 5. Hand trench location (479285 m E, 6191496 m N; GDA94/MGA50). (a) Subset of the photogrammetrically-derived UAV DTM (see
Fig. 3 for full footprint), with topographic section indicated by the black line. Colour drape has been tilted to remove regional topographic
slope and enhance relative differences. (b) Photomosaic of the north wall of the hand trench showing folded and displaced strata and
(c) interpretation of stratigraphy and structure of the north wall of the hand trench.

Solid Earth, 11, 691–717, 2020                                                                       www.solid-earth.net/11/691/2020/
D. J. Clark et al.: Surface deformation relating to the 2018 Lake Muir earthquake sequence                                           701

Figure 6. Phase images and images of the unwrapped InSAR line of sight (LOS) displacement field for the (a, b) September Mw 5.3 and
(c, d) November Mw 5.2 events. The location of the surface rupture relating to the September event is shown as a white line, with a black
dashed line showing where the scarp was observed in the field. The surface deformation front relating to the November event is shown as a
dashed black line. Refer to Fig. 2 for focal mechanisms. Seismicity before and after the November event is shown black dots in panels (a)
and (b) and (c) and (d), respectively. The mainshocks are shown as red stars. Each fringe in panels (a) and (c) represents 2.8 cm of LOS
range change. Note several unwrapping errors are evident as regions bound by a step jump at the northern and southern end of the scarp in
panel (b). The north–south extent of an easterly trending band of pine forest associated with degradation of coherence is indicated with a
white arrow in panel (a).

areal extent of the depressed region is surprisingly large for         dislocation model (Okada, 1985) suggests that a discrete sur-
a reverse fault rupture (cf. King et al., 1988; Ellis and Dens-        face rupture may not have been produced (i.e. the rupture
more, 2006).                                                           tip remained buried) (Fig. S4). Indeed, structures unambigu-
   The InSAR images for the November event (Fig. 6c, d) ex-            ously relating to the main rupture were not observed in the
hibit the classic quadrupole pattern of an almost pure strike-         field. Potential evidence for secondary surface deformation
slip rupture and are consistent with a maximum of ∼ 5–8 cm             relating to the main failure plane of this event was seen as
of right lateral slip having occurred at the surface relating          a series of fresh-looking east-trending left-stepping dilata-
to rupture of a northeast-trending, steeply northwest dipping          tional cracks expressed in a boundary track at 478970 m E,
fault. This contrasts with the focal mechanism for the event,          6190390 m N (GDA94/MGA50). No vertical displacement
which suggests an oblique compressive rake (Fig. 2). Al-               was observed to be associated with these features.
though the deformation pattern shows a sharp linear discon-               The deformation pattern relating to the November event is
tinuity for ∼ 1 km to either side of the intersection of the           also seen to be influenced by the northwest-trending struc-
November failure plane with the September rupture plane,               ture that forms the southern termination of the September
simple forward modelling using a finite rectangular elastic            event. This lineament is discernible in the November event

www.solid-earth.net/11/691/2020/                                                                      Solid Earth, 11, 691–717, 2020
702                            D. J. Clark et al.: Surface deformation relating to the 2018 Lake Muir earthquake sequence

unwrapped InSAR from the intersection of the surface pro-            subtle (≤ 5 cm high) linear topographic feature, extending
jection of the rupture planes to approximately 1.8 km south-         over ∼ 560 m, which was coincident with the surface dis-
east (Fig. 6d). Minor reverse-oblique movement on this struc-        placement implied by the InSAR data (Fig. 7b).
ture during the November event may have been responsible
for the reports of a local freshening of the September scarp.
                                                                     3.4   Mainshock and aftershock relocation
3.3   Comparison of UAV-derived and InSAR-derived
      deformation surfaces                                           In the period from 16 September to 23 November, 884 earth-
                                                                     quakes were recorded by stations from the permanent ANSN
Part of the vertical displacement envelope resulting from            network and the five rapid-deployment aftershock kits tem-
the September earthquake was recovered by differencing the           porarily installed in the epicentral region. These events in-
DTM acquired by UAV and the 2012 lidar dataset (Fig. 7; see          clude the largest aftershock (12 October, Ml 4.6) and the
Sect. 2.2 and the Supplement for methods). Scarp-parallel            November Mw 5.2 event. Initial locations for these events
and scarp-perpendicular profiles through the resulting DTM           were computed using the SeisComP3 seismological software
of difference (DoD) ubiquitously show a larger displacement          (Weber et al., 2007) and the LocSAT location algorithm
magnitude than the InSAR-derived LOS displacement esti-              (Bratt and Bache, 1988). P- and S-wave arrival times were
mates (Fig. 7b, c). However, the general form of the two de-         manually picked and reviewed by Geoscience Australia seis-
formation envelope estimates is consistent. A broad uplifted         mic analysts. The mean location uncertainties in this dataset
region to the east of the scarp trace in the DoD corresponds to      were found to be 3.39 km in the horizontal direction and
the area of greatest uplift evident in the InSAR data (Fig. 7a).     2.33 km in the up direction. To better constrain the location
Further, the InSAR LOS phase image indicates that the east-          and pattern of aftershocks, events from this dataset were in-
ern end of the DoD profile is located in a broad region of           put for relocation using the HypoDD double-difference rel-
topographic depression relative to the far field (∼ 2 fringes),      ative location algorithm (Waldhauser and Ellsworth, 2000),
while the western end is raised relative to the far field (∼ 2.5     implemented in the software hypoDDpy (Krischer, 2015)
fringes) (cf. Fig. 7c blue line and Figs. 6a and b). This is re-     (see the Supplement for detail). The HypoDD algorithm min-
flected in a ∼ 0.3 m vertical difference between eastern and         imizes errors in hypocentral locations that are commonly at-
western ends of the UAV DoD profile.                                 tributed to uncertainties in Earth structure along the event-
   Importantly, the UAV DoD captures deformation close to            station ray path. The final relocation included a subset of 470
the scarp trace where the InSAR images lose coherence. For           events from this catalogue (Figs. 3 and S2). The mean loca-
example, the InSAR data did not image a ∼ 0.1 m deep foot-           tion uncertainties in the relocated dataset were found to be
wall depression that occurs within ∼ 100 m to the west of            63, 116 and 228 m in the east, north and up directions, re-
the scarp trace. Along the ∼ 2 km length of scarp that was           spectively.
covered by the UAV DoD, the average height of the scarp,                Both the largest aftershock (Ml 4.6) and the November
as measured along a 100 m wide swath profile (Fig. 7b),              Mw 5.2 event did not meet criteria for relocation in Hy-
is 0.46 ± 0.11 m. The landscape dislocation is shown to be           poDD using nearby seismic stations. However, both events
sharpest in the ∼ 10–30 m east of the scarp trace and con-           were clearly recorded with good azimuthal coverage at re-
sistent in magnitude with that measured by RTK GPS at the            gional and teleseismic distances. Based on waveforms from
location of the trench (cf. Figs. 5 and 7c). The topography          19 stations in Australia, Antarctica, Kazakhstan, Mongolia
then continues rising at a lower rate to a maximum vertical          and Thailand a separate relative location of these two events
displacement within ∼ 200 m east of the scarp trace, before          was calculated, together with the September Mw 5.3 main-
falling relatively smoothly over a kilometre (Fig. 7c). The          shock, by manually aligning the distant waveforms and per-
fact that uplift associated with the fault tip is distributed over   forming a joint hypocentre determination (Pujol, 2000; Fisk,
the ∼ 200 m east of the scarp trace suggests that the scarp-         2002; see the Supplement for detail). The September and
parallel DoD swath profile, spot measurements of scarp               November earthquakes were then anchored to the Ml 4.6 af-
height (green dots in Fig. 7b) and the two-dimensional UAV           tershock location, which was well constrained in an absolute
profiles (red dots in Fig. 7b) all underestimate total vertical      sense, as it occurred within ∼ 0.6 km of the LM01 seismo-
deformation to some degree. A similar result was derived             graph station. In this way a better estimation of the absolute
for the 2018 Petermann Ranges earthquake surface rupture             location of the point of initiation for both the September and
(Gold et al., 2019).                                                 November earthquakes was produced (Table 2). For calcu-
   No surface expression or ground cracking was observed             lations, the depths for all three events were fixed to 2 km.
on the ground along the southeast-trending feature imaged            This is justified in that the calculations were performed us-
in the InSAR-derived LOS displacement data at the south-             ing P phases from regional and teleseismic stations, so the
ern end of the September rupture (cf. Fig. 6b). However, a           epicentral solutions are fairly insensitive to depth. The depth
DoD constructed over the area (see Fig. 7a for mission out-          estimates presented in Table 2 relate to the initial locations
line and Fig. S1 for results) revealed the presence of a very        calculated using the permanent ANSN network, which was

Solid Earth, 11, 691–717, 2020                                                                 www.solid-earth.net/11/691/2020/
D. J. Clark et al.: Surface deformation relating to the 2018 Lake Muir earthquake sequence 703 Figure 7. Relative coseismic displacement swath profiles through UAV and InSAR data. (a) Location of scarp parallel and perpendicular swath profiles. Mapped scarp elements are shown in red. Length-weighted rose diagrams (north up) show orientation of scarp elements. The extents of the UAV surveys are shown as black outlines. UAV DTM differenced against lidar is shown over main scarp segment (blues are small; greys are large). Location and uncertainty ellipse for the September Mw 5.3 event is shown with a star and red dashed line, respectively. Base map is the InSAR phase image for the September event over lidar (datum/projection in GDA94/MGA50); (b) scarp-parallel profiles. UAV profiles sample a 100 m wide swath centred on the profile line and plot relative vertical displacement. The 90th percentile minus the 10th percentile value elevation value is plotted to reduce noise in the UAV data resulting from the difficulty in removing low vegetation inherent to structure from motion DTMs. UAV two-dimensional profiles plot the vertical displacement measured from single profile lines through small area UAV DTMs flown along forest trails. Spot heights were measured visually with a tape measure where the forest was too dense for other techniques to be used. InSAR swath profiles are collocated with the UAV profile lines and sample 300 m to either side of the profile line. These plot relative LOS displacement, calculated as the difference between the maximum and the minimum value in each scarp-perpendicular swath. (c) First to third quartile range of a scarp-perpendicular swath profile through the UAV data is plotted along with the mean value to demonstrate the precision of the UAV data. Variation in LOS displacement for the collocated unwrapped InSAR profile is not resolvable at the scale of the figure, so the maximum value sampled by each scarp-parallel swath is plotted. Zero relative displacement is arbitrarily pinned to the eastern end of the profile in part. supplemented by the five rapid deployment aftershock kits ber mainshocks are located predominantly east of the line for the latter two events. of the surface rupture (Fig. 6a, b). The associated hypocen- The relocated position of the September Mw 5.3 epicentre tres occur between ∼ 1.5 and 4 km depth and below a plane is seen to coincide with the region of most prominent sur- extending from the trailing edge of the surface rupture dip- face uplift imaged in the unwrapped InSAR image (Fig. 6b) ping at 50◦ to the east (Fig. 8). Considerations of the preser- and the greatest scarp height (Fig. 7a). Aftershock epicentres vation of seismic moment (i.e. M0 = shear modulus × fault occurring in the interval between the September and Novem- area × average displacement; Hanks and Kanamori, 1979) www.solid-earth.net/11/691/2020/ Solid Earth, 11, 691–717, 2020
704                             D. J. Clark et al.: Surface deformation relating to the 2018 Lake Muir earthquake sequence

Figure 8. Coulomb stress changes resulting from the September Mw 5.3 event (upper panels show a horizontal section at 3 km depth,
and lower panels show a vertical section along the line A–B), (a) resolved for reverse faults parallel to the November rupture plane and
(b) resolved for optimally oriented strike-slip faults. The rupture area was modelled as being 5.0 km long by 1.17 km wide to constrain seismic
moment and slip and 50◦ east-dipping, consistent with the USGS focal mechanism for the event (Fig. 2, Table 2). Relocated hypocentres
prior to the November mainshock are projected onto the horizontal plane in the upper panels, and onto the vertical A–B section plane in the
lower panels (see Fig. 3 for seismicity legend). Black line is the surface deformation trace interpreted from ground observations and InSAR
data. Black arrows in the upper panels point to the position of the November Mw 5.3 strike-slip event rupture plane.

suggest that the September rupture is unlikely to have ex-                tent with the USGS focal mechanism for the event (Table 2),
tended beyond ∼ 1 km depth, implying that few if any of the               and with field data and modelling of the compressional re-
aftershocks nucleated on the rupture plane. This is particu-              activation of reverse faults (Sibson et al., 2012). The value
larly the case for the largest aftershock (Ml 4.6) – the uncer-           is significantly different to the 30◦ dipping rupture plane ex-
tainty ellipse for this event occurs almost entirely below the            posed in the trench. We reconcile the two values in that the
depth of other aftershocks. A linear cluster of hypocentres               near surface may not be a good indicator of the fault dip at
is located directly below the southeastern end of the rupture,            depth (cf. King et al., 2019, Fig. 4). This is supported by the
parallel to the northwest–southeast oriented southern termi-              prominent tension fissure east of the scarp at the trench lo-
nal structure at the surface (Fig. 6b). Similarly, a loose clus-          cation, which indicates a steeper rupture dip at depth at least
ter of hypocentres, including the Ml 4.6 aftershock, underlies            locally (Fig. 4c). As the focal mechanisms of the aftershocks
the east–west-trending valley bounding the northern end of                are not known, results are presented with stresses resolved
the reverse rupture imaged in the InSAR data (Figs. 3 and                 for both reverse and strike-slip (Fig. 8a and b, respectively).
6a). Steep dips for terminal structures at the northern and               In both cases, increases in Coulomb stress are modelled to
southern ends of the reverse rupture are consistent with their            have occurred down dip of the trailing edge of the rupture
orientation at a low angle to the easterly maximum horizon-               plane and to a lesser degree in the footwall block at depth.
tal compression direction (SHmax ) of the extant crustal stress           The majority of aftershock hypocentre locations show excel-
field (cf. Rajabi et al., 2017b).                                         lent correlation with the volume of increased Coulomb stress
   The central ∼ 5 km of the September rupture, where the                 downdip of the rupture plane. Hypocentres in the footwall
most significant surface displacement was observed, was                   block only occur in regions of increased Coulomb stress if
modelled for Coulomb stress changes (e.g. Lin and Stein,                  it is resolved for optimal strike-slip faults (Fig. 8b). A broad
2004; Toda et al., 2005) (Fig. 8; see the Supplement for de-              region of shallow stress relief above the trailing edge of the
tail of method and parametrization). A dip of 50◦ to the east             rupture corresponds with a landscape depression imaged in
was assigned to the rupture for modelling purposes, consis-               the InSAR (cf. Fig. 6b).

Solid Earth, 11, 691–717, 2020                                                                        www.solid-earth.net/11/691/2020/
D. J. Clark et al.: Surface deformation relating to the 2018 Lake Muir earthquake sequence                                   705

   As mentioned in Sect. 3.2, simple forward modelling using     Lake Muir earthquake, where only descending-pass Sentinel-
a finite rectangular elastic dislocation model (Okada, 1985)     1 SAR data are available. Displacement measurements de-
(Fig. S4) suggests that a discrete surface rupture may not       rived from InSAR analysis of this data must therefore be
have been produced during the November strike-slip event.        interpreted in the LOS, and horizontal and vertical signals
Based upon the InSAR surface deformation envelope (cf.           cannot be unambiguously separated.
Fig. 6c), a rupture ∼ 4 km long and extending from 1.0 to           This is problematic when attempting to reconcile the
2.5 km depth is preferred (Figs. S3 and S4). If Coulomb          single-geometry InSAR LOS data with the absolute elevation
stress changes resulting from the September rupture are re-      changes captured by the UAV (e.g. Fig. 7b and c). However,
solved for optimally oriented strike-slip receiver faults, the   the descending orbit of the Sentinel-1 data used here has a
plane of the November rupture is seen to be positively           ground azimuth of 196◦ , and the SAR sensor looks perpen-
stressed over more than half of its area (Fig. S4b). The case    dicularly to the right of this orbit direction (i.e. 286◦ ). The
might then be made that the November event was triggered         LOS of the SAR sensor is very close to the P axis of the focal
by static stress changes associated with the September event     mechanism of the September earthquake (288◦ ). If the earth-
(cf. Mohammadi et al., 2019). However, additional factors        quake resulted in almost pure thrust motion along the line
may be involved as the stress increase is only on the order      of the P axis, as suggested by the focal mechanism (±10◦ ),
of 0.1–0.2 MPa in the region of nucleation of the November       the single InSAR viewing geometry should be sensitive to
earthquake.                                                      the full surface deformation field. The geometry problem is
   The November Mw 5.2 mainshock is located within a dif-        thus reduced approximately to a vertical plane containing the
fuse elongated cluster of dependant aftershock hypocentres       LOS vector and the slip vector.
at ∼ 3–4 km depth, which trends parallel to the northeast–          We use the above understanding to empirically derive a
southwest orientation of the surface deformation front im-       multiplicative factor of 2.75, which produces a generally
aged in the InSAR data, offset to the southeast by 0.25–         good match between the forms of both scarp-perpendicular
1.5 km (Figs. 6c, d). Hypocentres predominantly occur at         and scarp-parallel InSAR LOS and UAV vertical displace-
a greater depth than the preferred November event rupture        ment profiles (Fig. 7b and c, dashed black lines). This factor
plane (Fig. S4b).                                                is consistent with our assumption of a 50◦ fault dip, given the
                                                                 ∼ 41◦ side-look angle of the Sentinel-1 sensor at our field
                                                                 location. It is useful to apply this factor to “correct” the In-
4     Discussion                                                 SAR profile to enable a comparison of the UAV and InSAR
                                                                 data. There are two locations on the profiles where the match
4.1     Characteristics of the Lake Muir surface rupture
                                                                 is poor. Firstly, the corrected InSAR LOS profile underesti-
        sequence
                                                                 mates the vertical displacement compared to the UAV profile
The comparison of field observations, InSAR imagery and          from 2750 to 3250 m along the profile in Fig. 7b. This region
aftershock earthquake catalogue has permitted exploration        corresponds to a 50 m left step in the scarp and a 25◦ change
of the surface and subsurface deformation field related to the   in strike direction (Fig. 7a). The assumption that the InSAR
Lake Muir earthquake sequence in unprecedented resolution.       LOS direction is parallel to the slip vector breaks down here.
The September rupture, as mapped using traditional palaeo-       Secondly, the InSAR profile has not resolved the narrow foot-
seismological means, is revealed to be part of a more exten-     wall depression that is apparent in the UAV DoD (Fig. 7c).
sive deformed region, involving both uplift and depression       Much of the region occupied by the proximal footwall was
of broad areas proximal to the surface rupture. Furthermore,     masked as the result of lack of coherence of the InSAR sig-
the spatial and temporal relationship between September and      nal.
November Mw > 5.0 events reveals a dependency with im-
plications for how other earthquake swarms could be inter-       4.1.2   Character of surface deformation
preted.
                                                                 The average magnitude of vertical surface deformation along
4.1.1    Reconciling UAV vertical displacement and               the discrete surface rupture trace, as indicated by the UAV
         InSAR LOS displacement measurements                     DoD data, and locally validated by the corrected InSAR LOS
                                                                 displacement profile (Fig. 7b), is 0.46 ± 0.11 m over the cen-
InSAR measures displacement in the one-dimensional LOS           tral 2 km of the rupture. The corrected InSAR LOS displace-
of the SAR sensor. Three-dimensional displacements of the        ment profile suggests that displacement tails off smoothly to
ground surface are therefore mapped into a one-dimensional       the north from this central plateau (Fig. 7b). To the south of
geometry. If InSAR data from different viewing geometries        the central plateau, there is a step to higher vertical displace-
(e.g. ascending and descending orbital passes of the SAR         ment where the scarp changes orientation (2750–3250 m
satellite) are available, then vertical and horizontal com-      along the profile) and then a fall to the southern extremity.
ponents of displacement can be resolved (Fuhrmann and            The exact shape of the southern tail, defined by point mea-
Garthwaite, 2019). Unfortunately, this is not the case for the   surements and two-dimensional UAV profiles, is largely ob-

www.solid-earth.net/11/691/2020/                                                               Solid Earth, 11, 691–717, 2020
You can also read