TROPOMI ATBD of the total and tropospheric NO2 data products
←
→
Page content transcription
If your browser does not render page correctly, please read the page content below
TROPOMI ATBD of the
total and tropospheric
NO2 data products

document number                 : S5P-KNMI-L2-0005-RP
authors                         : J.H.G.M. van Geffen, H.J. Eskes, K.F. Boersma and J.P. Veefkind
CI identification               : CI-7430-ATBD
issue                           : 2.2.0
applicable to processor release : 1.4.0 & 2.2.0
date                            : 2021-06-16
status                          : released
TROPOMI ATBD tropospheric and total NO2                                       S5P-KNMI-L2-0005-RP
issue 2.2.0, 2021-06-16 – released                                                    Page 2 of 86

Document approval record
This document was prepared by J.H.G.M. van Geffen, H.J. Eskes, K.F. Boersma and J.P. Veefkind. It was
checked by S. Beirle, A. Richter, B. Sanders.
TROPOMI ATBD tropospheric and total NO2 S5P-KNMI-L2-0005-RP
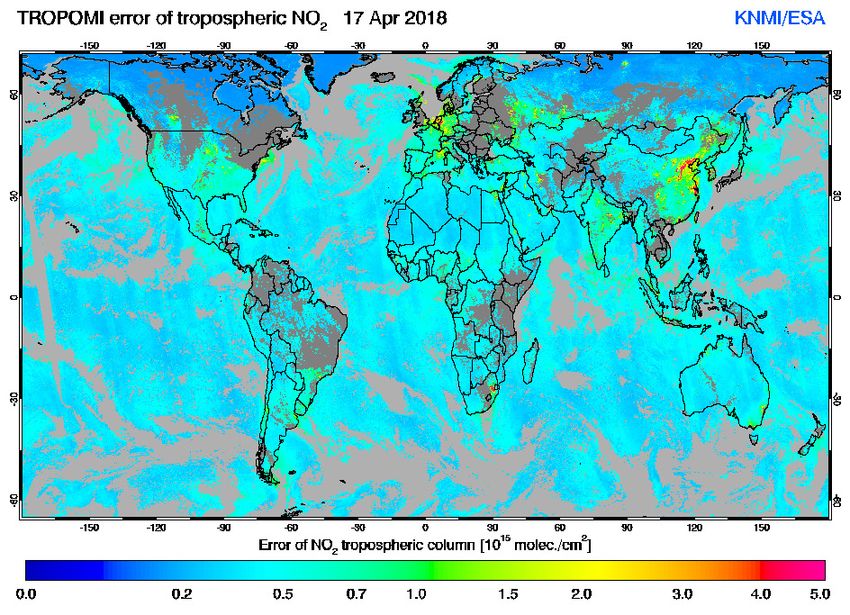
issue 2.2.0, 2021-06-16 – released Page 3 of 86
Document change record
issue date item comments
0.0.1 2012-08-17 All Initial draft version
0.0.2 2012-09-12 All Major reordering, adding text and references throughout
0.0.3 2012-09-26 6.1–6.2 Several small corrections and additions
7.1–7.2
0.1.0 2012-09-26 — First official release
0.2.0 2012-11-15 5.1–5.4 Large number of updates throughout the text after internal
6.1–6.2 reviewing by the TROPOMI Level-2 Working Group
0.2.1 2013-04-10 5, 6, 7 Document number corrected, reorganisation of Sect. 6; removal of
the discussion on an alternative retrieval approach; various minor
corrections, updates and additions
0.2.2 2013-06-03 5, 6, 7 Major updates and further reorganisation of Sect. 5–7
8, 9, 10 first versions of Sect. 8–10
0.3.0 2013-06-04 — Release for Level-2 Working Group review
0.3.1 2013-06-19 5.1–5.3 Correction and additions resulting from v0.3.0 internal Level-2
6.2–6.6 Working Group review, and other minor corrections and additions
7.3–7.5
8.4, 9.2
0.5.0 2013-06-20 — Release for external review
0.5.1 2013-09-05 5.1–5.2 First round of updates taking into account comments and
6.1–6.6 suggestions of the reviewers of version 0.5.0
7.2, 7.5
0.5.2 2013-11-21 5.5 Further updates in view of the reviewers comments, and providing
6.2–6.7 more details regarding the fit procedure and the processing chain
7.1, 7.2
8.2, 8.3
0.9.0 2013-11-27 — Release to ESA and external reviewers
0.9.1 2014-03-17 4. Instrument overview section now in separate document; section num-
bering of this document unchanged to maintain change record
0.9.2 2014-04-07 6.2 Some small typographic corrections and updates
0.10.0 2014-04-15 — Release to ESA
0.10.1 2014-09-19 6.1–6.6 Minor updates and corrections in text and tables; old Sects. 6.5 and
6.7 combined; Sects. 6.6 updated; references updated.
7.1–7.4 Descriptions updated and tables of input and output data added.
Notation of variables improved or clarified in view of the IODD [RD1].
0.10.2 2014-09-25 6.6 Table added with overview user applications and data the users need
0.11.0 2014-10-02 — Release to ESA
0.11.1 2015-08-27 6.4.1 Update of AMF look-up table entries
6.4.4.1 Update text regarding using cloud fraction from NO2 spectral window
6.6, 7.4 Minor updates in product data set tables, incl. dataset units
0.13.0 2015-09-14 — Limited release to S5P Validation Team
0.13.1 2015-12-08 6.2, 7.5 Minor textual corrections
7.1 Correction of units of input datasets
0.14.0 2015-12-11 — Release to ESA
0.14.1 2016-01-21 6.4.2 Temperature correction equation updated
6.4.6 Description of de-striping implementation clarified
TROPOMI ATBD tropospheric and total NO2                                             S5P-KNMI-L2-0005-RP
issue 2.2.0, 2021-06-16 – released                                                          Page 4 of 86

Document change record – continued
 issue   date         item      comments
 1.0.0   2016-02-05   —         Public release
 1.0.1   2017-01-31   All       Corrections and additions in response to internal review comments
 1.0.2   2017-06-13   A–D       Appendices added
 1.0.3   2017-07-13   All       Finalising the corrections and additions
 1.1.0   2017-08-16   —         Updated public release for commissioning phase (E1)
 1.1.1   2018-02-02   6.2       Formulation of the Ring term to match operational implementation
                      6.2       Improved description of the wavelength calibration
                      6.2.3     New section with text from main section to improve readability
                      6.4.6     Expanded description of a possible de-striping algorithm
                      7.4       Updated detailed product overview table to match output product
 1.1.2   2018-05-31   6.2       Updated to match the operational implementation
                      C, D      Updated to match the operational implementation
                      E         Appendix on the qa_value definition added
 1.1.3   2018-06-08   5–9       Many textual corrections and improvements to match the operational
                                implementation and to incorporate results based on the TROPOMI
                                measurements from the commissioning phase
 1.2.0   2018-06-11   —         Release for operational phase (E2)              processor version 1.0.0
 1.2.1   2018-10-15   —         Version with main text changes v1.1.0 to v1.2.0 marked for reviewers
 1.2.2   2018-11-08   —         Figures 1, 3, 5, 7, 24 redone using TROPOMI data
                      5.4       Text and Table updated
                      5.6       Text updated and Table 2 added
                      6.3.1     Text on updates in TM5-MP and Figure 8 added
                      6.4.6     Text on de-striping expanded and Figure 17 added
                      6.6       Improved treatment of snow/ice cases described and Figure 21 added
                      7.4       Tables 11 and 12 updated to include stripe amplitude
                      8.2       Text updated and superfluous figure removed
                      E         Updated qa_value for treatment of snow/ice cases (cf. Sect. 6.6)
                      —         Further textual updates
 1.3.0   2018-11-08   —         Release                                         processor version 1.2.0
 1.3.1   2019-01-31   6.4.4.1   Text on treatment of cloud data improved; Figure 10 added
                      6.6       Product overview Table 5 and product usage Table 6 updated
                      7.4       Detailed product overview Table 11 updated
                      E         Updated qa_value for M trop /M geo threshold
                      —         Further minor textual updates and corrections
 1.4.0   2019-02-06   —         Release                                         processor version 1.3.0
 1.4.1   2019-04-15   6.2 & F   Added description of removal of outliers from the DOAS fit residual
                      C         Description on limiting cloud fraction to [0 : 1] added
                      E         Updated qa_value for solar_eclipse
 1.4.2   2019-10-02   —         Remarks and suggestions from A. Richter & S. Beirle addressed
 1.4.3   2019-10-03   6.2       Section structure modified to improve readability
                      9         Section on Validation restructured
                      —         Further textual updates and corrections
 1.5.0   2019-10-03   —         Release to ESA for review
 2.0.0   —            —         Not released: no processor update implemented
TROPOMI ATBD tropospheric and total NO2                                         S5P-KNMI-L2-0005-RP
issue 2.2.0, 2021-06-16 – released                                                      Page 5 of 86

Document change record – continued
 issue   date         item    comments
 2.0.1   2020-02-19   —       Textual updates in view of processor version changes
                      6.4.4   Usage of ECMWF snow/ice flag & impact of FRESCO update
 2.0.2   2020-03-10   —       Textual updates addressing remarks from ESA on v1.5.0
 2.0.3   2021-01-21   —       Minor updates and corrections & digital signatures (page 2) removed
 2.0.4   2021-02-24   5.1     General NO2 description expanded
                      5.6     Version history expanded, including note on data change
                      6.4     Several subsections finetuned and expanded
                      6.4.4   Subsection on the FRESCO-wide update added
                      6.6     Product description and usage updated
                      7.1–4   Feasibility expanded and updated where needed
                      9.1–4   Vaidation discussion updated where needed
 2.1.0   2021-02-24   —       Release to ESA for review
 2.1.1   2021-04-15   All     Minor updates after review and other textual improvements
                      6.4.4   Section on cloud data reorganised and somewhat extended
 2.1.2   2021-04-20   9.1–4   Validation sections reorganised and shortend
 2.1.3   2021-06-15   —       Details finalised
 2.2.0   2021-06-16   —       Release                             processor versions 1.4.0 & 2.2.0
TROPOMI ATBD tropospheric and total NO2                                                                                                                                       S5P-KNMI-L2-0005-RP
issue 2.2.0, 2021-06-16 – released                                                                                                                                                    Page 6 of 86

Contents
Document approval record . . . . . . . . . . . . . . . . . . . . . . . . . . . . . . . . . . . . . . . . . . . . . . . . . . . . . . . . . . . . . . . . . . . . . . . . . . . . . . . .                           2
Document change record . . . . . . . . . . . . . . . . . . . . . . . . . . . . . . . . . . . . . . . . . . . . . . . . . . . . . . . . . . . . . . . . . . . . . . . . . . . . . . . . . .                         3
List of Tables . . . . . . . . . . . . . . . . . . . . . . . . . . . . . . . . . . . . . . . . . . . . . . . . . . . . . . . . . . . . . . . . . . . . . . . . . . . . . . . . . . . . . . . . . . . . . . . .      7
List of Figures . . . . . . . . . . . . . . . . . . . . . . . . . . . . . . . . . . . . . . . . . . . . . . . . . . . . . . . . . . . . . . . . . . . . . . . . . . . . . . . . . . . . . . . . . . . . . . .       7
1                   Introduction to the document . . . . . . . . . . . . . . . . . . . . . . . . . . . . . . . . . . . . . . . . . . . . . . . . . . . . . . . . . . . . . . . . . .                               9
1.1                 Identification . . . . . . . . . . . . . . . . . . . . . . . . . . . . . . . . . . . . . . . . . . . . . . . . . . . . . . . . . . . . . . . . . . . . . . . . . . . . . . . . . . . . . . .   9
1.2                 Purpose and objective . . . . . . . . . . . . . . . . . . . . . . . . . . . . . . . . . . . . . . . . . . . . . . . . . . . . . . . . . . . . . . . . . . . . . . . . . . . .                  9
1.3                 Document overview . . . . . . . . . . . . . . . . . . . . . . . . . . . . . . . . . . . . . . . . . . . . . . . . . . . . . . . . . . . . . . . . . . . . . . . . . . . . . . .                9
1.4                 Acknowledgements . . . . . . . . . . . . . . . . . . . . . . . . . . . . . . . . . . . . . . . . . . . . . . . . . . . . . . . . . . . . . . . . . . . . . . . . . . . . . . .                 9
2                   Applicable and reference documents . . . . . . . . . . . . . . . . . . . . . . . . . . . . . . . . . . . . . . . . . . . . . . . . . . . . . . . . .                                           10
2.1                 Applicable documents . . . . . . . . . . . . . . . . . . . . . . . . . . . . . . . . . . . . . . . . . . . . . . . . . . . . . . . . . . . . . . . . . . . . . . . . . . . .                   10
2.2                 Standard documents . . . . . . . . . . . . . . . . . . . . . . . . . . . . . . . . . . . . . . . . . . . . . . . . . . . . . . . . . . . . . . . . . . . . . . . . . . . . . .                 10
2.3                 Reference documents . . . . . . . . . . . . . . . . . . . . . . . . . . . . . . . . . . . . . . . . . . . . . . . . . . . . . . . . . . . . . . . . . . . . . . . . . . . .                    10
2.4                 Electronic references . . . . . . . . . . . . . . . . . . . . . . . . . . . . . . . . . . . . . . . . . . . . . . . . . . . . . . . . . . . . . . . . . . . . . . . . . . . . .                11
3                   Terms, definitions and abbreviated terms . . . . . . . . . . . . . . . . . . . . . . . . . . . . . . . . . . . . . . . . . . . . . . . . . . . .                                               13
3.1                 Terms and definitions . . . . . . . . . . . . . . . . . . . . . . . . . . . . . . . . . . . . . . . . . . . . . . . . . . . . . . . . . . . . . . . . . . . . . . . . . . . . .                13
3.2                 Acronyms and abbreviations . . . . . . . . . . . . . . . . . . . . . . . . . . . . . . . . . . . . . . . . . . . . . . . . . . . . . . . . . . . . . . . . . . . . .                           13
4                   TROPOMI instrument description . . . . . . . . . . . . . . . . . . . . . . . . . . . . . . . . . . . . . . . . . . . . . . . . . . . . . . . . . . . . .                                       14
5                   Introduction to the TROPOMI NO2 data products . . . . . . . . . . . . . . . . . . . . . . . . . . . . . . . . . . . . . . . . . . .                                                            15
5.1                 Nitrogen dioxide in troposphere and stratosphere . . . . . . . . . . . . . . . . . . . . . . . . . . . . . . . . . . . . . . . . . . . . . .                                                   15
5.2                 NO2 satellite retrieval heritage . . . . . . . . . . . . . . . . . . . . . . . . . . . . . . . . . . . . . . . . . . . . . . . . . . . . . . . . . . . . . . . . . . .                         17
5.3                 Separating stratospheric and tropospheric NO2 with a data assimilation system . . . . . . . . . . . . .                                                                                        19
5.4                 NO2 data product requirements . . . . . . . . . . . . . . . . . . . . . . . . . . . . . . . . . . . . . . . . . . . . . . . . . . . . . . . . . . . . . . . . . .                              20
5.5                 NO2 retrieval for TROPOMI . . . . . . . . . . . . . . . . . . . . . . . . . . . . . . . . . . . . . . . . . . . . . . . . . . . . . . . . . . . . . . . . . . . . . .                          20
5.6                 NO2 data product: version history and access . . . . . . . . . . . . . . . . . . . . . . . . . . . . . . . . . . . . . . . . . . . . . . . . . .                                               21
6                  Algorithm description . . . . . . . . . . . . . . . . . . . . . . . . . . . . . . . . . . . . . . . . . . . . . . . . . . . . . . . . . . . . . . . . . . . . . . . . . . .                     23
6.1                Overview of the NO2 retrieval algorithm . . . . . . . . . . . . . . . . . . . . . . . . . . . . . . . . . . . . . . . . . . . . . . . . . . . . . . . . .                                       23
6.2                Spectral fitting . . . . . . . . . . . . . . . . . . . . . . . . . . . . . . . . . . . . . . . . . . . . . . . . . . . . . . . . . . . . . . . . . . . . . . . . . . . . . . . . . . . . .      23
6.2.1              Wavelength calibration & common wavelength grid . . . . . . . . . . . . . . . . . . . . . . . . . . . . . . . . . . . . . . . . . . . . .                                                       25
6.2.2              Minimising the chi-squared merit function . . . . . . . . . . . . . . . . . . . . . . . . . . . . . . . . . . . . . . . . . . . . . . . . . . . . . . .                                         26
6.2.3              Reference spectra. . . . . . . . . . . . . . . . . . . . . . . . . . . . . . . . . . . . . . . . . . . . . . . . . . . . . . . . . . . . . . . . . . . . . . . . . . . . . . . . .              27
6.2.4              DOAS fit details for OMI and TROPOMI . . . . . . . . . . . . . . . . . . . . . . . . . . . . . . . . . . . . . . . . . . . . . . . . . . . . . . . . .                                          27
6.2.5              Some notes regarding other DOAS implementations . . . . . . . . . . . . . . . . . . . . . . . . . . . . . . . . . . . . . . . . . . .                                                           28
6.3                Separation of stratospheric and tropospheric NO2 . . . . . . . . . . . . . . . . . . . . . . . . . . . . . . . . . . . . . . . . . . . . . .                                                    29
6.3.1              Stratospheric chemistry in the TM5-MP model . . . . . . . . . . . . . . . . . . . . . . . . . . . . . . . . . . . . . . . . . . . . . . . . . .                                                 31
6.4                Air-mass factor and vertical column calculations . . . . . . . . . . . . . . . . . . . . . . . . . . . . . . . . . . . . . . . . . . . . . . . .                                                31
6.4.1              Altitude dependent AMFs . . . . . . . . . . . . . . . . . . . . . . . . . . . . . . . . . . . . . . . . . . . . . . . . . . . . . . . . . . . . . . . . . . . . . . . . .                       33
6.4.2              Temperature correction . . . . . . . . . . . . . . . . . . . . . . . . . . . . . . . . . . . . . . . . . . . . . . . . . . . . . . . . . . . . . . . . . . . . . . . . . . .                    34
6.4.3              Correction for cloud cover . . . . . . . . . . . . . . . . . . . . . . . . . . . . . . . . . . . . . . . . . . . . . . . . . . . . . . . . . . . . . . . . . . . . . . . .                      36
6.4.4              Cloud cover and cloud pressure data . . . . . . . . . . . . . . . . . . . . . . . . . . . . . . . . . . . . . . . . . . . . . . . . . . . . . . . . . . . .                                     36
6.4.4.1            The FRESCO-S cloud pressure & NO2 cloud fraction . . . . . . . . . . . . . . . . . . . . . . . . . . . . . . . . . . . . . . . . . .                                                            36
6.4.4.2            Cloud pressure: the FRESCO-wide update. . . . . . . . . . . . . . . . . . . . . . . . . . . . . . . . . . . . . . . . . . . . . . . . . . . . . .                                               38
6.4.4.3            The O2 –O2 cloud pressure. . . . . . . . . . . . . . . . . . . . . . . . . . . . . . . . . . . . . . . . . . . . . . . . . . . . . . . . . . . . . . . . . . . . . . . .                        39
6.4.4.4            Other cloud data products . . . . . . . . . . . . . . . . . . . . . . . . . . . . . . . . . . . . . . . . . . . . . . . . . . . . . . . . . . . . . . . . . . . . . . . .                       40
6.4.5              Surface albedo . . . . . . . . . . . . . . . . . . . . . . . . . . . . . . . . . . . . . . . . . . . . . . . . . . . . . . . . . . . . . . . . . . . . . . . . . . . . . . . . . . . .          40
6.4.6              Snow and ice cover . . . . . . . . . . . . . . . . . . . . . . . . . . . . . . . . . . . . . . . . . . . . . . . . . . . . . . . . . . . . . . . . . . . . . . . . . . . . . . .                41
6.4.7              Surface pressure . . . . . . . . . . . . . . . . . . . . . . . . . . . . . . . . . . . . . . . . . . . . . . . . . . . . . . . . . . . . . . . . . . . . . . . . . . . . . . . . . .            42
6.4.8              A-priori vertical NO2 profiles. . . . . . . . . . . . . . . . . . . . . . . . . . . . . . . . . . . . . . . . . . . . . . . . . . . . . . . . . . . . . . . . . . . . . .                       43
6.4.9              Averaging kernels . . . . . . . . . . . . . . . . . . . . . . . . . . . . . . . . . . . . . . . . . . . . . . . . . . . . . . . . . . . . . . . . . . . . . . . . . . . . . . . . .             43
6.4.10             De-striping the NO2 data product . . . . . . . . . . . . . . . . . . . . . . . . . . . . . . . . . . . . . . . . . . . . . . . . . . . . . . . . . . . . . . . .                                44
6.5                Processing chain elements . . . . . . . . . . . . . . . . . . . . . . . . . . . . . . . . . . . . . . . . . . . . . . . . . . . . . . . . . . . . . . . . . . . . . . .                         45
6.5.1              Off-line (re)processing . . . . . . . . . . . . . . . . . . . . . . . . . . . . . . . . . . . . . . . . . . . . . . . . . . . . . . . . . . . . . . . . . . . . . . . . . . . .                 45
6.5.2              Near-real time processing . . . . . . . . . . . . . . . . . . . . . . . . . . . . . . . . . . . . . . . . . . . . . . . . . . . . . . . . . . . . . . . . . . . . . . . .                       46
TROPOMI ATBD tropospheric and total NO2                                                                                                                            S5P-KNMI-L2-0005-RP
issue 2.2.0, 2021-06-16 – released                                                                                                                                         Page 7 of 86

6.6      The NO2 data product . . . . . . . . . . . . . . . . . . . . . . . . . . . . . . . . . . . . . . . . . . . . . . . . . . . . . . . . . . . . . . . . . . . . . . . . . . . .                   47
7        Input-Output file description . . . . . . . . . . . . . . . . . . . . . . . . . . . . . . . . . . . . . . . . . . . . . . . . . . . . . . . . . . . . . . . . . . .                            52
7.1      Required input . . . . . . . . . . . . . . . . . . . . . . . . . . . . . . . . . . . . . . . . . . . . . . . . . . . . . . . . . . . . . . . . . . . . . . . . . . . . . . . . . . . . .       52
7.1.1    Inputs at the PDGS for spectral fitting and air-mass factor calculation . . . . . . . . . . . . . . . . . . . . . . . .                                                                        52
7.1.2    Inputs at the IDAF for the data assimilation . . . . . . . . . . . . . . . . . . . . . . . . . . . . . . . . . . . . . . . . . . . . . . . . . . . . .                                         53
7.2      Computational effort . . . . . . . . . . . . . . . . . . . . . . . . . . . . . . . . . . . . . . . . . . . . . . . . . . . . . . . . . . . . . . . . . . . . . . . . . . . . . .               53
7.3      Near-real time timeliness . . . . . . . . . . . . . . . . . . . . . . . . . . . . . . . . . . . . . . . . . . . . . . . . . . . . . . . . . . . . . . . . . . . . . . . . .                    55
7.4      NO2 product description and size . . . . . . . . . . . . . . . . . . . . . . . . . . . . . . . . . . . . . . . . . . . . . . . . . . . . . . . . . . . . . . . .                               55
8        Error analysis . . . . . . . . . . . . . . . . . . . . . . . . . . . . . . . . . . . . . . . . . . . . . . . . . . . . . . . . . . . . . . . . . . . . . . . . . . . . . . . . . . . .         58
8.1      Slant column errors . . . . . . . . . . . . . . . . . . . . . . . . . . . . . . . . . . . . . . . . . . . . . . . . . . . . . . . . . . . . . . . . . . . . . . . . . . . . . . .              58
8.2      Errors in the stratospheric (slant) columns . . . . . . . . . . . . . . . . . . . . . . . . . . . . . . . . . . . . . . . . . . . . . . . . . . . . . .                                        59
8.3      Errors in the tropospheric air-mass factors . . . . . . . . . . . . . . . . . . . . . . . . . . . . . . . . . . . . . . . . . . . . . . . . . . . . . .                                        60
8.4      Total errors in the tropospheric NO2 columns . . . . . . . . . . . . . . . . . . . . . . . . . . . . . . . . . . . . . . . . . . . . . . . . . . .                                             61
9        Validation . . . . . . . . . . . . . . . . . . . . . . . . . . . . . . . . . . . . . . . . . . . . . . . . . . . . . . . . . . . . . . . . . . . . . . . . . . . . . . . . . . . . . . . . .   64
9.1      Routine validation & validation activities . . . . . . . . . . . . . . . . . . . . . . . . . . . . . . . . . . . . . . . . . . . . . . . . . . . . . . . . .                                   64
9.2      Algorithm testing and verification. . . . . . . . . . . . . . . . . . . . . . . . . . . . . . . . . . . . . . . . . . . . . . . . . . . . . . . . . . . . . . . . .                            64
9.3      Stratospheric NO2 validation . . . . . . . . . . . . . . . . . . . . . . . . . . . . . . . . . . . . . . . . . . . . . . . . . . . . . . . . . . . . . . . . . . . . .                         64
9.4      Tropospheric NO2 validation. . . . . . . . . . . . . . . . . . . . . . . . . . . . . . . . . . . . . . . . . . . . . . . . . . . . . . . . . . . . . . . . . . . . . .                         65
10       Conclusion . . . . . . . . . . . . . . . . . . . . . . . . . . . . . . . . . . . . . . . . . . . . . . . . . . . . . . . . . . . . . . . . . . . . . . . . . . . . . . . . . . . . . . .       67
A        Wavelength calibration. . . . . . . . . . . . . . . . . . . . . . . . . . . . . . . . . . . . . . . . . . . . . . . . . . . . . . . . . . . . . . . . . . . . . . . . . .                      68
A.1      Description of the problem. . . . . . . . . . . . . . . . . . . . . . . . . . . . . . . . . . . . . . . . . . . . . . . . . . . . . . . . . . . . . . . . . . . . . . . .                      68
A.2      Non-linear model function and Jacobian. . . . . . . . . . . . . . . . . . . . . . . . . . . . . . . . . . . . . . . . . . . . . . . . . . . . . . . . .                                        68
A.2.1    Prior information for the optimal estimation fit . . . . . . . . . . . . . . . . . . . . . . . . . . . . . . . . . . . . . . . . . . . . . . . . . . .                                         70
A.3      Application of the wavelength calibration in NO2 . . . . . . . . . . . . . . . . . . . . . . . . . . . . . . . . . . . . . . . . . . . . . . . .                                               70
B        High-sampling interpolation. . . . . . . . . . . . . . . . . . . . . . . . . . . . . . . . . . . . . . . . . . . . . . . . . . . . . . . . . . . . . . . . . . . .                             71
C        Effective cloud fraction in the NO2 window . . . . . . . . . . . . . . . . . . . . . . . . . . . . . . . . . . . . . . . . . . . . . . . . . .                                                 72
C.1      Adjusting albedo to respect physical limits to the cloud fraction. . . . . . . . . . . . . . . . . . . . . . . . . . . . . . . .                                                               73
D        Surface albedo correction using the snow/ice flag . . . . . . . . . . . . . . . . . . . . . . . . . . . . . . . . . . . . . . . . .                                                            74
E        Data quality value: the qa_value flags . . . . . . . . . . . . . . . . . . . . . . . . . . . . . . . . . . . . . . . . . . . . . . . . . . . . . . .                                           75
F        Spike removal in the DOAS fit . . . . . . . . . . . . . . . . . . . . . . . . . . . . . . . . . . . . . . . . . . . . . . . . . . . . . . . . . . . . . . . . . .                              76
G        References. . . . . . . . . . . . . . . . . . . . . . . . . . . . . . . . . . . . . . . . . . . . . . . . . . . . . . . . . . . . . . . . . . . . . . . . . . . . . . . . . . . . . . . .      78

List of Tables
1        NO2 data product requirements . . . . . . . . . . . . . . . . . . . . . . . . . . . . . . . . . . . . . . . . . . . . . . . . . . . . . . . . . . . . . . . . . .                              20
2        NO2 processor version overview . . . . . . . . . . . . . . . . . . . . . . . . . . . . . . . . . . . . . . . . . . . . . . . . . . . . . . . . . . . . . . . . .                               21
3        Settings of DOAS retrieval of NO2 . . . . . . . . . . . . . . . . . . . . . . . . . . . . . . . . . . . . . . . . . . . . . . . . . . . . . . . . . . . . . . .                                26
4        AMF LUT . . . . . . . . . . . . . . . . . . . . . . . . . . . . . . . . . . . . . . . . . . . . . . . . . . . . . . . . . . . . . . . . . . . . . . . . . . . . . . . . . . . . . . . . . .    35
5        Final NO2 vertical column data product. . . . . . . . . . . . . . . . . . . . . . . . . . . . . . . . . . . . . . . . . . . . . . . . . . . . . . . . . .                                      49
6        Data product user applications . . . . . . . . . . . . . . . . . . . . . . . . . . . . . . . . . . . . . . . . . . . . . . . . . . . . . . . . . . . . . . . . . . .                           50
7        Dynamic input data . . . . . . . . . . . . . . . . . . . . . . . . . . . . . . . . . . . . . . . . . . . . . . . . . . . . . . . . . . . . . . . . . . . . . . . . . . . . . . .               53
8        Static input data . . . . . . . . . . . . . . . . . . . . . . . . . . . . . . . . . . . . . . . . . . . . . . . . . . . . . . . . . . . . . . . . . . . . . . . . . . . . . . . . . . .        54
9        Computational effort: off-line processing . . . . . . . . . . . . . . . . . . . . . . . . . . . . . . . . . . . . . . . . . . . . . . . . . . . . . . . .                                      54
10       Computational effort: NRT processing . . . . . . . . . . . . . . . . . . . . . . . . . . . . . . . . . . . . . . . . . . . . . . . . . . . . . . . . . . .                                     54
11       Data product list of main output file . . . . . . . . . . . . . . . . . . . . . . . . . . . . . . . . . . . . . . . . . . . . . . . . . . . . . . . . . . . . . .                              56
12       Data product list of support output file . . . . . . . . . . . . . . . . . . . . . . . . . . . . . . . . . . . . . . . . . . . . . . . . . . . . . . . . . . .                                 57
13       Estimate of AMF errors . . . . . . . . . . . . . . . . . . . . . . . . . . . . . . . . . . . . . . . . . . . . . . . . . . . . . . . . . . . . . . . . . . . . . . . . . . .                   61
14       Tropospheric AMF uncertainty estimates from OMI. . . . . . . . . . . . . . . . . . . . . . . . . . . . . . . . . . . . . . . . . . . . .                                                       63
15       A-priori values for the wavelength fit . . . . . . . . . . . . . . . . . . . . . . . . . . . . . . . . . . . . . . . . . . . . . . . . . . . . . . . . . . . . .                               70
16       Look-up tables for reflectance calculations . . . . . . . . . . . . . . . . . . . . . . . . . . . . . . . . . . . . . . . . . . . . . . . . . . . . . .                                        73
17       Snow/ice flags . . . . . . . . . . . . . . . . . . . . . . . . . . . . . . . . . . . . . . . . . . . . . . . . . . . . . . . . . . . . . . . . . . . . . . . . . . . . . . . . . . . . .       74
18       Data quality value detemination . . . . . . . . . . . . . . . . . . . . . . . . . . . . . . . . . . . . . . . . . . . . . . . . . . . . . . . . . . . . . . . . . .                            75
19       NO2 process configuration for saturation and outliers . . . . . . . . . . . . . . . . . . . . . . . . . . . . . . . . . . . . . . . . . .                                                      77
TROPOMI ATBD tropospheric and total NO2                                                                                                                              S5P-KNMI-L2-0005-RP
issue 2.2.0, 2021-06-16 – released                                                                                                                                           Page 8 of 86

List of Figures
1        Tropospheric NO2 for April 2018 . . . . . . . . . . . . . . . . . . . . . . . . . . . . . . . . . . . . . . . . . . . . . . . . . . . . . . . . . . . . . . . . .                                15
2        COVID-19 lockdown impact on NO2 in India . . . . . . . . . . . . . . . . . . . . . . . . . . . . . . . . . . . . . . . . . . . . . . . . . . . .                                                 16
3        Stratosperic NO2 for 1 April 2018 . . . . . . . . . . . . . . . . . . . . . . . . . . . . . . . . . . . . . . . . . . . . . . . . . . . . . . . . . . . . . . . .                                17
4        NO2 data record UV/Vis satellite instruments . . . . . . . . . . . . . . . . . . . . . . . . . . . . . . . . . . . . . . . . . . . . . . . . . . .                                               18
5        DOAS fit . . . . . . . . . . . . . . . . . . . . . . . . . . . . . . . . . . . . . . . . . . . . . . . . . . . . . . . . . . . . . . . . . . . . . . . . . . . . . . . . . . . . . . . . . . .   25
6        Reference spectra. . . . . . . . . . . . . . . . . . . . . . . . . . . . . . . . . . . . . . . . . . . . . . . . . . . . . . . . . . . . . . . . . . . . . . . . . . . . . . . . .               28
7        NO2 forecast and analysis differences . . . . . . . . . . . . . . . . . . . . . . . . . . . . . . . . . . . . . . . . . . . . . . . . . . . . . . . . . . .                                      32
8        High-latitude improvement . . . . . . . . . . . . . . . . . . . . . . . . . . . . . . . . . . . . . . . . . . . . . . . . . . . . . . . . . . . . . . . . . . . . . . . .                        33
9        Temperature correction factors . . . . . . . . . . . . . . . . . . . . . . . . . . . . . . . . . . . . . . . . . . . . . . . . . . . . . . . . . . . . . . . . . . .                             34
10       Cloud fraction method comparison. . . . . . . . . . . . . . . . . . . . . . . . . . . . . . . . . . . . . . . . . . . . . . . . . . . . . . . . . . . . . . .                                    37
11       Example of improvements in cloud treatment . . . . . . . . . . . . . . . . . . . . . . . . . . . . . . . . . . . . . . . . . . . . . . . . . . .                                                 38
12       Explanation of the FRESCO-wide approach . . . . . . . . . . . . . . . . . . . . . . . . . . . . . . . . . . . . . . . . . . . . . . . . . . . .                                                  39
13       FRESCO case study, 23 Jan 2019 . . . . . . . . . . . . . . . . . . . . . . . . . . . . . . . . . . . . . . . . . . . . . . . . . . . . . . . . . . . . . . .                                     39
14       TROPOMI vs OMI NO2 over China, Winter 2020/21. . . . . . . . . . . . . . . . . . . . . . . . . . . . . . . . . . . . . . . . . . . .                                                             40
15       Albedo adjustment in version 2 compared to version 1 . . . . . . . . . . . . . . . . . . . . . . . . . . . . . . . . . . . . . . . . .                                                           42
16       Tropospheric NO2 difference from resolution . . . . . . . . . . . . . . . . . . . . . . . . . . . . . . . . . . . . . . . . . . . . . . . . . . . .                                              43
17       De-striping example . . . . . . . . . . . . . . . . . . . . . . . . . . . . . . . . . . . . . . . . . . . . . . . . . . . . . . . . . . . . . . . . . . . . . . . . . . . . . . .                45
18       Comparison of vertical columns . . . . . . . . . . . . . . . . . . . . . . . . . . . . . . . . . . . . . . . . . . . . . . . . . . . . . . . . . . . . . . . . . .                               46
19       Scheme of the TROPOMI processing system . . . . . . . . . . . . . . . . . . . . . . . . . . . . . . . . . . . . . . . . . . . . . . . . . . .                                                    47
20       Scheme of the TROPOMI processing system in NRT . . . . . . . . . . . . . . . . . . . . . . . . . . . . . . . . . . . . . . . . . .                                                               48
21       Enhanced coverage over snow/ice . . . . . . . . . . . . . . . . . . . . . . . . . . . . . . . . . . . . . . . . . . . . . . . . . . . . . . . . . . . . . . .                                    51
22       Error in slant column versus SNR . . . . . . . . . . . . . . . . . . . . . . . . . . . . . . . . . . . . . . . . . . . . . . . . . . . . . . . . . . . . . . . .                                 59
23       Comparison of slant column errors . . . . . . . . . . . . . . . . . . . . . . . . . . . . . . . . . . . . . . . . . . . . . . . . . . . . . . . . . . . . . .                                    59
24       Tropospheric column and error estimates from TROPOMI . . . . . . . . . . . . . . . . . . . . . . . . . . . . . . . . . . . . .                                                                   62
25       Tropospheric column comparisons OMI-TROPOMI. . . . . . . . . . . . . . . . . . . . . . . . . . . . . . . . . . . . . . . . . . . . .                                                             65
26       High sampling interpolation on part of a solar observation . . . . . . . . . . . . . . . . . . . . . . . . . . . . . . . . . . . . .                                                             71
27       Examples of outliers in fit residual . . . . . . . . . . . . . . . . . . . . . . . . . . . . . . . . . . . . . . . . . . . . . . . . . . . . . . . . . . . . . . .                               76
28       Examples of outliers and saturation . . . . . . . . . . . . . . . . . . . . . . . . . . . . . . . . . . . . . . . . . . . . . . . . . . . . . . . . . . . . . .                                  77
TROPOMI ATBD tropospheric and total NO2                                                 S5P-KNMI-L2-0005-RP
issue 2.2.0, 2021-06-16 – released                                                              Page 9 of 86

1     Introduction to the document
1.1   Identification
This document, identified as S5P-KNMI-L2-0005-RP, is the Algorithm Theoretical Basis Document (ATBD)
for the TROPOMI total and tropospheric NO2 data products. It is part of a series of ATBDs describing the
TROPOMI Level-2 data products. The latest public release version of the ATBD is available via [ER1].

This version of the ATBD describes NO2 processor version 1.4.0 & 2.2.0.

An overview of which NO2 processor version is used for processing which TROPOMI orbits is given in Table 2.

Additional documents related to the TROPOMI NO2 data products:
   • Product User Manual (PUM), identified as S5P-KNMI-L2-0021-MA, available via [ER2].
   • Product ReadMe File (PRF), identified as S5P-MPC-KNMI-PRF-NO2, available via [ER3].
   • Product User Manual (PUM) for the TM5 NO2 , SO2 and HCHO profile auxiliary support product, identified
      as S5P-KNMI-L2-0035-MA, available via [ER2].
   • Quarterly Validation Report (ROCVR), identified as S5P-MPC-IASB-ROCVR, available via [ER4].
S5P/TROPOMI product and algorithm documents are also available via [ER5].

1.2   Purpose and objective
The purpose of this document is to describe the theoretical basis and the implementation of the NO2 Level-2
algorithm for TROPOMI. The document is maintained during the development phase and the lifetime of the
data products. Updates and new versions will be issued in case of changes of the algorithm.

1.3   Document overview
Sections 2 and 3 list the applicable and reference documents and the terms and abbriviations specific for
this document; references to peer-reviewed papers and other scientific publications are listed in Appendix G.
Section 4 provides a reference to a general description of the TROPOMI instrument, which is common to all
ATBDs of the TROPOMI Level-2 data products. Section 5 provides an introduction to the NO2 data products,
their heritage, the set-up of their retrieval, the requirements of the products, and their availability. Section 6
gives an overview of the TROPOMI NO2 data processing system and important aspects of the various steps in
the processing. Section 7 lists some aspects regarding the feasibility of the NO2 data products, such as the
computational effort and the auxiliary information needed for the processing. Section 8 deals with an error
analysis of the NO2 data product. Section 9 gives a brief overview of validation issues and possibilities, such
as campaigns and satellite intercomparions. Section 10 formulates some conclusion regarding the NO2 data
products.

1.4   Acknowledgements
The authors would like to thank the following people for useful discussions, information, reviews of earlier
versions of this document and other contributions: Andreas Hilboll, Andreas Richter, Angelika Dehn, Bram
Maasakkers, Bram Sanders, Deborah Stein – Zweers, Dominique Brunner, Huan Yu, Isabelle De Smedt, Jason
Williams Johan de Haan, Lidia Saavedra De Miguel, Maarten Sneep, Marina Zara, Mark ter Linden, Michel
Van Roozendael, Piet Stammes, Pieter Valks, Ronald van der A, Steffen Beirle, Thomas Wagner.
TROPOMI ATBD tropospheric and total NO2                                           S5P-KNMI-L2-0005-RP
issue 2.2.0, 2021-06-16 – released                                                       Page 10 of 86

2     Applicable and reference documents
2.1   Applicable documents
[AD1] Level 2 Processor Development – Statement of Work.
      source: ESA/ESTEC; ref: S5P-SW-ESA-GS-053; issue: 1.1; date: 2012-05-21.

[AD2] GMES Sentinel-5 Precursor – S5p System Requirement Document (SRD).
      source: ESA/ESTEC; ref: S5p-RS-ESA-SY-0002; issue: 4.1; date: 2011-04-xx.

2.2   Standard documents

      There are no standard documents

2.3   Reference documents
 [RD1] Sentinel 5 precursor/TROPOMI KNMI and SRON level 2 Input Output Data Definition.
       source: KNMI; ref: S5P-KNMI-L2-0009-SD; issue: 11.0.0; date: 2019-02-01.

 [RD2] Terms, definitions and abbreviations for TROPOMI L01b data processor.
       source: KNMI; ref: S5P-KNMI-L01B-0004-LI; issue: 3.0.0; date: 2013-11-08.

 [RD3] Terms and symbols in the TROPOMI Algorithm Team.
       source: KNMI; ref: S5P-KNMI-L2-0049-MA; issue: 2.0.0; date: 2016-05-17.

 [RD4] TROPOMI ATBD of the UV aerosol index.
       source: KNMI; ref: S5P-KNMI-L2-0008-RP; issue: 1.1.0; date: 2018-06-15.

 [RD5] GMES Sentinels 4 and 5 Mission Requirements Document.
       source: ESA/ESTEC; ref: EOP-SMA/1507/JL-dr; issue: 3; date: 2011-09-21.

 [RD6] QA4ECV - Quality Assurance for Essential Climate Variables.
       source: KNMI; ref: EU-project 607405, SPA.2013.1.1-03; date: November 2012.

 [RD7] Science Requirements Document for TROPOMI. Volume I: Mission and Science Objectives and
       Observational Requirements.
       source: KNMI, SRON; ref: RS-TROPOMI-KNMI-017; issue: 2.0.0; date: 2008-10-30.

 [RD8] CAPACITY: Operational Atmospheric Chemistry Monitoring Missions – Final report and technical notes
       of the ESA study.
       source: KNMI; ref: CAPACITY; date: Oct. 2005.

 [RD9] CAMELOT: Observation Techniques and Mission Concepts for Atmospheric Chemistry – Final report
       of the ESA study.
       source: KNMI; ref: RP-CAM-KNMI-050; date: Nov. 2009.

[RD10] TRAQ: Performance Analysis and Requirements Consolidation – Final report of the ESA study.
       source: KNMI; ref: RP-ONTRAQ-KNMI-051; date: Jan. 2010.

[RD11] Sentinel-5P Calibration and Validation Plan for the Operational Phase.
       source: ESA; ref: ESA-EOPG-CSCOP-PL-0073; issue: 1; date: 2017-11-6.

[RD12] NO2 PGE Detailed Processing Model.
       source: Space Sytems Finland; ref: TN-NO2-0200-SSF-001; issue: 1.2; date: 2010-04-21.

[RD13] Algorithm theoretical basis document for the TROPOMI L01b data processor.
       source: KNMI; ref: S5P-KNMI-L01B-0009-SD; issue: 8.0.0; date: 2017-06-01.

[RD14] S5P/TROPOMI Static input for Level 2 processors.
       source: KNMI/SRON/BIRA/DLR; ref: S5P-KNMI-L2CO-0004-SD; issue: 4.0.0; date: 2016-03-21.

[RD15] QA4ECV D4.2 - Recommendations on best practices for retrievals for Land and Atmosphere ECVs..
       source: KNMI; ref: EU-project 607405, SPA.2013.1.1-03; date: April 2016.
TROPOMI ATBD tropospheric and total NO2 S5P-KNMI-L2-0005-RP
issue 2.2.0, 2021-06-16 – released Page 11 of 86
[RD16] An improved temperature correction for OMI NO2 slant column densities from the 405-465 nm fitting
window.
source: KNMI; ref: TN-OMIE-KNMI-982; issue: 1.0; date: 2017-01-24.
[RD17] Cloud retrieval algorithm for GOME-2: FRESCO+.
source: EUMETSAT/KNMI; ref: EUM/CO/09/4600000655/RM; issue: 1.3; date: 2010-10-18.
[RD18] Sentinel-5 L2 Prototype Processor – Algorithm Theoretical Baseline Document for Cloud data product.
source: KNMI; ref: KNMI-ESA-S5L2PP-ATBD-005; issue: 3.1; date: 2019-05-02.
[RD19] S5P/TROPOMI ATBD Cloud Products.
source: DLR; ref: S5P-DLR-L2-ATBD-400I; issue: 2.2.0; date: 2020-06-15.
[RD20] Dutch OMI NO2 (DOMINO) data product v2.0 – see URL https://www.temis.nl/
airpollution/no2.php.
source: KNMI; ref: OMI NO2 HE5 2.0 2011; date: 18 August 2011.
[RD21] Product user manual for the TM5 NO2 , SO2 and HCHO profile auxiliary support product.
source: ; ref: S5P-KNMI-L2-0035-MA; issue: 1.0.0; date: 2021-02-04.
[RD22] Preparing elevation data for Sentinel 5 precursor.
source: KNMI; ref: S5P-KNMI-L2-0121-TN; issue: 2.0.0; date: 2015-09-11.
[RD23] S5P/TROPOMI Science Verification Report.
source: IUP; ref: S5P-IUP-L2-ScVR-RP; issue: 2.1; date: 2015-12-22.
[RD24] Wavelength calibration in the Sentinel-5 precursor Level 2 data processors.
source: KNMI; ref: S5P-KNMI-L2-0126-TN; issue: 1.0.0; date: 2015-09-11.
[RD25] Determine the effective cloud fraction for a specific wavelength.
source: KNMI; ref: S5P-KNMI-L2-0115-TN; issue: 2.0.0; date: 2019-04-10.
2.4 Electronic references
[ER1] TROPOMI level-2 product ATBD documents. URL http://www.tropomi.eu/documents/atbd/.
[ER2] TROPOMI level-2 product PUM documents. URL http://www.tropomi.eu/documents/pum/.
[ER3] TROPOMI level-2 product PRF documents. URL http://www.tropomi.eu/documents/prf/.
[ER4] TROPOMI Quarterly Validation Report. URL http://www.tropomi.eu/documents/
validation/.
[ER5] Sentinel-5P TROPOMI Products and algorithms documentation. URL https://sentinel.esa.
int/web/sentinel/technical-guides/sentinel-5p/products-algorithms.
[ER6] TEMIS website: NO2 data product page. URL https://www.temis.nl/airpollution/no2.
php.
[ER7] QA4ECV website. URL http://www.qa4ecv.eu/.
[ER8] QA4ECV NO2 ECV precursor data. URL http://www.qa4ecv.eu/ecv/no2-pre.
[ER9] Copernicus Open Access S5P Data Hub. URL https://s5phub.copernicus.eu.
[ER10] TROPOMI website. URL http://www.tropomi.eu/.
[ER11] S5P/TROPOMI ISRF. URL http://www.tropomi.eu/data-products/isrf-dataset.
[ER12] Vandaele et al. NO2 cross sections. URL http://spectrolab.aeronomie.be/no2.htm.
[ER13] TM5 website. URL http://www.projects.science.uu.nl/tm5/.
[ER14] Q. L. Kleipool, M. R. Dobber, J. F. De Haan et al.; OMI Surface Reflectance Climatology (2010). URL
https://disc.gsfc.nasa.gov/datasets?page=1&source=AURA~OMI.TROPOMI ATBD tropospheric and total NO2 S5P-KNMI-L2-0005-RP
issue 2.2.0, 2021-06-16 – released Page 12 of 86
[ER15] A. Nolin, R.L. Armstrong and J. Maslanik; Near Real-Time SSM/I EASE–Grid Daily Global Ice
Concentration and Snow Extent. Boulder, CO, USA: National Snow and Ice Data Center. Digital
media (2005). Updated daily; URL http://nsidc.org/data/NISE.
[ER16] EUMETSAT Ocean & Sea Ice Satellite Application Facility. Updated daily; URL http://osisaf.
met.no/.
[ER17] J.J. Danielson and D.B. Gesch; Global Multi-resolution Terrain Elevation Data 2010 (GMTED2010)
(2011). URL http://topotools.cr.usgs.gov/gmted_viewer/.
[ER18] L. G. Tilstra, O. N. E. Tuinder, P. Wang et al.; Surface reflectivity climatologies from UV to NIR
determined from Earth observations by GOME-2 and SCIAMACHY (2017). URL https://temis.
nl/surface/gome2_ler.php.
[ER19] TROPOMI Mission Performance Centre. URL http://www.tropomi.eu/data-products/
mission-performance-centre.
[ER20] S5P Mission Performance Centre VDAF website. URL http://mpc-vdaf.tropomi.eu/.
[ER21] In-service Aircraft for a Global Observing System (IAGOS). URL https://www.iagos.org/.
[ER22] What are outliers in the data? URL https://www.itl.nist.gov/div898/handbook/prc/
section1/prc16.htm.
[ER23] Important z-scores. URL http://www.cs.uni.edu/~campbell/stat/normfact.html.
[ER24] The Standard Normal Distribution. URL http://sphweb.bumc.bu.edu/otlt/MPH-Modules/
BS/BS704_Probability/BS704_Probability9.html.TROPOMI ATBD tropospheric and total NO2 S5P-KNMI-L2-0005-RP issue 2.2.0, 2021-06-16 – released Page 13 of 86 3 Terms, definitions and abbreviated terms Terms, definitions and abbreviated terms that are used in development program for the TROPOMI L0-1b data processor are described in [RD2]. Terms, definitions and abbreviated terms that are used in development program for the TROPOMI L2 data processors are described in [RD3]. Terms, definitions and abbreviated terms that are specific for this document can be found below. 3.1 Terms and definitions The most important symbols related to the data product described in this document – some of which are not in [RD3] – are the following; see also the data product overview list in Table 11. M total air-mass factor Mcld cloudy air-mass factor Mclr clear-sky air-mass factor M trop tropospheric air-mass factor M strat stratospheric air-mass factor Ns total slant column density Nstrop tropospheric slant column density Nsstrat stratospheric slant column density Nv total vertical column density Nvtrop tropospheric vertical column density Nvstrat stratospheric vertical column density Nvsum sum of tropospheric and stratospheric vertical column density 3.2 Acronyms and abbreviations AAI Absorbing Aerosol Index ACE Atmospheric Chemistry Experiment AMF Air-mass factor CAMS Copernicus Atmosphere Monitoring Service CTM Chemistry Transport Model DAK Doubling-Adding KNMI DEM Digital Elevation Map DOAS Differential Optical Absorption Spectroscopy DOMINO Dutch OMI NO2 data products of KNMI for OMI ECMWF European Centre for Medium-Range Weather Forecast ENVISAT Environmental Satellite EOS-Aura Earth Observing System (Chemistry & Climate Mission) ERBS Earth Radiation Budget Satellite ERS European Remote Sensing satellite FRESCO Fast Retrieval Scheme for Clouds from the Oxygen A band GOME Global Ozone Monitoring Experiment HALOE Halogen Occultation Experiment IDAF-L2 Instrument Data Analysis Facility, Level 2 (at KNMI) IPA Independent pixel approximation ISRF Instrument Spectral Response Function (aka slit funtion) LER Lambertian equivalent reflectivity LUT Look-up table
TROPOMI ATBD tropospheric and total NO2                                            S5P-KNMI-L2-0005-RP
issue 2.2.0, 2021-06-16 – released                                                        Page 14 of 86

 MAX-DOAS        Multi-axis DOAS
 MERIS           Medium Resolution Imaging Spectrometer
 MetOp           Meteorological Operational Satellite
 MPC             S5P Mission Performance Centre
 NISE            Near-real-time Ice and Snow Extent
 NRT             near-real time (i.e. processing within 3 hours of measurement)
 OMI             Ozone Monitoring Instrument
 OMNO2A          OMI NO2 slant column data product (at NASA)
 OSIRIS          Optical Spectrograph and Infrared Imager System
 OSISAF          Ocean & Sea Ice Satellite Application Facility
 PANDORA         not an acronym; direct-sun UV-visible spectrometer
 PDGS            Sentinel-5Precursor Payload Data Ground Segment (at DLR)
 POAM            Polar Ozone and Aerosol Measurements
 PRF             Product ReadMe File
 PUM             Product User Manual
 ROCVR           Routine Operations Consolidated Validation Report
 QA4ECV          European "Quality Assurance for Essential Climate Variables" project
 S5P             Sentinel-5 Precursor (satellite carrying TROPOMI)
 SAGE            Stratospheric Gas and Aerosol Experiment
 SAOZ            Systeme d’Analyse par Observations Zenithales instrument
 SCIAMACHY       Scanning Imaging Absorption Spectrometer for Atmospheric Cartography
 SME             Solar Mesosphere Explorer
 SNR             Signal-to-Noise Ratio
 SPOT            Système Pour l’Observation la Terre
 STREAM          STRatospheric Estimation Algorithm from Mainz
 TM4, TM5        Data assimilation / chemistry transport model (version 4 or 5)
 TM4NO2A         NO2 data products of KNMI for GOME, SCIAMACHY and GOME-2
 TOA             Top-of-atmosphere
 TROPOMI         Tropospheric Monitoring Instrument
 UARS            Upper Atmosphere Research Satellite
 VDAF            Validation Facility of the MPC

4    TROPOMI instrument description
A description of the TROPOMI instrument and performance, referred to from all ATBDs, can be found in [RD4].
See also the overview paper of Veefkind et al. [2012].
TROPOMI ATBD tropospheric and total NO2 S5P-KNMI-L2-0005-RP
issue 2.2.0, 2021-06-16 – released Page 15 of 86
5 Introduction to the TROPOMI NO2 data products
5.1 Nitrogen dioxide in troposphere and stratosphere
Nitrogen dioxide (NO2 ) and nitrogen oxide (NO) – together usually referred to as nitrogen oxides (NOx =
NO + NO2 ) – are important trace gases in the Earth’s atmosphere, present in both the troposphere and the
stratosphere. They enter the atmosphere as a result of anthropogenic activities (notably fossil fuel combustion
and biomass burning) and natural processes (such as microbiological processes in soils, wildfires and lightning).
Approximately 95% of the NOx emissions is in the form of NO. During daytime, i.e. in the presence of sunlight,
a photochemical cycle involving ozone (O3 ) converts NO into NO2 (and vice versa) on a timescale of minutes,
so that NO2 is a robust measure for concentrations of nitrogen oxides (Solomon [1999], Jacob [1999]).
In the troposphere NO2 plays a key role in air quality issues, as it directly affects human health [World
Health Organisation, 2003]. In addition nitrogen oxides are essential precursors for the formation of ozone
in the troposphere (e.g. Sillman et al. [1990]) and they influence concentrations of OH and thereby (shorten)
the lifetime of methane (CH4 ) (e.g. Fuglestvedt et al. [1999]). Although NO2 is a minor greenhouse gas in
itself, the indirect effects of NO2 on global climate change are probably larger, with a presumed net cooling
effect mostly driven by a growth in aerosol concentrations through nitrate formation from nitrogen oxides and
enhanced levels of oxidants (e.g. Shindell et al. [2009]). Deposition of nitrogen is of great importance for
eutrification [Dentener et al., 2006], the response of the ecosystem to the addition of substances such as
nitrates and phosphates – negative environmental effects include the depletion of oxygen in the water, which
induces reductions in fish and other animal populations.
For typical levels of OH the lifetime of NOx in the lower troposphere is less than a day. For Riyadh, for
example, Beirle et al. [2011] find a lifetime of about 4.0 ± 0.4 hours, while at higher latitudes (e.g. Moscow) the
lifetime can be considerably longer, up to 8 hour in winter, because of a slower photochemistry in that season.
For Switzerland Schaub et al. [2007] report lifetimes of 3.6 ± 0.8 hours in summer and 13.1 ± (3.8) hours in
winter. With lifetimes in the troposphere of only a few hours, the NO2 will remain relatively close to its source,
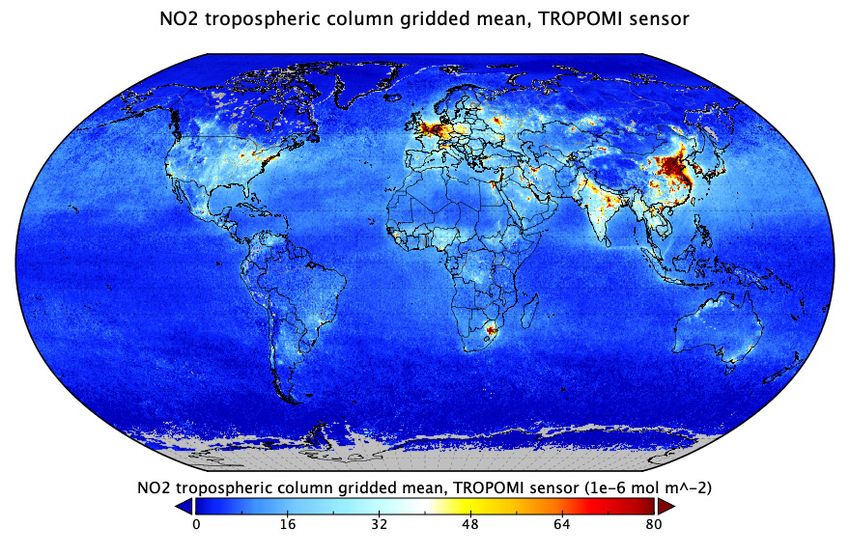
making the NOx sources well detectable from space. As an example, Fig. 1 shows distinct hotspots of NO2
pollution over the highly industrialised and urbanised regions of London, Rotterdam and the Ruhr area in the
monthly average tropospheric NO2 for April 2018 over Europe derived from TROPOMI data.
Since July 2018, with the first public release of the TROPOMI datasets including NO2 , the number of
TROPOMI users and publications has grown strongly. A review of these applications is beyond the scope of
this ATBD. Topics addressed range from changes in global-scale NO2 distributions and impacts on atmospheric
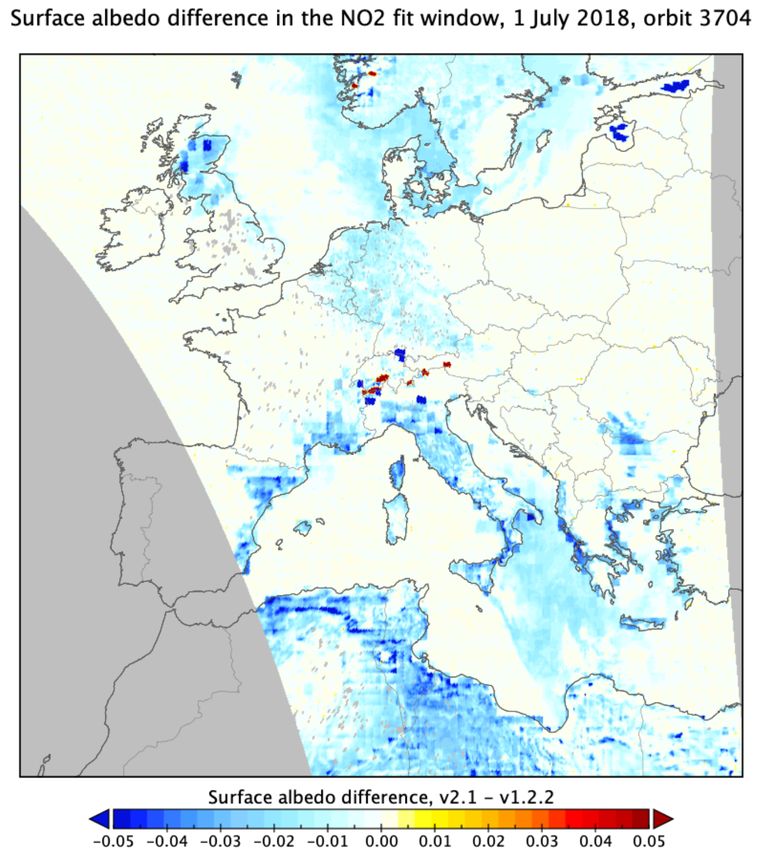
Figure 1: Monthly average distribution of tropospheric NO2 columns for April 2018 over Europe based on
TROPOMI data, derived with processor version 1.2.0.TROPOMI ATBD tropospheric and total NO2 S5P-KNMI-L2-0005-RP
issue 2.2.0, 2021-06-16 – released Page 16 of 86
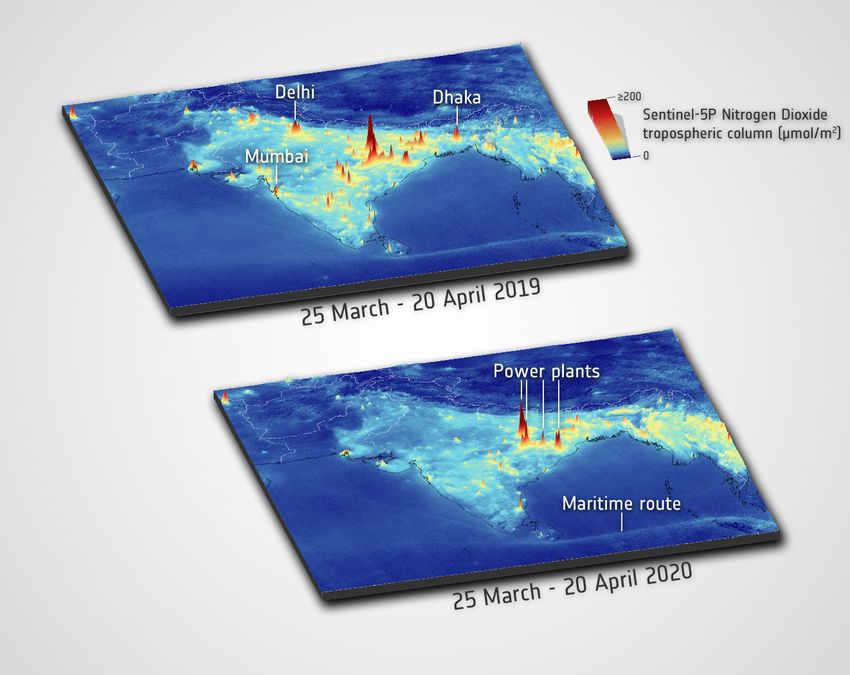
Figure 2: Strong reduction of NO2 over India as a result of the COVID-19 lockdown in March-April 2020
(lower panel) compared to 2019 (top panel). Concentrations were reduced strongly in cities like Delhi, Mumbai,
Dhaka. In contrast, some of the coal-fired power plants continued the electricity production with only minor
reductions. Source: https://www.esa.int/, news story 24 April 2020.
chemistry, data assimilation applications, validation of regional air quality models and NOx emission inversion
studies. In particular the combination of the high spatial resolution, the large signal-to-noise ratio and daily
global coverage makes TROPOMI unique. This has been and will be further used for the analysis of emissions
and concentrations at the local scale, for individual cities, power plants, industrial complexes, road traffic and
shipping lanes. The power of TROPOMI is nicely demonstrated by the observation of pollution plumes from
individual ships [Georgoulias et al., 2020].
In 2020 the number of publications and attention in the media for TROPOMI NO2 observations has exploded.
As a result of the COVID-19 related lockdowns pollution levels have dropped dramatically as observed in
real-time by the TROPOMI instrument, largely consistent with surface observations [Gkatzelis et al., 2021].
This clearly demonstrates the value of real-time global monitoring of concentrations from space. Fig. 2 shows,
as example, COVID-19 lockdown impact on NO2 in India.
In the stratosphere NO2 is involved in some photochemical reactions with ozone and thus affects the ozone
layer (Crutzen et al. [1970]; Seinfeld and Pandis [2006]). NO2 in the stratosphere originates mainly from
oxidation of N2 O in the middle stratosphere, which leads to NOx , which in turn acts as a catalyst for ozone
destruction (Crutzen et al. [1970]; Hendrick et al. [2012]). But NOx can also suppress ozone depletion by
converting reactive chlorine and hydrogen compounds into unreactive reservoir species (such as ClONO2 and
HNO3 ; Murphy et al. [1993]).
Fig. 3 shows, as an example, the stratospheric NO2 distribution derived from TROPOMI measurements on
1 April 2018 at the 13:30 overpass local time. The image shows variability related to atmospheric transport and
diurnal variability in the stratosphere. In a study into the record ozone loss, triggered by enhanced NOx levels,
in the exceptionally strong Arctic polar vortex in Spring 2011, Adams et al. [2013] showed the usefulness of
such data when investigating the anomalous dynamics and chemistry in the stratosphere. With its high spatial
resolution and signal-to-noise ratio, TROPOMI is clearly well-suited to help understand the stratospheric NO2
content and its implications for the ozone distribution.TROPOMI ATBD tropospheric and total NO2 S5P-KNMI-L2-0005-RP
issue 2.2.0, 2021-06-16 – released Page 17 of 86
Figure 3: Distribution of stratospheric NO2 on 1 April 2018 along the individual TROPOMI orbits, derived with
processor version 1.2.0. The image shows that atmospheric dynamics creates variability in the stratospheric
columns, mainly at mid-latitudes. Furthermore we can see the effect of the increase of NO2 in the stratosphere
during daytime leading to small jumps from one orbit to the next. Note that the colour scale range is different
from the range in Fig. 1.
From observed trends in N2 O emissions one would expect a trend in stratospheric NO2 with potential
implications for persistent ozone depletion well into the 21st century [Ravishankara et al., 2009]. There have
been some reports of such trends in stratospheric NO2 , for instance from New Zealand [Liley et al., 2000] and
northern Russia [Gruzdev and Elokhov, 2009]. On the other hand, Hendrick et al. [2012] report that changes
in the NOx partitioning in favour of NO may well conceal the effect of trends in N2 O. TROPOMI continues
the important record of stratospheric NO2 observations that started with GOME in 1995, and improves the
detectability of trends.
Over unpolluted regions most NO2 is located in the stratosphere (typically more than 90%). For polluted
regions 50–90% of the NO2 is located in the troposphere, depending on the degree of pollution. Over polluted
regions, most of the tropospheric NO2 is found in the planetary boundary layer, as has been shown among
others in campaigns using measurements made from aeroplanes, such as INTEX (e.g. Hains et al. [2010]). In
areas with strong convection, enhanced NO2 concentrations are observed at higher altitudes due to production
of NOx by lightning (e.g. Ott et al. [2010]; Allen et al. [2021]).
The important role of NO2 in both troposphere and stratosphere implies that it is not only important to
know the total column density of NO2 , but rather the tropospheric NO2 and stratospheric NO2 concentrations
separately. A proper separation between the two is therefore important, in particular for areas with low pollution,
where the stratospheric concentration forms a significant part of the total column.
5.2 NO2 satellite retrieval heritage
Tropospheric concentrations of NO2 are monitored all over the world by a variety of remote sensing instruments
– ground-based, in-situ (balloon, aircraft) or satellite-based – each with its own specific advantages, and to
some extent still under development.
Stratospheric NO2 has been measured by a number of satellite instruments since the 1980s, such as
the spectrometer aboard SME (1981-1989; Mount et al. [1984]), SAGE-II/III (ERBS/Meteor-3M, 1984-2005;TROPOMI ATBD tropospheric and total NO2 S5P-KNMI-L2-0005-RP
issue 2.2.0, 2021-06-16 – released Page 18 of 86
GOME
SCIAMACHY
OMI
GOME-2A
GOME-2B
S5P/TROPOMI
GOME-2C
Sentinel-4
Sentinel-5
1997 2000 2003 2006 2009 2012 2015 2018 2021 2024
Figure 4: Overview of the European UV/Vis polar orbiting and geostationary backscatter satellite instruments
capable of retrieving tropospheric and stratospheric NO2 column data since the launch of GOME aboard
ERS-2, including missions to be launched in the near future.
Chu and McCornick [1986]), HALOE (UARS, 1991-2005; Gordley et al. [1996]), POAM (SPOT-3, 1993-1996;
Randall et al. [1998]), SCIAMACHY (ENVISAT, 2002–2012; Bovensmann et al. [1999], Sierk et al. [2006]),
OSIRIS (Odin, 2001–present; Llewellyn et al. [2004], Adams et al. [2016]), and ACE (SCISAT-1, 2003–present;
Bernath et al. [2005]).
Over the past 22 years tropospheric NO2 has been measured from UV/Vis backscatter satellite instruments
such as GOME (ERS-2, 1995–2011; Burrows et al. [1999]), SCIAMACHY (ENVISAT, 2002–2012; Bovensmann
et al. [1999]), OMI (EOS-Aura, 2004–present; Levelt et al. [2006]), the GOME-2 instruments [Munro et
al., 2006] aboard MetOp-A (2007–present), MetOp-B (2012–present) and MetOp-C (2019–present), the OMPS
instrument [Yang et al., 2014] on the Suomi NPP platform (2011–present) and the NOAA-20 satellite (2017–
present). TROPOMI (see [RD4]; Veefkind et al. [2012]) extends the records of these observations, and in turn
will be followed up by several forthcoming instruments including Sentinel 5 and the geostationary platforms
GEMS (Bak [2013], Kim [2020]; launched in 2020), TEMPO [Zoogman et al., 2017] and Sentinel 4 [Ingmann et
al., 2012], [RD5]. Fig. 4 shows the timelines of the NO2 data records of some of these instruments. Note that
TROPOMI, OMI, the GOME-2 instruments and Sentinel-5 provide (near-)global coverage in one day, and that
Sentinel-4 is a geostationary instrument.
For the UV/Vis backscatter instruments that observe NO2 down into the troposphere, KNMI has operated –
in close collaboration with BIRA-IASB, NASA and DLR – a real-time data processing system, the results of
which are freely available via the TEMIS website [ER6]. The data has been used for a variety of studies in
areas like validation (see e.g. Boersma et al. [2009], Hains et al. [2010], Lamsal et al. [2010]), trends (see
e.g. Van der A et al. [2008], Stavrakou et al. [2008], Dirksen et al. [2011], Castellanos and Boersma [2012],
DeRuyter et al. [2012]), and NOx emission and lifetime estimates (see e.g. Lin et al. [2010], Beirle et al. [2011],
Mijling and Van der A [2012], Wang et al. [2012]).
The DOMINO approach for OMI (and the similar approach called TM4NO2A for GOME, SCIAMACHY
and GOME-2) is based on a DOAS retrieval, a pre-calculated air-mass factor (AMF) look-up table and a data
assimilation / chemistry transport model for the separation of the stratospheric and tropospheric contributions
to the NO2 column (see Sect. 6 for details). The differences between the processing systems for the different
instruments are small and related to instrument issues, such as available spectral coverage and wavelength
calibration, other absorbing trace gases fitted along, and details of the cloud cover data retrieval.
The European Quality Assurance for Essential Climate Variables (QA4ECV) project ([RD6], [ER7], Boersma
et al. [2018]) has led to a homogeneous reprocessing dataset of NO2 for the sensors GOME, SCIAMACHY,
OMI and GOME-2A. This project has investigated and improved all the individual steps/modules in the NO2
retrieval. The new NO2 datasets are available via the QA4ECV project website at [ER8]. This new release
replaces the DOMINO-v2 OMI NO2 dataset and TM4NO2A datasets for the other sensors. Due to IT equipment
issues the OMI/QA4ECV dataset ends on 29 March 2021; a follow-up dataset, based on new collection-4 OMI
data, with reprocession of the full mission, is currently being set up.
The TROPOMI NO2 processor includes many of the developments from the QA4ECV project, including im-
provements in the TM5-MP/DOMINO chemistry modelling-retrieval-assimilation approach, DOAS optimisations
(cf. Van Geffen et al. [2020]) and air-mass factor lookup table. On top of that, several further improvementsTROPOMI ATBD tropospheric and total NO2 S5P-KNMI-L2-0005-RP
issue 2.2.0, 2021-06-16 – released Page 19 of 86
have been implemented, notably in the TM5-MP/DOMINO system and the output data file
5.3 Separating stratospheric and tropospheric NO2 with a data assimilation system
The NO2 processing system starts with a DOAS retrieval step that determines the NO2 slant column density,
which represents the total amount of NO2 along the line of sight, i.e. from sun via earth’s atmosphere to
satellite. To determine the tropospheric NO2 slant column density, the stratospheric NO2 slant column density is
subtracted from the total slant column, after which the tropospheric sub-column is converted to the tropospheric
vertical NO2 column.
Several approaches to estimate the stratospheric NO2 amount have been introduced in the past. The
TM5-MP/DOMINO approach uses information from a chemistry transport model by way of data assimilation to
simulate the instantaneous stratospheric NO2 distribution and to force consistency between the stratospheric
NO2 column and the satellite measurement [Boersma et al., 2004]. Other methods applied elsewhere include
the following (in arbitrary order).
a) The wave analysis method uses subsets of satellite measurements over unpolluted areas to remove
known areas of pollution, i.e. areas with potentially large amounts of tropospheric NO2 , from a 24-hour
composite of the satellite measured NO2 and expands the remainder with a planetary wave analysis
across the whole stratosphere, followed where necessary by a second step to mask pollution events
(e.g. Bucsela et al. [2006]). This approach has been used between 2004 and 2012 for the OMI NO2
Standard Product (SP) of NASA/KNMI.
b) The reference sector method method uses a north-to-south region over the Pacific Ocean that is as-
sumed to be free of tropospheric NO2 , as there are no (surface) sources of NO2 , so that all NO2
measured is assumed to be in the stratosphere (e.g. Richter and Burrows [2002], Martin et al. [2002]).
This stratospheric NO2 is then assumed to be valid in latitudinal bands for all longitudes. In some
implementaions this method is extended with a spatial filtering to include other relatively clean areas
across the world (e.g. Bucsela et al. [2006], Valks et al. [2011]).
c) Image processing techniques assume that the stratospheric NO2 shows only smooth and low-amplitude
latitudinal and longitudinal variations (e.g. Leue et al. [2001], Wenig et al. [2003]). This approach will
probably miss the finer details in the stratospheric NO2 distribution (as is the case for methods a and b
above). The next version of NASA’s OMI NO2 SP will use a similar approach [Bucsela et al., 2013].
d) Independent stratospheric NO2 data, such as collocated limb measurements (e.g. Beirle et al. [2010],
Hilboll et al. [2013b]) or data taken from a chemistry transport model (e.g. Hilboll et al. [2013a]), can
be subtracted from the total (slant) column measurements to find the tropospheric NO2 concentrations.
Unfortunately, limb collocated stratospheric measurements are not available for satellite retrievals from
the GOME(-2), OMI, and TROPOMI sensors. Nevertheless this approach is potentially very useful for
comparison and validation studies. Possible cross-calibration problems between the stratospheric and
the total measurements would complicate the approach.
e) The STRatospheric Estimation Algorithm from Mainz (STREAM; Beirle et al. [2016]). The STREAM
approach is based on the total column measurements over clean, remote regions as well as over
clouded scenes where the tropospheric column is effectively shielded. STREAM is a flexible and robust
interpolation algorithm and does not require input from chemical transport models. It was developed as
a verification algorithm for the then upcoming satellite instrument TROPOMI, as a complement to the
operational stratospheric correction based on data assimilation. STREAM was successfully applied to
the UV/vis satellite instruments GOME 1/2, SCIAMACHY, and OMI. It overcomes some of the artifacts
of previous algorithms, as it is capable of reproducing some of the gradients of stratospheric NO2 , e.g.,
related to the polar vortex, and reduces interpolation errors over continents.
f) The Standard Product 2 (SP2) includes a new stratospere-troposphere separation approach (Bucsela et
al. [2013]). This approach has aspects in common with STREAM. It is based on the measurements only
and uses tropospheric pollution masking and subsequent interpolation over the masked areas.
These ways of treating the stratospheric NO2 field may not be accurate enough to capture the variability
of the stratospheric NO2 in latitudinal and longitudinal direction, as well as in time. At the same time it is
not certain whether these methods do actually separate stratospheric NO2 : some of the NO2 interpreted as
"stratospheric" may be in the (upper) troposphere.
Also the assimilation approach suffers from these uncertainties, but in a different way since actual meteor-
ological fields are used to model the dynamical and chemical variability of NOx in the stratosphere and free
troposphere. The assimilation analyses the retrieved total slant column with a strong forcing to the observationsTROPOMI ATBD tropospheric and total NO2 S5P-KNMI-L2-0005-RP
issue 2.2.0, 2021-06-16 – released Page 20 of 86
Table 1: NO2 data product requirements for the TROPOMI NO2 data products, where accuraries are split in
the systematic and random components. The numbers are taken from [RD11]; see also the Product ReadMe
File (PRF; available via [ER3]).
NO2 data product Vertical resolution Bias Random
Stratospheric NO2 Stratospheric column < 10% 0.5×10¹⁵ molec/cm2
Tropospheric NO2 Tropospheric column 25 − 50% 0.7×10¹⁵ molec/cm2
over clean regions (regions with small tropospheric column amounts). The data assimilation ensures that
the model simulations of the stratospheric NO2 column agrees closely with the satellite measurements. The
modelled stratospheric NO2 (slant column) amount is subtracted from the full column observation to derive the
tropospheric column.
The use of a data assimilation system to provide stratospheric NO2 concentrations has been shown to
provide realistic results, as indicated by validation studies. For example, Hendrick et al. [2012] found very
good agreement between satellite retrievals using data assimilation to estimate the stratospheric NO2 column
(GOME, SCIAMACHY and GOME-2) and ground-based measurements at the station of Jungfraujoch.
The advantages of the use of stratospheric chemistry transport modelling in combination with data assimil-
ation are:
• The system models the chemistry (diurnal cycle) and dynamics of the stratosphere based on meteorolo-
gical analyses.
• Data assimilation provides a realistic error estimate of the stratospheric NO2 column [Dirksen et al., 2011].
• The height of the tropopause, obtained from the meteorological data, provides a point of separation of
the stratospheric from the tropospheric NO2 column.
• The result of the data assimilation is a comprehensive understanding of 3-D NO2 distributions that covers
the whole world, taking into account the spatial and temporal variability of the NO2 profiles.
5.4 NO2 data product requirements
S5P/TROPOMI mission requirements have been discussed in several documents, including the GMES
Sentinels-4, -5 and -5Precursor Mission Requirements Document [RD5] and the Science Requirements
Document for TROPOMI [RD7]. These requirements are based on the findings of the CAPACITY [RD8],
CAMELOT [RD9] and TRAQ [RD10] studies. For the TROPOMI NO2 column data products the set of
requirements which are used as baseline in the routine validation work are the NO2 data product requirement
listed in Table 1; these are given in the "Sentinel-5P Calibration and Validation Plan for the Operational Phase"
document [RD11] and also given in the NO2 Product ReadMe File (PRF; available via [ER3])
The uncertainties stated in Table 1 include retrieval errors as well as instrument errors. Over polluted areas
retrieval errors will dominate the uncertainties; these relate to the presence of clouds and aerosols and to the
surface albedo. Over rural areas, with low NO2 concentrations, errors in tropospheric NO2 are mostly driven by
random noise related to the instrument’s Signal-to-Noise Ratio (SNR), to estimates of the stratospheric NO2
column, and to uncertainties in the NO2 profile.
5.5 NO2 retrieval for TROPOMI
The TROPOMI retrieval of total and tropospheric NO2 is based on the TM5-MP/DOMINO system (see Sect. 6.1),
thus extending the long-term record of NO2 data, produced using a reliable, well-established and well-described
processing system (see Boersma et al. [2004], Boersma et al. [2007] and Boersma et al. [2011]). In particular,
the inclusion of many of the retrieval developments of the QA4ECV project ([RD6], [ER7]) in the TROPOMI
NO2 retrieval will ensure a good continuity from the QA4ECV OMI and GOME-2 NO2 records to TROPOMI.
For the OMI NO2 retrieval a number of improvements are related to spectral fitting [Van Geffen et al., 2015]
and to the chemistry modelling, stratosphere-troposphere separation and the air-mass factor [Maasakkers et
al., 2013]. The TROPOMI NO2 processing chain is described in Sect. 6.5.
In order to comply with the SI unit definitions, the TROPOMI NO2 data product file (described further in
Sect. 6.6) provides the trace gas columns in mol/m2 , rather then in the commonly used unit molec/cm2 . For
convenience sake, most of the text and figures of this document will remain in the latter unit; only the tables
listing the input (Sect. 7.1) and output (Sect. 7.4) dataset use the SI based units.You can also read