OPEN GOVERNMENT DATA IN CHILE - RODRIGO BASOALTO WALKER
←
→
Page content transcription
If your browser does not render page correctly, please read the page content below
PONTIFICIA UNIVERSIDAD CATOLICA DE CHILE
SCHOOL OF ENGINEERING

       OPEN GOVERNMENT DATA IN CHILE

                 RODRIGO BASOALTO WALKER

   Thesis submitted to the Office of Research and Graduate Studies
   in partial fulfillment of the requirements for the degree of
   Master of Science in Engineering

   Advisor:
   JAIME NAVÓN

   Santiago de Chile, August 2012

   ⃝
   c MMXII, RODRIGO BASOALTO WALKER
⃝
c MMXII, RODRIGO BASOALTO WALKER
Se autoriza la reproducción total o parcial, con fines académicos, por cualquier medio
o procedimiento, incluyendo la cita bibliográfica que acredita al trabajo y a su autor.PONTIFICIA UNIVERSIDAD CATOLICA DE CHILE
SCHOOL OF ENGINEERING
OPEN GOVERNMENT DATA IN CHILE
RODRIGO BASOALTO WALKER
Members of the Committee:
JAIME NAVÓN
ANDRÉS NEYEM
CLAUDIO NÚÑEZ
LUIS CIFUENTES
Thesis submitted to the Office of Research and Graduate Studies
in partial fulfillment of the requirements for the degree of
Master of Science in Engineering
Santiago de Chile, August 2012
⃝
c MMXII, RODRIGO BASOALTO WALKERAd Iesum per Mariam.
ACKNOWLEDGEMENTS

    In the first place, I want to thank God, for through His goodness we’ve received all
that we have. In His providence, He continually guides and provides for us with what we
need.

    I want to thank my advisor, professor Jaime Navón, who helped me along the way,
provided guidance, and prudent advice, always looking after my best interest.

    I also want to thank Synopsys, my current employer, for patiently giving me time to
work in this thesis.

    Thanks, also, to many friends, who helped along the way. Juan Esteban, José Antonio,
Francisco, Juan Pablo, Daniel, among many others. Especially I’d like to thank María
Trinidad, for being there in the good times, and the bad times as well.

    And last, but not least, thanks to my parents, who always gave their best efforts pur-
suing my education. They gave continuous advice and support, always in my benefit.

                                                                                        v
Contents
Acknowledgements . . . . . . . . . . . . . . . . . . . . . . . . . . . . . . . . v
List of Figures . . . . . . . . . . . . . . . . . . . . . . . . . . . . . . . . . . . viii
Abstract . . . . . . . . . . . . . . . . . . . . . . . . . . . . . . . . . . . . . . ix
Resumen . . . . . . . . . . . . . . . . . . . . . . . . . . . . . . . . . . . . . . x
Chapter 1. Introduction . . . . . . . . . . . . . . . . . . . . . . . . . . . . . 1
1.1. Transparency . . . . . . . . . . . . . . . . . . . . . . . . . . . . . . . 2
1.2. Open Government Data . . . . . . . . . . . . . . . . . . . . . . . . . . 3
1.3. Data formats . . . . . . . . . . . . . . . . . . . . . . . . . . . . . . . 4
1.3.1. Linked Data . . . . . . . . . . . . . . . . . . . . . . . . . . . . . 6
1.4. Licensing . . . . . . . . . . . . . . . . . . . . . . . . . . . . . . . . . 7
1.5. Access to data . . . . . . . . . . . . . . . . . . . . . . . . . . . . . . . 8
Chapter 2. Open Government Data in Chile . . . . . . . . . . . . . . . . . . . 10
2.1. Introduction . . . . . . . . . . . . . . . . . . . . . . . . . . . . . . . . 10
2.1.1. Current state of transparency in Chile . . . . . . . . . . . . . . . . 10
2.1.2. Open Government Data . . . . . . . . . . . . . . . . . . . . . . . 11
2.2. Current state of OGD . . . . . . . . . . . . . . . . . . . . . . . . . . . 12
2.2.1. OGD in developed countries . . . . . . . . . . . . . . . . . . . . . 12
2.2.2. Progress of OGD in Chile and other developing countries . . . . . . 13
2.3. Implementing OGD in Chile . . . . . . . . . . . . . . . . . . . . . . . 14
2.3.1. Learn from other countries’ experience . . . . . . . . . . . . . . . . 15
2.3.2. Start small . . . . . . . . . . . . . . . . . . . . . . . . . . . . . . 15
2.3.3. 5-star ranking: point to the 3-4 star . . . . . . . . . . . . . . . . . . 16
2.3.4. Ease of access: the importance of the single data repository . . . . . 16
2.3.5. Awareness is essential for adoption . . . . . . . . . . . . . . . . . . 17
vi2.4. Putting the data to work . . . . . . . . . . . . . . . . . . . . . . . . . . 17
2.4.1. Getting the data . . . . . . . . . . . . . . . . . . . . . . . . . . . . 18
2.4.2. Preparing the data . . . . . . . . . . . . . . . . . . . . . . . . . . 18
2.4.3. Displaying the data . . . . . . . . . . . . . . . . . . . . . . . . . . 19
2.5. Conclusions . . . . . . . . . . . . . . . . . . . . . . . . . . . . . . . . 20
Chapter 3. Conclusion and Future Research . . . . . . . . . . . . . . . . . . . 22
3.1. Results and lessons learned . . . . . . . . . . . . . . . . . . . . . . . . 22
3.1.1. State of the art . . . . . . . . . . . . . . . . . . . . . . . . . . . . 22
3.1.2. Transparency and OGD in Chile . . . . . . . . . . . . . . . . . . . 23
3.1.3. Recommendations and good practices . . . . . . . . . . . . . . . . 24
3.1.4. Application . . . . . . . . . . . . . . . . . . . . . . . . . . . . . . 25
3.2. Future work . . . . . . . . . . . . . . . . . . . . . . . . . . . . . . . . 26
3.2.1. Computer science . . . . . . . . . . . . . . . . . . . . . . . . . . 26
3.2.2. Other disciplines . . . . . . . . . . . . . . . . . . . . . . . . . . . 27
References . . . . . . . . . . . . . . . . . . . . . . . . . . . . . . . . . . . . . 28
viiList of Figures
2.1 Map of schools in downtown Santiago . . . . . . . . . . . . . . . . . . . . 19
viiiABSTRACT
Governments, in their functions, collect and produce data: budgets, statistics, con-
tracts, etc. Most of this data rightfully belongs to the people, so many countries have
transparency laws to ensure it’s made available. All this data could be used for many
purposes by citizens if it were in appropriate, computer-readable formats and under per-
missive licenses. Analyses, visualizations, applications, and businesses could be created
using this pool of data. The idea of Open Government Data (OGD) consists of publishing
this information freely in the web, and in open, standard formats, suitable for computer
processing.
OGD is well on its way in some countries, and just starting in others like Chile. Good
design decisions and adequate management can lead to great benefits at a very low cost
for the state.
In this thesis we introduce the concepts and the current state of transparency, OGD,
data formats, and data usage rights. We analyze the state of OGD, assessing its adoption,
and proposing a few necessary steps towards establishing a healthy OGD environment.
The research is focused particularly in Chile, as a good example of a developing country.
We build on top of the experiences that the US and the UK gathered from their own OGD
programs, and on guidelines laid out by the scientific community.
As a proof of concept, we developed a simple application, and documented the pro-
cess. This allowed us to better assess the state of Chile’s OGD portal and data quality.
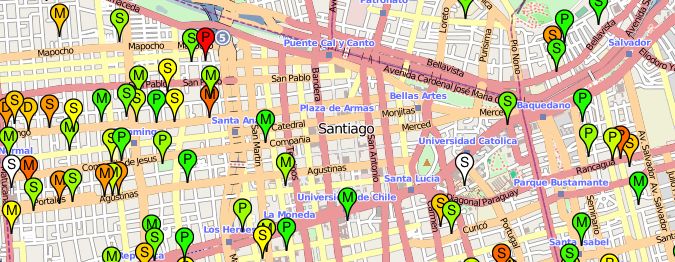
Using datasets from the Ministry of Education, we created a map to visualize all schools
and their scores as colored markers.
Keywords: e-Government, Open Government Data, Linked Data, Data Web
ixRESUMEN
Los gobiernos producen datos, incluso sin quererlo: presupuestos, estadísticas, con-
tratos, etc. La mayor parte de estos datos pertenece a la ciudadanía, y por eso existen
leyes que aseguran su derecho a acceder a ellos. Estos datos podrían ser usados por los
ciudadanos para muchos fines si estuvieran disponibles en formatos apropiados para su
procesamiento computarizado y bajo licencias que permitan su uso. Podrían analizarse,
o desarrollarse aplicaciones usando los datos. La idea de Open Government Data (datos
abiertos o públicos del gobierno, OGD) trata de la publicación de esta información en la
web, en formatos estándares y abiertos, y con licencias de uso permisivas.
Muchos países han avanzado en OGD, publicando grandes catálogos de datos, como
Estados Unidos y el Reino Unido. En los países en desarrollo, hay avances, pero queda
mucho camino por recorrer. Una buena implementación de OGD puede traer muchos
beneficios, a un bajo costo.
En esta tesis, describimos los conceptos de transparencia, OGD, formatos, y licencias
de uso. Analizamos el estado del arte en el mundo y el nivel de adopción de OGD. El
estudio está enfocado en Chile, como modelo de país en vías de desarrollo. Por eso pro-
ponemos algunas recomendaciones para la implementación de OGD, en países de estas
características, que creemos que llevarán a un buen ecosistema de OGD. Aprovechamos
las experiencias de grandes países que ya han avanzado en OGD, y los avances de la
comunidad científica.
Como una prueba de concepto, creamos un mapa usando datos del Ministerio de
Educación de Chile. En él mostramos información de los colegios, marcando de colores
una métrica del rendimiento académico. Esto nos permitió adentrarnos en el ambiente de
OGD de Chile, y conocer la calidad de los datos y los procesos para trabajar con ellos.
Palabras Claves: e-Gobierno, Datos Abiertos, Web Semántica, Web de Datos
xChapter 1. INTRODUCTION
Everyday and all the time, governments have to work with data. They have to make
decisions, evaluate the results of projects, among a myriad of other tasks, using data.
Governments produce data, they consume it, process it, transform it, and present it in
many different forms. They do this both for their internal use and for publishing.
This data rightfully belongs to the people, with the exception of secret data or citizens’
personal information. This data has been paid for through taxes, and some of it is definitely
relevant to people.
Most developed countries have laws of information access, and developing countries
are following their examples. The governments (and their organs) then have the duty
to provide the information requested by citizens, and even foreigners sometimes. In the
case of Chile, we have the transparency law (República de Chile, 2008). It mandates
government agencies to actively publish a set of public information, and also to diligently
fulfill requests from citizens. We will give a deeper view into transparency in section 1.1.
Now, with this information, people could examine the data to find something of their
interest (e.g. how much is senator X spending from public funds?), or do some basic anal-
ysis on it (e.g. what is the average family income in different regions of the country?).
More importantly, they can better analyze the data by mixing it with other datasets, either
from the same government, or from other sources (e.g. how does the family income cor-
relate with education quality in the region?). This can only be done with reasonable effort
if the data is in computer-readable formats. More on formats is discussed in section 1.3.
It’s also important to know precisely what can be done with the data. If it’s suitable for
commercial use, or what are the terms for redistribution, or whether attribution is required
in derivative works. In section 1.4 we’ll discuss the licensing issues.
The information needs to be accessed somehow. Also it should be easy to find. Sec-
tion 1.5 introduces the topic in more detail.
1Our objective in this investigation consists of three parts: first, to analyze the state
of the art in OGD, both in the scientific community and in real implementations; second,
to distill the experiences and proposals from the first part into a set of good practices and
recommendations specifically targeted for Chile; and third, to develop a simple application
using data from Chile’s OGD repository.
1.1. Transparency
In democratic societies, we expect our governments to be transparent about their do-
ings. We increasingly demand more and more information from them. Some of it for
the sake of accountability, some for the evaluation of government performance, some for
assessment of the status of the country in various matters.
Governments have always dealt with data. For example, censuses have been recorded
since ancient Egypt, Greece and Israel. Budgets, economic indices, personnel listings,
etc. Lately, however, a trend in transparency has been observed. Transparency laws have
been proposed and passed in most developed and developing countries, and citizens are
exercising their right to access information.
In Chile, since 2008 we have the transparency law. It mandates most government
bodies and state organs to actively publish some of their data, and to respond to requests
for information. But, more importantly, it deems public all the information in the hands
of public administration organs, unless subject to some exceptions protecting privacy, na-
tional security, and other few cases.
Transparency can benefit everyone. By exposing everything to the public, inefficien-
cies can be spotted, corruption can be detected, and the state of public affairs can be
assessed. In the example of public data usage on section 2.4 we analyze the state of pri-
mary and secondary education, not only public but also private. The same could be done
using public health data, or related to economic activities, or regional development.
These analyses we mention are probably already being done by the government it-
self. But most of them remain in the dark, or are only used as decision support and then
2archived. This information could be valuable to some organizations, even to businesses.
Let’s put a hypothetical example: the interior ministry can extract data from complaints of
energy theft, to instruct the police forces accordingly. But this same information could be
very valuable for utility companies, to help them decide whether to install regular cabling,
or the more expensive anti-theft cables, in different neighborhoods. This is one example,
in millions, in which businesses can harness the power of public data.
Anyway, the main reason behind transparency law is administration accountability.
Taxpayers want to know what is being done with their money. They want the resource us-
age to be efficient. They want to spot corruption and money leaks. That’s why practically
every transaction done by the administration is now open to public scrutiny. And there
have been scandals, and corrupt transactions have been discovered, and people have been
processed.
The benefits of transparency are obvious at this point. In the next section, we’ll intro-
duce the discussion on why transparency is not enough.
1.2. Open Government Data
Transparency is good. We want to know about what the government is doing for our
country, how it is spending our resources, and the results obtained. However, even if this
information is presented to us, there’s always the doubt whether the analyses were correct,
or if they took in account this or that factor, or how the current results compare to previous
years.
There’s many possibilities that are not explored with due diligence. And, of course,
it’s impossible for the government to explore them all; they cannot cover every citizen’s
interest, or every research area. That’s one reason why governments should spend less time
and effort presenting data, and should focus more on giving the data itself, as Robinson et
al. propose (Robinson, Yu, Zeller, & Felten, 2009). The government isn’t always the best
candidate for processing and presenting data. There are actors in the private sector who
are better suited to work with the data, and, to some extent, release the government from
3that responsibility. As Robinson writes it: there’s a wide gap between the exciting uses
of Internet technology by private parties, on the one hand, and the government’s lagging
technical infrastructure, on the other.
This all pushes towards the release of public data in raw, opening up the possibilities
for yet unimagined uses, powering applications which would benefit all, and uncovering
facts that were there, but the public sector could never discover.
1.3. Data formats
The first approach to transparency in Chile was to publish everything in PDF files.
This worked great for publishers and citizens alike, at least for a while. PDF is a portable,
standard format, free readers and creators exist for every major platform, and, most im-
portantly, people are familiar with it. The one, big drawback of PDF is that it’s almost the
same as paper. Works great for viewing, sharing, printing, but taking the raw data out of it
is impossible, or, at the very least, impractical.
When transparency information consumers wanted to analyze the data, they had to
resort to the old-fashioned manual methods. This was probably fine for them at the begin-
ning. But then, when information volume started to grow, and the level of detail increased,
the question arose: if authorities produce these documents from digitally stored raw data,
wouldn’t it be easier for everyone to work with that very same raw data?
This is where Open Government Data (OGD) initiatives becomes relevant.
We’ll use the 5-star ranking for open data on the web, proposed by Sir Tim Berners-
Lee (Berners-Lee, 2006). This ranking goes from 1 star for putting data on the web, in
whatever format, to 5 stars for fully linked data. By publishing PDFs, most of Chile’s
published documents is already rated at 1 star. 1 star rating requires the information to be
released under an open license. While some of Chile’s data is published under Creative
Commons Attribution license, some of the documents are published without specifying
4any license at all. A good example is Chile’s OGD portal1 , which clearly states the license
for each dataset.
This brings us to the 2-star rank: machine-readable data. One of the most frequent
uses that citizens or organizations give to OGD datasets is analysis and computerized
processing. Usually, interesting datasets are big, and obviously impossible to analyze by
hand. For example, for the application described in section 2.4, we display 13,000 schools,
and some of the datasets behind the score have over 370,000 records. This would definitely
be impossible to analyze manually. It’s very desirable, then, that datasets are published
in machine-readable formats, whatever that is. In most cases, the data to be published is
originally stored in some sort of database or spreadsheet, so the cost of publishing it in that
very same format is negligible. We’re not talking about specific formats for 2-star rank,
just any that is machine-readable will suffice. Even if it’s proprietary, rare, obsolete, or if
it can only be read with one specific program.
Of course it would be better to have data in open, standard formats, and that’s pre-
cisely the third star in the ranking. Instead of putting spreadsheets in Microsoft Excel
format, why not put it in CSV? Or Open Document Foundation’s ODS? This simple con-
version, or similar ones for other data sources, can benefit the users of OGD. Open and
standard formats allow developers to easily read data, parse it, and process it. Usually, the
conversion process is very straightforward. Most database engines, spreadsheet software,
and statistical analysis tools have the options to export data in open formats. The most
common and convenient are CSV for tabular data, and XML or JSON for semi-structured
data.
Now a new problem arises. For example, if in the data, in the location field for a
record, we find “Santiago”: does it mean the city of Santiago, Chile? Or maybe it’s the
whole province of Santiago. Or the Metropolitan Region of Santiago. Or maybe it’s
Santiago, Cuba, or any other Santiago. It’d be nice to know precisely what Santiago it’s
referring. Another example can further illustrate the issue: in one dataset for schools,
1 http://datos.gob.cl
5we can have a field named “principal”, referring to the school’s principal; but another
dataset may have “school_principal”, another “director”, and many other variations. If we
were to combine these datasets, we’d have to map the fields by hand. This task is usually
doable for medium-sized dataset, but it makes automatic data retrieval and combination
practically impossible. This problem is recurrent, and it has more than one solution, but
the gold standard is Linked Data, also known as “the semantic web”.
1.3.1. Linked Data
In essence, Linked Data consists of representing the information as RDF triples: sub-
ject, predicate, object. For example, Cheeta is_a monkey, and Monkeys eat bananas.
This permits some obvious reasoning, like Cheeta eats bananas. But the real trick is
the use of identifiers. All three components of the triple are uniquely identified. The most
common way to do this is by using URIs2 . Using URIs for entities has the added benefit
of knowing where to find additional information for them: usually an HTTP query on the
entity’s URI results in more data, further linking it to other entities and completing the
information.
This, in the context of OGD, enables a few key features: reasoning, extensibility, and
composability.
• Linked Data engines allow reasoning over the data. This opens the way for
complex queries which are not easily attainable using traditional databases. The
SPARQL query language, the de-facto standard, provides a very simple inter-
face to the reasoning power of RDF data stores.
• Linked Data is usually produced framed in a model, called an ontology. The
ontology defines the concepts in its domain, and describes the relationships
between them. Linked Data ontologies (which themselves are represented as
linked data), can be extended simply and effortlessly. A new ontology can be
created on top of an existing one, without needing to rebuild it, and keeping all
2 Uniform Resource Identifier, such as http://dbpedia.org/resource/Santiago for the city of Santi-
ago, Chile.
6the semantic relationships with the existing one. This enables the incremental
creation of ontologies and data, without the risk of obsolescence, and without
the cost of future-proof design. An application of this will be discussed in
section 2.3.2.
• Finally, Linked Data is, in its essence, composable. The same features described
for the extensibility allows us to create mappings between otherwise unrelated
ontologies. This, in our opinion, is really the decisive factor in favor of Linked
Data. It allows any mapping of public or private databases, and unlocks infer-
ence engines to walk all over the data corpus and reason over everything within
their reach. The open nature of the web, both philosophical and technical, en-
ables seamless integration and composition of data from diverse sources. On
this matter, Maali et al. (Maali, Cyganiak, & Peristeras, 2010) started working
on common vocabularies to link datasets to, making them interoperate effort-
lessly.
These features of Linked Data, together with the open nature of the web, can really
help unlock the potential of OGD. Even two years before data.gov.uk and data.gov were
launched, researchers were already reaching this conclusion (Alani et al., 2007).
One isolated study of Linked Data for public sector information in Chile, specifically
in the Library of the Congress, has come to good conclusions: the benefits are there,
the process is feasible, and their solution works (Cifuentes-Silva, Sifaqui, & Labra-Gayo,
2011).
1.4. Licensing
As we already discussed, the matter of OGD is new. Public data has been around
for a short time, and before that, everything was behind closed doors. Data was available
to people inside the government, or to select researchers, usually under non-disclosure
agreements and for specific purposes. When data began to be released to the public, no
use license was specified. So possible uses for the data were still unclear. The wording in
7the transparency law (República de Chile, 2008) section 11 c, loosely translated as “Prin-
ciple of openness and transparency, under which all information held by organs of state
administration is presumed public unless subject to the exceptions noted.”, just declares
the information “public”, so it’s not specific about the possible uses, required attribution,
nor any word is said about commercial uses of the information.
It’s very important for data users to have a specific license to outline their rights and
to formally state the requirements for using the data. Currently, Chile’s OGD portal of-
fers most of its datasets under Creative Commons Attribution license, which essentially
requires products, commercial or not, to cite the source of the data. There are a number of
suitable licenses for OGD, as recommended by the Open Knowledge Foundation (Open
Knowledge Foundation, 2011): the Creative Commons licenses such as CC-BY (Creative
Commons, n.d.), or, specifically crafted for Open Data, ODC-By (Open Data Commons,
n.d.-b), ODbL (Open Data Commons, n.d.-a), or dedication to the public domain using a
license such as PDDL (Open Data Commons, n.d.-c).
1.5. Access to data
We will discuss, as well, the different means for accessing the data. Historically, each
data producer published its own data. In Chile, under the current transparency law, this is
still the case. Every administration organ has to actively publish its mandated data, and
respond individually to requests, only based on the data available to them.
While this is intuitive and maybe obvious, it makes the process of finding data dif-
ficult and slow. In the search for data, users have to navigate through diverse interfaces,
accessing data cataloged in many different ways, under different licenses (if at all).
That’s why recent efforts on OGD have emphasized the existence of a single reposi-
tory of data. In such repository, data would be consistently cataloged, described, tagged,
and made available in common formats. All datasets would be available under the same
license, or at least the license for each dataset would be clearly indicated.
8Continuing with the ideal OGD repository, in the progress towards Linked Data, all
datasets would use a common vocabulary for common terms, or at least would provide
mappings to a common ontology, and would also provide a single query interface to op-
erate over the whole data corpus. This is the direction in which the US and the UK are
moving. They already have in place their central OGD repositories, even if not perfectly
complete. The UK has a Linked OGD project well on its way, as will be noted in section
2.2.1.1, and they are already providing some SPARQL query endpoints to end users and
developers to work with the Linked Data they release.
Coordinating all offices to work in a single common repository can be challenging.
Every administrative organ has its own internal workflows and rules, and it can be difficult
to adapt all of them to embrace the standards defined. However, in the pursuit for a good
OGD ecosystem, the benefit of a single repository vastly outweighs the difficulties.
9Chapter 2. OPEN GOVERNMENT DATA IN CHILE
The following chapter is a paper, submitted for publication in the Journal of World
Wide Web.
2.1. Introduction
Every government, in its regular functions, has to work with data. Budgets, statis-
tics, personnel, providers, contractors, and many other everyday objects and actions are
represented, stored, transmitted, processed and transformed digitally as data.
Every government, also, has a duty of being transparent to the people it governs.
We’ve seen a huge trend in this direction. Most countries have laws that enforce trans-
parency and freedom of information access. In Chile, we have the so-called Transparency
Law (República de Chile, 2008), which mandates every governmental organization to
publish some information, and to diligently provide the information requested directly by
citizens (with the obvious exception of secret data).
2.1.1. Current state of transparency in Chile
The transparency law has noticeably pushed transparency forward, in central, re-
gional, and communal governments. They have made available many budgets, financial
reports, personnel listings, acts, regulations, and other documents. It’s clear that a big ef-
fort has been put in this task. However, usually all we can get is just PDF documents with
tables in them, or even scanned PDFs of printed documents.
The Commission for Probity and Transparency1 recently surveyed a sample of 71
central government agencies, to find an average 96% of transparency law compliance
(Comisión de Probidad y Transparencia, 2012). On the other hand, a recent survey con-
ducted by the Transparency Council1 in Chile showed that, on average, municipalities
1 The Commission for Probity and Transparency is part of the central government, and channels the gov-
ernment’s effort towards transparency. The Transparency Council, on the other hand, is an autonomous
corporation, created by the transparency law, which promotes, guarantees and helps regulate everything
related to transparency and information access.
10comply only with 30% of what is required by law, although some reach up to 96% com-
pliance (Consejo para la Transparencia, 2012; Pérez, 2012). Unsurprisingly, low income
regions are the poorest performers.
2.1.2. Open Government Data
Transparency works well enough if we’re only interested in the information itself. For
example, if we want to investigate a particular contract, or find out the salary of the city
mayor. But what if we want to analyze the data? Or if we want to aggregate data from one
source with datasets obtained elsewhere? In all these cases transparency is not enough,
and we need a more profound change. Thus, the next step in the openness direction is
Open Government Data (OGD).
The basic, primitive OGD principle states that if the government has data that belongs
to the public, then it should be published. If possible, in open formats, or, even better,
as Linked Data, but at least it should be published in its original form. Tim Berners-Lee
has created an excellent 5-star ranking scale for Linked Open Data (Berners-Lee, 2006),
starting from simply publishing data with an open license, and up to publishing fully linked
data.
As expected, OGD must be open. The publisher must put the data under an open
license, to allow the use, combination, transformation, and possibly redistribution of the
data. Good examples of open licenses for OGD are CC-BY (Creative Commons, n.d.),
ODC-By (Open Data Commons, n.d.-b), ODbL (Open Data Commons, n.d.-a), or even
in the public domain using a license such as PDDL (Open Data Commons, n.d.-c) or
similar. These are the licenses recommended by the Open Knowledge Foundation (Open
Knowledge Foundation, 2011).
112.2. Current state of OGD
2.2.1. OGD in developed countries
Developed countries have gone a long way to reach the current state of their OGD ini-
tiatives. Most notable examples are the United Kingdom and the United States of America.
Barack Obama, on the first day as president of the USA, in 2009, issued a memoran-
dum for the heads of executive departments and agencies, pushing forward transparency
as a key objective of his administration (Obama, 2009). This directive, under the former
US CIO Vivek Kundra, gave birth to Data.gov2 , the US OGD repository. Around the
same time, in the UK, Tim Berners-Lee and Nigel Shadbolt were appointed to oversee the
creation of data.gov.uk3 . Its beta version launched on September 2009, with great appre-
ciation from the public, and when it launched officially, in January 2010, it had more than
2,400 registered developers using the data and providing feedback.
As of May 2012, Data.gov had about 4,500 raw datasets, and 385,000 geospatial
datasets. Data.gov.uk, on the other hand, had about 8,400 datasets4 . Citizen-developed
applications and uses range from comparisons between obesity, smoking, exercising, and
healthy eating in the US; to crime statistics in the UK, to a mobile application which finds
the nearest pharmacy.
2.2.1.1. Linked OGD
An interesting trend, which comes from the academic community and is increasingly
gaining traction in the government sector, is the use of Linked Data principles in OGD.
The full potential for Linked Data is yet to be uncovered with time, but some of it has been
explored (Alani et al., 2007). OGD is probably one of the areas which Linked Data can
benefit the most, both technically and in its uses (Shadbolt, O’Hara, Salvadores, & Alani,
2011). Most notably, the US and UK portals for OGD already offer some linked datasets5 .
2 http://www.data.gov
3 http://data.gov.uk
4 Numbers obtained from http://www.data.gov/metric and http://data.gov.uk/data respectively.
5 A summary of the US and UK Linked OGD initiatives can be found at http://www.data.gov/semantic
and http://data.gov.uk/linked-data.
12With Sir Tim Berners-Lee, and Professor Nigel Shadbolt guiding the OGD efforts in
the UK, the advent of Linked Data into Data.gov.uk was just waiting to happen. Much
of the early research on Linked OGD comes from Shadbolt’s work at the University of
Southampton.
The United States’ Data.gov, in collaboration with the Rensselaer Polytechnic Insti-
tute, have put some effort into it, using some machine learning and crowdsourcing tech-
niques to semantically annotate plain datasets (Ding et al., 2010a, 2010b; Erickson et al.,
2011).
2.2.2. Progress of OGD in Chile and other developing countries
During the last year or two, a certain interest in OGD has been noticeable in the
circles surrounding the Transparency Council. In this timeframe, the Chilean government,
through the Commission for Probity and Transparency, has pushed towards the release of
public data.
In mid 2011, a central OGD portal6 was launched, though only with a few datasets.
About 1 year later, by the end of May 2012, only 51 datasets were available. Most of
these were links to the websites of different government agencies, in which the user must
navigate and obtain the data by himself, usually having to fiddle around with filtering
options and export formats, all this in difficult to use, poorly designed interfaces.
We’ll discuss some of the issues encountered while using Chile’s OGD in more depth
in section 2.4.
Some important initiatives in which Chile and other developing countries (mostly latin
american) are involved are listed below:
• The UN Economic Commission for Latin Ameria and the Caribbean (ECLAC,
or CEPAL for its spanish name) has published a document aimed towards wider
adoption of OGD policies in Latin America and the Caribbean (Concha &
Naser, 2012). This document shows some of the potential benefits of OGD
6 http://datos.gob.cl/
13in the context of L.A., collects some lessons learned from other countries, and
shows some good practices that would help OGD take off in the region.
• The World Wide Web Foundation has partnered with the International Devel-
opment Research Centre, and the Berkman Center at Harvard University to es-
tablish an agenda and support the research on OGD in Latin America and the
Caribbean.7
• Several countries in Latin America, and more in the developing world, are par-
ticipating in the Open Government Partnership (OGP)8 . Besides Chile, other
countries like Brazil, Colombia, Dominican Republic, Guatemala, Honduras,
Mexico, Peru, and Uruguay are also participating and have already delivered
their commitments. The OGP commitments are broader than just OGD, but
they have a strong emphasis in transparency and accountability. OGP puts OGD
as a keystone for achieving the transparency levels expected for the globalized
world in the Internet era.
2.3. Implementing OGD in Chile
The implementation and development of OGD policies in Chile is already happening.
Although, the current state is nothing but a small collection of already-available links to
data sources in heterogeneous formats, and with absolutely no semantic coherence. The
transparency law already paved the way in regulation terms, but from the technical side
there’s still much work to be done.
On the broader topic of OGD feasibility, the Web Foundation and Fundación CTIC al-
ready conducted a very thorough study (Alonso et al., 2011), concluding that it’s perfectly
feasible. Their study is mostly focused on the government itself, its will to implement
OGD, the possible difficulties, and the regulatory environment; they cover most of the
7 More info on this partnership can be found at their respective websites, http://www.webfoundation
.org/projects/odrs/ and http://www.idrc.ca/EN/Regions/Latin_America_and_the
_Caribbean/Pages/ProjectDetails.aspx?ProjectNumber=106286.
8 http://www.opengovpartnership.org/
14politics and non-technical aspects. The facts have proved them right: OGD is now hap-
pening.
We’ll try to delve a little bit into the technical aspects of OGD, particularly in the
context of Chile, but applicable to a broad range of developing countries. We’re not trying
to set standards or guidelines, but rather expose what we believe are good practices that
will help countries create active, high quality OGD ecosystems.
2.3.1. Learn from other countries’ experience
In science, and open source software, to “stand in the shoulder of giants” is the rule.
We think that it should be the rule in many other areas as well, including OGD. A lot
of work has been done by others, not only in the scientific side, but also in the technical
aspects of OGD. And of course the legal, administrative, and governmental organization
sides have been extensively explored too (Concha & Naser, 2012; Alonso et al., 2011).
The two main exponents, at least from the technical side, are the United States and
the United Kingdom, as they started their OGD initiatives before any other country. The
experience gathered by data.gov and data.gov.uk is most valuable, and will certainly help
other countries avoid some (or most) missteps along the way. Their extensive developer
community has already hit the most common roadblocks, and can provide good feedback
on what they like or miss.
It’s true, every country is different. Governments are different, societies are different,
needs are different. But data is just data, anywhere, so don’t try to reinvent the way data
is published, but rather learn from other countries’ successes and failures.
2.3.2. Start small
Current software development methodologies are steering away from clearly-defined-
from-the-beginning specifications towards build-as-you-go products. These new tenden-
cies on agile software development allow software products to effortlessly change accord-
ing to their users’ needs. This also allows software to get real-world usage feedback earlier
in the development of the product, gaining valuable time and effort.
15OGD should follow the same methodology. We’re not dealing with life-critical sys-
tems, but rather with tools that help people analyze data. We won’t know for sure how
people will use the data until they start using it. So it’s best to publish the data as soon as
possible, and then, based on the real usage, focus the efforts on what is needed the most.
One particular example of starting small goes for Linked OGD. Publishers don’t need
to model the whole domain of the data they ever plan to release. Instead, the consensus in
the scientific community is that small models (ontologies) should be created, specific to
the domain of each data producer (Alani et al., 2007), (Shadbolt et al., 2011). Later these
models can be expanded and interliked with others, collectively growing to a more general
model, but keeping each unit small, manageable, and maintainable.
2.3.3. 5-star ranking: point to the 3-4 star
The semantic web potentials are huge, so it’s very desirable that all data is fully linked,
using standard terms for common concepts, and linking to well-known databases for cities,
regions, organizations. However, the effort to reach that level of quality is too big, and the
real benefits are still not evident. And as we pointed out in section 2.3.2, it’s better to
get the data out in the wild soon, than perfecting it and wasting all that time in which the
data could have been given good use. So, following the 5-star ranking by Berners-Lee
(Berners-Lee, 2006), we believe that Chile (and similar countries), to get a useful OGD
corpus, should start publishing 3-star data, and gradually move select datasets to RDF and
link them to get 4 and 5-star.
2.3.4. Ease of access: the importance of the single data repository
Journalists, developers, or common citizens looking for data, are currently forced to
go through every data publisher related to the topic they are investigating. Within the
publishers’ websites, they have to navigate, often through overly complicated interfaces,
to find what they need (if it is published at all). Then, when they finally get the data they
were looking for, they find it in diverse formats, under different licenses (if any specific
16license), and in the end they often need to manually pre-process the data to get into a
usable shape.
This process can be dramatically simplified by simply putting datasets in a single
repository, tagged by category, topic, origin, format, etc. They can be put under a single,
clear license, preferably open enough to allow commercial use. And finally, data producers
can be asked to upload the data in a few preferred formats, or at least batch transform
common formats to their open counterparts (e.g. Excel to CSV or XML).
Then, with the coming of Linked OGD, this single repository of data can be used as a
base for common terms, and as a place for mappings between different ontologies. Also,
it’s a good place for a SPARQL endpoint, which can query and reason on the whole OGD
corpus.
2.3.5. Awareness is essential for adoption
It’s important to show the benefits of open data to decision makers in the government,
so it’s necessary to get as many people as possible on board the OGD train. We believe
that considerable effort should be put into boosting OGD adoption in developers and jour-
nalists. Developers can find interesting ways to process, combine, analyze, and display the
data, and journalists can expose interesting facts to wider audiences, again gaining more
exposure for OGD and feeding the loop. Some ways to achieve this would be to organize
app contests, hackatons, and give incentives for data-driven apps and data journalism.
Summarizing: for OGD to gain more support from the government, it’s essential that
the community shows interest, and that they make something with the data as it becomes
available.
2.4. Putting the data to work
As a real world experiment, we developed a web application based on some datasets
from Chile’s OGD catalog. Since the catalog is scarce, we opted for the most complete
group of datasets. The Ministry of Education has data available about every school in
17Chile, geo-referenced, and contains grade averages, financing, university admission test
scores9 , attendance summaries, pass/fail/dropout statistics, and others.
The application consists of a map, with markers on every school. The markers are
colored in a red-to-green scale based on a normalized score computed from the test data
available. It also shows the school administrative category in one letter10 . This visualiza-
tion clearly shows areas in which the scores of the schools are very poor, and vice versa11 .
2.4.1. Getting the data
We will describe the process of obtaining the data, and getting it ready for use. First
of all, part of the goal was to only use data reachable through Chile’s OGD portal. From
the around 50 datasets, about half were from the ministry of education. The quality of the
data was pretty good, relatively up-to-date, having data up to 2010.
Even if the data was accessible from Chile’s OGD portal, they only had a link to the
ministry of education data portal12 , which offers it in Excel and CSV, and an undocu-
mented API which offers some search functionality and more formats such as XML or
JSON. One note on the formats, though: XML are in a very verbose, Microsoft-based
schema, so in-memory processing is impossible for medium-to-large datasets. CSV files
are improperly escaped, so commas within fields misalign the rest of the row. It seems
that the tools used to manage the databases are a bit precarious and not very user friendly.
2.4.2. Preparing the data
So, once we got our hands on the data, we needed to prepare it for use. Normally
one would want the data in a relational database, or some form in which it can be queried,
operated on, etc. First the data had to be normalized, separated, and distributed in tables.
Different tables had much of the same data duplicated, e. g. school names, locations,
9 Chile has a standard University Selection Test (PSU, Prueba de Selección Universitaria).
10 Schools in Chile can be Municipal (state-owned), private but financed by the state partially or completely,
or private.
11 Please note we’re not trying to relate this score with school quality. The score only reflects the performance
on the tests mentioned before.
12 http://data.mineduc.cl/
18types, were present in all datasets, instead of having a different table with just school
names and data, and then referring it from the other tables. Also it’s important to note
that not all data was available for all schools, we guess some of it was due to privacy
concerns (you don’t want to publish the average test score for just 3 students), some due to
unavailability or other unknown reasons; it may be useful to know why a particular piece
of data is missing.
2.4.3. Displaying the data
Using the before mentioned data, we built a simple web application based on the
OpenLayers13 Javascript library, and OpenStreetMap14 , overlaying the colored markers
on it. A part of the map can be seen in figure 2.1.
F IGURE 2.1. Map of schools in downtown Santiago.
This map provides an intuitive visualization for the data. It shows, through the colors,
a general notion of school scores in different areas, and makes easy to query the data for a
particular school by clicking its marker.
While this application was created simply as a proof-of-concept, it is definitely useful
to some groups. What’s remarkable is the simplicity and short development time it took:
about a week from concept to working state. The short time is mostly due to the great
13 http://openlayers.org/
14 http://openstreetmap.org/
19visualization tools freely available, and the simplicity of data manipulation in modern
languages such as Ruby. This shows that simple yet effective apps can be created quickly
and easily, after the data is available, thus showing the great potential for OGD in the
developer community.
2.5. Conclusions
First and foremost, OGD is beneficial for society. It is an evolution for transparency,
and enables tools to better analyze and visualize what the government is doing and what’s
happening in the country.
This evolution in transparency depends on three main actors: the government, devel-
opers, and the press. Government, of course, provides the data, developers make the data
analysis and visualization tools, and the press shows interesting results and hosts discus-
sion on important topics.
A keystone for the development of the OGD ecosystem is the choice of formats. Sim-
ple, open, and interoperable formats are the best way to encourage data usage, and the
effort required to publish data in suitable formats is minimal. Linked OGD presents a big-
ger challenge, and should be taken seriously, but it’s worth the effort, as it enables much
better analysis and understanding of the data.
OGD projects should start as soon as possible, no matter how many datasets will
be available at the beginning. This permits a quick feedback loop from the community
and allows the government to evolve in the direction that the people need. Linked Data
structure allows it to incrementally grow and improve, thus easing the initial release to the
level of a basic semantic annotation and object identification.
All these benefits don’t come without its dangers. Data-based journalism very fre-
quently lacks sound statistic methods, and can lead to wrong conclusions. It’s also impor-
tant to raise the awareness on the matter, and encourage analysts to share their methods
20for analysis, so errors can be detected and, in general, data journalism quality can be im-
proved. The selection of data analysis tools, and their proper use, is essential to getting
correct and sound analysis, together with open and transparent analysis methods.
21Chapter 3. CONCLUSION AND FUTURE RESEARCH
Open Government Data is going to induce a change in democracy. Being able to
independently analyze and use the data will change the political environment around the
government. Governments will lose the monopoly of information presentation. Obviously
they will still be providing the data, but concealing truths is going to be a lot more difficult.
And citizen participation will change. With the new analysis power given through OGD,
concrete propositions will start surfacing from the people. Democracy will now become
even more democratic.
3.1. Results and lessons learned
Going over what has been done for this investigation, we went through 4 main stages:
• We researched on the state of the art in the field of open data, government trans-
parency, and, the combination of both, open government data.
• We assessed the status of transparency and OGD in Chile.
• We developed some recommendations and good practices.
• We built an application on top of real world datasets published in Chile’s OGD
portal.
Each of these stages led to its own set of partial conclusions and learned lessons. We’ll
describe them individually.
3.1.1. State of the art
First of all, we saw the real magnitude of the data web. We think Tim Berners-Lee
masterfully describes it in his TED talk in 2009 (Berners-Lee, 2009). It’s like the Web
revolution, 20 years ago, to the next level. The possibilities are endless.
Currently, the data web is, to say the least, disperse. There’s datasets all over the web,
in open and proprietary formats, under permissive and restrictive licenses. But most of
22it isn’t linked (in the ‘Linked Data’ sense of linked). There’s projects like DBpedia1 and
TWC LOGD2 , and they really make the web go forward, but we’re not quite there yet.
We learned the state of transparency in other countries. Developed countries have
some history in their transparency. They all (or most of them) have freedom of information
access laws, people exercise their rights. Non-governmental organizations exist, and they
work with transparency data, and they propose ideas, and publish analyses. We are, in
Chile, on the right track. See section 3.1.2 where we discuss further the case.
And more importantly, we saw how open data meets transparency, and leads to OGD.
In the last 10 years the idea has been gaining strength in the academia. The benefits have
been discussed, the risks assessed, and the technical challenges analyzed. This has enabled
the current existence of OGD in many countries.
3.1.2. Transparency and OGD in Chile
Focusing the research in Chile has given us deep knowledge on how Chilean govern-
ment works in regards of transparency, the legal framework, the implementation phase,
and the current state of adoption. At some levels, the adoption is really good, for example
some ministries have in place web-based request tracking systems, with automated man-
agement according to response deadlines (imposed by law), etc. On the other hand, some
municipalities barely have a website, and don’t comply even with the minimum required
by law. We think, after 7 years of the law being in effect, that still some time and effort
are needed for transparency to reach a good state.
We met with people in the government, in the commission of probity and transparency,
to discuss the current state of OGD in Chile, and the ongoing projects. By that time, the
OGD portal datos.gob.cl still hadn’t launched, it was just a project. There’s definitely
interest from the president, and his team, in pushing OGD forward. The project has made
1 http://dbpedia.org/.
2 Linking Open Government Data, of the Tetherless World Constellation, at the Rensselaer Polytechnic In-
stitute, http://logd.tw.rpi.edu/.
23a lot of progress, not without difficulties, and its future looks promising. We expect to see
a lot of developer and researcher interest in OGD in the following years.
In the process of assessing the state of open data in Chile, we came across the Library
of Congress, with an ongoing effort to publish all regulations and laws, in the web, as
linked data. Their project has been very successful, and it accomplished a very important
objective, which probably wasn’t foreseen when they started: they proved that it’s pos-
sible, using Chilean talent and knowledge, to build a project of that characteristics and
magnitude.
It is also worth mentioning a non-governmental organization which, in our opinion, is
a strong influence in the topics of transparency and OGD in Chile: Fundación Ciudadano
Inteligente3 (Intelligent Citizen Foundation). Particularly, Acceso Inteligente4 (Intelligent
Access) gathers requests of information from citizens, and displays them online. In their
catalog, there are request ranging from environmental studies of drinking water, to the
salaries paid in one municipality, to the breweries with approval from the ministry of
agriculture.
One project by Fundación Ciudadano Inteligente caught our attention. It’s one which
explicitly makes use of government raw data (although not so open by the time it was
created), and plots the location of cellular antennas in the country5 .
3.1.3. Recommendations and good practices
Having seen the two sides of OGD, the state of the art and the current state in Chile,
we started the task to propose some good practices, or what we believe are good ways to
make OGD work.
These recommendations were elaborated based on the scientific literature, and other
countries’ successes and failures in their OGD experiences. All this, taking into account
3 More about this foundation can be found in its website http://www.ciudadanointeligente.cl/.
4 See http://www.accesointeligente.org/.
5 The result can be seen in this website: http://senalalo.ciudadanointeligente.cl/.
24the idiosyncrasies of Chile, the technical background, the political landscape, and always
towards a better OGD implementation.
Some of them were obvious, like learning from other countries. They’ve ‘been there,
done that’, and they succeeded. Aiming for Linked OGD is also very desirable, seeing the
future of the web built on top of it. The potential benefits we’ve seen grossly outweigh the
costs. Publishing Linked OGD from day one is impossible, so we applied agile software
development methodologies to OGD: build incrementally. We saw the success of coun-
trywide OGD portals and immediately derived two conclusions: the benefit (or the need,
really) of data being in one common place, and the importance of getting as many users
on board as soon as possible. This is what has been fueling the success of US and UK
OGD portals.
3.1.4. Application
In the final stage, where we developed the application using OGD, we faced the real-
world issues of the current state of OGD in Chile. We had to deal with the suboptimal
OGD site of the Ministry of Education, its all-but-intuitive interface, and its data. As we
already described in section 2.4, the data quality was not perfect, nor complete. But it was
enough to build an interesting application, which hopefully will help people visualize the
state of education in Chile.
Another problem we found, is that data is often inconsistent with previous data. They
use different semantics, different parameters, different variables measured, and that leads
to datasets that cannot be compared easily year-on-year. There are some exceptions, of
course, but more than raw data, they appeared to be reports crafted in the form of data,
instead of raw unprocessed data.
In any case, there’s definitely a lot of potential in the data that’s available. Chile is
taking a very good direction in OGD policies, and we expect to see, very soon, a thriving
and healthy ecosystem around data.
253.2. Future work
Being OGD so multifaceted, there’s work to be done in every aspect of it. We’ll
propose future lines of work in two parts: those related to computer science, and those in
other fields.
3.2.1. Computer science
We think there are at least four big areas in computer science to expand the research:
theory of databases and web science; uses of data, applications, and statistic analysis; user
interface, cataloging, and search of datasets; and better, easier data analysis tools.
In theory of databases and web science, a lot is going on presently. RDF, the base
for Linked Data and the “Semantic Web”, is still not completely studied. SPARQL, the
query language, is just being formally defined. Algorithms, optimizations, everything is
just beginning to take form. There’s also room for studying the appropriate schemas and
structures for data storage, according to different kinds of data. Geospatial data, very
abundant in OGD, is a relatively new topic, and still immature.
For the uses of data, there’s a virtually infinite universe to explore. With new data
coming out constantly, there’s always the possibility to mix datasets, to do different statis-
tic analyses, and to build applications — even businesses — based on OGD.
User interfaces for data catalogs have still a long way to go. Organizing a large collec-
tion of data, correctly categorizing it, and providing good search tools is still a somewhat
unexplored territory. We hope to see advances in this area, because it’s probably the fea-
ture that would most promote the consumption of OGD.
Data analysis tools have a track record of being complex and very difficult to use.
Normally only statisticians or specially trained people can effectively use these existing
tools. If data is going to be more and more accessible, so should analysis. The design and
creation of new, easier tools for the general public is key for the continuing development
of the OGD ecosystem.
26You can also read