AIR (A) SCIENTIFIC ASSESSMENTS Part III - Commissioner ...
←
→
Page content transcription
If your browser does not render page correctly, please read the page content below
AIR (A) SCIENTIFIC ASSESSMENTS Part III
Traditional Owners
  The Commissioner for Environmental Sustainability
  proudly acknowledges Victoria’s Aboriginal community
  and their rich culture and pays respect to their Elders
  past and present.

  We acknowledge Aboriginal people as Australia’s first
  peoples and as the Traditional Owners and custodians
  of the land and water on which we rely. We recognise and
  value the ongoing contribution of Aboriginal people and
  communities to Victorian life, and how this enriches us.

  We embrace the spirit of reconciliation, working towards
  the equality of outcomes and ensuring an equal voice.

ISBN: 978-0-6485069-1-1
SCIENTIFIC ASSESSMENTS Part III Air

                                                                            Between 1996 and 2013, the length of the fire
Air                                                                         season in eastern Australia has increased,
This chapter includes assessments of Victoria’s                             in association with climate change. 4 This has
ambient air quality and the associated health                               necessitated more intensive fuel reduction burns
impacts of air pollution, emissions of major air                            over shorter periods. As fuel reduction burns must
pollutants, indoor air quality, stratospheric ozone,                        be undertaken during calm weather conditions
light pollution and odour pollution. It also includes                       that facilitate the buildup of air pollution, more
an assessment of noise pollution and its associated                         intense burn programs increase the risk of
health impacts.                                                             widespread particle pollution.
Background                                                                  As Victoria’s population increases, and the average
                                                                            age of the population increases, the health
Good air quality is essential for human health. The
                                                                            impacts of poor air quality are likely to increase,
links between air quality, population exposure and
                                                                            unless there is a decrease in air pollution. Climate
health are an increasing focus for research and
                                                                            change will compound existing threats: higher
policy development. The greatest adverse health
                                                                            temperatures and longer periods of reduced
effects from air pollution are usually experienced
                                                                            rainfall are likely to increase the risk of frequent
in densely populated areas that are exposed to
                                                                            and severe fires and dust storms and exacerbate
emissions from motor vehicles, industrial facilities
                                                                            conditions for summer smog formation. 5
and domestic activities (such as using wood
heaters), while significant smoke impacts from                              Environment Protection Authority Victoria
bushfires and planned burns (for example, fuel                              (EPA Victoria) has increased the number of air-
reduction, coupe and ecological burns) can cause                            monitoring stations since the publication of SoE
poor air quality in urban and rural areas.                                  2013. EPA Victoria now monitors air quality at 19
                                                                            sites across Victoria – 12 in Melbourne (Figure
Victoria’s air quality is considered good relative
                                                                            A.1), 5 in the Latrobe Valley (Figure A.2) and 1
to international standards, although poor air
                                                                            each in Geelong and Wangaratta. Since the 2014
quality is still measured near major industrial
                                                                            Hazelwood mine fire, EPA Victoria has worked with
facilities, during major incidents (such as bushfires,
                                                                            the Latrobe Valley community to design a more
industrial fires and dust storms) and during periods
                                                                            extensive air-monitoring network in the region. 6
of planned burns.

Recently, poor air quality in populated areas has
been recorded for multiple consecutive days near
major fires – notably the Hazelwood mine fire in
2014,1 the industrial fire at a recycling facility near
Coolaroo in 2017 2 and the peat fires near Cobden
in 2018. 3

1    EPA 2015, ‘Summarising the air monitoring and conditions during the
    Hazelwood mine fire, 9 February to 31 March 2014’, Carlton, Victoria
    http://www.epa.vic.gov.au/~/media/Publications/1598.pdf Accessed 3
    December 2018.
2    EPA, ‘EPA completes air monitoring campaign in Coolaroo’, Carlton,     4    Jolly M, Cochrane M, Freeborn P, Holden Z, Brown T, Williamson G,
    Victoria http://www.epa.vic.gov.au/about-us/news-centre/news-and-           Bowman D 2015, ‘Climate-induced variations in global wildfire danger
    updates/news/2017/july/21/epa-completes-air-monitoring-campaign-            from 1979 to 2013’, Nature Communications, 6(7537), pp. 1-11.
    in-coolaroo. Accessed 3 December 2018.                                  5    EPA 2013, ‘Future Air Quality in Victoria: Final Report, 2013’, Carlton,
3    EPA, ‘Last EPA air monitoring station leaving as Cobden gets the all       Victoria https://www.epa.vic.gov.au/~/media/Publications/1535.pdf
    clear’, Carlton, Victoria http://www.epa.vic.gov.au/about-us/news-          Accessed 3 December 2018.
    centre/news-and-updates/news/2018/may/08/last-epa-air-monitoring-       6    EPA, ‘Latrobe Valley air monitoring co-design’, Carlton, Victoria http://
    station-leaving-as-cobden-gets-the-all-clear Accessed 3 December            www.epa.vic.gov.au/our-work/programs/latrobe-valley-air-monitoring/
    2018.                                                                       latrobe-valley-air-monitoring-codesign Accessed 3 December 2018.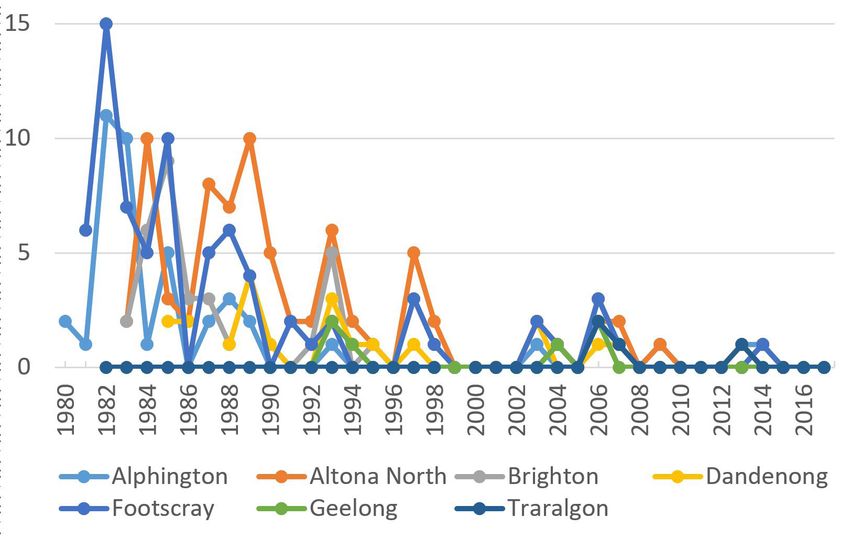
SCIENTIFIC ASSESSMENTS Part III Air

Figure A.1 EPA Victoria air-monitoring stations in Melbourne and Geelong

(Image source: EPA Victoria, 2018 )

Figure A.2 EPA Victoria air-monitoring stations in the Latrobe Valley

(Image source: EPA Victoria, 2018)

Victorian State of the Environment 2018 Scientific Assessments (A)
SCIENTIFIC ASSESSMENTS Part III Air

Despite EPA Victoria expanding its air-monitoring                              The critical challenges facing Victoria’s air-quality
network, a 2018 Victorian Auditor-General’s                                    management now and in the future include:
Office (VAGO) report found EPA Victoria cannot
                                                                               •      reducing air-pollution emissions and
demonstrate that its current monitoring provides
                                                                                      population exposure to air pollution emissions
a representative measure of ambient air quality
across the state. The VAGO report recommended                                  •      reducing human health impacts associated
an expanded air-monitoring network for Victoria                                       with an increasing and ageing population,
that better aligns coverage with pollution risks.7                                    particularly during pollution events and in
                                                                                      areas with greater air-pollution emissions
Studies investigating the long-term health effects
of air pollution have been conducted in Australia, 8,9                         •      expanding Victoria’s air-monitoring network
but there is no comprehensive understanding                                           to include a greater coverage across regional
of the impacts on human health. Few long-term                                         Victoria and some areas of Melbourne, as well
studies that document the association between                                         as including targeted roadside air-monitoring
mortality and air pollution exposure have been                                        sites
carried out in Australia. Given the delay between                              •      improving understanding of the sources
the publication of long-term studies and policy                                       and extent of air pollution through better
development, it is important to complement longer                                     monitoring and reporting and a more
studies with epidemiological studies that generate                                    comprehensive pollution inventory
useful associations between air pollution and
health impacts from just a few years of data. There                            •      improving knowledge of the link between air
is a increasing body of evidence demonstrating                                        quality and health, particularly during short-
that air pollution, even at concentrations below the                                  to-medium pollution events (for example,
current air-quality standards, is associated with                                     the effects of being exposed to significant
adverse health effects.10 The strongest evidence                                      amounts of smoke from bushfires, industrial
relates to premature mortality and effects on the                                     fires or planned burns)
respiratory and cardiovascular system.11                                       •      ensuring suitable buffer protection measures
Odour and noise can also impact wellbeing, while                                      are in place between odorous industries and
excessive exposure to noise can impact human                                          residential communities
health. Odour is the most frequent type of pollution                           •      identifying opportunities to include air quality
report received by EPA Victoria, prompting about                                      in urban planning decisions, particularly
4,000 reports per year.12 Common sources of odour                                     in relation to urban green space, and
pollution are landfills and composting facilities,                                    opportunities to reduce reliance on causes of
animal processing and intensive agriculture.                                          pollution (for example, motor vehicles)13

                                                                               •      identifying and managing the effects of
                                                                                      climate change on the impact of pollution
                                                                                      from bushfires, planned burns, summer smog
                                                                                      formation and dust storms.

7   VAGO 2018, ‘Improving Victoria’s Air Quality’, Melbourne, Victoria,
   https://www.audit.vic.gov.au/sites/default/files/2018-03/20180308-
   Improving-Air-Quality.pdf Accessed 3 December 2018.
8   Lazarevic N, Dobson AJ, Barnett AG, Knibbs LD 2015, ‘Long-term
   ambient air pollution exposure and self-reported morbidity in the
   Australian Longitudinal Study on Women’s Health: a cross-sectional
   study’, British Medical Journal 5(10), pp. 1-10.
9   Knibbs LD, Cortés de Waterman AM, Toelle BG, Guo Y, Denison L,
   Jalaludin B, Marks GB, Williams GM 2018, ‘The Australian Child Health
   and Air Pollution Study (ACHAPS): A national population-based cross-
   sectional study of long-term exposure to outdoor air pollution, asthma,
   and lung function’, Environment International, 120, pp. 394-403.
10 EPA 2018, ‘Air pollution in Victoria – a summary of the state of
   knowledge’, Carlton, Victoria https://www.epa.vic.gov.au/~/media/
   Publications/1709.pdf Accessed 3 December 2018.                             13    World Health Organization Regional Office for Europe 2016, ‘Urban
11 Ibid.                                                                            green spaces and health’, Copenhagen, Denmark http://www.euro.who.
12 EPA 2017, ‘2016-17 Annual Report’, Carlton, Victoria https://www.epa.vic.        int/__data/assets/pdf_file/0005/321971/Urban-green-spaces-and-
   gov.au/~/media/Publications/1665.pdf Accessed 3 December 2018.                   health-review-evidence.pdf Accesed 3 December 2018.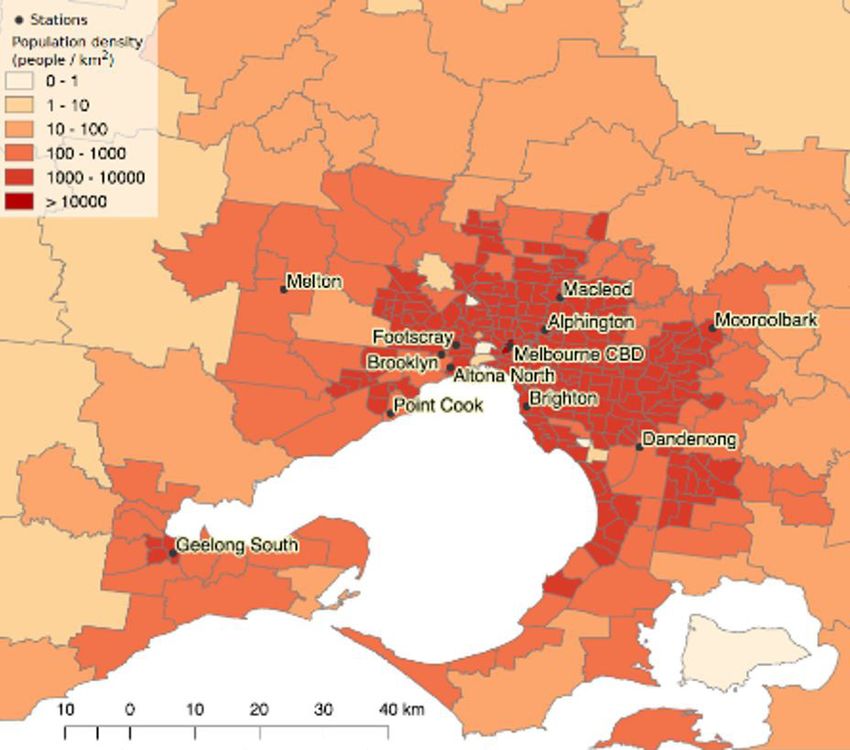
SCIENTIFIC ASSESSMENTS Part III Air

                                                                        Environment Protection Amendment Act 2018,
Current Victorian Government
                                                                        which provides the foundation for transforming
Settings: Legislation, Policy,                                          Victoria’s environment protection laws. The
Programs                                                                Victorian Government intends for this new
                                                                        legislation to take effect from 1 July 2020.
In May 2018, the Victorian Government released
Clean Air for All Victorians – Victoria’s Air Quality                   The updated legislation provides the foundation
Statement. The statement contains ideas on                              for the following changes:
what could be done to protect Victoria’s air
                                                                        •   a preventative approach through a general
quality through to 2030. Public comments on the
                                                                            environmental duty
statement, and a subsequent Clean Air Summit
and workshops, are informing the development of                         •   a tiered system of EPA Victoria permissions
a Victorian Clean Air Strategy for release in 2019.                         to support risk-based and proportionate
The Victorian Government has allocated                                      regulatory oversight
$1.2 million to develop this strategy, which will                       •   significant reforms to contaminated land and
articulate policy and programs to underpin air-                             waste management
quality management to 2030.
                                                                        •   increased maximum penalties
In 2016, a Ministerial Advisory Committee (MAC)
completed its inquiry into EPA Victoria. One of                         •   requirements for more environmental
the MAC’s recommendations was for EPA Victoria                              information to be publicly available
to ‘assess the adequacy of its air and water                            •   modernising and strengthening EPA Victoria’s
monitoring networks, particularly in relation                               compliance and enforcement powers.
to air quality and consider options to improve
                                                                        The 2018 VAGO report, Improving Victoria’s Air
data sharing and accessibility, and community
                                                                        Quality, recommended EPA Victoria:
communication’ (recommendation 6.3).14 Another
recommendation was to ‘create a consolidated                            •   expand its air-monitoring network
and enhanced environmental health capability
                                                                        •   improve its reporting on air quality
for Victoria within the EPA, with appropriate
governance arrangements recognising its critical                        •   expand and update its knowledge of Victoria’s
relationship with the Department of Health and                              air quality
Human Services’ (recommendation 6.2), which was                         •   work with all relevant councils to address
completed in December 2016.15,16                                            air-quality issues at the Brooklyn Industrial
The Victorian Government is investing $182.4                                Precinct
million to reform EPA Victoria into a modern                            •   work with the Department of Environment,
environmental regulator focused on preventing                               Land, Water and Planning (DELWP) to clarify
pollution, and to give the agency stronger powers                           the roles and responsibilities of relevant
and tools to prevent and manage instances of air                            Victorian Government agencies with respect to
pollution. The Environment Protection Act 1970 has                          air-quality management.
been reformed through two pieces of legislation:
the Environment Protection Act 2017, which                              DELWP and EPA Victoria have accepted all
establishes EPA Victoria as a statutory authority                       recommendations of the VAGO report and are
and legislates the role of its board, chief executive                   commencing actions to address them.
officer and chief environmental scientist, and the

14  MAC 2016, ‘Independent inquiry into the Environment Protection
   Authority’, http://www.epa-inquiry.vic.gov.au/__data/assets/
   file/0008/336698/Inquiry-report-EPA_June.pdf Accessed 3 December
   2018.
15 Ibid.
16 EPA, ‘Environmental public health’, Carlton, Victoria https://www.
   epa.vic.gov.au/our-work/environmental-public-health Accessed 3
   December 2018.

Victorian State of the Environment 2018 Scientific Assessments (A)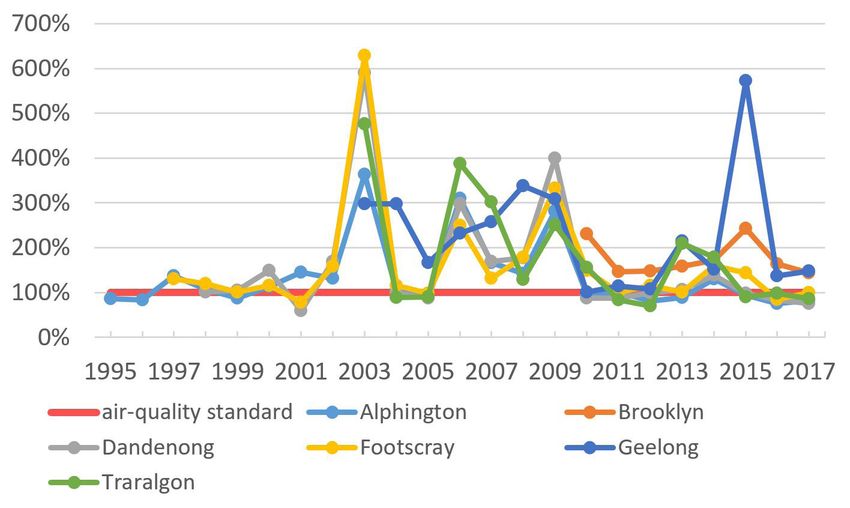
SCIENTIFIC ASSESSMENTS Part III Air

National and state ambient air quality legislation                                 In the absence of a coordinated indoor air quality
was amended in 2016 to reflect the adoption of                                     strategy or policy document, there are federal
annual and daily PM 2.5 standards and an annual                                    guidance documents relevant to indoor air quality
PM 10 standard.17 The Victorian annual PM 10                                       published by the Department of the Environment
standard was set to a much more stringent level                                    and Energy, the Australian Building Codes Board,
than the national standard. The amendment                                          and the Department of Health.23,24,25
also included a future tightening of the particle
standards in 2025.

Some regulations relevant to this chapter have
been revised, or are in the process of being revised,
including the:

•      Environment Protection (Vehicle Emissions)
       Regulations

•      State Environment Protection Policy (Control of
       Noise from Commerce, Industry and Trade) No.
       N-1

•      State Environment Protection Policy (Control of
       Music Noise from Public Premises) No. N-2

•      Environment Protection (Residential Noise)
       Regulations 2008.18,19,20

Other noise policies related to the material
presented in indicator A:06 (Odour and noise)
include the standard for internal noise levels in
apartment developments located near noise
sources. This standard was introduced in the
planning framework in 2017. 21

VicRoads administers a traffic noise reduction
policy that was developed in 2005 sets noise
criteria for freeways and aims to limit noise
impacts from new or upgraded roads.22

17   EPA, ‘Review of national ambient air quality standards’, Carlton,
     Victoria https://www.epa.vic.gov.au/your-environment/air/review-of-
     national-ambient-air-quality-standards Accessed 3 December 2018.
18   EPA, ‘Air legislation’, Carlton, Victoria https://www.epa.vic.gov.au/about-
     us/legislation/air-legislation Accessed 3 December 2018.
19   EPA, ‘Review of the noise SEPPs’, Carlton, Victoria https://www.epa.vic.
     gov.au/our-work/setting-standards/environmental-standards-reform/
     noise Accessed 3 December 2018.
20   EPA, ‘Review of Residential Noise Regulations’, Carlton, Victoria https://
     www.epa.vic.gov.au/our-work/setting-standards/review-of-residential-          23  Australian Department of the Environment and Energy, ‘Indoor air’,
     noise-regulations Accessed 3 December 2018.                                      Canberra, Australia http://www.environment.gov.au/protection/air-
21   DELWP, ‘Better Apartments’, East Melbourne, Victoria https://www.                quality/indoor-air Accessed 3 December 2018.
     planning.vic.gov.au/policy-and-strategy/planning-reform/better-               24 Australian Building Codes Board 2018, ‘Indoor Air Quality Handbook
     apartments Accessed 3 December 2018.                                             2018’, Canberra, Australia http://www.abcb.gov.au/-/media/Files/
22   VicRoads 2005, ‘Traffic Noise Reduction Policy’, Melbourne, Victoria             Resources/Education-Training/11HandbookIndoorAirQuality2018.pdf
     https://www.vicroads.vic.gov.au/-/media/files/documents/planning-                Accessed 3 December 2018.
     and-projects/environment/noise/trafficnoisereductionpolicy.                   25 Australian Department of Health 2002, ‘Healthy Homes - A guide to
     ashx?la=en&hash=6C28650833D6FD178B03FC47E5C7B60F Accessed                        indoor air quality in the home for buyers, builders and renovators’,
     3 December 2018.                                                                 Canberra, Australia.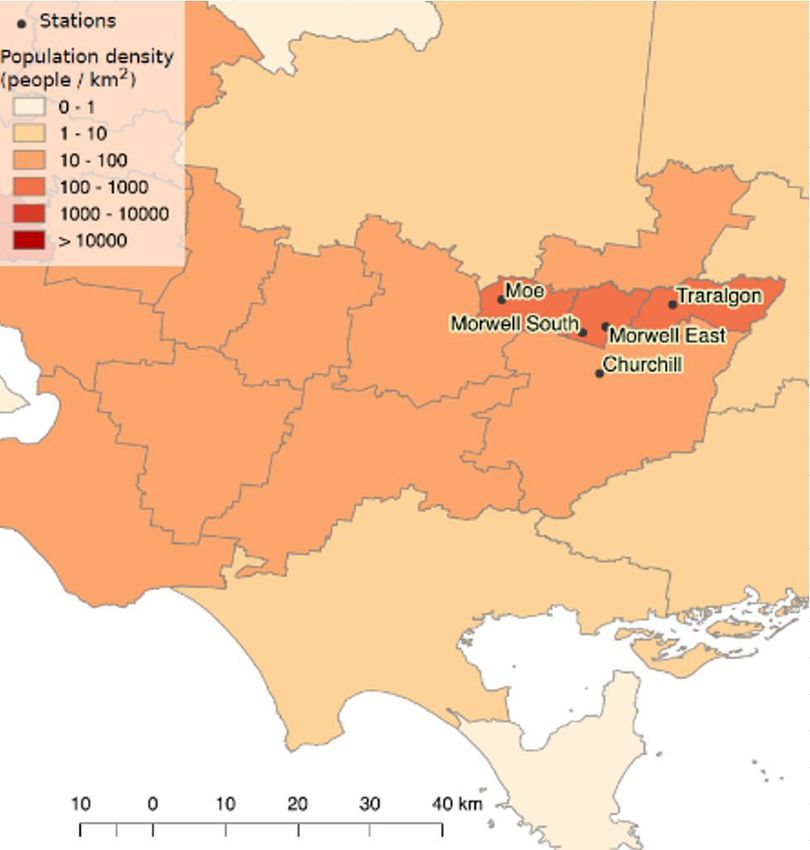
SCIENTIFIC ASSESSMENTS Part III Air

Ambient Air Pollutants
Note that:
1.   The data for these indicators (A:01 to A:04)
     has been sourced from EPA Victoria’s air-
     monitoring database (MONSYS).
2.   The data included in these indicators does
     not contain all of EPA Victoria’s air-monitoring
     stations. However, stations have been selected
     for inclusion in this report based on their
     length of operation (so as to provide a trend),
     proximity to populated areas and frequency of
     peak results.
3.   Data for Geelong comes from two sites
     (Geelong #1 from 1991 to 1996, and Geelong
     South from 1998 to 2017).
4.   Data for Melbourne City comes from four sites
     (Science Museum from 1981 to 1986, Parliament
     from 1992 to 1995, RMIT from 1996 to 2006, and
     Richmond from 2007 to 2014).
5.   The data included in these indicators is
     only taken from monitoring equipment that
     meets current or historical reference criteria
     for assessment against the legislated air-
     quality standards in Australia and Victoria
     (For example, PM2.5 data includes only data
     measured by a Partisol or Beta Attenuation
     Monitor.)
6.   Air-quality standards used in the assessment
     of these indicators come from the State
     Environment Protection Policy (Ambient Air
     Quality).26

26 EPA, ‘State Environment Protection Policy (Ambient Air
   Quality)’, Carlton, Victoria https://www.epa.vic.gov.au/
   about-us/legislation/~/media/Files/About%20us/Legislation/
   Air/160726consolidatedvariedSEPPAAQ.pdf Accessed 3 December 2018.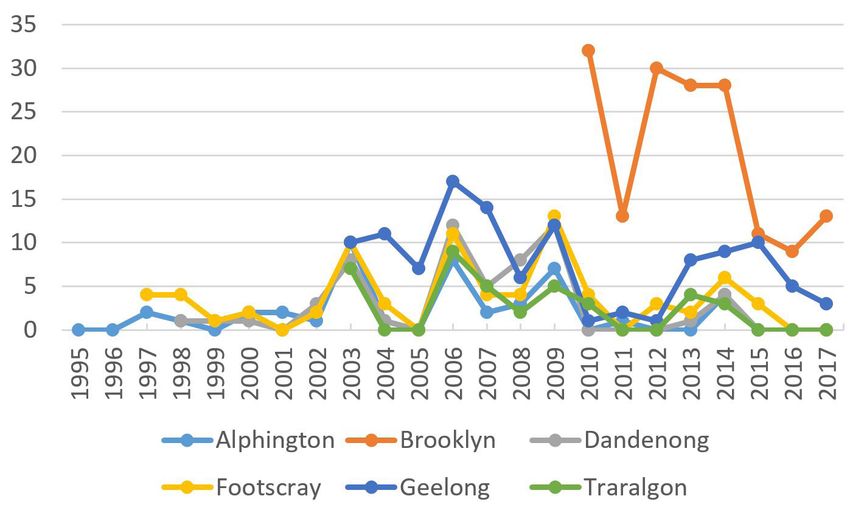
Data quality

SCIENTIFIC
Poor       ASSESSMENTS
              Fair     Part III
                            GoodAir
Evidence and consensus too low           Limited evidence or limited            Adequate high-quality evidence
to make an assessment                    consensus                              and high level of consensus

AIR
                                                         Status                                          Trend          Data Quality
Indicator                                                UNKNOWN        POOR       FAIR         GOOD

A:01 Ambient ozone levels
(summer smog)
                                                                                                                        DATA QUALITY

Data custodian EPA Victoria                                                                                             Good

A:02 Carbon monoxide and
Ozone is the primary pollutant in summer smog,                                      equipment with small engines. 32 Despite
nitrogen dioxide
which forms around large cities on sunny days with                                  maintaining reduced ozone        pollution during recent
                                                                                                              DATA QUALITY

light winds.27,28 Ozone is formed when reactions                                    years, if emissions are not
                                                                                                              Good kept in check, climate
between hydrocarbons and oxides of nitrogen take                                    change is predicted to cause significant increases
A:03 Particle pollution (PM10 and PM 2.5)
place during intense sunlight. Ozone can increase                                   in summer smog, particularly beyond 2030. 33 These
respiratory problems and most strongly affects the                                  increases would occur because
                                                                                                              DATA QUALITYthe formation
                                          Elsewhere Brooklyn                      Geelong, the Latrobe Valley
elderly and those with lung disease.29 in Victoria                                  ofmost
                                                                                  and  ozone     would be enhanced
                                                                                            of Melbourne      Fair by more frequent
                                                                                    periods of warm, sunny conditions in summer. An
The frequency
A:04             and magnitude of peak ambient
     Sulfur dioxide
                                                                                    increase in inner-city ozone is also expected in
ozone concentrations have reduced in Victoria
                                                                                    Melbourne. 34 A projected    increase
                                                                                                              DATA QUALITY  in the frequency
since the early 1980s (Figure A.3 and
                                                                                    and severity of bushfires    is also likely to increase
                                                                                                              Good
Figure A.4). The rate of air-quality improvement
                                                                                    peak ozone levels.
has slowed considerably since the turn of the
A:05 Stratospheric ozone
century, although very few summer smog days                                         Monitoring in major towns such as Ballarat, 35
have been recorded in Melbourne this century, with                                  Bendigo, 36 Geelong, 37 Mildura, 38
                                                                                                                        Shepparton, 39
                                                                                                             DATA QUALITY

all Victorian stations recording 10 or fewer days                                                            Good 41 has shown
                                                                                    Traralgon40 and Warrnambool
exceeding the four-hour average ozone standard                                      that, apart from smoke impacts during intense
this century. The few days exceeding ozone                                          bushfires, ozone concentrations do not exceed
standards in recent years have generally been due                                   air-quality standards. This situation is likely to
to smoke from bushfires, as occurred during the                                     continue.
2002 to 2003 and 2006 to 2007 summer bushfire
seasons. 30

There are two air-quality standards for ozone in
Victoria, and the data selected for this indicator is
based on the four-hour average standard, which
is the standard exceeded most frequently in
Victoria. 31
                                                                                    32    EPA, ‘Ozone in air’, Carlton, Victoria https://www.epa.vic.gov.au/your-
                                                                                          environment/air/air-pollution/ozone-in-air Accessed 3 December 2018.
The main sources of pollutants leading to the                                       33    EPA 2013, ‘Future Air Quality in Victoria: Final Report, 2013’, Carlton,
                                                                                          Victoria https://www.epa.vic.gov.au/~/media/Publications/1535.pdf
formation of ozone are motor vehicle and industrial                                       Accessed 3 December 2018.
                                                                                    34    Ibid
emissions, as well as domestic activities such                                      35    Environment Protection Authority Victoria 2007, ‘Air monitoring at
as solvent use or the operation of gardening                                              Ballarat August 2005 to August 2006’, Carlton, Victoria https://www.epa.
                                                                                          vic.gov.au/~/media/Publications/1111.pdf.
                                                                                    36    Environment Protection Authority Victoria 2006, ‘Air monitoring at
                                                                                          Bendigo, May 2004 to July 2005’, Carlton, Victoria
                                                                                    37    EPA 2018, ‘Air monitoring report 2017 – Compliance with the National
                                                                                          Environment Protection (Ambient Air Quality) Measure’, Carlton Victoria,
                                                                                          https://www.epa.vic.gov.au/~/media/Publications/1703.pdf Accessed 3
                                                                                          December 2018.
                                                                                    38    Environment Protection Authority Victoria 2008, ‘Airborne particle
27   EPA, ‘Ozone in air’, Carlton, Victoria https://www.epa.vic.gov.au/your-              monitoring at Mildura, December 2004 to June 2006’, Carlton, Victoria
     environment/air/air-pollution/ozone-in-air Accessed 3 December 2018.                 https://www.epa.vic.gov.au/~/media/Publications/1201.pdf Accessed 3
28   EPA 2007, ‘Summer Smog in Victoria’, Carlton, Victoria https://www.epa.              December 2018.
     vic.gov.au/~/media/Publications/1188.pdf Accessed 3 December 2018.             39    Environment Protection Authority Victoria 2005, ‘Airborne particle
29   EPA, ‘Ozone in air’, Carlton, Victoria, https://www.epa.vic.gov.au/your-             monitoring at Shepparton, December 2003 to December 2004’, Carlton,
     environment/air/air-pollution/ozone-in-air Accessed 3 December 2018.                 Victoria https://www.epa.vic.gov.au/~/media/Publications/992.pdf
30   EPA 2018, ‘Air monitoring report 2017 – Compliance with the National                 Accessed 3 December 2018.
     Environment Protection (Ambient Air Quality) Measure’, Carlton Victoria,       40    Environment Protection Authority Victoria 2017, ‘Air monitoring report
     https://www.epa.vic.gov.au/~/media/Publications/1703.pdf Accessed 3                  2016 – Compliance with the National Environment Protection (Ambient
     December 2018.                                                                       Air Quality) Measure’, Carlton, Victoria https://www.epa.vic.gov.au/~/
31   Ibid.                                                                                media/Publications/1663.pdf Accessed 3 December 2018.
                                                                                    41    Environment Protection Authority Victoria 2008, ‘Air monitoring at
                                                                                          Warrnambool, October 2006 to October 2007’, Carlton, Victoria.

Victorian State of the Environment 2018 Scientific Assessments (A)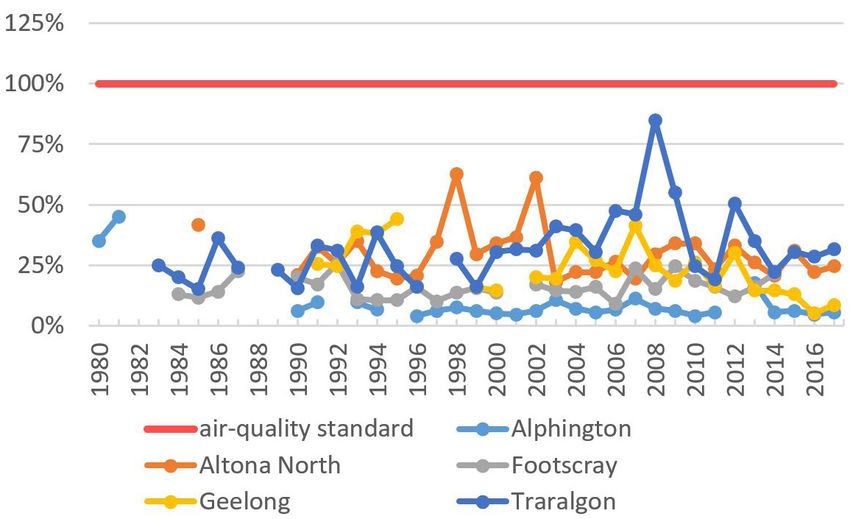
SCIENTIFIC ASSESSMENTS Part III Air

Figure A.3 Number of days exceeding the ozone (4-hour average) standard at
monitored sites in Victoria, 1980–2017

(Data source: EPA Victoria, 2018)

Figure A.4 Annual maximum ozone (4-hour average) concentrations at
monitored sites in Victoria, 1980–2017
Note: Concentrations are shown as a percentage of the
air-quality standard.

(Data source: EPA Victoria, 2018)
Poor Fair Good
Evidence and consensus too low Limited evidence or limited Adequate high-quality evidence
Data
to makequality
an assessment consensus and high level of consensus
AIR
SCIENTIFIC
Poor
Indicator
ASSESSMENTS
Fair Status Part III Air
Good Trend Data Quality
UNKNOWN POOR FAIR GOOD
Evidence and consensus too low Limited evidence or limited Adequate high-quality evidence
to make an assessment consensus and high level of consensus
A:01 Ambient ozone levels
AIR
(summer smog)
DATA QUALITY
Status Trend Data Quality
Indicator UNKNOWN POOR FAIR GOOD Good
A:01 Ambient
A:02 ozone levels
Carbon monoxide and
(summer dioxide
nitrogen smog)
DATA QUALITY
DATA QUALITY
Data custodian EPA Victoria Good
Good
A:03 Particle pollution (PM and PM )
A:02 Carbon
Exposure to monoxide and
elevated concentrations
10 2.5
of carbon Carbon Monoxide
nitrogen dioxide
monoxide in the air can cause tissue damage inBrooklyn DATA
DATA QUALITY
QUALITY
Elsewhere Geelong, the Latrobe Valley
humans and animals. People with cardiovascular
in Victoria Carbon
and monoxide concentrations
most of Melbourne Fair
Good have
disease are particularly at risk. 42 dramatically reduced in Victoria since the early
A:04 Particle
A:03 Sulfur dioxide
pollution (PM10 and PM 2.5) 1980s, with a steady reduction in peak levels
Increased concentrations of nitrogen dioxide can
still recorded to the endDATA of QUALITY
DATA 2017 (Figure A.5). A
QUALITY
affect the throat and lungs. Those most at risk Brooklyn
Elsewhere Geelong, the Latrobe Valley
in Victoria
notable exception to this was the spike in carbon
Good
Fair
from nitrogen dioxide pollution are people with and most of Melbourne
monoxide recorded in the southern area of Morwell
respiratory problems,
A:05 Stratospheric particularly infants, children
A:04 Sulfur dioxide ozone during the Hazelwood mine fire in February 2014.
and the elderly. 43
Measurements showed DATA theQUALITY
DATA carbon monoxide
QUALITY
Carbon monoxide and nitrogen dioxide standard was exceededGood for three days during
concentrations are closely linked to motor vehicle the fire, but it is likely that the standards were
emissions. Large industrial
A:05 Stratospheric ozone facilities also emit also exceeded at the start of the fire, before air
these pollutants, but industrial emissions are monitoring commenced. The last time EPA Victoria
DATA QUALITY
often treated before release from tall stacks, recorded similiar levels of carbon monoxide in
Good
so rarely impact significantly on ground-level populated areas was more than 25 years ago, when
concentrations in populated areas. motor vehicle carbon monoxide emissions were
much higher.
Both carbon monoxide and nitrogen dioxide
concentrations are expected to gradually reduce
in-line with forecast improvements in vehicle and
fuel technology, and with the potential significant
increase in the proportion of motor vehicles that
are electric.
Figure A.5 Annual maximum carbon monoxide
(8-hour average) concentrations in Victoria,
1981–2017
Note: Concentrations are shown as a percentage
of the air-quality standard.
(Data source: EPA Victoria, 2018)
42 Environment Protection Authority Victoria ‘Carbon monoxide in air’,
Carlton, Victoria https://www.epa.vic.gov.au/your-environment/air/air-
pollution/carbon-monoxide-in-air Accessed 3 December 2018.
43 Environment Protection Authority Victoria ‘Nitrogen dioxide in air’,
Carlton, Victoria https://www.epa.vic.gov.au/your-environment/air/air-
pollution/nitrogen-dioxide-in-air Accessed 3 December 2018.
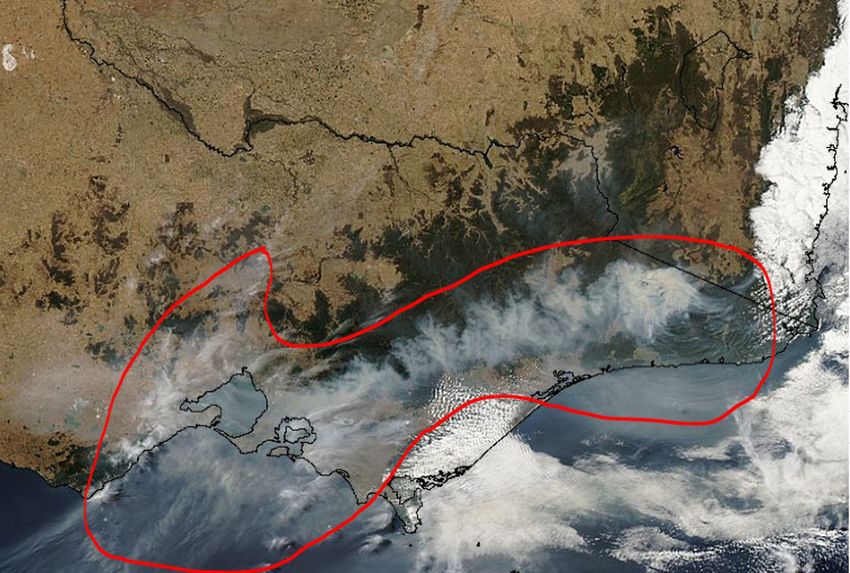
Victorian State of the Environment 2018 Scientific Assessments (A)SCIENTIFIC ASSESSMENTS Part III Air Nitrogen Dioxide There are two air-quality standards for nitrogen dioxide in Victoria. One standard is based on hourly average data, the other for annual average data. The hourly average standard has not been exceeded in Victoria since autumn 1991, when it was exceeded at Footscray on a day when an accumulation of motor vehicle emissions during calm weather was the likely cause of pollution (Figure A.6). The annual standard has never been exceeded (Figure A.7). Peak nitrogen dioxide (based on hourly average data) decreased significantly in Melbourne during the late 1980s and early 1990s: despite more vehicles, changing technology has meant fewer emissions per vehicle. The trend has continued this century, albeit at a much slower rate. 44 After a slight reduction in annual average concentrations for nitrogen dioxide during the first 10 years since monitoring began, there has been no noticeable trend during the past decade. Figure A.6 Annual maximum nitrogen dioxide Figure A.7 Annual average nitrogen dioxide (1-hour average) concentrations in Victoria, concentrations in Victoria, 1980–2017 1980–2017 Note: A.6 and A.7 Concentrations are shown as a percentage of the air-quality standard. (Data source: EPA Victoria, 2018) 44 Commissioner for Environmental Sustainability 2013, ‘State of the Environment report 2013’, Melbourne, Victoria https://www.ces.vic. gov.au/sites/default/files/publication-documents/2013%20SoE%20 report%20full.pdf Accessed 3 December 2018.
Status Trend Data Quality
Indicator
Poor Fair
UNKNOWN POOR
Good
FAIR GOOD
Evidence and consensus too low Limited evidence or limited Adequate high-quality evidence
Data
to makequality
an assessment consensus and high level of consensus
A:01 Ambient ozone levels
(summer smog)
AIR
SCIENTIFIC
Poor ASSESSMENTS
Fair Status Part III Air
Good Trend
DATA QUALITY
Data Quality
Indicator UNKNOWN POOR FAIR GOOD Good
Evidence and consensus too low Limited evidence or limited Adequate high-quality evidence
to make an assessment consensus and high level of consensus
A:01
A:02Ambient ozone levels
Carbon monoxide and
AIR
(summer
nitrogen smog)
dioxide
DATA QUALITY
Status Trend Data Quality
DATA QUALITY
Indicator UNKNOWN POOR FAIR GOOD Good
Good
A:01 Ambient
A:03 ozone levels
Particle monoxide
pollution (PM
A:02 Carbon and10 and PM 2.5)
(summer smog)
nitrogen dioxide DATA QUALITY
DATA QUALITY
DATA QUALITY
Elsewhere Brooklyn Geelong, the Latrobe Valley
Data custodian EPA Victoria in Victoria and most of Melbourne Fair
Good
Good
A:04 Particle
A:02
A:03 Sulfur dioxide
Carbon monoxide
pollution and
(PM andare
PMmeasured
)
Two main particle pollutants
10 2.5 in Smoke from large bushfires has resulted in the
nitrogen dioxide
Victoria: PM (particles less than 2.5 micrometres most widespread particle DATApollution
QUALITY impacts across
2.5 DATA
DATA QUALITY
QUALITY
in diameter) and PM 10 (particles less than 10
Elsewhere Brooklyn Victoria,
Geelong, with Valley
the Latrobe smoke from large fires capable
in Victoria and most of Melbourne
Good
Good
Fair
micrometres in diameter). Monitoring technology of travelling across vast parts of Victoria. This
A:05
A:03 Stratospheric
Particle
to measure PM ozone
pollution (PM been
and PM ) happened in February 2014, when smoke from
A:04 Sulfur 2.5 has not10
dioxide available
2.5 for as long
as the instruments that measure PM 10 , so the PM 2.5 a large bushfire in the far DATAeast of the state blew
QUALITY
DATA QUALITY
QUALITY
DATA
Elsewhere
dataset is shorter and, until recently, quite Brooklyn
limited over Bass
Geelong, Strait
the Latrobe and resulted
Valley in poor air quality in
in Victoria and most of Melbourne Good
Fair
Good
in spatial coverage. Melbourne for four consecutive days. The smoke
A:04 Stratospheric
A:05 Sulfur dioxide ozone plume from this fire is visible in Figure A.8.
Greater concentrations of PM 2.5 and PM 10 particles
in the air can cause wheezing, chest tightness Other events, such as theDATA2014
DATA Hazelwood mine
QUALITY
QUALITY
and difficulty breathing for people with existing fire, have caused more Good
severe
Good impacts for nearby
heart or lung conditions (including asthma). 45,46 populations, while PM 10 pollution remains an
A:05
PM 2.5Stratospheric
particles areozone
smaller than PM 10 and can be issue in Brooklyn in Melbourne’s inner west, and
breathed deeper into the lungs. Children and is associated with dust DATA
emissions
QUALITY generated by
people over 65, and those with existing heart industry and vehicles. Good
or lung conditions (including asthma), are more
Smoke from domestic wood heaters also
sensitive to the effects of breathing in smaller
contributes to particle pollution in the cooler
particles. 47
months. It is estimated that Victoria has nearly
The air-quality standards for particle pollution 150,000 wood heaters. 49
are exceeded more frequently than for other
As recommended by VAGO, a more comprehensive
pollutants. Despite this, Victoria’s particle pollution
air-monitoring network for Victoria that better
is reasonably low by global standards. 48 Particle
aligns coverage with pollution risks is required.
pollution sources in Victoria include:
This would enable a better understanding of the
• smoke from bushfires, planned burns, magnitude of particle pollution affected by wood
industrial fires and domestic wood-heating smoke and dust (especially in regional areas),
• windblown dust during dry and windy as well as improving knowledge of the impacts
conditions associated with motor vehicle exhaust emissions
near major urban roads.
• exhaust emissions from motor vehicles
• road dust from vehicles travelling on unsealed
roads
• industrial facilities
• small particles formed in the air by chemical
reactions between other pollutants.
45 EPA, ‘PM10 particles in air’, Carlton, Victoria https://www.epa.vic.gov.au/
your-environment/air/air-pollution/pm10-particles-in-air Accessed 3
December 2018.
46 EPA, ‘PM2.5 particles in air’, Carlton, Victoria https://www.epa.vic.gov.
au/your-environment/air/air-pollution/pm25-particles-in-air Accessed
3 December 2018.
47 Ibid.
48 World Health Organization, ‘WHO Global Urban Ambient Air Pollution
Database (update 2016)’, Geneva, Switzerland http://www.who.int/phe/
health_topics/outdoorair/databases/cities/en/ Accessed 3 December 49 EPA 2017, ‘Variation to the Waste Management Policy (Solid Fuel
2018. Heating) policy impact assessment’, Carlton, Victoria.
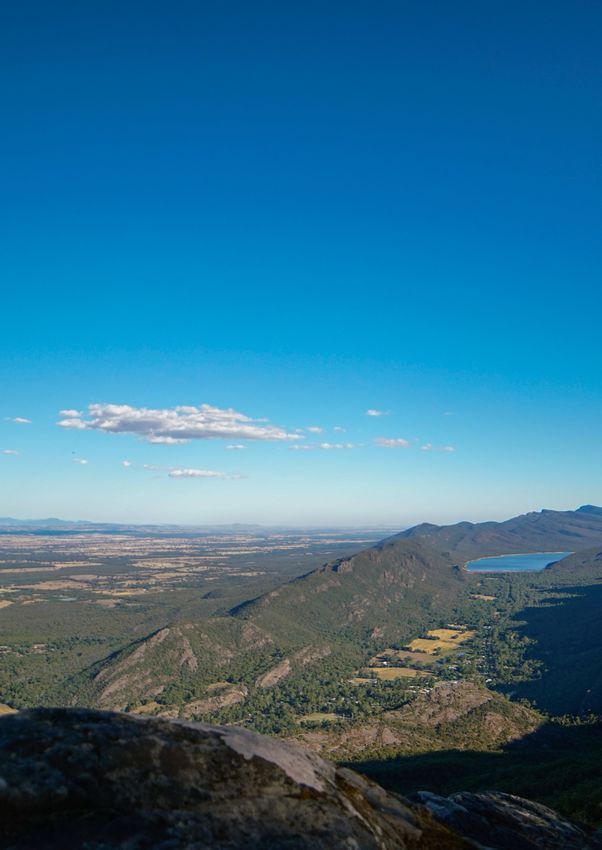
Victorian State of the Environment 2018 Scientific Assessments (A)SCIENTIFIC ASSESSMENTS Part III Air Figure A.8 NASA satellite image, 11 February 201450 Note: Red shows the extent of smoke plume from a fire that started in the far east. Ultrafine particles (particles less than 1 micrometre in diameter) are smaller than PM 2.5 and PM 10 , and can therefore penetrate further into the lungs. 51 Ultrafine particles are difficult to measure and are not included in national or state ambient air quality standards. Therefore, no ultrafine particle data is available for this report. A small number of studies have investigated the health effects of ultrafine particles and found some evidence of an association between ultrafine particles and cardiovascular health effects, although more research is needed to determine the nature of this association. 52 50 United States National Aeronautics and Space Administration, ‘Australia6 Subset – Aqua 1km True Color 2014/042’, https://lance- modis.eosdis.nasa.gov/imagery/subsets/?subset=Australia6.2014042. aqua.1km Accessed 3 December 2018. 51 EPA 2018, ‘Air pollution in Victoria – a summary of the state of knowledge’, Carlton, Victoria https://www.epa.vic.gov.au/~/media/ Publications/1709.pdf Accessed 3 December 2018.
SCIENTIFIC ASSESSMENTS Part III Air

PM 2.5
PM 2.5 trend data in Victoria is only available from
2003, with data up to 2013 confined to Alphington
and Footscray in Melbourne, other than for a few
short-term monitoring projects. Alphington and
Footscray were selected as initial monitoring
locations as they are long-term trend stations
in Melbourne for other pollutants and are in
populated areas near PM 2.5 pollution sources
(industrial and wood-heating). PM 2.5 monitoring
has increased, particularly in Melbourne and the                              Figure A.9 Number of days exceeding the PM2.5
Latrobe Valley since the 2014 Hazelwood mine fire.                            (daily average) standard in Victoria, 2003–2017
The frequency of days exceeding the PM 2.5 air-                               (Data source: EPA Victoria, 2018)
quality standard has been relatively stable since
2003: fewer than four days typically exceed the
standard each year (Figure A.9). Years with major
fires are exceptions – for example, the summer of
2006 to 2007 (Alpine fires) and 2014 (the Hazelwood
mine fire and a large East Gippsland fire). 53,54,55

Poor air quality has also been recorded during
cool, calm and stable atmospheric conditions when
particles from a wide variety of sources (including
smoke from planned burns and wood heaters)
accumulate over populated areas. Notably, in 2017,
a record number of days exceeded the PM2.5 air-
quality standard at Alphington. 56 The magnitude
                                                                              Figure A.10 Annual maximum PM2.5 (daily average)
of the peak PM2.5 concentrations recorded at
                                                                              concentrations in Victoria, 2003–2017
Morwell South air-monitoring station during the
2014 Hazelwood mine fire were unprecedented                                   Note: Concentrations are shown as a percentage of
in Victoria, with peak levels recorded at nearly 17                           the air-quality standard.
times the air-quality standard (Figure A.10).                                 (Data source: EPA Victoria, 2018)

                                                                              The annual average PM 2.5 air-quality standard
                                                                              is currently 8 µg/m3(micrograms per cubic
                                                                              metre), although this will tighten in Victoria to
                                                                              7 µg/m3 by 2025. 57 The current annual average
                                                                              PM 2.5 standard has been met for every year of
                                                                              monitoring in Footscray, but has been exceeded
                                                                              nearly half the time at Alphington (Figure A.11). It
52 Ibid.                                                                      is likely that Alphington records slightly greater
53 EPA 2007, ‘Air monitoring report 2006 – Compliance with the National
   Environment Protection (Ambient Air) Measure’, Carlton, Victoria           levels of PM 2.5 pollution than Footscray due to
   https://www.epa.vic.gov.au/~/media/Publications/1137.pdf Accessed 3
   December 2018.                                                             greater urban emissions (including from wood
54 EPA 2008, ‘Air monitoring report 2007 – Compliance with the National
   Environment Protection (Ambient Air Quality) Measure’, Carlton, Victoria   heaters) in Alphington and surrounding suburbs.
   https://www.epa.vic.gov.au/~/media/Publications/1231.pdf Accessed 3
   December 2018.
                                                                              The annual standard has been achieved in each
55 EPA 2015, ‘Air monitoring report 2014 – Compliance with the National
   Environment Protection (Ambient Air Quality) Measure’, Carlton, Victoria
   https://www.epa.vic.gov.au/~/media/Publications/1604.pdf Accessed 3        57   EPA, ‘State Environment Protection Policy (Ambient Air
   December 2018.                                                                  Quality)’, Carlton, Victoria https://www.epa.vic.gov.au/
56 EPA 2018, ‘Air monitoring report 2017 – Compliance with the National            about-us/legislation/~/media/Files/About%20us/Legislation/
   Environment Protection (Ambient Air Quality) Measure’, Carlton Victoria         Air/160726consolidatedvariedSEPPAAQ.pdf Accessed 3 December 2018.
   https://www.epa.vic.gov.au/~/media/Publications/1703.pdf Accessed 3
   December 2018.

Victorian State of the Environment 2018 Scientific Assessments (A)
SCIENTIFIC ASSESSMENTS Part III Air
year of monitoring in the Latrobe Valley since PM10
2014, except for Morwell South and Morwell East
The pattern of days exceeding the PM 10 standard
in 2014 (associated with smoke impacts from the
has traditionally aligned with that for PM 2.5 ,
Hazelwood mine fire) and Traralgon in 2017. It is
although more days generally exceed the PM 10
likely that areas of regional Victoria that most
standard. This pattern has changed over the past
frequently use wood heaters and are impacted by
few years, particularly in 2017 when there were
smoke from planned burns will have greater PM 2.5
widespread PM 2.5 impacts and no days exceeding
concentrations. However, due to the limitations
the PM 10 standard, except at dust hotspots in
associated with the extent of the current
Brooklyn and, to a lesser extent, Geelong (Figure
monitoring network, these assumptions cannot be
A.12). Peak PM 10 readings are associated with
verified.
major fires (which occurred, for example, in 2003)
The closure of the Hazelwood mine and power or windblown dust events (which occurred, for
station in March 2017 does not appear to have example, in Geelong in 2015) (Figure A.13).
significantly changed PM 2.5 levels in the region,
with the annual PM 2.5 average at the Morwell South
air-monitoring station, adjacent to the former mine
and power station site, dropping by just 3% from
2016 to 2017. A full, detailed analysis - accounting
for variations in bushfire, planned burns and wood
smoke - is required to determine the exact impact
of the mine and power station closure on PM 2.5
levels. The results presented here suggest the
closure has not significantly improved PM 2.5 levels.
Figure A.12 Number of days exceeding the PM10
(daily average) standard in Victoria, 1995–2017
(Data source: EPA Victoria, 2018)
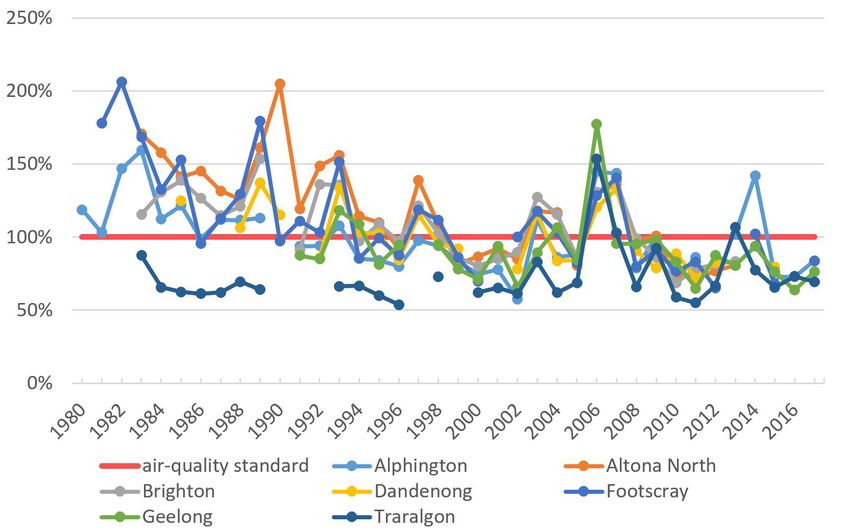
Figure A.11 Annual average PM2.5 concentrations in Figure A.13 Annual maximum PM10 (daily average)
Victoria, 2003–2017 concentrations in Victoria, 1995–2017
Note: Concentrations are shown as a percentage of Note: Concentrations are shown as a percentage of
the air-quality standard. the air-quality standard.
(Data source: EPA Victoria, 2018) (Data source: EPA Victoria, 2018)SCIENTIFIC ASSESSMENTS Part III Air
Due to PM 10 impacts, Brooklyn is still Victoria’s
biggest air-pollution hotspot in terms of the
number of days exceeding air-quality standards.
The impacts in Brooklyn are linked to the large
industrial precinct that sits immediately to the
north of its residential area. Unsealed roads
frequently used by heavy vehicles were sealed
during 2015, resulting in a significant improvement
in local air quality, 58 although more improvements
are required to bring the suburb’s air quality in-line
with neighbouring suburbs such as Footscray.
Figure A.14 Annual average PM10 concentrations in
An annual average PM 10 standard was adopted
Victoria, 1995–2017
in Victoria in 2016; previously, there had been no
annual average PM 10 standard at state or national Note: Concentrations are shown as a percentage of
level. 59 The Victorian annual PM 10 standard of 20 the air-quality standard.
µg/m3 is significantly more stringent than the (Data source: EPA Victoria, 2018)
national standard of 25 µg/m3. Annual average
PM 10 concentrations have been trending slightly
down across Victorian this decade (Figure A.14),
with 2014 the only year when monitoring sites
exceeded the PM 10 annual standard since 2009
(except for Brooklyn). The higher annual average
PM 10 readings from 2000 to 2009 may be due to
drier conditions associated with the millennium
drought. To demonstrate the recent improvement
in annual PM 10 concentrations, the current annual
standard of 20 µg/m3 has only been exceeded at
Footscray once from 2010 to 2017, compared with
eight times in the period 1997 to 2009.
58 EPA 2016, ‘Brooklyn air quality update: effectiveness of road sealing’,
Carlton, Victoria https://www.epa.vic.gov.au/~/media/Publications/1627.
pdf Accessed 3 December 2018.
59 EPA, ‘Review of national ambient air quality standards’, Carlton,
Victoria https://www.epa.vic.gov.au/your-environment/air/review-of-
national-ambient-air-quality-standards Accessed 3 December 2018.
Victorian State of the Environment 2018 Scientific Assessments (A)Good
Data quality
Data quality
A:02 Carbon monoxide and
nitrogen dioxide
ir SCIENTIFIC
Poor
Poor Good ASSESSMENTS
Fair
Fair Part III Air
Good
Good
DATA QUALITY
Good
mited evidence or limited
Evidenceand
Evidence andconsensus
consensus
Adequatetoo
too
high-quality
low
low Limited
evidence
Limited evidenceor
evidence orlimited
limited Adequatehigh-quality
Adequate high-qualityevidence
evidence
nsensus tomake
to makeananassessment
assessment
and high level of consensus
consensus
consensus andhigh
and highlevel
levelof
ofconsensus
consensus
A:03 Particle pollution (PM10 and PM 2.5)
AIR
AIR DATA QUALITY
Elsewhere Brooklyn Geelong, the Latrobe Valley
Status Trend Data
Status
Status Quality Trend
Trend Data Quality
Data Quality
Indicator
Indicator
UNKNOWN POOR FAIR GOOD
in Victoria
UNKNOWN
UNKNOWN POOR
POOR
and most of Melbourne
FAIR
FAIR GOOD
GOOD
Fair
A:04
A:01 Sulfur
A:01 Ambient
Ambientdioxide
ozone levels
ozone levels
(summer smog)
(summer smog)
DATA QUALITY
Data custodian EPA Victoria DATA QUALITY DATAQUALITY
DATA QUALITY
Good
Good Good
Good
A:05 Stratospheric ozone
Prolonged
A:02 Carbon
A:02 Carbon exposure
monoxide
monoxidetoand
sulfur dioxide can lead to
and
nitrogen dioxide
increases
nitrogen dioxide
in respiratory illnesses such as chronic DATA QUALITY
DATA QUALITY DATAQUALITY
DATA QUALITY
bronchitis. The effect of sulfur dioxide on health is Good
Good Good
Good
increased by the presence of airborne particles. 60
d PM 2.5) Acute
A:03 effectspollution
A:03 Particle
Particle can also(PM
pollution occur,
(PM andparticularly
PM 2.5))
10 and PM 2.5
irritation
10
of the upper respiratory tract and the eyes, with
DATA QUALITY DATAQUALITY
DATA QUALITY
asthmatics
Elsewhere Brooklyn most sensitive
Geelong, to Valley
the Latrobe these effects. 61
Elsewhere
Elsewhere Brooklyn
Brooklyn Geelong,the
Geelong, theLatrobe
LatrobeValley
Valley
in Victoria and most of Melbourne Fair
inVictoria
in Victoria andmost
and mostofofMelbourne
Melbourne Fair
Fair
Power stations are the main driver of peak sulfur
A:04 Sulfur
A:04 Sulfur
dioxide dioxide
dioxide
concentrations in Victoria. Ships that travel
near the coast and dock at Victoria’s ports are a
DATA QUALITY DATAQUALITY
DATA QUALITY
secondary source. There have been noGood significant Good
Good
trends in sulfur dioxide concentrations in Victoria
A:05 Stratospheric
A:05
since Stratospheric ozone
ozone
the 1980s, with levels remaining well below
Figure A.16 Annual maximum sulfur dioxide (daily
the three air-quality standards legislated in this
DATA QUALITY
average) concentrations in QUALITY
Victoria, 1980–2017
DATAQUALITY
DATA
state (Figure A.15 to Figure A.17). Victoria’s
62
Good
peak Good
Good
sulfur dioxide levels are measured near major (Data source: EPA Victoria, 2018)
industrial facilities in Altona North and Traralgon.
Figure A.15 Annual maximum sulfur dioxide Figure A.17 Annual average sulfur dioxide
(hourly average) concentrations in Victoria, concentrations in Victoria, 1980–2017
1980–2017
(Data source: EPA Victoria, 2018)
(Data source: EPA Victoria, 2018)
Note: Concentrations are shown as a percentage of
the air-quality standard.
60 EPA Victoria, ‘Sulfur dioxide in air’, Carlton, Victoria https://www.epa.
vic.gov.au/your-environment/air/air-pollution/sulfur-dioxide-in-air
Accessed 3 December 2018.
61 United States National Research Council 2010, ‘Acute Exposure
Guideline Levels for Selected Airborne Chemicals: Volume 8’, National
Academies Press (US), Washington, DC https://www.ncbi.nlm.nih.gov/
books/NBK219999/ Accessed 3 December 2018.
62 EPA, ‘State Environment Protection Policy (Ambient Air
Quality)’, Carlton, Victoria https://www.epa.vic.gov.au/
about-us/legislation/~/media/Files/About%20us/Legislation/
Air/160726consolidatedvariedSEPPAAQ.pdf Accessed 3 December 2018.SCIENTIFIC ASSESSMENTS Part III Air The closure of the Hazelwood mine and power station in March 2017 does not appear to have significantly changed sulfur dioxide levels in the region, however this assessment is only based on the nine months of data available since the closure and it would be ideal to do the comparison with at least 12 months of data to cover a full range of weather patterns. Annual average sulfur dioxide concentrations at Morwell South, adjacent to the former mine and power station site, were stable at 0.6 parts per billion (ppb) in 2015, 2016 and 2017, with similarly stable readings of between 0.9 and 1.0 ppb recorded at Traralgon. Morwell East’s annual average sulfur dioxide concentrations decreased to 0.5 in 2017 relative to the two preceding years when the average was 0.7 ppb. Combining air quality results with modelling is required to determine the exact impact of the power station closure. However, this analysis suggests the power station closure has not significantly improved annual average sulfur dioxide levels in the region – although it may have contributed to a minor improvement in Morwell East. Victorian State of the Environment 2018 Scientific Assessments (A)
nitrogen
assessmentdioxide
          is provided.
                                                                                                      DATA QUALITY

                                                                                                      Good
Data quality
SCIENTIFIC ASSESSMENTS Part III Air
A:03 Particle pollution (PM10 and PM 2.5)

                                                                                                      DATA QUALITY
                                               Elsewhere Brooklyn   Geelong, the Latrobe Valley
Poor                             Fair          in Victoria
                                                                  Good                                Fair
                                                                    and most of Melbourne
Evidence and consensus too low   Limited evidence or limited      Adequate high-quality evidence
to make an assessment            consensus                        and high level of consensus
A:04 Sulfur dioxide
Stratospheric
AIR           Air Pollutants                                                                          DATA QUALITY

                                              Status                                    Trend         Data
                                                                                                      Good Quality
Indicator                                     UNKNOWN      POOR       FAIR      GOOD

A:05 Ambient
A:01 Stratospheric
             ozoneozone
                   levels
(summer smog)
                                                                                                      DATA QUALITY
Data custodian DEE, BoM                                                                               DATA QUALITY
                                                                                                      Good
                                                                                                      Good

Stratospheric   ozone impacts
A:02 Carbon monoxide     and    on ultraviolet                         The long-term changes in stratospheric ozone due
nitrogen dioxide
radiation  (UV). Less stratospheric ozone means                        to ozone-depleting substances over a mid-latitude
                                                                                                   DATA QUALITY
more UV reaches the earth’s surface. January is                        location such as Victoria are small compared to
                                                                                                   Good
generally the month of greatest impact in Victoria:                    natural variations. Stratospheric ozone is currently
more   peoplepollution
A:03 Particle  are on holidays  and
                        (PM10 and PMoutside
                                    2.5
                                        )     in the                   measured as total column ozone (the total amount
sun, and UV levels are greatest. Figure A.18 shows                     of ozone in a column from the surface to the edge
                                                                                                   DATA QUALITY
Melbourne’s average UV levels in January        sinceBrooklyn
                                          Elsewhere                    of thethe
                                                                     Geelong,  atmosphere)
                                                                                 Latrobe Valley and this is done by satellite and
                                          in Victoria                and most of Melbourne         Fair
1980. Measurement of the long-term trend includes                      ground-based measurements. There is significant
satellite-based   observations of UV levels without
A:04 Sulfur dioxide                                                    variability in ozone levels from year to year, largely
the impact of clouds. By contrast, recent ground-                      due to changes in cloud cover. Overall, there was a
                                                                                                   DATA QUALITY
based measurements include the effect of clouds,                       clear decreasing trend in ozone during the 1980s
                                                                                                   Good
which is why those UV levels are shown to be lower                     and 1990s, followed by an increase this century
and
A:05more    variable.ozone
     Stratospheric    Melbourne’s UV levels have                       (Figure A.19).
generally been stable since the 1980s, with a slight
                                                                                                      DATA QUALITY
increase during the final two decades of the 20th
century.                                                                                              Good

Figure A.18 Average UV index for Melbourne,                           Figure A.19 Average total column ozone for
1979–2017                                                             Melbourne, 1973–2018

(Data source: BoM, 2018)                                              Note: A Dobson Unit is the number of molecules of
                                                                      ozone that would be required to create a layer of
                                                                      pure ozone 0.01 mm thick at 0°C and a pressure of
                                                                      1 atmosphere.63

                                                                      (Data source: BoM, 2018)

                                                                      63 United States National Aeronautics and Space Administration, ‘What
                                                                         is a Dobson Unit?’, https://ozonewatch.gsfc.nasa.gov/facts/dobson_
                                                                         SH.html Accessed 3 December 2018.
SCIENTIFIC ASSESSMENTS Part III Air Emission of chemicals such as chlorofluorocarbons (CFCs) into the air leads to the depletion of stratospheric ozone, exposing both marine and terrestrial life to additional harmful amounts of UV radiation. Under the Montreal Protocol, which started in 1989, signatory countries are formally required to control their emissions of ozone- depleting substances to protect the ozone layer. The protocol achieved global participation in 2009, and has been effective, particularly over Antarctica and polar regions. However, recent research has found the ozone layer recovery has not been as pronounced outside the polar regions (between 60°S and 60°N). 64 Global emissions of ozone-depleting substances included in the Montreal Protocol peaked at 1.46M tonnes in the late 1980s, then declined at a rate of 10% per year to 314 tonnes in 2014. Australian emissions of ozone-depleting substances, weighted by ozone-depleting potential, also fell by about 13% per year from 1995 to 2005, then remained relatively constant through to 2013. 65 Australia continues to achieve its committed targets as part of the Montreal Protocol, meeting or exceeding all of its phase-out obligations up until the end of 2016. 64 Ball et al 2018, ‘Evidence for a continuous decline in lower stratospheric ozone offsetting ozone layer recovery’, Atmospheric Chemistry and Physics, 18, pp. 1379–1394. 65 Fraser P, Dunse B, Krummel P, Steele P, Derek N 2014, ‘Australian and Global Emissions of Ozone Depleting Substances’, Report prepared for Department of the Environment, CSIRO Marine and Atmospheric Research, Centre for Australian Weather and Climate Research, Aspendale, Australia, pp. 29. Victorian State of the Environment 2018 Scientific Assessments (A)
SCIENTIFIC ASSESSMENTS Part III Air

Amenity
AIR
                                              Status                            Trend     Data Quality
Indicator                                     UNKNOWN   POOR    FAIR     GOOD

A:06 Odour and noise

                                                                                          DATA QUALITY
Data Custodian EPA Victoria, local councils
                                                                                          Fair

                                                                                  ?
A:07 Light pollution
Impacts from odour and noise are a significant                   Odour is the type of pollution most frequently
issue in Victoria, both in terms of amenity and                  reported to EPA Victoria.
                                                                                         DATAThe  regulator received
                                                                                              QUALITY

complaints to regulators, while excessive exposure               more than twice as many Poorcomplaints     about odour
to noise can impact human health. Data for this                  from 2013 to 2017 (Figure A.20) than about noise,
A:08 Emissions of major air pollutants
indicator is limited to pollution reports received
by sector
by EPA Victoria. Local councils and Victoria Police
                                                                                  ?
                                                                 the next most-frequent source of complaints
                                                                 in that period. In EPA Victoria’s
                                                                                         DATA QUALITYpollution report

also receive a significant number of amenity                     database, a single pollution
                                                                                         Fair event can be
reports. However, variation in recording of pollution            duplicated if more than one reporter makes a
report  dataimpacts
A:09 Health   by Victoria’s  79 councils and the police
                      of air pollution                           report.
dataset makes its use alongside the EPA Victoria                                  ?
                                                             The location of pollution          reports
                                                                                             DATA QUALITY is heavily
data unfeasible.
                                                             weighted towards populated     Poor areas: areas with
Those who notify EPA Victoria of pollution may               more people are, on balance, more likely to have
A:10 Health impacts of noise pollution
allege  a source (such as a person or a business).
Forty-six per cent of all odour and noise pollution
                                                                                  ?
                                                             more pollution reports. Because of this, pollution
                                                             reports are displayed as the total number of
                                                                                             DATA QUALITY
reports in EPA Victoria’s database have an alleged Fair for Melbourne
                                                             reportsand   for each local government area (LGA)
                                                      Unknown for the rest of Victoria      Poor
source.                                                      and the per capita reports for each LGA in Tables
                                                             A.1 and A.2. Table A.1 shows the top five LGAs for
A:11 Indoor air quality                                      pollution reports on a per capita basis, and Table
                                                                                  ?
                                                             A.2 shows the top five LGAs for pollution reports
                                                             in total. There are someDATA      associations
                                                                                                  QUALITY      between per
                                                             capita pollution reporting     Poorhotspots (from the 2013
                                                             to 2017 pollution report data) and socio-economic
                                                             disadvantage. Victorians living in more affluent
CLIMATE CHANGE IMPACTS                                       areas are generally reporting more impacts
                                        Status               from noise, while    TrendVictorians
                                                                                            Data in    less affluent areas
                                                                                                    Quality
Indicator                               UNKNOWN    POOR
                                                             are reporting disproportionately more impacts
                                                            FAIR        GOOD

CC:01 Observed average rainfall                              from odour. This analysis of linking pollution
                                                             report and socio-economic disadvantage data
                                                             should be treated as indicative.DATA QUALITY Future reporting

                                                             could expand on this analysis  Good and formalise a
Figure A.20 Pollution reports received by EPA                methodology for evaluating environmental justice.
CC:02 Snow
Victoria,    cover
          2013–17

(Data source: EPA Victoria, 2018)                                                         DATA QUALITY

                                                                                          Good

CC:03 Observed surface temperature

                                                                                          DATA QUALITY

                                                                                          Good

CC:04 Projected changes in
temperature                                    N/A
                                                                                          DATA QUALITY

                                                                                          Good
You can also read