Fishery Data Collection Systems: Evasive as an Elusive Fish - By Marlowe Sabater - No. 13, January 2021 - Western Pacific Fishery ...
←
→
Page content transcription
If your browser does not render page correctly, please read the page content below
No. 13, January 2021

Fishery Data Collection Systems:
Evasive as an Elusive Fish
By Marlowe Sabater

                                       A
ABOUT THE AUTHOR
Marlowe Sabater is
the marine ecosystem
scientist at the Western
Pacific Regional Fishery
Management Council
and the former chief
fisheries biologist at the
American Samoa Department of Marine
and Wildlife Resources.
© Western Pacific Regional Fishery
Management Council, 2021. All rights
reserved, Published in the United States
by the Western Pacific Regional Fishery
Management Council under NOAA Award
##NA20NMF4410013.
ISBN 978-1-944827-75-5
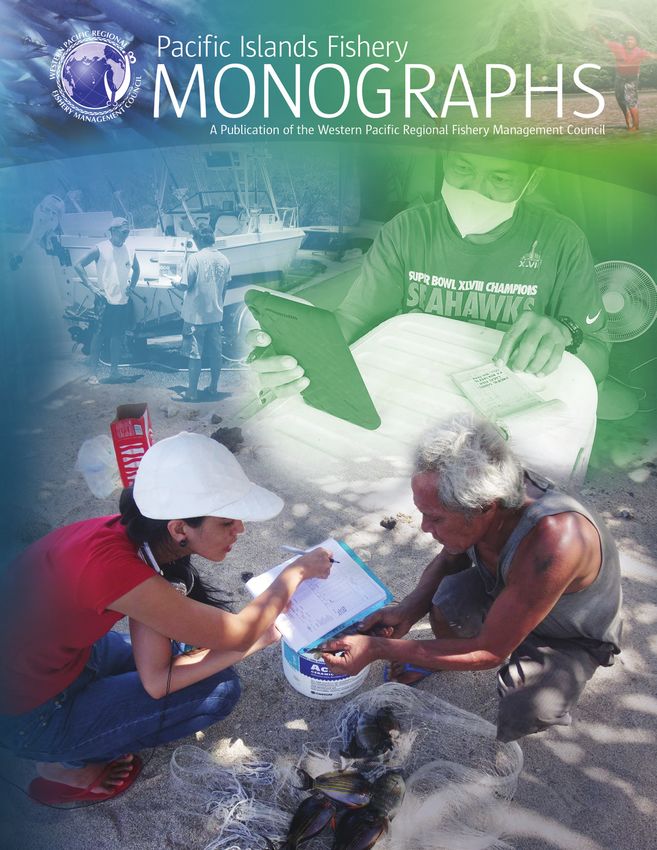
COVER: (top left) Hawai’i data collection;
(bottom left) Priti Smith conducting a
shore-based creel interview with Terry
Lam-Yuen to capture rare-event fishing in
American Samoa; (top right) Jim Cabanese
of Pacific Source Fish Mart reporting
fish purchase from CNMI fishermen on
Catchit Logit.
B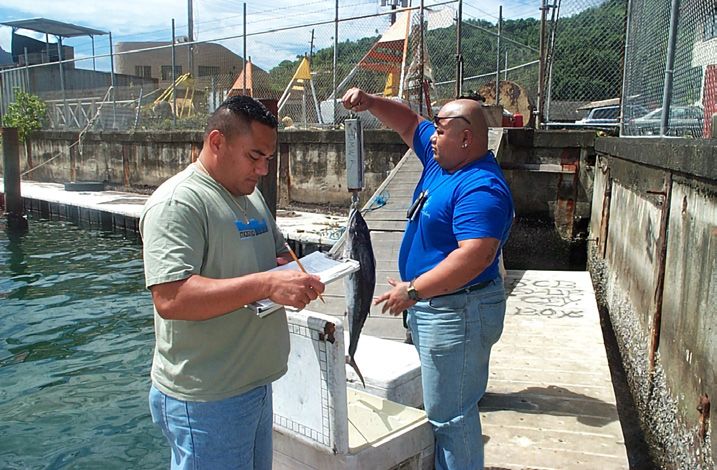
CONTENTS

           LIST OF ILLUSTRATIONS. .  .  .  .  .  .  .  .  .  .  .  .  .  .  .  .  .  .  .  .  .  .  .  .  .  .  .  .  .  .  .  .  .  .  .  .  .  .  .  .  .  .  .  .  .  .  .  .  .  .  . ii
           LIST OF TABLES. .  .  .  .  .  .  .  .  .  .  .  .  .  .  .  .  .  .  .  .  .  .  .  .  .  .  .  .  .  .  .  .  .  .  .  .  .  .  .  .  .  .  .  .  .  .  .  .  .  .  .  .  .  .  .  .  . ii
           LIST OF ACRONYMS. .  .  .  .  .  .  .  .  .  .  .  .  .  .  .  .  .  .  .  .  .  .  .  .  .  .  .  .  .  .  .  .  .  .  .  .  .  .  .  .  .  .  .  .  .  .  .  .  .  .  .  .  .  . ii

           1.       Introduction . .  .  .  .  .  .  .  .  .  .  .  .  .  .  .  .  .  .  .  .  .  .  .  .  .  .  .  .  .  .  .  .  .  .  .  .  .  .  .  .  .  .  .  .  .  .  .  .  .  .  .  .  .  .  . 1

           2. 	     Setting the Stage
           2.1      Regional Fisheries Management. .  .  .  .  .  .  .  .  .  .  .  .  .  .  .  .  .  .  .  .  .  .  .  .  .  .  .  .  .  .  .  .  .  .  .  .  .  .  .  .  . 1
           2.2      Regional Fisheries . .  .  .  .  .  .  .  .  .  .  .  .  .  .  .  .  .  .  .  .  .  .  .  .  .  .  .  .  .  .  .  .  .  .  .  .  .  .  .  .  .  .  .  .  .  .  .  .  .  .  . 1
           2.3      Regional Data Collection Systems . .  .  .  .  .  .  .  .  .  .  .  .  .  .  .  .  .  .  .  .  .  .  .  .  .  .  .  .  .  .  .  .  .  .  .  .  .  .  . 2

           3. 	     Early Data Collection History
           3.1      Boxes of Receipts. .  .  .  .  .  .  .  .  .  .  .  .  .  .  .  .  .  .  .  .  .  .  .  .  .  .  .  .  .  .  .  .  .  .  .  .  .  .  .  .  .  .  .  .  .  .  .  .  .  .  .  . 3
           3.2      Western Pacific Fisheries Information Network . .  .  .  .  .  .  .  .  .  .  .  .  .  .  .  .  .  .  .  .  .  .  .  .  .  .  .  .  . 3
           3.3      Fishery Data Collection Committee . .  .  .  .  .  .  .  .  .  .  .  .  .  .  .  .  .  .  .  .  .  .  .  .  .  .  .  .  .  .  .  .  .  .  .  .  .  . 4
           3.4      Funding: A Continuing Challenge. .  .  .  .  .  .  .  .  .  .  .  .  .  .  .  .  .  .  .  .  .  .  .  .  .  .  .  .  .  .  .  .  .  .  .  .  .  .  .  . 4

           4. Monitoring Fishery Performance
           4.1 Fishery Management Plan Monitoring and Assessment Workshop (1989). .  .  .  .  .  .  .  .  .  . 6
           4.2 	 WPacFIN Next Generation Computer Training Workshop (1989). .  .  .  .  .  .  .  .  .  .  .  .  .  .  .  .  . 7

           5. Complying with the Sustainable Fisheries Act
           5.1 The 1996 Data 2000 Workshop–Developing Stock Assessments (1997). .  .  .  .  .  .  .  .  .  .  .  . 8
           5.2 Ecosystem Science and Management Planning Workshop (2005). .  .  .  .  .  .  .  .  .  .  .  .  .  .  .  . 8
           5.3 	 Data and Monitoring Workshop (2006) . .  .  .  .  .  .  .  .  .  .  .  .  .  .  .  .  .  .  .  .  .  .  .  .  .  .  .  .  .  .  .  .  .  .  . 8

           6.       Complying with the 2007 Magnuson-Stevens Reauthorization—
                    Annual Catch Limits for All
           6.1      Pacific Islands Biosampling Workshop (2009). .  .  .  .  .  .  .  .  .  .  .  .  .  .  .  .  .  .  .  .  .  .  .  .  .  .  .  .  .  . 10
           6.2      Regional Fishery Data Workshop (2009). .  .  .  .  .  .  .  .  .  .  .  .  .  .  .  .  .  .  .  .  .  .  .  .  .  .  .  .  .  .  .  .  .  . 11
           6.3      Workshop on Establishing Annual Catch Limits (2011) . .  .  .  .  .  .  .  .  .  .  .  .  .  .  .  .  .  .  .  .  .  .  . 11
           6.4      Noncommercial Data Workshop (2011) . .  .  .  .  .  .  .  .  .  .  .  .  .  .  .  .  .  .  .  .  .  .  .  .  .  .  .  .  .  .  .  .  .  . 11
           6.5      Data Collection Improvement Workshop (2011). .  .  .  .  .  .  .  .  .  .  .  .  .  .  .  .  .  .  .  .  .  .  .  .  .  .  .  . 12
                    6.5.1 Governance Body Restructuring. .  .  .  .  .  .  .  .  .  .  .  .  .  .  .  .  .  .  .  .  .  .  .  .  .  .  .  .  .  .  .  .  .  .  .  . 13
                    6.5.2  Funding Stream for Projects. .  .  .  .  .  .  .  .  .  .  .  .  .  .  .  .  .  .  .  .  .  .  .  .  .  .  .  .  .  .  .  .  .  .  .  .  .  . 13
           6.6      Pacific Island Fisheries Monitoring and Assessment Planning Summit (2019)d . .  .  .  .  . 14

           7. 	     What Does the Future Hold?
           7.1      Deep-7 Bottomfish in the Main Hawaiian Islands . .  .  .  .  .  .  .  .  .  .  .  .  .  .  .  .  .  .  .  .  .  .  .  .  .  .  . 16
           7.2      Small-Boat Pelagic Fishery. .  .  .  .  .  .  .  .  .  .  .  .  .  .  .  .  .  .  .  .  .  .  .  .  .  .  .  .  .  .  .  .  .  .  .  .  .  .  .  .  .  .  .  . 16
           7.3      Funding the Future . .  .  .  .  .  .  .  .  .  .  .  .  .  .  .  .  .  .  .  .  .  .  .  .  .  .  .  .  .  .  .  .  .  .  .  .  .  .  .  .  .  .  .  .  .  .  .  .  . 17

           REFERENCES. .  .  .  .  .  .  .  .  .  .  .  .  .  .  .  .  .  .  .  .  .  .  .  .  .  .  .  .  .  .  .  .  .  .  .  .  .  .  .  .  .  .  .  .  .  .  .  .  .  .  .  .  .  .  .  .  .  . 18

                                                                                                                                                                                                           i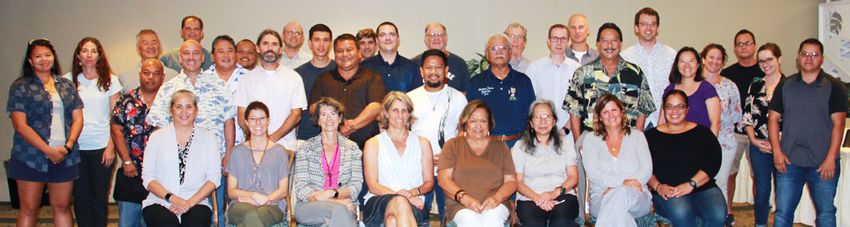
LIST OF ILLUSTRATIONS                                                                             LIST OF ACRONYMS
Fig. 1. Boat-based creel survey technicians recording catch                                       ACL      annual catch limit
        information from a trolling trip. . . . . . . . . . . . . . . . . . . . . . 2             AM       accountability measure
Fig. 2. WPacFIN staff training DLNR staff on Rota, CNMI. . . . . . . . 2                          CML      commercial marine license
Fig. 3. Council contractor and DAR staff collecting information                                   CNMI 	   Commonwealth of the Northern Mariana Islands
        from the Honolulu fish auction. . . . . . . . . . . . . . . . . . . . . . 3               CPRS     Commercial Purchase Reporting System
Fig. 4. Organizations participating in the Western Pacific Fisheries                              CPUE     catch per unit effort
        Information Network. . . . . . . . . . . . . . . . . . . . . . . . . . . . . . 3          CRCP     Coral Reef Conservation Program
                                                                                                  DAR      Division of Aquatic Resources (Hawai‘i)
Fig. 5. Original members of the Fisheries Data Cooordinating
        Committee. . . . . . . . . . . . . . . . . . . . . . . . . . . . . . . . . . . . . 4      DAWR     Division of Aquatic and Wildlife Resources (Guam)
                                                                                                  DFW      Division of Fish and Wildlife (CNMI)
Fig. 6. Letter from Congressman Daniel Akaka informing the
        Council that there is no funding to support WPacFIN . . . . . 5                           DMWR     Department of Marine and Wildlife Resources
                                                                                                           (American Samoa)
Figs. 7a-b. Computers provided to local fishery agencies by the
                                                                                                  EEZ      exclusive economic zone
        Council and Honolulu Lab. . . . . . . . . . . . . . . . . . . . . . . . . . 5
                                                                                                  EPAP     Ecosystem Principles Advisory Committee
Fig. 8. WPacFIN staff Michael Quach upgrading the hardware                                        FDCC     Fisheries Data Coordinating Committee
        system at DAWR. . . . . . . . . . . . . . . . . . . . . . . . . . . . . . . . . 5
                                                                                                  FDCRC    Fishery Data Collection and Research Committee
Fig. 9. Council chief scientist Paul Dalzell presenting at the                                    FEP      Fishery ecosystem plan
        2006 Data and Monitoring Workshop.. . . . . . . . . . . . . . . . . 9
                                                                                                  FIN      Fishery Information Network
Fig. 10a–g. Regional BioSampling Workshop. . . . . . . . . . . . . . . .  10                      EPAP     Ecosystem Principles Advisory Panel
Fig. 11. Technical Subcommittee that worked on the Fishery Data                                   FMP      fishery management plan
         Collection and Research Committee Strategic Plan. . . . . .  13                          HMRFS Hawai‘i Marine Recreational Fishing Survey
Fig. 12. The 153rd Council meeting in Saipan. . . . . . . . . . . . . . . . .  13                 MRIP     Marine Recreational Information Program
Fig. 13. Regional participants of the Pacific Island Fisheries                                    MSA      Magnuson-Stevens Fishery Conservation and
         Monitoring and Assessment Planning Summit. . . . . . . . .  15                                    Management Act
                                                                                                  MSY 	    maximum sustainable yield
Fig. 14. Catchit and Logit logo. . . . . . . . . . . . . . . . . . . . . . . . . . . .  15
                                                                                                  nm       nautical mile
Fig. 15. Owner of MJ Fishing in Saipan transcribing daily purchase                                NMFS     National Marine Fisheries Service
         receipts into the Catchit Logit app. . . . . . . . . . . . . . . . . . .  15
                                                                                                  NWHI     Northwestern Hawaiian Islands
Fig. 16. Official correspondence rejecting the federal permit
                                                                                                  PacFIN 	 Pacific Fishery Information Network
         and reporting measures in Amendment 14 to the
         Pelagic FMP. . . . . . . . . . . . . . . . . . . . . . . . . . . . . . . . . . . .  17   PIFMAPS 	Pacific Island Fisheries Monitoring and Assessment .
                                                                                                           Planning Summit
Fig. 17. The Council’s response to NMFS rejection of the permit
                                                                                                  PIFSC 	  Pacific Islands Fisheries Science Center
         and reporting requirements in Amendment 14. . . . . . . . .  17
                                                                                                  PIRO 	   Pacific Islands Regional Office
                                                                                                  PIROP 	 Pacific Islands Regional Observer Program
LIST OF TABLES
                                                                                                  PMT 	    Plan Management Team
Table 1: Technical specifications of the IBM PS/2 and Apple II                                    PRIAs 	 Pacific Remote Island Areas
         used to collect fishery data in the region. . . . . . . . . . . . . . 5
                                                                                                  RFMC     Regional Fishery Management Council
Table 2: List of stock assessment work to acquire information                                     SAFE     Stock Assessment and Fishery Evaluation
         needed for ACL management. . . . . . . . . . . . . . . . . . . . . .  12
                                                                                                  SFA      Sustainable Fisheries Act
Table 3: Pilot projects and their funding sources. . . . . . . . . . . . . .  14                  SSC      Scientific and Statistical Committee
                                                                                                  SFF      Sustainable Fisheries Fund
                                                                                                  SWFSC 	 Southwest Fisheries Science Center
                                                                                                  TAC      total allowable catch
                                                                                                  TSI      Territory Science Initiative
                                                                                                  USFWS 	 U.S. Fish and Wildlife Service
                                                                                                  WPacFIN Western Pacific Fishery Information Network
                                                                                                  WPDGC 	 Western Pacific Data Goals Committee
                                                                                                  WPR      Western Pacific Region
                                                                                                  WPRFMC Western Pacific Regional Fishery Management Council
                                                                                                  WSFR 	 Wildlife and Sport Fish Restoration

ii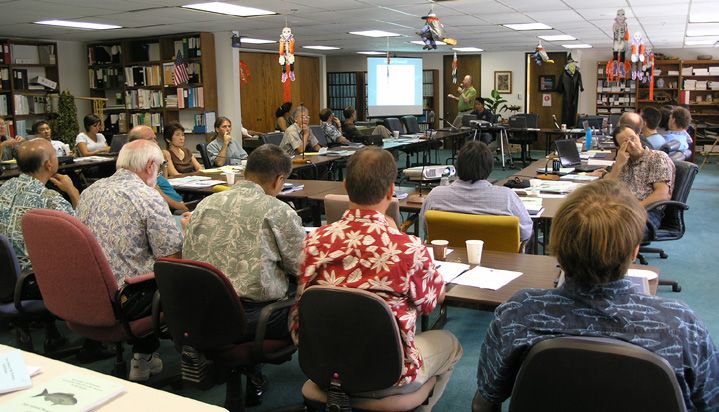
1. INTRODUCTION
“
M
ath does not just describe the universe but makes the universe.” “The universe is a
mathematical structure.” “Everything in the universe is made of math.” These are some of
the quotes that are circulating in the popular media about math and numbers. If you ponder
upon them, you’ll find that they contain some truth. The smallest atom has a weight; our age is .
a number; everything has a dimension; and the universe is quantified by its age (13.8 billion years)
and rate of expansion (72 kilometers per mega parsec).
When you come to fish and fisheries, numbers abound. Then why, despite knowing this and having decades
Fish have weight, age and length. The catch of fisheries of management history, has the Western Pacific Regional
has a weight. Fishing effort has a duration. Each fisherman Fishery Management Council (WPRFMC, or Council)
has a rate at which he or she catches fish. All these are numbers. struggled to acquire fishery information that is critically
When fishery agencies collect these numbers, fishery needed to properly manage the fisheries in the region?
managers can use them to make decisions that are equitable This monograph attempts to answer that question by docu
to the stakeholders and help sustain the stocks. Data are the menting the attempts that have been to improve fishery data
lifeblood of fishery science and management. Stock assess collection in the Western Pacific Region (WPR). Some efforts
ments are driven by numbers. Monitoring of fishery perfor reached their goals; some failed. It seems that a robust data
mance relies heavily on data. The evaluation of regulatory collection system that has been long sought after is as elusive
impacts and the effectiveness of management measures all as a wily fish.
need accurate and diverse sets of data.
2. SETTING THE STAGE
2.1 Regional Fisheries Management in the management of shared fishery The island fisheries are more diverse
In 1976, the enactment of the resources. The coordination among the than the pelagic fisheries in terms
Fishery Conservation and Management Council and federal, state and territory of the species and the gear used to
Act (subsequently known as the agencies includes monitoring and catch the species. The bottomfish,
Magnuson-Stevens Act, or MSA) tracking catch. Tracking of the catch crustaceans, precious coral and coral
established the nation’s fishery conser is a crucial part of fishery management reef ecosystem fisheries constitute
vation zone (now known as the exclu to monitor fishery performance, the majority of the island fisheries.
sive economic zone, or EEZ), which production, catch per unit effort These fishermen use small boats for
extends 200 nautical miles (nm) offshore. (CPUE) and, more recently, to meet most commercial operations and
The MSA also established eight Regional annual catch limit (ACL) requirements also other watercraft, like canoes and
Fishery Management Councils (RFMCs) of the 2006 reauthorized MSA. kayaks, for the noncommercial sector.
mandated to develop, monitor and There are the bottomfishing headboat
amend fishery management plans (FMPs)
2.2 Regional Fisheries type noncommercial charters in the
for fisheries in federal waters (generally, Island and pelagic fisheries are the Marianas. The noncommercial fisheries
3 to 200 nm offshore). The FMPs major categories of fisheries managed are conducted along the shoreline
are required to have conservation and by the Council in the WPR. The using such gear as nets, hook-and-line
management objectives and measures island fisheries are located in waters and spear and include recreational,
to prevent overfishing, rebuild surrounding Hawai‘i (including the subsistence, sustenance, cultural and
overfished stocks and ensure a safe, Northwestern Hawaiian Islands, traditional fishing.
sustainable supply of seafood and long- or NWHI), American Samoa, The pelagic fishery is subdivided
term economic and social benefits of Mariana Archipelago (Guam and into large vessels, such as longliners
fisheries to the nation. the Commonwealth of the Northern and purse-seiners, and small boat
In partnership with the National Mariana Islands, or CNMI) and the commercial, noncommercial and
Marine Fisheries Service (NMFS), the Pacific Remote Island Areas (PRIAs). charter troll fisheries. These fisheries
Council manages the federal fisheries The pelagic fisheries occur both within principally target tuna, blue marlin and
and the species throughout their range. the U.S. EEZ waters surrounding other billfishes.
The Council and NMFS coordinate each of these island areas and in
with state and territory fishery agencies international waters.
1
2.3 Regional Data Collection at predetermined ports, marinas and Observer Program (PIROP) and
Systems ramps) to estimate catch. NMFS logbook programs are utilized
In the territories, the standard data to record catch by species and effort of
For the island and small-boat pelagic
collection system for the island and U.S. longline fisheries based in Hawai‘i
(i.e., nonlongline) fisheries, fishery-
small-boat pelagic fisheries includes and American Samoa. The PIROP
dependent data are captured by state
boat- and shore-based creel surveys uses observers on board longline
and territorial agencies: the Division
(fig. 1). These surveys are comprised of vessels to collect additional information
of Aquatic Resources (DAR) in
a Participation Run, where data collec such as size frequencies of catch by
Hawai‘i, the Department of Marine
tors randomly survey stratified locations species with geolocation information
and Wildlife Resources (DMWR) in
and periods to gauge fishing partici on longline sets. Submitting reports
American Samoa, Division of Aquatic
pation, and a Catch Interview Run, electronically has been an option for
and Wildlife Resources (DAWR)
where data collectors intercept fisher the longline fisheries. In September
in Guam, and Division of Fish and
men for interviews of their specific 2020, the Council took final action on
Wildlife (DFW) in the CNMI.
effort and to measure their catch.
Hawai‘i noncommercial island and
Commercial data for the island
small-boat pelagic fisheries data are
and small-boat pelagic fisheries in
collected through the Fisher Reporting
the territories are supplemented by
System, as a requirement for those
the Commercial Purchase Reporting
holding a Hawai‘i Commercial Marine
System (CPRS) (fig. 2). Fish retailers
License (CML), and is supplemented
submit logbooks on the type and
by Dealer Reports, which fish retailers
amount of fish they have purchased
must provide on the amount of fish
from the commercial fishermen. The
bought from fishermen. The require
CPRS is voluntary in Guam and
ments for the fishermen reports range
mandatory for American Samoa,
from trip level (for Deep 7 bottomfish1) Fig. 2. WPacFIN staff Mike Quach training DLNR
CNMI and Hawai‘i.
to monthly (for the rest of the species). staff on Rota, CNMI, to use the Commercial
The noncommercial data for the Purchase Reporting System data processing app.
Hawai‘i noncommercial island and
island and small-boat pelagic fisheries Dave Hamm photo.
small-boat pelagic fisheries data are
in the territories are assumed to be that
collected by the Hawai‘i Marine
gathered from the shore-based creel a regulatory amendment for mandatory
Recreational Fishing Survey (HMRFS).
survey and the not-sold portion of the electronic reporting for vessels
The HMRFS system includes a mail
catch from the boat-based catch interview. operating under the Hawai‘i longline
survey, which estimates fishing effort,
For the commercial longline limited entry permit and vessels
and a shoreline roving interview (i.e.,
fisheries, the Pacific Islands Regional larger than 50 feet in length (i.e., size
Access Point Angler Intercept Survey
classes C and D) operating under the
American Samoa longline limited entry
permit. Under the amendment, vessel
operators must record and submit
logbook data within 24 hours after
completion of each fishing day using an
electronic logbook application certified
by NMFS. In the event of technology
malfunction, vessel operators would be
required to submit the logbook data by
paper or electronically within 72 hours
of the end of each fishing trip. The
recommended date for implementing
mandatory electronic reporting is
by July 1, 2021. This regulatory
amendment is pending approval by
the Secretary of Commerce. There are
no noncommercial longline fisheries;
therefore, no corresponding data
collection mechanisms.
Fig. 1. Boat-based creel survey technicians in American Samoa recording catch information from a
trolling trip (2001). Dave Hamm photo.
1. Comprised of six species of deep-water snapper and one deep-water grouper.
2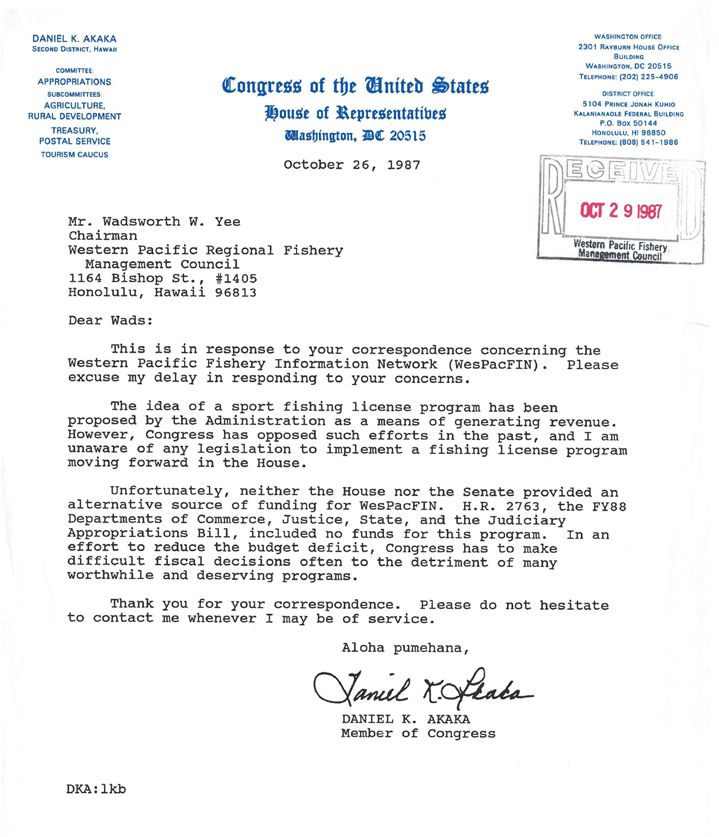
3. EARLY DATA COLLECTION HISTORY
Western Pacific Fishery
3.1 Boxes of Receipts Information Network
In the 1970s, the Council began ORGANIZATIONS
work to develop the FMPs for the
WPR as mandated by the MSA.
These efforts included coordinating National Western Pacific
fishery data collection systems with Marine Fisheries Regional Fishery Hawai‘i “Flag States”
Service Management
the State of Hawai‘i and establishing Council
such systems in the territories.
The State of Hawai‘i had been
collecting fisheries information Commenwealth
Southwest Division
since the 1940s, including dealer Fisheries
Southwest
of Aquatic
American Guam of the
Regional Office Samoa Northern
information which was not inputted Science Center Resources
Mariana Islands
in a computerized database system.
The Council saw an opportunity to
capture the dealer information at the
United Fishing Agency (Honolulu fish Department of Division of
Honolulu Pacific Marine and Aquatic Department Division of
auction), which was and continues to Laboratory Area Office Wildlife and Wildlife of Commerce Fish and Wildlife
Resources Resources
be the biggest dealer in Hawai‘i. After
fishermen dropped off their catch at the Fig. 4. Organizations participating in the Western Pacific Fisheries Information Network.
auction, copies of the receipts they were Source: Hamm 1993.
issued were kept in shoeboxes. The
Council contracted Kurt Kawamoto, the Council contractor to continue WPacFIN (fig. 4) and participated
assisted by Hawai‘i DAR staff Jo-Anne the data collection at the auction and in the design and implementation of
Kushima, to collect the information also from dealers on the islands of WPacFIN. Alaska FIN deals with
from the auction receipts and log Kaua‘i, Maui and Hawai‘i (the Big the northwest region fisheries.
landings (fig. 3). The receipt boxes Island), where the second largest WPacFIN provides technical
were transported to the Honolulu seafood auction (Suisan) was located. support, including hardware and
For the territories, the Council software support, and governs the
initiated the Historical Data Compila data storage and data sharing through
tion Project, which identified and various agreements. The WPacFIN
described the fishery data available in system provides each island area with
American Samoa, Guam and CNMI. its unique and independent data system
and brought about the standardization
3.2 Western Pacific Fisheries of data sets to allow for inter-jurisdic
Information Network tional comparisons. The WPacFIN
In 1981, the SWFSC established the developed the data entry softwares,
Fishery Information Network (FIN) to computational capabilities and auto
“provide a central source of regionwide mated summarization of the data
Fig. 3. Council contractor Kurt Kawamoto and fishery data” in the Pacific area so as to collected by each territory fishery
DAR staff member Jo-Anne Kushima collect meet the increasing demand for readily agencies. These summarizations are
fish purchase information at the Honolulu fish used to generate the Council’s annual
auction. WPRFMC photo. accessible, quality fisheries data needed
for the development of FMPs and monit oring reports as well as the the
Laboratory, then a part of the NMFS other management purposes (Hamm reporting for the Fisheries of the
Southwest Fisheries Science Center 1982). The FIN included the Pacific United States.2
(SWFSC), to be sorted. A standardized FIN (PacFIN) for the Western coastal Starting in December 1981 into
coding system was established for states and Idaho and the Western 1982, 64K Apple II+ computer systems
the fishermen, species and other Pacific FIN (WPacFIN) for Hawai‘i were installed in all four island fishery
information on the receipts. This was and the U.S. Pacific Island territories. agencies. Relational database systems
the start of the Hawai‘i dealer database. NMFS, WPR state/territorial fishery were created and numerous staff trained
The Honolulu Lab subsequently hired agencies and the Council comprised to support the generation of
2. Fisheries of the United States is the annual NMFS yearbook of fishery statistics for the United States published from 1999 to 2018. The report provides data on U.S.
recreational catch and commercial fisheries landings and value as well as other aspects of U.S. commercial fishing.
3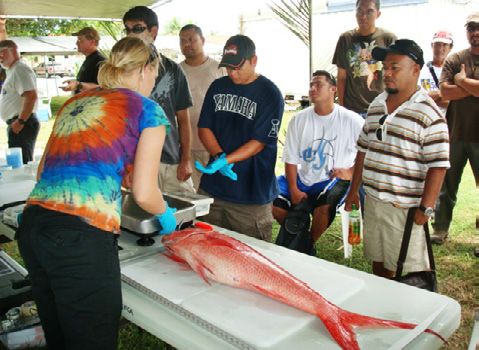
a territory-wide information to monitor The WPDGC restructured 3.4 Funding: A Continuing
fishery performance. As technology into the WPacFIN Fisheries Data Challenge
changed and microcomputers systems Coordinating Committee (FDCC) in
The Council has had a historic
improved over the last 40 years of 1985 (figs. 5a–g). The FDCC was the
involvement in financially supporting
support, WPacFIN Central has provided governance body that guided imple
WPacFIN. The coordinated data
about 80 Microsoft-based computers mentation of WPacFIN and the forum
collection system for the WPR was
covering five to six processor generat for communicating data collection
established and initially implemented
ions and provided many training at all issues and proposing solutions. It
from PacFIN funds committed by
main fishery offices and field offices. included heads of the WPRFMC,
the SWFSC. The Council helped by
The WPacFIN developed database SWFSC, SWFSC Honolulu Lab,
providing $40,000 in seed funding and
processing, quality control and American Samoa Office of Marine
by working with the SWFSC’s Honolulu
reporting systems that spanned about Resources (precursor to the DMWR),
Lab to transition the Council’s existing
seven database and four programming Guam Department of Agriculture,
Historical Data Compilation Project
languages. The technical support at Hawai‘i Board of Land and Natural
to WPacFIN (Hamm 1982).
the backend of the data collection Resources and CNMI Department
Keeping the regional system funded
process is meant to support the on- of Natural Resources. The purposes
has been challenging. In 1987, Congress
the-ground collection conducted of FDCC were 1) to serve as the
man Daniel Akaka (D-Hawai‘i) informed
by the territorial fishery agencies. forum for information exchange
Council Chair Wadsworth Yee that
related to fisheries data and to oversee
3.3 Fishery Data neither the Senate nor the House
WPacFIN operations and progress
provided funding for the 6-year-old
Coordinating Committee review; 2) to establish WPacFIN
program (fig. 6). Undeterred, the
The establishment of WPacFIN implementation activities and priorities;
Council sought funding through the
required a coordinating body to 3) to coordinate and recommend
Pacific Marine Fisheries Commission
recommend priorities and identify improvements to the implementation
and assisted state/territorial agency
the regional data collection program’s plan; 4) to promote development and
directors with the preparation of
needs. By mid-1982, the Western Pacific implementation of data collection;
letters supporting the PacFIN budget
Data Goals Committee (WPDGC) and 5) to designate membership of
request for $1.9 million, of which 18%
was created for this purpose and a Technical Subcommittee (Hamm
($350,000) would be used to continue
included the same agencies comprising 1985). The glory days of the FDCC
supporting WPacFIN.
WPacFIN. This Committee determined were in the late 80s to the early
In a memo dated Dec. 9, 1987,
the specific projects and data collection 2000s, when it took the fight to
Council Executive Director Kitty M.
systems that should be undertaken in the Pacific States Marine Fisheries
Simonds reported to Council Chair
each island area. A Technical Subcom Commission to get its fair share of
Bill Paty (incumbent Hawai‘i Board
mittee was formed to support the tech data collection funding. At this time,
of Land and Natural Resources chair)
nical and operational aspects of WPacFIN WPacFIN budget was under PacFIN
that the Council provided program
and to ensure that the information budget line item since the Honolulu
matic funds for each territory member
needs were met. Lab was under the SWFSC.
of the FDCC, purchased four IBM
WPacFIN Fisheries Data
Coordinating Committee
Fig 5. Original members of the FDCC included (top row,
left to right) Committee Chair Kitty M. Simonds
(WPRFMC), Richard Shomura (SWFSC Honolulu Lab),
Henry Sesepasara (American Samoa), Harry Kami (Guam);
(bottom row left to right) Henry Sakuda (Hawai’i),
Nick Leon Guerrero (CNMI) and Doyle Gates (SWFSC).
4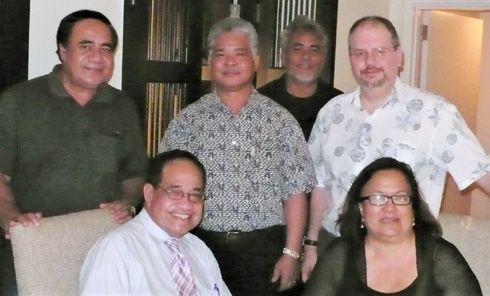
Personal System/2 machines for
Hawai‘i fishery offices on the neighbor
islands to replace the Apple II compu
ters provided initially by the SWFSC
Honolulu Lab (Table 1) (figs. 7a and
7b) and provided computer training
for DAR staff.
According to a 1989 Council sum
mary document titled “PacFIN,” the
federal share of the PacFIN consisted
of programmatic grants to the RFMCs
and some ad-hoc monies from the West
Coast offices of NMFS. This document
was used to justify the increased and
stable funding for WPacFIN for the
fiscal year 1990 (WPRFMC 1989).
During this period, the Council
requested $400,000 that would go to
Hawai‘i and the territories (an order of
magnitude larger than the initial seed
funding of $40,000) and $200,000 to
support the WPacFIN Data Systems.
The Council also supported the
region’s data collection system by
funding the Boating Fishing Survey
Design Project to scope the extent
of recreational fisheries in Hawai‘i;
purchasing computer systems for
American Samoa and Guam; and
continually monitoring the status of
data collection in the region.
In 2004, the Pacific Islands became
its own NMFS region separate from
the NMFS Southwest Region, and
Fig. 6. Letter from Congressman Daniel Akaka informing the Council that there is no funding to
the Pacific Islands Fisheries Science
support WPacFIN in the Fiscal Year 1988 Appropriation Bill, which is indicative of the continuous
Center (PIFSC) was established. This struggle to fund the regional data collection program.
led to some supplemental funding for
WPacFIN and Council projects (fig. 8). Table 1: Technical specifications of the IBM PS/2 and Apple II used to collect fishery
data in the Western Pacific Region.
Parameters IBM PS/2 Apple II+ & Apple IIe
(Upgraded computers (Initial computers provided by
provided by the Council) SWFSC Honolulu Lab)
Microprocessor Intel 8088 MOS Technology 6502
Central Processing 4,772,726 Hz (2x) 1,022,727 MHz.
Unit Speed
Random 64 kilobytes 64 kilobytes.
Access Memory
Graphics 320 x 200 resolution . 280 x 192 resolution (National
(Color Graphics Adapter) Television System Committee)
Figs. 8. David Hamm, WPacFIN program Figs. 7a. and 7b. The Council provided IBM Personal System/2 computers
manager (circa 1980s). David Hamm photo. (left) to fishery agencies in Hawai‘i neighbor islands to replace aging
Apple II computers (above right) that had been previously provided to them
by the Honolulu Lab.
5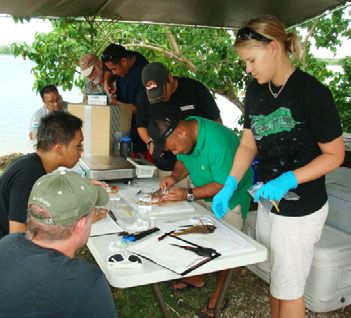
4. MONITORING FISHERY PERFORMANCE Between the enactment of the descriptions were no longer adequate territory agency would be responsible MSA in 1976 and its reauthorization and there was general dissatisfaction for generating the report module for in 1996, the Council developed with the process used to generate its island area ahead of the Council’s and implemented four FMPs: the the Bottomfish and Pelagic FMP annual Plan Management Team (PMT) Crustacean FMP (1983), Precious Annual Reports. Too much effort was meetings. Ample time should be Coral FMP (1983), Bottomfish expended on producing descriptive given for the PMT members to review and Seamount Groundfish FMP statistics of fishery performance the reports and for the reports to (1986) and Pelagic FMP (1987). and not enough effort was given to be revised and finalized. The report While the impetus for implementing rigorous analyses. The module and also documented several indicators and coordinating the region’s data report generation was overemphasized, generated by the workshop to evaluate collection programs was development and trends, changes and fishery issues the performance of the fisheries and of the FMPs, once most of them were received less emphasis. Additionally, status of the stocks. Indicators for the completed (the Coral Reef Ecosystem the Council’s annual reports and bottomfish fishery were biological FMP would be implemented in 2004), NMFS’s Stock Assessment and (e.g., average length at first maturity, the attention refocused to monitoring Fishery Evaluation (SAFE) report the ratio of fishing mortality to natural performance of the fisheries and were potentially duplicative. mortality and CPUE measures that prevent overfishing of WPacFIN and FDCC, the Council, ex-vessel revenue); operational (e.g., while achieving optimum yield. in collaboration with the SWFSC increase in catch per gear, increase National Standard 2 requires these Honolulu Lab, convened the FMP in proportion of frozen products, measures to be based on the best Monitoring and Assessment Workshop change in species composition, and scientific information available. Each on Nov. 6–9, 1989. Representatives substantial increase or decrease in FMP requires an annual report to from each of the region’s state and total landings compared to the long- monitor the fishery performance and territory fishery agencies participated term average); and expert-based (e.g., a set of indicators to evaluate whether in the workshop to define and discuss interaction with protected species the FMP objectives are achieved. the analyses needed to monitor and begins to occur). Some of the ranked While the original goal of assess the status of the bottomfish pelagic fisheries indicators included establishing a coordinated data and pelagic fisheries in each island size statistics, index of localized collection program through out the region. Data, analytical processing catchability, ratio of CPUE per gear, region is to monitor the broad fishery systems and human resources were index of species-gear-season CPUE, performance, the changes in the identified for each method of analysis. recreational CPUE trends, price trends management requirements both in The workshop generated three and index of effort by area and gear. the local and federal waters triggered products: 1) a report that documented The second workshop product the evolution of the data collection the workshop discussion and recom (Bartram 1990a) created the actions by needs. At this period, the annual mendations; 2) a “plan of attack” that which issues identified in the annual reports and annual reviews of the followed up on the workshop discus report generation process would be FMP objectives drove the changes sions and suggestions for organizing addressed. These actions included 1) in the data collection and reporting available data and analytical resources streamlining the FMP monitoring from the regional data collection to improve FMP monitoring proce procedures by focusing on the priority systems in Hawai‘i and the territories. dures; and 3) a document that compiled indicators of fishery condition and The early annual reports for the the data collection needs to address urgent fishery issues; 2) publishing the FMP focused on descriptions of fishery the requirements of the annual and basic fishery data from the annual data performance and characteristics of SAFE reports. review only in the NMFS WPacFIN’s the fisheries that met the basic FMP The first workshop product (Pooley “Fishery Statistics of the Western requirements. But as information 1990) reported a protocol for the deve Pacific”3 and incorporating only requirements and the complexity lopment of the Pelagic and Bottomfish portions of their summary statistics and of the management increased, basic Annual Reports. Each state and other research information by reference 3. Between 1986 and 2016, WPacFIN published 31 PIFSC administrative reports summarizing the fishery data collected throughout the WPR. 6
in the annual reports; 3) incorporating                covered improvements to the fishery-        4.2 WPacFIN Next Generation
more rigorous analysis focusing on the                 dependent data collection; identified       Computer Training Workshop
key fisheries indicators that are related              mandatory record-keeping and                Workshop (1989)
to the management objectives; 4)                       reporting as a primary need to improve
treating annual report suggestions as                  the fishery’s commercial segment; and          The SWFSC Honolulu Lab
the PMT’s best judgment about fishery                  described the support for the technical     convened the WPacFIN Next
conditions based on the individual                     work conducted by WPacFIN central,          Generation Computer Training
member’s expertise and familiarity                     island agency systems, monitoring           Workshop on Nov. 13–24, 1989.
with the fisheries; 5) providing the                   system upgrades, and special fishery        This workshop aimed to provide
Council with brief annual summaries                    information projects and research to fill   technical capabilities for the member
of the status of the FMP fisheries and                 in information gaps for assessments.        agencies to utilize new hardware
popularizing the annual reports for                        In response to the workshop, the        and software environments as part
distribution to fishery participants;                  American Samoa Office of Marine             of the technical upgrading effort.
and 6) including the SAFE report                       Resources would require mandatory           While this built upon the local
requirements in the annual data review.                commercial fishery permit and               capacity for data transcription and
   In response to the workshop,                        dealer reports in its regulations.          management, it did not address the
WPacFIN Central created automated                          In 2012, CNMI would enact Public        operational issues associated with
Plan Team Report generation software                   Law 17–89, establishing a mandatory         on-the-ground data collection.
that produced Word documents                           catch recording and reporting system,          Reviews conducted by the Center
embedded with updated graphs and                       but the implementing regulations            for Independent Consultants and
tables required by the FMPs. This                      would not be approved until February        Barry Vittor on the survey design
enabled island fishery agency Plan                     2019. In Guam, data submission              of the creel surveys resulted in
Team members to focus on writing the                   continues to be voluntary.                  minor tweaks to the design.4
interpretation of the trends in the data
and developing recommendations.
   The third workshop product, the                           That’s so 80s Trivia
WPacFIN data plan (Bartram 1990b),                           How long does it take to run a single year summary the Hawai‘i Pelagic
provided the data and research                               Fisheries Module in a micro-computer?
needed to develop and improve on the

                                                                                                                                               TOMY Dingbot, 1987. Source: Pinterest.com.
                                                                A Council memo (Rutka 1989) reported that NMFS scientist
indicators and descriptors that would
help managers monitor the FMPs                               and PMT member Robert Skillman said DAR PMT members
and make informed decisions about                            could reserve the State of Hawai‘i mainframe to run the data for
them. Each indicator and descriptor                          the module or use the University of Hawai‘i mainframe and pay
depends on the types and quantities                          for the time of usage. Or they could use the micro-computer
of data collected and analyzed. The                          [which we now call a desktop computer], but it
workshop identified data collection                          would take one to two days to complete one-year
steps and research that would improve                        of a 10-year time series. Today, that task would take a
the data that feeds into each indicator                      couple of minutes on an ordinary desktop computer.
and descriptor for the Bottomfish and
Pelagic Annual Reports. The data plan

4. Dave Hamm, in discussion with the author, 2020 Dec. 14.

                                                                                                                                           7
5. COMPLYING WITH THE SUSTAINABLE FISHERIES ACT
The 1996 reauthorization of the Workshop goal was to address the economic, and protected species
MSA, the Sustainable Fisheries Act gaps in the regional data collection information. It would also require
(SFA), strengthened the requirements systems to ensure that the data could the use of ecosystem models and
to prevent overfishing and rebuild be used to generate stock assessments. development of indicators useful for
overfished fisheries. It ushered in the The workshop generated 54 recom gauging ecosystem processes and the
use of biomass-based reference points, mendations for the data collections effects of management on species
i.e., MSYs, and reduced the use of the systems of Hawai‘i, American Samoa, and the ecosystem (Glazier 2011).
spawning potential ratios, the primary Guam and the CNMI and eight recom The workshop participants identified
reference points prior to the SFA. It mendations for WPacFIN central. They a range of interim requirements for
set the standard for FMPs to specify included additional components for the new data needed to support the
measurable criteria for determining annual reports (e.g., socioeconomic, ecosystem-approach to management
stock status, which drove the protected species, fishery-independent in the region. Of primary interest was
development of status determination information), partner access to data, improving the commercial, recreatio
criteria for each management unit database characteristics, data docu nal, subsistence landings and effort
species or complex and made stock mentation and standards, and capabi data; 2) information on bycatch
assessments a requirement. The SFA lities to generate the reports. and fishery interactions; and 3) data
also introduced another key FMP The common recommendations regarding life-history. The participants
component—fish habitat, requiring across the region were to 1) develop recognized that the ecosystems
designations of essential fish habitats regulations to require licensing and (biophysical, social and economic)
and habitat areas of particular concern. reporting; 2) expand the data collec are different between archipelagos
The 1996 SFA also called for NMFS tion systems; 3) improve communi and that research priorities should
to create an Ecosystem Principles cation and outreach; 4) refine data cater to the needs of each archipelago.
Advisory Panel (EPAP). The EPAP collection goals and objectives; Workshop recommendations inclu
developed recommendations to expand 5) enhance collaboration among ded the formation of a Data Needs
the use of ecosystem principles in agencies to deal with data collection Working Group to address the collec
fisheries management (16 USC §1882) issues; 6) upgrade the technology tion of fishery-dependent information
(EPAP 1999). The Council jumped and automate the reports; 7) integrate to support ecosystem-based fisheries
on this opportunity and developed the multiple data collection and database management and to monitor the
Coral Reef Ecosystem FMP, the first systems; 8) enhance research on fisheries through the annual and
ecosystem-based FMP in the nation, management unit species; and SAFE reports for the WPR.
which incorporated the eight EPAP 9) increase the resolution of the
recommendations. Four Councils existing data collection system for the 5.3 Data and Monitoring
(North Pacific, Pacific, South Atlantic commercial and recreational fisheries. Workshop (2006)
and Western Pacific) first responded to In response to the recommendation
the call for the development of Fishery 5.2 Ecosystem Science from the 2005 Ecosystem Science
Ecosystem Plans (FEPs) and mostly and Management Planning and Management Planning Workshop
addressed the EPAP recommendations Workshop (2005) recommendation to form a Data
(Wilkinson and Abrams 2015). In the early 2000s, the Council Needs Working Group, the Council
The new regulations in the SFA and began restructuring its five species- convened the Data and Monitoring
the EPAP recommendations elevated based FMPs into place-based FEPs. Workshop in October 2006 (fig. 9).
the significant and crucial role of data To assist in this work, it convened The workshop’s goal was to identify
in fisheries science and management three workshops between 2005 and the data and research needs to develop
and led to the convening of several 2007. The Ecosystem Science and stock assessments and ecosystem
additional data workshops. Management Planning Workshop models to support the implementation
(or Biophysical Workshop) in April of the FEPs. Improvements in the data
5.1 Data 2000 Workshop— and research priorities would trigger
2005 brought together 60 experts
Developing Stock Assessments to address the data that would be changes to the annual and SAFE
(1997) needed for the new FEPs. The work reports, which would be redesigned
In February 1997, the Council shop noted that the shift toward from species-based to place-based to
hosted a workshop to prepare WPacFIN the ecosystem approach to fisheries match the structure of the FEPs.
for the demands of the amendments management would require the The workshop covered the different
to the FMPs brought about by the collection of oceanographic, fishery- data collection systems in the domestic
SFA requirements. The Data 2000 independent biomass, social and (commercial and recreational) and
8international fisheries. Participants also covered stock assessments that could National Standard 2 requirement
reviewed the statutory requirements of be generated given the available data. to be based upon the best scientific
the 1996 SFA for FEPs and associated The workshop concluded with information available. Several
reports, including the SAFE Reports. recommendations to restructure the ecosystem and socioeconomic
The workshop discussed the inclusion annual reports and to include within indicators would also be included to
of habitat data in the reports and them the elements needed for the support development of the FEPs,
identified habitat and ecosystem annual reports to mutually serve which would be finalized in 2009.
parameters to be monitored, including as the SAFE reports. In particular, Federal management measures that
the human component. The workshop this included compliance with the required additional data increased the
burden on the state and territorial
data collection systems. Without a
significant increase in the NMFS
funding support for basic fishery
data collection, the territory fishery
agencies adapted by reprogramming
their Sportfish Restoration Program,
Interjuridictional Fisheries Act, and
WPacFIN cooperative agreement
to accommodate the collection
of additional fishery information.
These changes in turn altered the
programming codes of the data input,
the databases and the reporting
softwares at WPacFIN Central.
Fig. 9. Council senior scientist Paul Dalzell presents a recap of the purpose and nature of the
2006 Data and Monitoring Workshop to the attendees. WPRFMC photo.
6. COMPLYING WITH THE 2007 REAUTHORIZED ACT—ANNUAL CATCH LIMITS FOR ALL
In 2007, the MSA was reauthorized fisheries through the establishment of as the old adage says, “The more things
with an overarching goal to end over the Marine Recreational Information change, the more things stay the same.”
fishing and rebuild overfished stocks. Program (MRIP) to provide statistical
The focus of federal fisheries manage estimates of the recreational catch “The more things change,
ment shifted to stock sustainability in the nation. Another big program the more things
and required ACLs and accountability introduced in the 2007 reauthorization
measures (AMs) for all federally managed was catch shares, which is a market-
stay the same.”
fisheries. This obligation put the onus based management system that allocates Without significant investment in
on data collection systems to be robust the catch limit to fishery participants. improving the data collection systems
to meet the scientific standards for stock The management needs for fishery to keep up with the increasing
assessments and real-time management data had increased significantly from sophistication of the federal fishery
measures to prevent and end overfishing. enactment of the MSA in 1976 to its management system, the region was
The 2007 reauthorization also made reauthorization 31 years later in 2007. left with making the most of what
sweeping changes to the role of science The rate of change in the information it had, not only in funding but also in
in fisheries management. Scientific requirements for federal fishery manage the capacity of the local agencies to
products were subject to peer-review, ment outpaced the slow evolution of do the work. Constant staff turn-overs
and the responsibilities of the Council’s the data collection due to lack of sup and the need for WPacFIN Central
Scientific and Statistical Committee port. The efforts to improve the data to train new staff kept the system at
(SSC) were enhanced to include this, collection system had still not satisfac status quo. During this time, more
including the review of data. torily produced fishery-dependent data federal interventions through short-
The 2007 reauthorized MSA also to satisfy the management needs for the and medium-term fixes started to come
reflected renewed interest in recreational region. The status quo seemed to be, into fruition.
96.1 Pacific Island Biosampling the Guam Fishermen’s Cooperative extraction, sampling protocols, pro
Workshop (2009) Association would end in 2009 and cessing and handling biosamples, and
that the hope was for a regional data logging.
At the 144th meeting of the Council
biosampling program to continue The regional biosampling workshop
in March in American Samoa, the
that effort. While CNMI DFW and provided PIFSC with the impetus
Council’s Bottomfish Plan Team
American Samoa DMWR each had to create a coordinated biosampling
reported the need to conduct life
its own life history program geared program, the Pacific Island
history work on bottomfish. In response,
towards processing samples, neither Commercial Fishery Biosampling
the Council asked PIFSC to establish
could procure the needed samples. Program, utilizing Enhanced Stock
a program to collect otoliths from
A regional biosampling program could Assessment Program funds.
bottomfish around American Samoa
bridge that gap as well. The Commercial Fishery BioSampling
to get basic age and growth informa
The workshop was held at the Guam Program has two components. The
tion. PIFSC, through WPacFIN
Fisherman’s Cooperative Association first is sampling for fishery dependent
Central and the PIFSC Life History
in August 2009 and included biologists data led by WPacFIN Central. This
Program lab,5 worked with the Council
from the American Samoa, Guam, collected length and weight informa
to organize the Pacific Island Biosam
CNMI and Hawai‘i fishery management tion to generate conversion coefficients.
pling Workshop. The workshop plan
agencies and local fishing community WPacFIN developed the data entry
was presented to the FDCC at its July
members (figs. 10a–g). Led by Megan and data summarization software for
2009 meeting in Kona. It was noted
Sundberg and Karen Underkoffler the territory agencies and third-party
that the biosampling contract with the
of the PIFSC Aiea Lab, the workshop contractors. The second component
Richard Seman in collaboration with
provided training in otolith and gonad is the life history sampling by the
5. Prior to PIFSC, NMFS life history work was undertaken by Ed DeMartini through the Honolulu Lab’s Insular Ecology Program.
Regional BioSampling Workshop August 11–12, 2009, Guam
c
a b Figs. 10. a) A workshop participant is trained
to properly log life history data; b) Megan
Sundberg demonstrates otolith extraction
from an onaga; c) Workshop participants
extract otoliths from fish heads; d) Karen
Underkoffler shows otolith rings against
the sunlight; e) Close-up of otolith removal
from a fish sample; f) Gonad sample from
opakapaka; and g) Participants of the Pacific
Island Biosampling Workshop held August
2009 in Guam.
d e
f g
10PIFSC Life History Program, run by overarching theme was the need for augment ACLs, and 4) considering
Robert Humphreys Jr. During his additional human and funding the removal of rare species and those
involvement with the Council’s high resources in the region if the Council predominantly caught in state/territo
school summer course, which has were to address the ACL mandates by rial waters a management unit species.
run annually since 2006, Humphreys 2011 and to consider catch shares in More importantly, the workshop
demonstrated otolith extraction future management. advised the Councils to improve
and ring counting and the sampling data collection and life history data
of seamount groundfish, which 6.3 Workshop on Establishing (WPRFMC 2011).
exposed the need to expand the life Annual Catch Limits for Coral
history sampling to other federally Reef Fisheries (2011) “Use simplistic approach
managed species. The species’ The coral reef ecosystem fisheries for data limited situation.”
biological information is one of the are the classic example of a data-limited
three legs of stock assessments along situation. The fisheries are as diverse The Council was under pressure
with catch from fishery-dependent as the species harvested. Species-level to complete the ACL specification for
data collection and abundance from catch and effort information is available all of the management unit species
fishery-independent surveys. for only a very few species. Life history in the four FEPs by 2012. The main
In 2011, PIFSC began hiring data is scarce, and abundance data is Hawaiian Island Deep 7 bottomfish
staff and implementing contracts available only from 0 to 30 meters. complex was the only non-pelagic
in each territory to collect, measure These shortcomings presented signifi fishery to have a stock assessment. Since
and ship biosamples to Hawai‘i. The cant challenges for developing assess there was no stock assessment for coral
Council provided additional funding ments on thousands of species in the reef species, the Council worked with
support to fill in the manpower Council’s FEPs. The data-limited nature its SSC and coordinated with PIFSC
gaps in Guam and the CNMI. of coral reef fisheries was not unique to to apply the average catch approach to
the WPR; it also occurred and conti family-level groupings to set acceptable
6.2 Regional Fishery Data biological catches. The Council,
nues to occur in the Caribbean, Gulf
Workshop (2009) of Mexico and South Atlantic regions. through the Cooperative Agreement
In November 2009, the Council The Council convened the Coral Reef with the Coral Reef Conservation
convened the Western Pacific Region Fisheries ACL Workshop in February Program (CRCP), partnered with
Fishery Data Workshop. Its primary 2011. Participants included representa Hawaii Pacific University to develop
objective was to examine data gaps tives from fishery management agencies, stock assessments for federally managed
that could prevent the Council from NMFS, researchers from the Universities coral reef species, to address data
meeting the mandates of the 2007 of Miami and Puerto Rico, and staff methodologies and to explore the
reauthorized MSA, particularly ACLs members from the Caribbean, Gulf of utility of the data-limited methods
and AMs, and to consider catch shares. Mexico and South Atlantic Councils. to specifying harvest limits for ACL
The workshop developed an inventory The workshop’s goal was to specification purposes (Table 2).
of the different monitoring and research determine the underlying issues in As the Council progressed on
conducted in the WPR. Participants implementing ACLs and AMs for data developing stock assessments and
gauged whether the quality of the limited coral reef fisheries. Given the methodologies for the data-limited
data collected was robust enough to lack of available data, the workshop fisheries, the PIFSC Stock Assessment
generate MSY and identified data gaps was to provide advice to the RFMCs Program ramped up its assessments,
in catch, effort, life history and assess on what types of assessments could be expanding beyond the Deep 7 bottom
ments (WPRFMC 2009). used and the control rules that could fish. Between 2015 and 2017, PIFSC
The regional workshop highlighted be applied to specify ACLs. generated species-level reef fish stock
the research conducted by the territo The workshop served as an informa assessments for 27 main Hawaiian
rial agencies to provide information tion exchange among the regions on Island species (Nadon 2017) and 12
for stock assessments and defined how each planned to implement ACLs Guam species (Nadon 2019) using the
priority species for ACL management. and AMs. The data-limited situation length-based spawning potential ratio
Many of the data gaps identified in the constrained the ability to develop approach (Nadon et al. 2015).
workshop could be traced back to the CPUE-based assessments. Many of the
earlier workshops, indicating that the acceptable biological catch control rules 6.4 Hawai‘i Non-Commercial
on-the-ground data collection had not used were from data limited methods Data Workshop (2011)
evolved much. The technology for data and average catch approaches. The The 2007 reauthorization included
entry and reporting may have evolved, workshop advised 1) using a simplistic establishment of a National Saltwater
but the basic data collection remained approach for data-limited fisheries; Angler Registry and improvements
antiquated. 2) conducting an inventory of data and to the Marine Recreational Fishery
Altogether 28 recommendations life history information; 3) utilizing Statistics Survey. To facilitate these
emerged from the workshop. The existing management measures to improvements recommended by the
11Table 2: List of stock assessment work to acquire information needed for Subsequently, the State of Hawai‘i
ACL management. opted to not seek an exemption from
the national registry and instead to
REFERENCE PROJECT pursue improving the HMRFS survey
Thomas 2011 Kona Crab Assessment and conducting MRIP pilot projects
Walker et al. 2012 Estimation of the Noncommercial Catch in the WPR for a possible fisherman certification
program. Hawai‘i is still struggling
Thomas 2013 Guam Reef Fish Productivity and Susceptibility Analysis
with getting a good handle on the
Pardee 2014a Hawai‘i Parrotfish Assessment noncommercial universe.
Pardee 2014b CNMI Reef Fish Productivity and Susceptibility Analysis
Maciasz 2014 Hawai‘i Kumu Assessment 6.5 Data Collection Improvement
Sabater and Kleiber 2014 Augmented Catch-MSY Approach to Fishery .
Workshop
Management in Coral-Associated Fisheries The Coral Reef Fisheries ACL
Pardee 2015a Am. Samoa Reef Fish Productivity and . Workshop highlighted the lack of data
Susceptibility Analysis to support proper implementation of
Pardee 2015b Estimating Sustainable Yields for Data Limited .
the MSA ACL requirement and the
Coral Reef Fishery in CNMI need for action to address those gaps.
There was a general recognition that
Pardee 2016a Feasibility Study for Age-based Stock Assessment .
for the Main Hawaiian Island Deep 7 Bottomfish WPR fisheries remained in a data-limited
situation despite numerous attempts
Martell 2015 An Integrated Catch-MSY Model for Data-Poor Stocks
to improve the region’s data collection
Rudd and Martell 2016 Updates to the Age-Structured, Integrated Catch-MSY . system. On Dec. 13–15, 2011, the
Assessment Approach Council convened the Workshop on
Remington and Field 2016 Evaluating Biological Reference Points and . Improving Fishery Data Collection
Data-Limited Methods in Western Pacific Reef Fisheries in the Western Pacific to address the
Remington 2018 Evaluating Biological Reference Points and . root issues and challenges that caused
Data-Limited Methods in Commercial Reef Fisheries of . the data limited situation to persist.
the Main Hawaiian Islands This workshop recognized the lack of
Kent 2017 Testing the Feasibility of a Catch Projection . concrete steps to attain data collection
Methodology and Enhancement of Monitoring of the . improvements (WPRFMC 2012). While
Coral Reef Fisheries of the WPR needs were identified in previous work
Pardee 2016b Data Limited Assessments of American Samoa . shops, the resulting plans did not specify
Coral Reef Fishery tangible steps to address the needs.
Pardee 2017a Initial Stock Assessment of the Hawai‘i Palani . The December workshop would
(Acanthurus dussumieri) Fishery rectify this by identifying agencies to
Pardee 2017b Assessment of the Hawai‘i White Ulua Fishery commit to specified tasks and the grants
Rudd 2019 Evaluating Options for Assessment and Management .
that would fund the activities. Problems
of Coral Reef Fish were categorized as institutional,
community, sampling, regulatory and
interagency relationships. The priori
National Research Council, NMFS Some projects, like HMRFS, were tized issues were examined in detail,
established MRIP to provide national conducted regularly with support from and solutions with appropriate on-the-
estimates of recreational catch. both the State and MRIP. Federal ground steps to attain them were
On Dec. 7, 2011, the Council regulations required noncommercial identified. The cost and timeline of the
convened the Hawai‘i Noncommercial permit and reporting for bottomfish. solutions were estimated. Identified
Data Collection Workshop. The objec Other projects were intermittent depend issues were prioritized according to
tives of this workshop were to 1) develop ing on funding, such as Hawai‘i socio importance, impact on data quality
regional priorities and proposals for economic surveys and pilot projects to and quantity, and attainability of the
funding (through MRIP and other estimate the noncommercial participants potential solutions. Leaders of the
sources) to ascertain the noncommercial in Hawai‘i. local fishery management agencies who
universe; 2) determine the noncommer The workshop had three recommen participated in the workshop expressed
cial component of Hawai‘i fisheries, and dations: 1) develop a regionally based their commitment and support to
3) collect data from noncommercial survey to qualify for an exemption to improving the data collection in their
fisheries in Hawai‘i. the National Saltwater Angler Registry; respective jurisdictions. The federal
Participants presented their agency’s 2) determine the weakness of HMRFS partners—the Council, PIFSC
efforts in collecting and reporting on and determine what is needed to fix the and U.S. Fish and Wildlife Service
noncommercial fisheries estimates. issue; and 3) determine the primary goal (USFWS)— also expressed their intent
of the noncommercial data collection.
12You can also read