Vulnerability of Major Indian States Due to COVID-19 Spread and Lockdown
←
→
Page content transcription
If your browser does not render page correctly, please read the page content below
IDSK Special Series on COVID-19

                            ❷

Vulnerability of Major Indian States Due to
    COVID-19 Spread and Lockdown

                   Subrata Mukherjee
                   Priyanka Dasgupta
                  Monalisha Chakraborty
                     Gopal Biswas
                   Soumi Mukherjee

                        June 2020

       INSTITUTE OF DEVELOPMENT STUDIES KOLKATA
          DD 27/D, Sector I, Salt Lake, Kolkata 700 064
       Phone : +91 33 2321-3120/21 Fax : +91 33 2321-3119
      E-mail : idsk@idskmail.com, Website: www.idsk.edu.in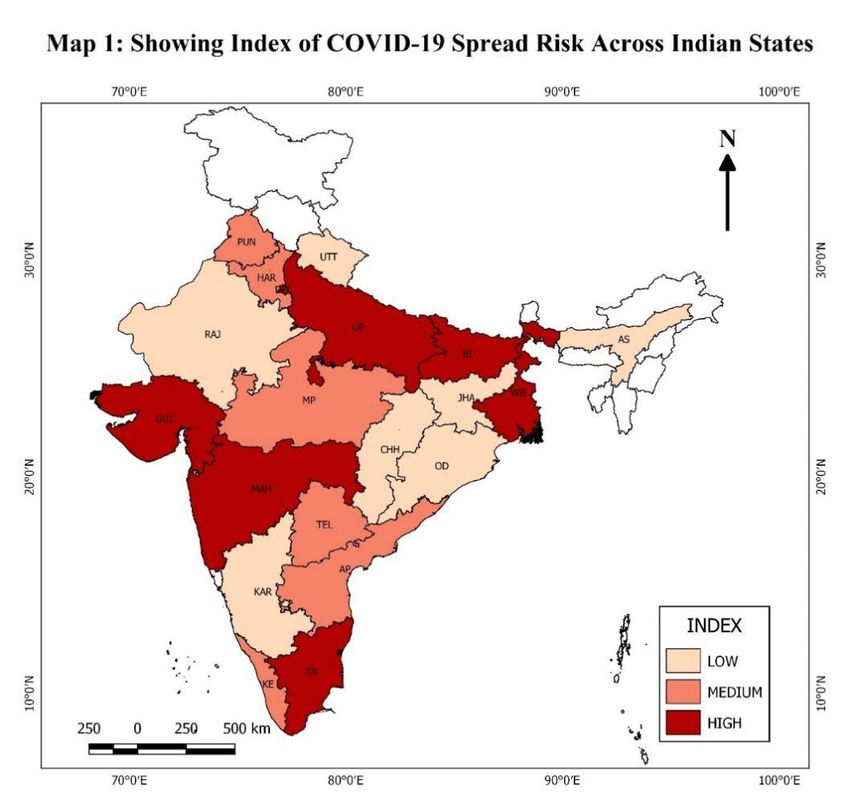
Vulnerability of Major Indian States Due to COVID 19-Spread and
                                                Lockdown

                                            Subrata Mukherjee1
                                            Priyanka Dasgupta2
                                           Monalisha Chakraborty3
                                              Gopal Biswas4
                                            Soumi Mukherjee5

                                                   Abstract
Both the spread of COVID-19 and lockdown announced by the governments to contain the
spread have put an immense challenge to India’s economy, society and health care system.
However, the situation is not uniform across the states of India as they vary enormously from
one another in terms of risk of the disease spread, size of the population vulnerable to COVID-
19, capacity to deal with medical emergency, size of the population economically vulnerable
to lockdown and financial capacity of the state governments to take care of the vulnerable
population in the absence of adequate assistance from the central government. This study, first
attempts to assess the vulnerability of the population due to the possible disease spread; and
then tries to assess four different dimensions of vulnerability caused by nation-wide lockdown.
The four dimensions that have been considered are (i) poverty, (ii) possible disruption of access
to health care for chronic ailments (iii) possible disruption in students’ access to school
education and mid-day meals; and (iv) ills caused by alcoholism and domestic violence. The
major Indian states found to be with higher volume of risky population are Kerala, Andhra
Pradesh, Tamil Nadu, West Bengal, Telangana, Odisha and Punjab. The states which would
probably face relatively greater challenges in dealing with large hospitalisation cases if the
disease is spread to its risky population are Odisha and Madhya Pradesh if their current
institutional medical capacity is not improved significantly. When we consider all four
dimensions of vulnerability, the major states which seem to be more vulnerable due to
lockdown are Bihar, Jharkhand, Odisha, West Bengal and Chhattisgarh as they show higher
index values of three or more dimensions of vulnerability out of the total four dimensions.
These five major states may require concerted efforts by central as well as state governments
to address their problems. The study makes a number of suggestions to deal with the current
crisis and similar crisis in future.

----------------------------------------------------------------------------------------------------------------
1
 Associate Professor, Institute of Development Studies Kolkata, Email: subrata@idsk.edu.in; 2 PhD
Student, Institute of Development Studies Kolkata, Email: pdg0812@gmail.com; 3 PhD Student,
Institute of Development Studies Kolkata, Email: cmonalisa44@yahoo.com; 4 PhD Student, Institute
of Development Studies Kolkata, Email: ami.gopal.biswas@gmail.com; 5 PhD Student, Institute of
Development Studies Kolkata, Email: mukh.soumi@gmail.com

The authors are grateful to Professor Achin Chakraborty for his detailed comments on an earlier draft
of the report.

                                                                                                               1
Introduction
The emergence of COVID-19 caused due to novel corona virus, known as Severe Acute
Respiratory Syndrome-Coronavirus-2 (SARS-CoV-2), has created an unprecedented challenge
for all countries across the world. The first case of COVID-19 was reported in November last
year in Wuhan city of Hubei province in China (Wang et al, 2020; Wu and McGoogan, 2020).
Since then, within a short span of just over 6-7 months, the infection has spread to over 213
countries across the world, with 4,837,361 confirmed cases and 317304 deaths (as on May 18,
2020).1 In India the first case was reported on January 30, 2020 in the south Indian state of
Kerala and first confirmed death due to COVID-19 was reported around second week of March
in another south Indian state, Karnataka.2 Since then infections started growing in India at an
exponential rate like in any other affected countries. The fatality due to COVID-19 also
multiplied but at a much slower speed than many other countries which reported higher disease
spread earlier than India did.

Individual state governments started responding to the situation of disease spread in their
respective states and initiated measures like closing down of educational institutions, advising
citizens to practice measures like washing hands frequently with soaps and wearing masks in
case of sickness. After calling for a nationwide voluntary stay at home advice on March 22,
the prime minister of India announced a total lockdown of the country for three weeks starting
from March 25, 2020. By the time of announcing total lockdown, the number of known
COVID-19 cases increased to 564 with 10 reported deaths. At the end of initially announced
three-week period, lockdown was further extended first till May 3, then till May 17 and May
31 on suggestions from different state governments which were struggling to contain the cases
of new infections from COVID-19.

The nation-wide lockdown, though inevitable from a public health point of view and supported
by experts across disciplines, was a sudden shock to a large section of vulnerable population
which was not much affected by the disease spread and its fatality at the time of lockdown. On
the one hand, the lockdown has imposed multiple challenges on India’s poor, migrants and
socially marginalized groups, chronically ill population, poor students depending only on
school for their education and mid-day meal for their regular nutrition. It has also worsened the

1
 https://www.worldometers.info/coronavirus/countries-where-coronavirus-has-spread/
2
 There is still controversy over the first death due to COVID-19 in India. See https://www.bbc.com/news/world-
asia-india-52343241
                                                                                                            2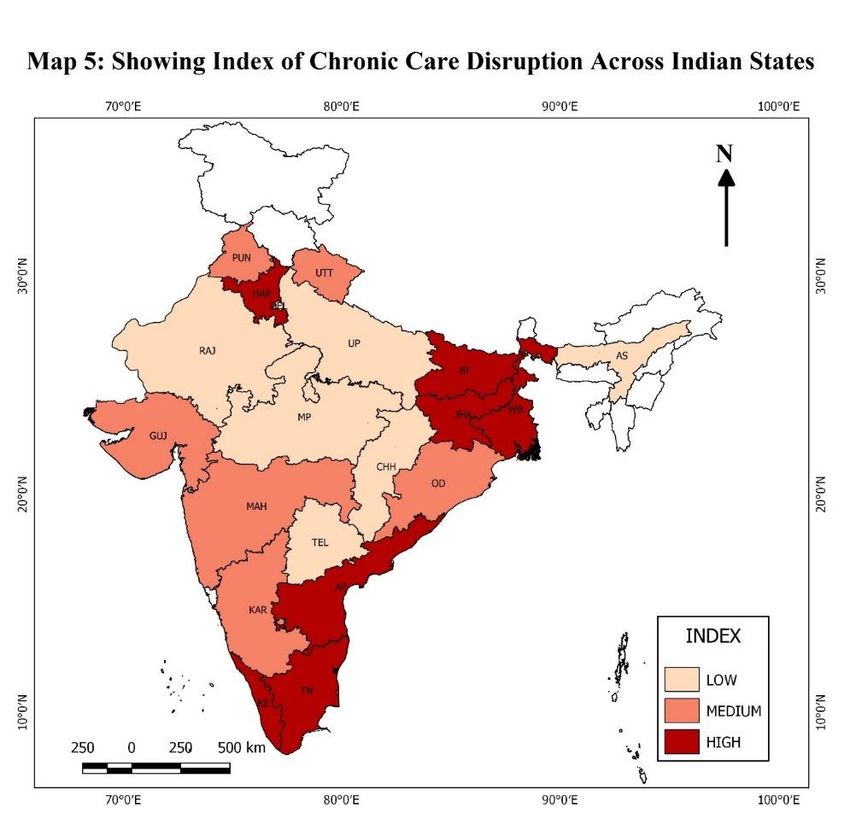
lives of those who regularly face violence at home by their family members. On the other hand,
the actual spread as well as the fear of spread of the disease has brought an immense pressure
on country’s health care system which is grossly inadequate due to poor infrastructure,
inadequate human resources and low overall funding. However, the situation is not uniform
across the states of India. Whereas some of the states are better positioned in terms of lower
burden of affected population and better health infrastructure, conditions of some states,
especially the most populous states are very challenging. The inequality in the burden and
coping up capacities of the states are compounded by varying risks of disease spread.

At this juncture, it may be a useful exercise to assess the vulnerability of major Indian states
arising from the spread of COVID-19 and lockdown to contain the possible spread by using
available information on various aspects of the economy, society and health sector. The
objective of the study, therefore, is twofold. In the first stage, it attempts to assess the
vulnerability of the population because of the possible disease spread by considering
information on current known level of spread, population density and population-subgroups
which might be more vulnerable to the disease. In the second stage, the study tries to assess the
vulnerability of the population with regard to livelihood and income, access to essential health
care services, access to education and school/ICDS- based nutritional programme and social
bad due to alcoholism and domestic violence which are all compounded by lockdown. Both
types of vulnerability can then be compared and contrasted with medical as well as financial
capacities of the states to understand their possible resilience power to face the vulnerability.
The report is organised into the following sections: A section on data and methods briefly
describes the data sources used for the study as well as methods applied. The first empirical
section presents and analyse the risk prospects due to the spread of COVID-19, risky
population, and coping capacity of the states. The next four sections deal with possible effects
of lockdown on the population in terms of (i) livelihood and income; (ii) possible disruption of
chronic health care need; (iii) possible disruption in school education and nutritional
programme; and (iv) social bad due to alcoholism and domestic violence. The last section
summarises the discussion and highlights a few policy lessons.

Data Sources and Methods
This study uses multiple data sources for assessing different dimensions of vulnerability caused
both by the spread of COVID-19 and lockdown imposed by various state governments as well

                                                                                                3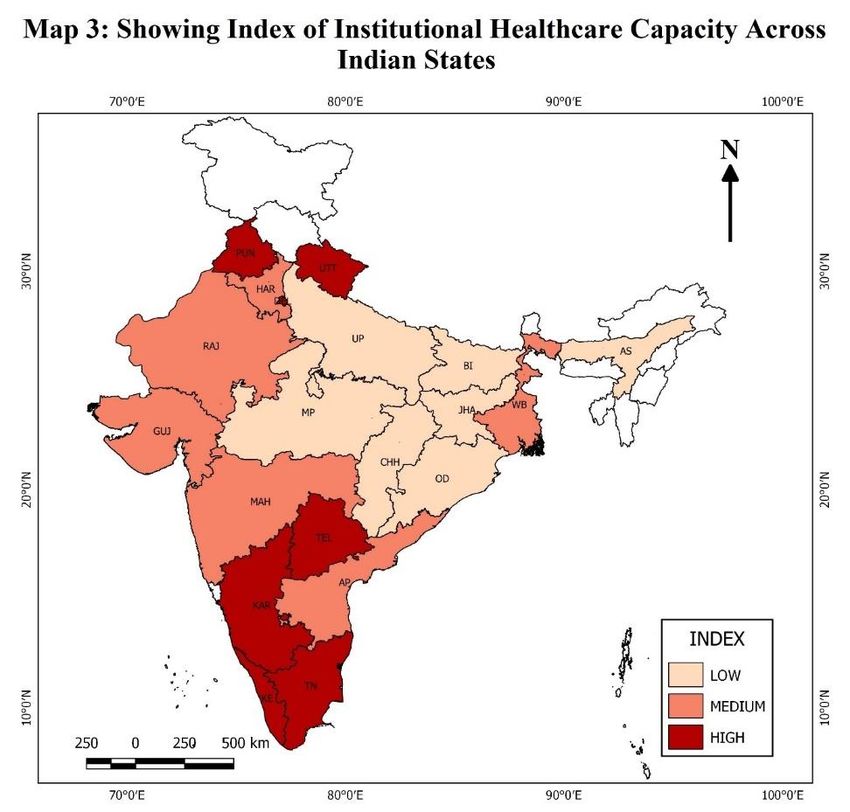
as the central government in India to contain the disease spread. The data sources used for the
analysis are the following: Ministry of Health and Family Welfare, a non-government COVID-
19 tracking site, Census 2011, National Family Health Survey (NFHS) 4 (2015-16) unit record
data, National Sample Survey (NSS) 75th round unit record data (2017-18) for Education and
Health, NSSO’s Periodic Labour Force Survey (2017-18) unit-record data, Reserve Bank of
India, Central Bureau of Health Intelligence, CSO database and IndiaStat.com. In addition, we
have used information from numerous articles appeared in online news portals and newspapers.

Data on COVID 19
There are two main sources of information on state and national level COVID-19 cases. They
are Ministry of Health and Family Welfare (https://mohfw.gov.in/) and COVID19INDIA
(https://covid19india.org).3 We have used data on total confirmed cases from the government
sources. Though the Ministry of Health and Family Welfare (MoHFW) website updates the
data on covid-19 cases at scheduled times (mostly twice a day), https://covid19india.org
updates its database of covid-19 cases throughout the day by drawing information from state
press bulletins, official (Chief Minister, Health Minister) handles, Press Trust of India, ANI
news reports.

Census and Projected Population Data
The Census of India which comes under Office of the Registrar General and Census
Commissioner (Ministry of Home Affairs, Government of India), collects and provides
information on demographic and socio-economic characteristics of population at the lowest
administrative unit (i.e. each revenue village and town and ward of a district). The population
census takes place every 10 years. From Census 2011, we have used data on marginal workers
and agricultural labourers for each major state. We have used the projected population data for
2020 to normalise some indicators to make them comparable across the states. The projected
population has been taken from Population Projections for India and States 2011 – 2036:
Report of the Technical Group on Population Projections, published by the National
Commission on Population, Ministry of Health and Family Welfare, Government of India
(National Commission on Population, 2019).4

3
 The numbers of known cases from both the data sources show very strong correlation.
4
 The projected population figures for 2020 have been estimated by applying the Component Method, which is a
universally accepted method. In population projections, the growth of population is determined by fertility,
mortality and migration rates.
                                                                                                           4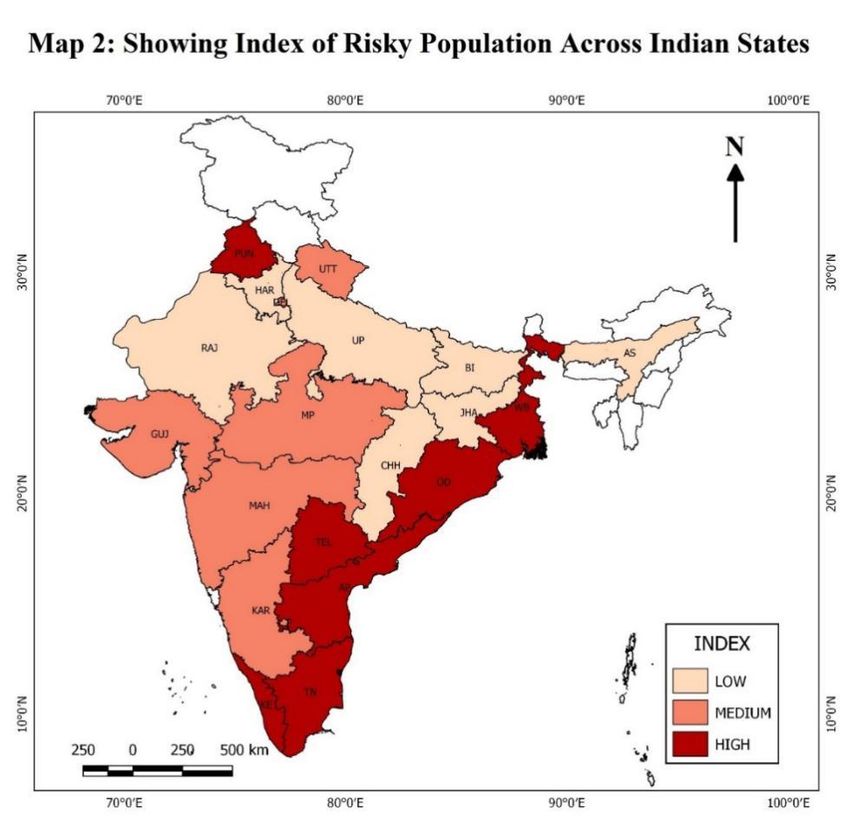
NSS Health Data
The NSS 75th round on Health was conducted during July 2017 to June 2018. The survey
collected data from 5,55,114 individuals residing in 1,13,823 households (rural and urban
combined). The survey covered entire India except for those villages of Andaman and Nicobar
Islands which were difficult to access. A stratified multi-stage sampling was used. In the rural
sector, the first stage units were the census villages (panchayat wards in Kerala) while in the
urban sector, they were the urban frame survey blocks. The final stage sampling units were the
households. The survey collected information on basic household characteristics, demographic
characteristics of the household members and particulars of ailments and healthcare utilization
with appropriate recall periods.

NFHS Data
NFHS 4 was conducted during 2015-16 and covered 29 states and 6 union territories. NFHS 4
collected data for men belonging to 15 to 54 years of age, ever married women of 15 to 49
years of age, and children of below 5 years of age. It provides information on basic household
characteristics, demographic characteristics of the household members, morbidity, women and
men’s background characteristics and domestic violence. The survey collected data from
699,686 eligible women (15-49 years age) and 112,122 men (15-54 years age) belonging to
601,509 households. In order to analyse the population at risk due to coronavirus (COVID-19)
outbreak, we have considered the percentage of men (15-54 years age) and ever married women
(15-49 years age) currently reporting cancer, diabetes, asthma and heart disease. In order to
analyse the social effects of lockdown, we have considered information on men reporting
regular drinking of alcohol and women reporting domestic violence by their husband or partner.

NSS Education Data
The NSS 75th round on Education was conducted during 1st July 2017 to 30th June 2018. The
main objective of the survey was to build indicators on participation of the persons of age 3 to
35 years in the education system, expenditure incurred on education of the household members
and various indicators of those currently not attending any educational institution (i.e., for the
persons who never enrolled or ever enrolled but currently not attending). Besides, for persons
of age 5 years and above, information was collected on ability to operate computer, ability to
use internet and use of internet during the last 30 days. In addition, particulars of current
attendance and related expenditure of the households in respect of the erstwhile members of

                                                                                                 5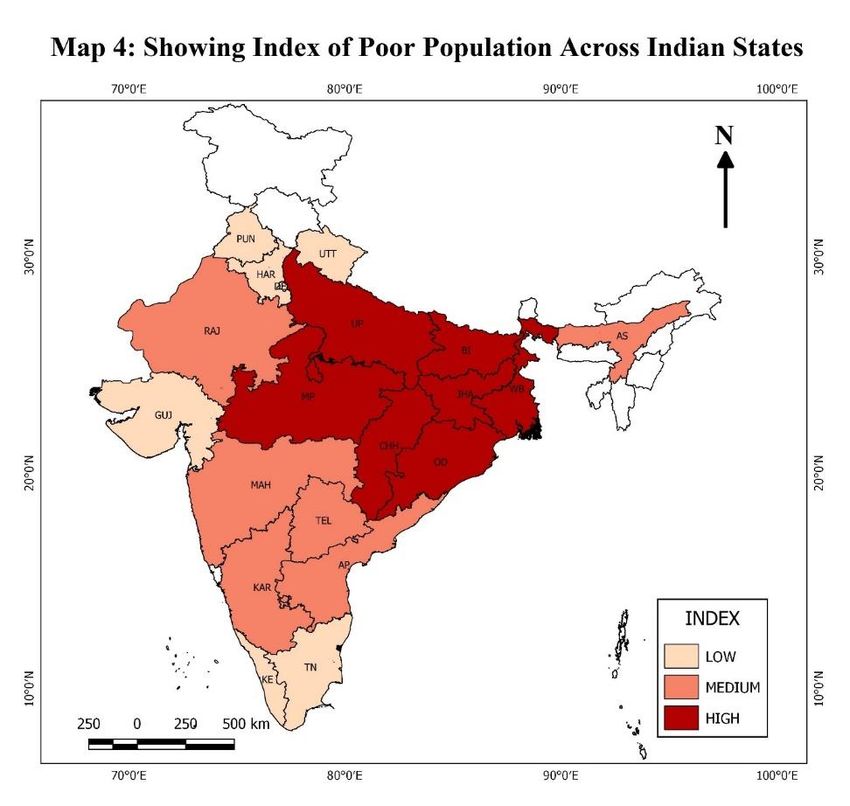
age 3 to 35 years were also collected. The survey covered both qualitative and quantitative
aspects related to educational attainment of the household members and educational services
used by them covering whole of the country except the villages in Andaman and Nicobar
Islands which are difficult to access. Like the health survey, a stratified multi-stage design was
adopted. The survey was spread over 14,285 FSUs (8,097 villages in rural areas and 6,188
Urban Frame Survey Blocks in urban areas) covering 1,13,757 households (64,519 in rural
areas and 49,238 in urban areas) and enumerating 5,13,366 persons (3,05,904 in rural areas and
2,07,462 in urban areas). In this survey, the total number of persons of age 3 to 35 years
surveyed was 2,86,456 (1,73,397 in rural areas and 1,13,059 in urban areas).

Other Data
The GSDP values for 2018-19 at current prices have been taken from the Central Statistical
Office (CSO) database. The value of GDP for India has been taken from Economic Survey
2019-2020. The GSDP value for Maharashtra has been taken from the Economic Survey of
Maharashtra 2019-20. The NSDP per capita for 2017-18 at current prices have been compiled
from the Handbook of Statistics on Indian States 2019, which is published by the Reserve Bank
of India annually. The Projected Tax-GSDP ratios have been taken from www.indiastat.com
which is owned by Datanet India and provides ready to use complied data of secondary level
socio-economic variables and other statistical information about India and its states and
districts. The corresponding tax revenues for the states have been estimated from GSDP and
Projected Tax-GSDP ratio. The data on government hospital beds have been taken from the
Central Bureau of Health Intelligence (CBHI) which collects primary as well as secondary data
on various communicable and non-communicable diseases, human resources in health sector
and health infrastructure from various Government organizations and departments to provide
Heath Statistics through its annual publication ‘National Health Profile (NHP)’. The data for
the study has been taken from National Health Profile 2019. The total number of hospital beds
has been achieved by adding the total number of government hospital beds with the ESI
hospital beds across states.

Methods
Our empirical analysis and descriptions are divided into two parts. The first part tries to assess
the possible risk of disease spread across major Indian states by combining known cases of
COVID-19 (till the date of analysis) and population density; it then assesses the volume of

                                                                                                 6
risky population by considering age composition and prevalence of chronic conditions which
are known to increase the risk of COVID-19. The second part of the analysis assesses the
possible impact of lockdown on population – the poor, chronically ill, students and
beneficiaries of mid-day meals; and women who are vulnerable to abuse by their husbands. In
other words, to assess the possible impact of lockdown on the population, we have considered
four dimensions: poverty, disruption of chronic care, disruption of school education (including
mid-day meal) and social bad (which includes alcoholism and domestic violence). For
assessing the possible situation under each dimension, we have used multiple indicators. For
each indicator, the values across the major states are normalised by subtracting minimum value
and then dividing by the range of values. This way of normalising the indicator creates a range
between 0 and 1 or 0 and 100 when multiplied by 100.5 Composite index for a particular
dimension is constructed by simple average of individual index values. For each dimension, a
composite index is also constructed using the principal component analysis (considering the
first component) and correlation coefficient is computed for validating our constructed
composite index. As graphical tools, scatter plots and maps are used to explore the association
and ranking of major Indian states respectively.
Risk prospect, risky population, and coping capacity of the states
It is difficult to precisely assess the risk of COVID-19 spread for any state (or union territory)
for a number of reasons. Whereas, strict implementation of lockdown reduces the scope for
further spread, in the absence of enough testing the number of individuals who are actually
infected in a given point of time remain unknown. Moreover, the long incubation period and a
large percentage of asymptomatic cases of COVID-19 allow infected individuals to spread the
virus to others without their knowledge. However, in the absence of large-scale testing, the
number of known (tested) cases provides us best available idea about the possible risks. The
states with higher number of known cases have larger risk of spreading the virus to their
population if infected persons are not identified, their contacts are not tracked down and all
tracked down persons are not isolated as soon as possible. The higher population density may
work as a catalyst for spreading the virus. In India, the first case of COVID-19 was reported in
Kerala, since then it is increasing rapidly. As of May 19, 2020 (8.00 AM), India has 101,139
confirmed cases, 39,174 recovered (including discharged) and 3163 deaths.6 Though, the first
5
For any indicator I for a state i, (Ii), index of Ii is defined as (Ii – min(I))*100/(max(I) -min(I))
6
Accessed from https://www.mygov.in/covid-19 on May 19, 2020, 11.00 pm.
7case of Covid-19 was reported in Kerala, at present Maharashtra is the worst affected state with
the highest number of confirmed cases (35058) followed by Tamil Nadu (11760), Gujarat
(11745) and Delhi (10054).
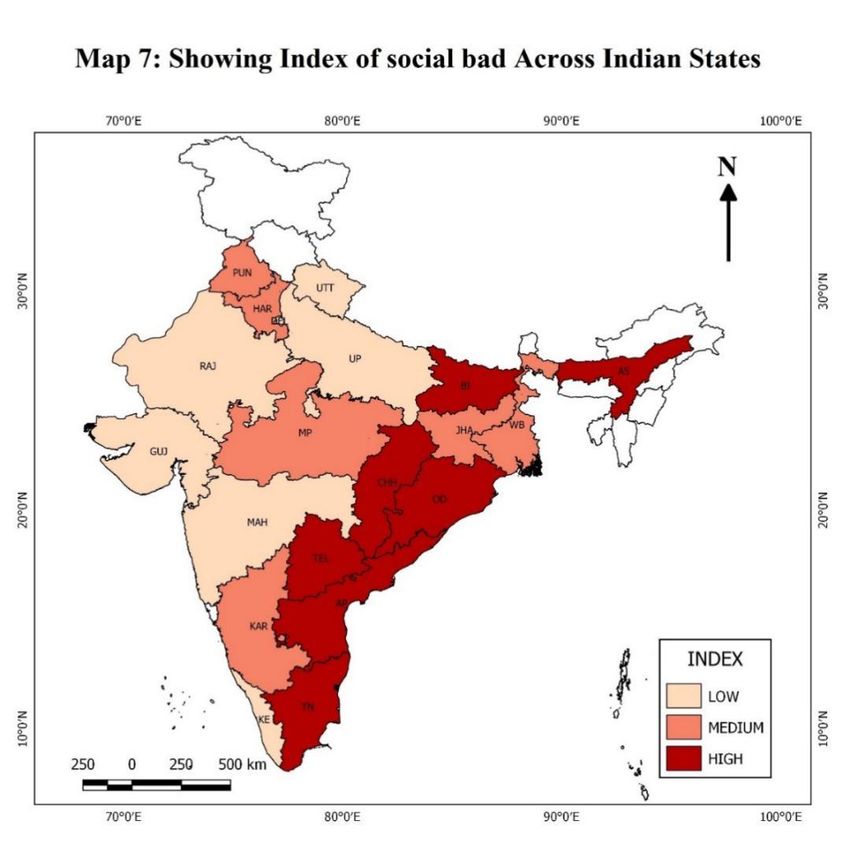
Table 1 shows the number of confirmed cases of COVID-19 and population density (persons
per square kilometres) for the major Indian states. The same table also shows the index values
constructed from confirmed cases of COVID-19 (until May 3, 2020) and population density
and a composite index constructed through a geometric mean formula. The overall risk index
shows that top five states with very high risk of COVID-19 spread (as on May 3, 2020) were
Delhi, Maharashtra, Uttar Pradesh, Tamil Nadu and West Bengal. Though Kerala has been
remarkably successful in bringing its new COVID-19 cases under control, because of its high
population density it may still be considered as a state with high risk of spread. The same table
shows that though Maharashtra has the highest number of known cases, the risk may be higher
for Delhi because of its high population density. However, it must also be noted that the
COVID-19 cases detected in Maharashtra are also from high population density districts like
Mumbai and Pune. A scatter plot showing the known number of COVID-19 cases (up to May
3, 2020) and population density is presented in Figure 1. The scatter plot excludes Maharashtra
and Delhi which are already identified states with high risk of spread. The scatter shows that
both Tamil Nadu and Uttar Pradesh have high risk of possible spread. There are a number of
states which stay behind Delhi, Maharashtra, Uttar Pradesh and Tamil Nadu. These states are
Gujarat, Kerala, Madhya Pradesh, West Bengal and Rajasthan. The states like Bihar, West
Bengal and Kerala, though having lesser known cases of COVID-19 need special monitoring
as they can become vulnerable to further spread after the lockdown given their high population
density.
Risky Population
The first and foremost important aspect that we consider for a state is the volume of potentially
risky population. Generally, the states with larger population are expected to have larger
volume of population potentially risky to possible COVID-19 infection. However, there are
two important aspects of a state population that we need to consider: first the number of elderly
persons (say, 60 years and above) and number of people with underlying conditions i.e. those
suffering from chronic ailments like diabetes, hypertension, heart disease, kidney disease and
8lung disease. These are the diseases which enhance the risk of a person if he/she is infected
with COVID-19(World Health Organization, Situation report-51, 2020).7
The elderly population is more vulnerable to infectious diseases as they do not have a strong
immune system. Moreover, they are more likely to have critical conditions such as heart
disease, lung disease, diabetes or kidney disease, which weaken their body’s ability to fight
infectious diseases (World Economic Forum, 2020). Keeping this in mind, we have identified
the risky population across states by considering elderly population (aged 60 years and above)
and population having select chronic ailments/diseases.8
Even in the absence of COVID-19, a few chronic non-communicable diseases (CNDs)
contribute a large part of avoidable deaths among the adult population. Heart diseases and
strokes are considered among the top reasons for deaths in India. The number of patients with
cardiovascular disease increased from 2.57 crore in 1990 to 5.45 crore in 2016 implying more
than 50 per cent in a duration of 25 years with the highest prevalence in Kerala, Punjab and
Tamil Nadu.9 Chronic Obstructive Pulmonary Disease (COPD) was found to be the second
strongest cause of death in India after heart disease is COPD, killing 9.58 lakh people in
2017.10
Table 2 presents a composite index of risky population across the major Indian states which is
a simple average of individual index values constructed from four indicators presented in the
same table.11 The table shows that Kerala is the state having the highest index value of risky
population (98.4), followed by Andhra Pradesh (73.7), Tamil Nadu (67.0), West Bengal (49.1)
7
According to World Health Organization, novel coronavirus shows serious manifestations among elderly (aged
60 and above) and people with chronic conditions i.e. diabetes, cardiovascular disease, kidney disease, and lung
diseases like asthma and chronic pulmonary obstructive disorder (COPD)(World Health Organization, situation
Report-51, 2020).
8
We use two data sources for estimating the prevalence of select chronic ailments. NFHS 4 data provides us
prevalence of diabetes, heart disease and asthma for males (15 to 54 years age group) and females (15-49 years
age group). NSS 75th round data allows us to estimate prevalence of diabetes, cardiovascular, respiratory ailments
for age group 50 years and above.
9
https://www.downtoearth.org.in/news/health/heart-disease-stroke-among-top-killers-in-india-61602. In the
news article they quote a study published in The Lancet by India State-Level Disease Burden Initiative CVD
Collaborators
10
https://www.business-standard.com/article/health/copd-what-we-know-about-the-disease-that-killed-a-
million-indians-in-2017-119030400121_1.html. The news article reports Global Burden of Disease Study, 2018.
According to the International Diabetes Foundation’s Diabetes Atlas, India has the second highest number of
diabetes patients (estimated 7.7 crore) of 20-79 years age in 2019.
11
A separate index constructed using principal component analysis (first component) shows 0.9976 correlation
with our composite index.
9and Telangana (46.6). When we compared index values of the risky population and index value of the risk of spread, Tamil Nadu turns out to be a case for concern – a state with higher index values of risk of spread as well as risky population (Figure 2). The two other states that one should equally be concerned with after Tamil Nadu are Kerala and Maharashtra. Whereas Maharashtra is a state with high risk of spread but lesser risky population, Kerala is a state with lower risk of spread but higher volume of risky population. Just behind Tamil Nadu, Kerala and Maharashtra, there are a few states not much behind in terms of risk of spread-risky population combinations. These states are Andhra Pradesh, West Bengal and Uttar Pradesh.
indicator is to calculate the average number of beds per lakh population. In this case, higher
the number of persons per hospital bed, better is the state’s institutional capacity to deal with
hospitalisation.

To assess how the states are currently equipped with their health sector capacities to address
any forthcoming challenges due to COVID 19, we need to consider the public sector as well as
the private sector. There is no reliable and consistent data on the strength of private health
sector for most of the states. The Central Bureau of Health Intelligence provides us data on
only government hospital beds. The latest National Sample Survey (75th round: 2017-18)
provides us estimates of hospitalisation that are taking place in the public hospitals as well as
private hospitals. In the absence of any data on the number of hospital beds in the private
sector, we assume that the ratio between number of beds in government and in private hospitals
are the same as the ratio between the numbers of hospitalisation in government and private
hospitals.13 In Table 3, in addition to population per government hospital bed, average number
of government hospital beds per lakh population, predicted number of private hospital beds per
lakh population and predicted number of hospital beds (government and private together) per
lakh population are presented. The beds per lakh population figures give us a rough idea about
the current strength of institutional capacity of health sector to handle hospitalisations. If we
only consider the government hospital beds, then three south Indian states Kerala, Karnataka
and Tamil Nadu lead the list of major Indian states. However, if we consider the predicted size
of the private inpatient care sector, it gives us a slightly different picture. Kerala and Karnataka
remain the major Indian states with very high hospital beds per lakh population, but Tamil
Nadu (which indicates a high risk of spread and high risky population combination) lags
behind. The states like Maharashtra, Uttar Pradesh, West Bengal, Andhra Pradesh and
Telangana seem to lack adequate capacity to handle large volume of hospitalisation. There is
an important caveat here. Higher availability of hospital beds does not necessarily imply that
they are better equipped for treating COVID-19 patients because availability of ventilator is an
important aspect of medical capacity to deal with severe form of COVID-19. Newspaper report
suggests that there are about 8,432 ventilators in government hospitals across the country
(Deccan Herald, March 30, 2020).

13
  This is a crude assumption. Generally, government hospitals often operate with near full or even excess capacity,
whereas private hospitals may operate below full capacity. Moreover, the bed-turnover rates may be different for
the government and private hospitals with an average hospital beds serving more patients in a given year.
                                                                                                                11
The last column of Table 3 presents the index values of the states’ institutional capacity to
handle the required volume of hospitalisation. The index values of the states’ institutional
capacity are presented in Map 3. The map clearly shows that only the south Indian states have
relatively higher institutional capacity to handle large numbers of hospitalisation.
Figure 3 plots the index of institutional health capacity against the index of risky population.
The horizontal and vertical lines drawn at the median values of both the indices divide the
scatter into four quadrants. Whether a state has lower or higher medical capacity relative to its
volume of risky population can roughly be identified by looking at which quadrant a particular
state lies. States with higher index value of risky population but lower index value of
institutional health care capacity can be a matter of concern as they indicate lower health care
capacity relative to its their population. Odisha and Madhya Pradesh fall in that list of states.
Lockdown and the Poor
We do not have any recent data on the extent of poverty or poor population from a large survey
for the major Indian states. The 2017-18 survey on consumption expenditure by the National
Sample Survey Office was not released. In the absence of consumption expenditure data, we
use consumption expenditure figures from Periodic Labour Force Survey (PLFS) of 2017-18
as one of the indicators for assessing the level of relative poverty. We use the following 7
indicators from Census, erstwhile Planning Commission and National Sample Surveys to
construct an index of income vulnerable population: (1) Percentage of population below the
poverty line (Planning Commission Estimates 2011-12); (2) Percentage of marginal worker in
total population (Census 2011); (3) Percentage of agricultural labourer in total population
(Census 2011); (4) Percentage of population with per capita consumption expenditure less than
India’s median per capita consumption expenditure (PLFS 2017-18); (5) Percentage of
population from self-employed households with per capita consumption expenditure less than
country’s median in total population (PLFS 2017-18); (6) Percentage of population from casual
labour households (PLFS 2017-18) ; (7) Percentage of population from Others household with
per capita consumption expenditure less than country’s median (PLFS 2017-18). The reasons
for taking multiple indicators to assess the extent of income vulnerable population are the
following: First, we do not have any recent estimates of poverty. The last estimates that we
have are from 68th round NSS data (2011-12) and one may argue that the both absolute and
relative situations in the states in the last 8-9 years. Second, migrant workers group forms an
important component of income-vulnerable population in each state, especially in poor states
12(i.e. states with lower per capita income, higher poverty and stagnating employment
opportunities). The volumes of inter-state out-migration from poorer states to relatively richer
states have increased significantly over the last two decades. The states with higher percentage
of poor people, marginal workers and agricultural labourers, such as Jharkhand, Bihar,
Chhattisgarh, Madhya Pradesh, Uttarakhand, Uttar Pradesh, Odisha, West Bengal, are found
among the states with high volume of out-migration in recent decade. In the absence of any
recent state-wise migration data, we assume that these indicators would jointly indicate
volumes of out-migration. Third, the disruptions of most of the economic activities due to lock
down are expected to hit the poor self-employed and casual labour households more than the
regular wage or salaried households. This suggests us to consider poor self-employed, all casual
labourer and poor other households for identifying the vulnerable population. The Indicators
and composite index are presented in Table 4. Figure 4 shows the scatters depicting pairwise
association across indicators.
The states with very high values of poor population index are Bihar, Jharkhand, Odisha,
Chattisgarh, Madhya Pradesh, Uttar Pradesh and West Bengal, Assam (Table 4). These are the
states where living standard of large segments of population are going to be severely affected
by the lockdown unless adequately supported by the governments. Figure 5 and Figure 6
present the index of poor population against index of per capita income (NSDP) and per capita
tax revenue respectively. They may indicate the economy and government’s capacities relative
to the volume of economically vulnerable population they need to support during the lockdown
period. Examining the index of poor population against index of tax revenues is important as a
state’s capacity to take care of its large poor population is constrained by its per capita tax
revenues (Figure 6). The disadvantageous states will perhaps require higher central assistance
to address their problems – supporting the poor population with minimum income during the
period of lockdown.
Lockdown and Disruption of Regular Chronic Care
The lockdown across the country has put a great constraint in accessing all types of non-
emergency health care services to the population. Several newspapers have reported that
COVID-19 has negatively impacted access to many otherwise essential health care services.14
14
There are news coming that COVID 19 has disrupted health care services in rural India and maternal health
care services have been severely curtailed https://www.livemint.com/news/india/how-covid-19-response-
disrupted-health-services-in-rural-india-11587713155817.html
13The outpatient departments of the hospitals are largely closed, and numerous clinics and private
chambers of the doctors are not accessible by majority of the population. It is reasonable to
assume that with no availability of any means of transport, patients who require regular care
are facing severe difficulties. Table 5 shows percentage of chronically ill population and
percentages of population suffering from a chronic disease like Cancer. Though nearly 4 per
cent of our population suffer from chronic ailments (thereby requiring regular health care),
roughly 0.5 per cent of the population above 15 years report cancer (considering two separate
sources of data viz. NFHS and NSS). The patients suffering from cancer and chronic kidney
diseases may require procedures like chemotherapy and dialysis on a regular basis. Since the
health sector is forced to treat the current pandemic with priority, there is legitimate
apprehension that other critical health care (such as chemotherapy, dialysis) needs may be
compromised in the process. There is another dimension to the chronically ill population –
they are also more susceptible to the complications due to COVID-19 in case they are infected
with the virus.
State-wise analysis shows that Kerala has the highest share of chronically ill population (18.15
per cent), followed by Andhra Pradesh (10.41 per cent) and West Bengal (9.01 per cent). The
share of chronically ill persons in a particular state implies the share of population who are
vulnerable to COVID-19 infection. A growing number of clinical studies on COVID-19 shows
that individuals suffering from multiple chronic illnesses are more prone to have severe
symptoms if they are infected with COVID-19 along with a higher probability of death as well
(Remuzzi & Remuzzi 2020; Zhou et al., 2020; Yang et al., 2020). A study conducted in Italy
on 12462 confirmed cases, showed that more than two-thirds of the patients had diabetes,
cardiovascular diseases, or cancer (Remuzzi & Remuzzi 2020). The patients who were severely
ill with COVID-19 had pre-existing cases of hypertension or COPD ailments (Yang et al.,
2020; Guan et al., 2020; Lippi and Henry 2020).
Estimates on the incidence of select chronic ailments from NFHS data shows that 4 - 4.4 per
cent of men and women aged below their mid-50s suffer from any of the three chronic diseases
(viz. diabetes, heart disease, asthma). Estimates from NSS data show that for people aged above
50s, the rate is as high as 11.6 per cent for India with Kerala having the highest burden,
followed by Andhra Pradesh, West Bengal, Punjab, Maharashtra, Gujarat and Tamil Nadu.
Both the data sources suggest that prevalence of cancer, one of the emerging non-
14communicable chronic diseases, is not very low in India. States such as Tamil Nadu, Jharkhand
and Madhya Pradesh dominates in prevalence rates of cancer for the men aged below mid-50s,
while Bihar, Tamil Nadu and Karnataka have higher prevalence rates of cancer for women
aged below 50s. For people aged 50 years and above, Kerala, West Bengal, Uttarakhand,
Haryana, Punjab and Rajasthan exhibit cancer prevalence rate higher than the national
average.15
These figures clearly portray the large segment of our population which require regular care.
However, access to chronic healthcare always pose significant challenges for a large part of
chronically ill population because such services primarily exist in secondary and tertiary
hospitals located in urban areas. The current situation has forced the health sector to prioritise
COVID-19 over other healthcare needs which has affected those requiring regular healthcare
services such as chemotherapy, dialysis, blood transfusions or even life-saving drugs.
Many chronically ill patients are now facing the brunt from multiple sides as they are stranded
without getting essential care. Many of them, who have gone to far-off places for getting
treatment, cannot even return to their homes because of the lockdown. Print and online
newspapers are full of stories about their miseries and helplessness. There are reports in various
credible print and online news portals that cancer patients staying with their relatives in shelters
near the AIIMS in south Delhi require immediate surgeries and treatments. Some of them even
borrowed money on interest for their treatments, paid money to the hospital and did the
paperwork, but treatment seems to be a far-fetched thing, given the closure of all OPD and
speciality services in AIIMS, from March 24th onwards.16 According to a senior oncologist at
Mumbai-based Tata Memorial Hospital, there has also been a sudden dip in the inflow of
patients from other states. Although follow-ups are being done telephonically and via online,
many people do not have the know-how or access to those means.17 The situation is not grim
for the cancer patients only. There are reports that patients requiring dialysis are facing similar
problems due to strict restrictions in mobility and non-availability of transport services,
especially for those without personal vehicles. Even for those who can avail transport, the
dialysis centres are facing staff crunch along with limited and irregular medical supplies such
15
Figures are based on author’s estimations.
16
https://www.thehindu.com/news/cities/Delhi/lesser-patients-in-a-pandemic/article31440359.ece
17
https://economictimes.indiatimes.com/industry/healthcare/biotech/healthcare/covid-outbreak-hinders-cancer-
treatment-in-hospitals/articleshow/75033787.cms
15as dialyser, needles and anticoagulants which are essential for the process.18 Besides, there are
several reports that HIV patients are also not able to reach their local ART centres for
medicines. Those who are on second- and third-line drugs are reported to face more problems
as these medicines are available only in bigger hospitals. They are missing their daily doses
which would probably bring down their immunity and make them more susceptible to getting
co-morbidities like TB.19 There has been several cases where patients and their relatives were
unable to get essential medicines for HIV, cancer and other lifesaving drugs. Even patients
requiring essential diagnostics had to delay their treatment as most of the laboratories are closed
due to lockdown.20
The lockdown has affected the provision of medicines and medical devices to hospitals and
pharmacies. In addition, some of the district administrations in various states/ UTs have also
given directions to close the manufacturing operations in the pharmaceutical and medical
device industry as part of measures to contain the spread of coronavirus.21 The lockdown has
also impacted the volume and frequency of blood donation. With 3321 licensed blood banks,
there already exists a documented imbalance between its demand and availability in the non-
pandemic times which has only aggravated in the present times.22
Though central and different state governments have assured that essential services would
continue to be provided amidst the lockdown, prioritizing COVID-19 cases, given the limited
resources, has certainly compromised the capacity of the health sector to deal with regular
health care services. The central ministry of health issued detailed guidelines on 17th April 2020
regarding non-elective surgery and medical interventions and mentioned various measures
which includes conducting infant check-ups at home and delivering medicines. It also
envisaged that states should ‘ensure uninterrupted availability of dialysis and cancer treatment
services’ and facilitate ‘easy movement of these patients to access care.’23 The reality is
18
https://theprint.in/health/cancer-dialysis-patients-struggle-for-treatment-as-hospitals-are-stretched-by-covid-
19/395097/
19
https://www.aljazeera.com/news/2020/03/india-covid-19-lockdown-hits-hiv-chronic-patients-hard-
200329200022525.html
20
https://www.aljazeera.com/news/2020/03/india-covid-19-lockdown-hits-hiv-chronic-patients-hard-
200329200022525.html)
21
https://economictimes.indiatimes.com/industry/healthcare/biotech/pharmaceuticals/lockdown-resulting-in-
drugs-medical-devices-supply-disruption-industry/articleshow/74810847.cms?from=mdr
22
Ministry of Health and Family Welfare. Lok Sabha Unstarred Question No 4585. Blood bank infrastructure,
20 Mar 2020. Accessed from http://164.100.24.220/loksabhaquestions/annex/173/AU4585.pdf
23
https://www.mohfw.gov.in/pdf/EssentialservicesduringCOVID19updated0411201.pdf
16multiple hospitals located nearby containment zones or in general had to shut their OPD
services and defer surgeries over concerns of coronavirus infection among healthcare workers
in the hospital premises. The remaining hospitals have been turned into specialised units for
treating COVID-19 cases, with chronic non-COVID patients nowhere to go.24 To add further
insult to the injury, COVID-19 tests have been made mandatory before receiving any kind of
treatment, irrespective of no contact or symptoms of the patients. This is happening even
though the Union health ministry has directed hospitals not to deny treatment to any patients
who are not Covid-19-positive.25,26 In fact, there have been reports of deaths due to hospitals’
refusal to admit patients fearing they might be infected with the virus. While COVID-19 deaths
are being tracked on an hourly basis, there are no official death counts from other sources which
are attributed to the lockdown itself. But anecdotal evidence from media reports, doctors, and
activists suggests they have been happening quite a lot.27 Cardiac specialists are puzzled by the
sudden dip in emergency heart attack cases in the lockdown phase and they fear that patients
being afraid of getting infected, prefer to die at home.
Estimates from the population-based health survey clearly indicate that the section of
population which requires regular chronic care is huge, but it is almost evident from
print/online newspapers/portals that chronic care has been jeopardised in the current times. An
excessive focus on the COVID positive patients while neglecting the other health care needs,
will only aggravate the net disease burden to mammoth levels in the future. Country’s health
sector must find a way where access to regular essential health care services is not restricted
along with its continuing emphasis on identification, isolation and treatment for COVID-19
cases.
The last column of Table 5 shows the index depicting the possible disruption of regular
essential care/interventions for the chronically ill. The states like Kerala and Tamil Nadu are
on the top among the major Indian states requiring large volume of regular care for their
critically ill population which perhaps experienced barriers in access during the lockdown.
After Kerala and Tamil Nadu, West Bengal, Bihar, Andhra Pradesh, Karnataka are some of the
24
https://economictimes.indiatimes.com/industry/healthcare/biotech/healthcare/ease-lockdown-let-other-critical-
patients-get-treatment-hospitals/articleshow/75310740.cms
25
https://www.hindustantimes.com/india-news/test-all-patients-getting-hospital-admissions-for-covid-19-centre-
to-states/story-Wonk3rpLdKP1s7dDJJTrnM.html
26
https://timesofindia.indiatimes.com/india/as-emergency-patients-await-treatment-many-hospitals-insist-on-
covid-19-tests/articleshow/75262116.cms
27
https://thelivenagpur.com/2020/04/11/where-are-missing-heart-attack-patients/
17states with high requirement of regular care by the chronically ill population. The states need
to see that the regular health care requirements of the chronically ill people are not
compromised due to lockdown and restriction in access to hospitals due to COVID 19. The
relative ranking of the major states with respect to (possible) regular medical care disruption
index is presented in Map 5 which shows the major states with possible disruption of chronic
health care due to lockdown.
Effects on School Education and Mid-Day Meal Programmes
Lockdown and school education
This crisis might have an immediate impact on children and youth. As Jaime Saavedra points
out, there may be losses in learning, increased dropout rates, and children missing their most
important meal of the day due to the lockdown.28 We still have huge rich-poor inequalities in
terms of access to school education in the country and it is almost certain that the negative
impacts will be felt disproportionately by poorer children. The estimates from NSS 75th round,
education, data shows that in India only 22 per cent of school going students (6-18 years) have
access to internet services (Table 6). This means that around 80 per cent of students do not
have potential access to education through internet or ‘remote classrooms’ an idea widely
propagated during this lockdown. The lockdown, since the middle of March, has left more than
23 crore students between 6-18 years of age disconnected from school education and restricted
to home.29Many of them are probably not able to continue regular study at home, and have
limited access to nutritional supplements which they were receiving from the mid-day meals.
Many of them may also be forced to spend more time with abusive family members.
Long period of disengagement from school can result in a further increase in dropouts in India.
Remote classrooms have been suggested and taken up by many private schools in India. In
order to introduce technology in education meaningfully and not limited to the privileged, what
is important is to improve access to computer and internet services for children belonging to
all economic classes. In a country where almost 80 per cent of its student population is
eliminated from this access, it is only going to increase the already existing digital divide. If
this digital gap in education were to increase while schools are closed, learning inequality
28
https://blogs.worldbank.org/education/educational-challenges-and-opportunities-covid-19-pandemic
29
The number of school goers between 6-18 years age is 23,51,64,904 (estimated from NSS 75 th round data of
2017-18)
18and ‘learning poverty’ would also inevitably increase.30 Remote education in India would only
mean that learning continuity is ensured for some but denied to others or to most. In addition
to this, school is often the only safe place for many vulnerable children. In school, “they are
safe from abuse, the only place they get proper meals.”31 NSS estimates show that there are
many states, including West Bengal, Karnataka, Andhra Pradesh, Telengana, Uttar Pradesh,
Tamil Nadu and Bihar, where percentage of access to internet services is less than the national
average. In many of these states the educational outcomes as captured by ASER 2018 were
already poor.32.In states with better learning outcomes like Kerala, Maharashtra or Punjab it is
expected that with better access to internet and already improved educational standards the
impact of this lockdown in terms of learning loss will be lesser.
The NSS estimates also show that only 8.6 per cent of students have a computer at home and
7.2 per cent have access to computer and internet services at home. 33 Functionally, it is this
7.2 per cent of students who will be able to appropriately access remote education during the
lockdown if offered by their schools. There are many states with lower than the national
average in terms of access to computer and internet services. Maharashtra which has the highest
number of cases so far has only about 33.2 per cent students with access to internet services.
This means that around 67 per cent of the students will not be able to access education during
the lockdown as remote learning strategies will not work for them. Additionally, the capacity
of the schools and teachers to undertake classes digitally, providing suitable content is another
area of concern. Private schools too face a digital gap like ‘the capacities and capabilities of
each school to provide individualized, or suitably levelled and sequenced, digital learning for
students; to promote and monitor engagement with these materials; and provide feedback that
helps maximize learning outcomes’ (Moreno, 2020).34
30
Learning poverty means being unable to read and understand a simple text by age 10
(https://www.worldbank.org/en/topic/education/brief/learning-poverty)
31
https://www.theguardian.com/education/2020/apr/14/the-schools-open-during-lockdown-for-some-kids-its-
the-only-safe-place
32
Like in West Bengal almost 50 per cent children in government schools in Standard V cannot read Standard II
level text. For Tamil Nadu it is about 54 per cent and in Bihar, it is 65 per cent. On the other hand, there are many
states like Kerala (73 per cent), Maharashtra (66 per cent) or Punjab (69 per cent) where a much higher percentage
of children in Standard V are able to read Standard II text.
33
According to NSS 75th computer includes desktop, laptop, palmtop, notebook, netbook, tablets, etc
34
Schools’ readiness for digital learning in the eyes of principals. An analysis from PISA 2018 and its implications
for the COVID19 (Coronavirus) crisis response (https://blogs.worldbank.org/education/schools-readiness-digital-
learning-eyes-principals-analysis-pisa-2018-and-its?cid=EXT_WBBlogTweetableShare_D_EXT)
19Mid-day meal and lockdown
Schools and ICDS centres are often the only space where many children get a full meal in a
day.35 The lockdown due to the COVID-19 crisis has left these children without access to meal,
though efforts are being made in different states to send uncooked raw materials to the parents
of the children who are entitled to meals in schools and ICDS centres but it seems to be limited.
In India, according the latest NSS estimates, 30 per cent children between 0-18 years benefit
from the mid-day meals (Table 7) and according to the DISE data (2016-17) 75 per cent of the
schools provide mid-day meals. The NSS estimates also show that 35 per cent poor children-
(children from below median per capita consumption expenditure households) receive these
meals. It is this 35 per cent of children who will be hit the most due to the shutting down of
schools. States like Punjab, Haryana, and Uttar Pradesh have the least percentage of children
who receive mid-day meals. There are many states where the percentage of children benefitting
from mid-day meals in less than the national average. It includes states like Andhra Pradesh,
Gujarat, Maharashtra, Madhya Pradesh and Rajasthan. Uttar Pradesh (23 per cent) and Haryana
(24 per cent) also have less than one-quarter of poor children receiving such meals.
The last column of Table 7 presents a composite index which captures to what extent the school
education and mid-day meals might get possibly disrupted in different major states. The major
states which are going to bear the highest disruption in school education are Bihar, Jharkhand,
Chhattisgarh, Odisha, Assam, Uttar Pradesh, West Bengal, Madhya Pradesh and Rajasthan.
The map below presents the relative ranking of the states in terms of likely disturbances in
school education due to lock down.
To sum up, in order to understand the wide-ranging impact on education due to the closing of
schools we have tried to analyse internet accessibility and access to mid-day meals
simultaneously to get a more complete picture. States like Uttar Pradesh and Andhra Pradesh
have both low percentage of children with internet services and low percentage of children
receiving mid-day meal. Additionally, Uttar Pradesh also has only 36 per cent Standard V
children who can read Standard II texts. It may be easily concluded that states like Uttar
Pradesh will be severely pushed into nutrition and learning poverty due to this lockdown. There
35
There are anecdotal evidences appearing in newspaper. One such news talks about Anjum, a class 5 student at
the government primary school in Dasna (Ghaziabad) who said that she is eagerly waiting for resumption of her
classes. “We have no school work at the moment. The food (mid-day meal) is also not available now and we
survive with one meal per day at home,” she said (https://www.hindustantimes.com/cities/lockdown-govt-school-
children-in-gzb-deprived-of-mid-day-meal/story-nsBAbohcnbfJCexpXkbPEN.html Hindustan Times, Apr 13,
2020).
20are states like Odisha, Karnataka where access to internet services maybe low among children
but a higher percentage of them receive mid-day meals. So, in these states learning poverty
may be lower but health and nutrition for children will face a major setback.
So far, most states have been sending a weekly quota of ration to the families. States like West
Bengal and Andhra Pradesh have been sending raw materials to households to compensate for
the loss of mid-day meals in the schools. The other states may also be following a similar
practice. The ration may however, be just enough to provide the family one meal for a few
days. It is likely, that in a gender biased society like ours, women or a girl child may be
receiving a smaller portion of the daily food as compared to their male counterparts. The mid-
day meal, apart from providing daily nutrition is also an equalizing scheme where both girls
and boys till eighth standard would receive similar amount and quality of food. It is important
that gender sensitivity is promoted in such trying times through community radio, television
and other possible mass media channels.
To offer some solutions to address this pause in classroom education, a few schools have
suggested that since most children do not have access to technology at home, teachers will
provide printed assignments to the families for the children when they come to collect the food
items at the ration shops.
The tremors of this crisis will be inter-generational as poverty will affect not only this
generation but even the ones to come and plans to reach the Sustainable Development Goals
will be altered and the objective of states governments will also see a paradigm shift. This crisis
will determine the political choices that people make as how the governments cope with this
will become its ‘defining legacy’.36
Social Bad
Like many other countries violence against women is a persistent and pressing problem in
India. In 2013, the WHO estimated that roughly 35 per cent of all women have been victims of
physical or sexual violence (Luca, 2015)37. The incidence of marital violence of men toward
36
https://www.hindustantimes.com/columns/covid-19-will-alter-indian-political-life/story-
uomMzsoz0hsFGZG2N4wfEP.html- Hindustan Times, Mar 28, 2020
37
Luca, Dara Lee, Emily Owens and Gunjan Sharma, “Can Alcohol Prohibition Reduce Violence Against
Women?”, The American Economic Review, Vol. 105, No. 5, PAPERS AND PROCEEDINGS OF THE One
Hundred Twenty-Seventh Annual Meeting OF THE AMERICAN ECONOMIC ASSOCIATION (MAY 2015),
pp. 625-629
21their wives varies across cultures, as do the underlying causes. Studies demonstrate that
individual and community factors, and societal responses are linked to marital violence. The
co-occurrence of alcohol abuse and domestic violence including forced sex within marriage in
India is widely acknowledged (Jeyaseelan, 2007; Duvvury et la., 2002).It is a widely-held
belief that alcohol contributes to dis-inhibition, mood enhancement, and alcohol myopia in men
(George and Stoner, 2000). Indirectly, as a mood enhancer, alcohol can also increase existing
feelings of anger and frustration and thus tend to raise the incidence of domestic violence within
intimate partners (Stanley, 2008). Ever since the lockdown began due to COVID-19, there has
been an increase in domestic abuse complaints (ABP News Bureau, April 09, 2020). The media
has been reporting cases of these increased incidents of violence across sectors and the lack of
protection extended to these women. Women in normal circumstances are often known to run
to neighbours or family when violence at home reaches an intolerable level. However, the
lockdown now prevents this (Aljazeera, April 18, 2020). The lockdown has metamorphosed
into a trap with the abusers for women and children (ABP News Bureau, April 09, 2020).
Women without financial security and the ones who are relying on their partners for support
are likely to experience more abuse. According to Feminist Economist, Ashwini Deshpande,
the lockdown provides the perfect opportunity to the abuser to practice “intimate terrorism”—
dictate and control all actions and movements of women, with violence if needed (Quartz India,
April 16, 2020).38 Women from low-income households are worst hit with their partners now
out of job due to the outbreak would resort to abuse to take out their pent-up frustration (ABP
News Bureau, April 09, 2020). The ‘Childline India’ has received more than 92,000 calls
within 11 days of lockdown asking for protection from the violence (The New Indian Express,
April 08, 2020).
Based on NFHS 4 data, we have estimated the percentage of men (15-54 years age) drinking
alcohol, percentage of ever married women reporting domestic violence, percentage of ever
married women (15-49 years age) reported their husband drinking alcohol, and percentage of
ever married women with drunken husband reporting domestic violence.39 Though about 15.6
per cent of the men all over India report that they drink alcohol regularly whereas,29.7 per cent
38
https://qz.com/author/ashwini-deshpande/
39
Computed by taking only physical violence into consideration i.e. ever been pushed, shook or thrown something
by husband or partner, ever been punched by fist or hit by something harmful by husband or partner, ever been
kicked or dragged by husband or partner, ever by strangled or burnt by husband or partner, ever been threatened
by knife or gun or other weapon by husband or partner, and ever had arm twisted or hair pulled by husband or
partner.
22You can also read