Airborne observations of the Eyjafjalla volcano ash cloud over Europe during air space closure in April and May 2010 - Atmos. Chem. Phys
←
→
Page content transcription
If your browser does not render page correctly, please read the page content below
Atmos. Chem. Phys., 11, 2245–2279, 2011
www.atmos-chem-phys.net/11/2245/2011/                                                                  Atmospheric
doi:10.5194/acp-11-2245-2011                                                                             Chemistry
© Author(s) 2011. CC Attribution 3.0 License.                                                          and Physics

Airborne observations of the Eyjafjalla volcano ash cloud over
Europe during air space closure in April and May 2010
U. Schumann1 , B. Weinzierl1 , O. Reitebuch1 , H. Schlager1 , A. Minikin1 , C. Forster1 , R. Baumann1 , T. Sailer1 ,
K. Graf1 , H. Mannstein1 , C. Voigt1 , S. Rahm1 , R. Simmet1 , M. Scheibe1 , M. Lichtenstern1 , P. Stock1 , H. Rüba1 ,
D. Schäuble1 , A. Tafferner1 , M. Rautenhaus1 , T. Gerz1 , H. Ziereis1 , M. Krautstrunk2 , C. Mallaun2 , J.-F. Gayet3 ,
K. Lieke4 , K. Kandler4 , M. Ebert4 , S. Weinbruch4 , A. Stohl5 , J. Gasteiger6 , S. Groß6 , V. Freudenthaler6 , M. Wiegner6 ,
A. Ansmann7 , M. Tesche7 , H. Olafsson8 , and K. Sturm9
1 Deutsches    Zentrum für Luft- und Raumfahrt (DLR), Institut für Physik der Atmosphäre, Oberpfaffenhofen, Germany
2 DLR,   Flugexperimente, Oberpfaffenhofen, Germany
3 Laboratoire de Météorologie Physique UMR 6016/CNRS, Université Blaise Pascal, Clermont-Fd, France
4 Institut für Angewandte Geowissenschaften, Technische Universität Darmstadt, Germany
5 Norwegian Institute for Air Research (NILU), Kjeller, Norway
6 Meteorologisches Institut, Ludwig-Maximilians-Universität, München, Germany
7 Leibniz Institut für Troposphärenforschung, Leipzig, Germany
8 University of Iceland and Icelandic Meteorological Office, Reykjavik, Iceland, and Bergen School of Meteorology,

Geophysical Institute, University of Bergen, Norway
9 Deutscher Wetterdienst, Offenbach, Germany

Received: 25 August 2010 – Published in Atmos. Chem. Phys. Discuss.: 27 September 2010
Revised: 10 February 2011 – Accepted: 1 March 2011 – Published: 11 March 2011

Abstract. Airborne lidar and in-situ measurements of             particle density of 2.6 g cm−3 and various values of the re-
aerosols and trace gases were performed in volcanic ash          fractive index (RI, real part: 1.59; 3 values for the imaginary
plumes over Europe between Southern Germany and Ice-             part: 0, 0.004 and 0.008). The mass concentrations, effec-
land with the Falcon aircraft during the eruption period of      tive diameters and related optical properties were compared
the Eyjafjalla1 volcano between 19 April and 18 May 2010.        with ground-based lidar observations. Theoretical consid-
Flight planning and measurement analyses were supported          erations of particle sedimentation constrain the particle di-
by a refined Meteosat ash product and trajectory model anal-     ameters to those obtained for the lower RI values. The ash
ysis. The volcanic ash plume was observed with lidar directly    mass concentration results have an uncertainty of a factor of
over the volcano and up to a distance of 2700 km downwind,       two. The maximum ash mass concentration encountered dur-
and up to 120 h plume ages. Aged ash layers were between         ing the 17 flights with 34 ash plume penetrations was be-
a few 100 m to 3 km deep, occurred between 1 and 7 km al-        low 1 mg m−3 . The Falcon flew in ash clouds up to about
titude, and were typically 100 to 300 km wide. Particles col-    0.8 mg m−3 for a few minutes and in an ash cloud with ap-
lected by impactors had diameters up to 20 µm diameter, with     proximately 0.2 mg m−3 mean-concentration for about one
size and age dependent composition. Ash mass concentra-          hour without engine damage. The ash plumes were rather dry
tions were derived from optical particle spectrometers for a     and correlated with considerable CO and SO2 increases and
                                                                 O3 decreases. To first order, ash concentration and SO2 mix-
                                                                 ing ratio in the plumes decreased by a factor of two within
                      Correspondence to: U. Schumann             less than a day. In fresh plumes, the SO2 and CO con-
                      (ulrich.schumann@dlr.de)                   centration increases were correlated with the ash mass con-
   1 Also known as Eyjafjallajökull or Eyjafjöll volcano,      centration. The ash plumes were often visible slantwise as
http://www.britannica.com/EBchecked/topic/1683937/               faint dark layers, even for concentrations below 0.1 mg m−3 .
Eyjafjallajokull-volcano

Published by Copernicus Publications on behalf of the European Geosciences Union.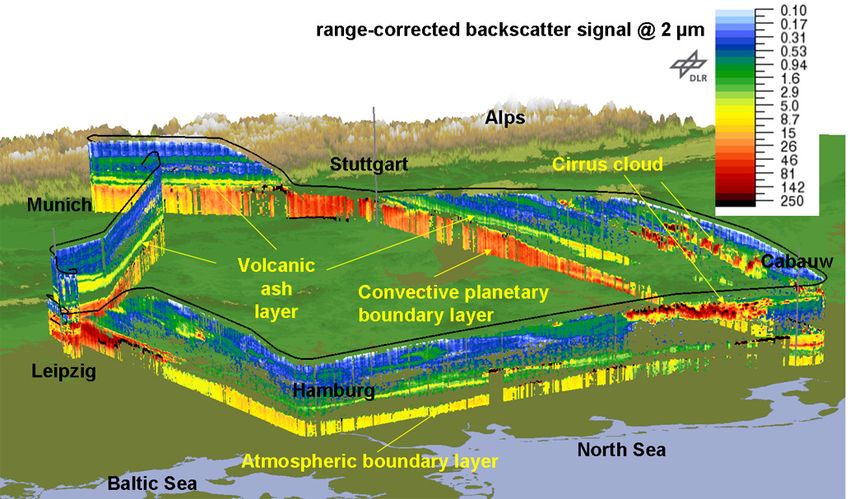
2246                                U. Schumann et al.: Airborne observations of the Eyjafjalla volcano ash cloud over Europe

The large abundance of volatile Aitken mode particles sug-        2 g m−3 as estimated from engine damage analysis (Dunn
gests previous nucleation of sulfuric acid droplets. The ef-      and Wade, 1994; Przedpelski and Casadevall, 1994). Shortly
fective diameters range between 0.2 and 3 µm with consider-       after the Eyjafjalla eruption, on 20 April 2010, aviation ex-
able surface and volume contributions from the Aitken and         perts agreed preliminarily on new thresholds: 0.2 mg m−3 as
coarse mode aerosol, respectively. The distal ash mass flux       the limit below which aircraft may fly without special at-
on 2 May was of the order of 500 (240–1600) kg s−1 . The          tention and 2 mg m−3 as a contamination limit above which
volcano induced about 10 (2.5–50) Tg of distal ash mass and       flights should be avoided. At the end of this volcanic eruption
about 3 (0.6–23) Tg of SO2 during the whole eruption period.      (since 21 May), areas of low (≤ 2 mg m−3 ), medium (2 to
The results of the Falcon flights were used to support the re-    4 mg m−3 ) and high (≥ 4 mg m−3 ) contamination were dis-
sponsible agencies in their decisions concerning air traffic in   tinguished (ICAO, 2010).
the presence of volcanic ash.                                        A few airborne studies have been performed in distal
                                                                  plumes of eruptive volcanoes before, as reviewed in Watson
                                                                  and Oppenheimer (2001). The concentrations and fluxes of
                                                                  trace gases were measured in the Mt. St. Helens plume in
1   Introduction                                                  1980 (Bandy et al., 1982; Cronn and Nutmagul, 1982). The
                                                                  SO2 concentration reached 440 nmol mol−1 , CO was in the
Iceland’s Eyjafjallajökull (63.63◦ N, 19.62◦ W, 1666 m a.s.l)    order of 200 nmol mol−1 . Source rates of SO2 of up to 10 and
erupted on 14 April 2010 ejecting a volcanic ash (VA) plume       140 kg s−1 were derived for Mt. St. Helens and Mt. Redoubt,
over 9 km a.s.l. into the atmosphere (Sigmundsson et al.,         respectively (Hobbs et al., 1982, 1991). Aircraft and balloon-
2010). Though the eruption of the Eyjafjalla volcano rates        borne measurements were made of trace gases, atmospheric
among the mid-sized eruptions (Thordarson and Self, 2003;         particles, and condensed acid volatiles in the plume of El
Mason et al., 2004; Mastin et al., 2009), it had strong im-       Chichón volcano, Mexico, in November 1982 (Kotra et al.,
pact on aviation over Europe. The eruption occurred in a          1983; Arnold et al., 1990). Hydrogen sulfide was the primary
weather situation with strong westerly winds causing VA           gaseous sulfur species in that plume. Lidar and in-situ mea-
to drift within 1–2 days from Iceland toward Central Eu-          surements were used to determine the cross-sectional area
rope where it resided for several days, as observed, e.g.,        and the fluxes of particles and gases from the Mt. Redoubt
with ground based lidar (Ansmann et al., 2010; Flentje et         Volcano in 1990 (Hobbs et al., 1991). The young strato-
al., 2010). Advisories of areas at risk from the volcano          spheric plume of the Mt. Pinatubo eruption in June 1991 was
plume were issued by the responsible Volcanic Ash Advi-           observed mainly by remote sensing techniques, including air-
sory Center (VAAC) of UK Meteorological Office based on           borne lidar (Winker and Osborn, 1992; McCormick et al.,
model predictions. Based on these advisories, European avi-       1995). The volcanic eruptions of Mt. Kasatochi (52.2◦ N,
ation authorities decided on air space closure. As a conse-       175.5◦ W; 7 August 2008) injected about 1.5 Mt SO2 into
quence, air traffic ceased in 23 European countries and 75%       the atmosphere, the eruption reached up to the stratosphere
of the European aerodrome network was closed, with more           at 15.2 km altitude, and resulted in a cancellation or delay of
than 100 000 flights cancelled, affecting 10 million passenger    44 aircraft flights (Schmale et al., 2010). Increased SO2 (and
journeys, in the time period 14 April to 20 April (as reported    particulate sulfate) concentrations up to 0.5 nmol mol−1 were
by EUROCONTROL). Further incursions of VA over West-              repeatedly detected in the lower stratosphere above Europe
ern Europe caused again airspace closures at various places       up to 4 months after eruption (Martinsson et al., 2009; Heue
and periods until 18 May 2010, leading to cancelling of about     et al., 2010b; Jurkat et al., 2010; Mattis et al., 2010; Schmale
7000 more flights.                                                et al., 2010; Voigt et al., 2010). More recently still, Sarychev
   Never before was such a large and busy air space im-           (48.1◦ N, 153.2◦ E; 12 June 2009) erupted in June 2009 in-
pacted by a volcanic eruption. Existing regulation required       jecting around 1.2 Tg of SO2 into the stratosphere (Haywood
an air space to be closed whenever any VA contamination           et al., 2010). In February 2000, a 34 h aged volcanic cloud
was expected in the air space without specifying an accept-       from Hekla volcano, Iceland, was incidentally encountered
able safety limit of ash loading (Casadevall, 1993). In desert    by the DC-8 research aircraft during a larger atmospheric ob-
vicinity regions, such as Saudia Arabia and Southern Mo-          servation experiment (Hunton et al., 2005; Rose et al., 2006).
rocco, annual mean dust mass levels of 0.2 mg m−3 are not         During this flight, the DC-8 sampled various gases (including
uncommon (Schütz, 1980; Weinzierl et al., 2009). In com-         SO2 , HCl and HF) and particulate properties at 10.4 km alti-
parison to desert dust, VA is considered more dangerous be-       tude, for about 10 min inside a cirrus cloud. The SO2 concen-
cause of its lower melting temperature (Casadevall, 1993).        tration exceeded 1 µmol mol−1 . Engine damages diagnosed
During the past 30 yr, more than 120 airplanes have inadver-      for this case (perhaps for other reasons) were later interpreted
tently flown through clouds of VA from erupting volcanoes         as an indication that flying in even minor VA plume remnants
(Webley and Mastin, 2009). In a few cases, serious engine or      may cause major damage to the aircraft (Grindle and Bur-
aircraft damages have been reported, after a few minutes of       cham Jr., 2002; Pieri et al., 2002; Grindle and Burcham Jr.,
flight time in volcanic plume with ash loading of possibly        2003).

Atmos. Chem. Phys., 11, 2245–2279, 2011                                             www.atmos-chem-phys.net/11/2245/2011/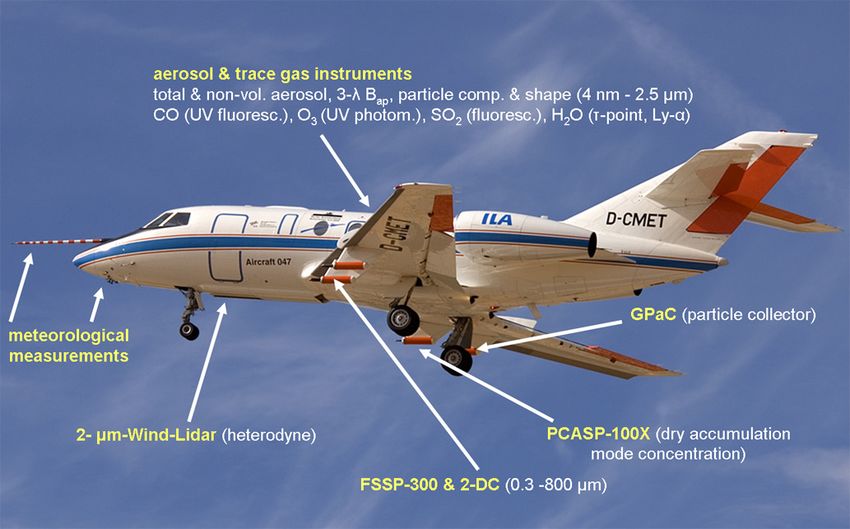
U. Schumann et al.: Airborne observations of the Eyjafjalla volcano ash cloud over Europe                                    2247

   The size spectra of ash particles available in the litera-
ture were mostly derived from tephra deposited at ground
(Rose and Durant, 2009; Webley and Mastin, 2009). Sam-
ples taken at ground near the Eyjafjalla indicate particle
sizes up to 300 µm, with more than 50% mass in particles
larger than about 50–150 µm, varying during the eruption pe-
riod (IES: Institute of Earth Sciences, University of Iceland,
http://www.earthice.hi.is). Most of the large particles sedi-
ment out of the ash plume in close vicinity of the volcano.
   Only a few airborne measurements of the ash size spec-
trum and total mass concentrations have been taken inside
VA plumes (Hobbs et al., 1982). Particle counters inside the
fuselage can measure only small particles (
2248                                  U. Schumann et al.: Airborne observations of the Eyjafjalla volcano ash cloud over Europe

Table 1. Falcon instrumentation for the DLR volcanic ash missions in April/May 2010.

                    Instrumentation                                                  Measured quantity
                                                      Remote sensing instrument
    2-µm Wind-lidar                                                  Vertical profile of attenuated aerosol backscatter and wind
                                                                     vector below the aircraft
                           Aerosol in-situ instruments sampling sub-2.5 µm particles behind the aerosol inlet
    Multi-channel condensation particle counter (CPC; 3 unheated,    Integral number of ultrafine particles (D > 4 nm) and
    2 heated channels)                                               non-volatile fraction
    2-channel Optical Particle Counter (Grimm SKY-OPC 1.129)         Total and
                                                                     non-volatile size distribution (D > 0.25 µm)
    Three-wavelength Particle Soot Absorption Photometer             Absorption coefficient at λ = 467, λ = 530 and λ = 660 nm
    (3-λ-PSAP)
    Impactor sampler                                                 Chemical composition and shape of particles
                                              Aerosol in-situ instruments at wing stations
    Passive Cavity Aerosol Spectrometer Probe (PCASP-100X)           Size distribution accumulation mode, dry state
                                                                     (0.16 µm < D < 3.0 µm)
    Forward Scattering Spectrometer Probe (FSSP-300)                 Size distribution coarse mode, ambient state
                                                                     (1 µm < D < 25 µm)
    Two-dimensional imaging cloud probe (2D-C)                       Shape and size distribution of very large particles, water
                                                                     droplets and ice-crystals (25 µm < D < 800 µm)
    Giant Particle Collector (GPaC)                                  Chemical composition and shape particles
                                                     Trace gas in-situ instruments
    SO2 detector (fluorescence)                                      Sulfur dioxide mixing ratio
    O3 detector (UV absorption)                                      Ozone mixing ratio
    CO detector (vacuum UV)                                          Carbon monoxide mixing ratio
                                                         Meteorological data
    Falcon standard instrumentation                                  Position, temperature, pressure, humidity, wind
    CR-2 dew point hygrometer                                        Dew point, humidity

instruments that were available quickly from previous exper-          2.1.1    Lidar
iments; see Table 1. The instruments include a lidar, in-situ
instruments for measuring aerosol microphysical properties,
chemical species, and meteorological parameters like tem-             The 2-µm Doppler wind lidar (light detection and ranging)
perature, humidity and wind. Furthermore, aircraft naviga-            was deployed on the Falcon aircraft in a downward looking
tion parameters (position, aircraft speed, etc.) were recorded.       direction performing conical scans for the retrieval of ver-
The 2D-C and the particle impactor instruments, see Table 1,          tical profiles of the horizontal wind vector and attenuated
were provided by the Laboratoire de Météorologie Physique,          aerosol backscatter. The coherent, heterodyne-detection li-
Clermont-Ferrand, and by the Technical University Darm-               dar is based on a transceiver unit from Lockheed Martin Co-
stadt, respectively. All other instruments were provided by           herent Technologies. The laser is transmitting pulses with a
DLR. For possible early detection of engine damages, the              wavelength of 2.02 µm, duration of 400 ns, energy of 1–2 mJ,
pilots controlled temperature and pressure indicators for nor-        and a repetition rate of 500 Hz (Köpp et al., 2004). Measure-
mal engine operations during flight. Satellite (Iridium) tele-        ments are obtained from an altitude of 400 m below the air-
phone connections were available and important for real-time          craft to the ground with a vertical resolution of 100 m. The
communication of the results from the observers on board to           wind vector is derived by a velocity-azimuth-display tech-
the decision-making agencies.                                         nique from 20 line-of-sight (LOS) directions during one con-
                                                                      ical scan with a horizontal resolution of 4–6 km depending on
                                                                      aircraft ground speed (Reitebuch et al., 2001). Accuracies of

Atmos. Chem. Phys., 11, 2245–2279, 2011                                                      www.atmos-chem-phys.net/11/2245/2011/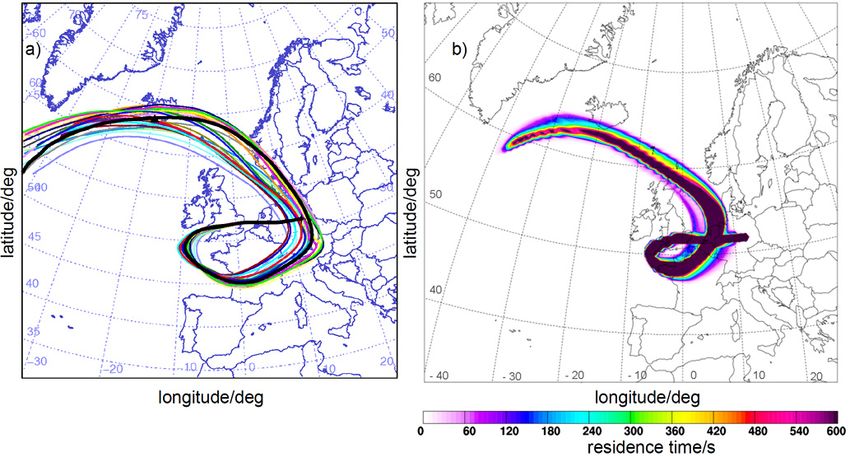
U. Schumann et al.: Airborne observations of the Eyjafjalla volcano ash cloud over Europe                                   2249

better than 1 m s−1 can be achieved for the horizontal wind       Cavity Aerosol Spectrometer Probe (PCASP) of type PMS
speed (Weissmann et al., 2005a, b). The backscatter signal is     PCASP-100X, and Forward Scattering Spectrometer Probe
obtained after averaging a number of 500 laser pulse-returns      (FSSP) of type PMS FSSP-300 (Weinzierl et al., 2009), see
during 1 s for each LOS and applying a correction for range       Table 1. The measurement principle of these instruments is
R with a factor of R 2 . Thus, the signal profiles are obtained   the sizing of particles based on the detection of the amount
with a horizontal resolution of 150–200 m for typical aircraft    of light scattered by single particles. The instruments con-
speeds. The range-corrected signal depends on the vertical        vert the scattering signal into an electrical signal, which cor-
profile of the atmospheric backscatter and extinction coef-       responds to size information and is resolved into an array
ficient, which are both depending on the particle (aerosol,       of channels which is fixed in case of the three aerosol spec-
cloud, ash) content of the atmosphere, their size distribu-       trometers used in this study. The instruments differ mainly
tions and scattering properties. The 2-µm laser wavelength        in optical geometry and electronic signal processing, and,
is higher than the typical wavelengths of up to 1.064 µm for      as a result, cover different particle size ranges. Accord-
ceilometers (Flentje et al., 2010) or aerosol lidars (Ansmann     ing to the manufacturers, the PCASP covers nominally the
et al., 2010), which were used to observe the VA plumes from      size range 0.12–3.5 µm (15 channels), the OPC 0.25–32 µm
the ground. Thus, the 2-µm lidar observations complement          (31 channels) and the FSSP 0.3–20 µm (31 channels). Dur-
those ground observations for a wavelength, which is com-         ing the Falcon flights discussed in this study, we found the
parable to the size of the VA particles. The heterodyne de-       FSSP to show false counts due to electronic noise in the
tection method is more sensitive to lower aerosol contents        lowest channels as well as unrealistically high count rates
in the atmosphere compared to a direct-detection aerosol li-      in some of its higher channels (in particular channels 24,
dar, because the heterodyne signal is analyzed in a much          25, 30 and 31). Close inspection of the raw data of the in-
lower frequency bandwidth, making it insensitive to the so-       strument suggested disregarding the counts outside the chan-
lar background. On the other hand, the volume backscat-           nel range 12–23. This limits in particular the upper end of
ter and extinction coefficient cannot be derived directly from    the size range of the FSSP instrument considerably (for in-
the heterodyne signal, as it is performed for aerosol lidars      stance, maximum particle diameter of 14 µm for channel 23
(Ansmann et al., 2010). Nevertheless, the real-time display       instead of 30 µm for channel 31, referring to a case of non-
of the signal-to-noise ratio was used during flights to detect    absorbing aerosol). However, we will show below that the
the presence of VA layers, their vertical and horizontal ex-      maximum of the volume size distribution has been captured
tent and their relative signal strength compared to water or      even within the reduced FSSP size range. For the PCASP
ice clouds. Thus, the lidar observations were essential as a      the two lowest channels were disregarded due to electronic
pathfinder for subsequent in-situ observations.                   noise, raising the lower end of the PCASP size range to about
   In the post-flight analysis, the lower and upper boundary      0.16 µm. Below this size, the total number of particles larger
of the measured VA layers was determined from the range-          than 4 nm and larger than 10 nm is known from CPC mea-
corrected attenuated backscatter signal of the lidar by visual    surements which were operated at different cut-off diame-
inspection. Layers were identified where they were clearly        ters (Schröder and Ström, 1997). In addition to the total size
separated vertically from the atmospheric aerosol boundary        distribution, the size distribution of the non-volatile aerosol
layer, showed signal levels lower than from water clouds but      compounds was also measured. For this purpose, a second
higher than typically observed in the free troposphere, and       OPC and two of the CPCs were connected to a thermal de-
are characterized by a strong signal vertical gradient. As the    nuder heating the aerosol to 250 ◦ C. The heating tempera-
VA layers showed high signal levels combined with high sig-       ture of the thermal denuder allows the separation of high to
nal gradients within 100–200 m, the upper and lower bound-        medium volatile organics and components of sulfuric acid-
aries could be clearly identified. The uncertainty in the de-     like and ammonium sulfate-like behavior from non-volatile
termination of the VA layer boundaries is ± 150 m resulting       or refractory components like crustal material in VA layers
from the range resolution of the lidar (± 50 m) and the ap-       (Clarke, 1991). The size range from about 25 to 800 µm, de-
plied threshold on the signal strength and gradient (± 100 m).    pending on airspeed, was covered by the 2D-C probe (Law-
                                                                  son et al., 2006; Gayet et al., 2009). The 2D-C instrument
2.1.2   In-situ aerosol instruments                               records the two-dimensional shadows of particles as they
                                                                  pass through a focused laser beam and provides informa-
The in-situ aerosol instrumentation covered the whole par-        tion about particle shape and size from the analysis of the
ticle size spectrum including particles in the nucleation         recorded shadow. Beyond particle sizing, the Falcon aerosol
mode (4–10 nm diameter), Aitken mode (10–160 nm), accu-           instrumentation was designed to provide information on the
mulation mode (160 nm–1 µm), coarse mode (1 µm–25 µm)             aerosol absorption coefficient at the wavelengths of 467, 530
and particles in the far super-micron diameter range (up to       and 660 nm with a 3-λ Particle Soot Absorption Photome-
800 µm). The particle fraction above 160 nm was sized by          ter (PSAP) (Virkkula, 2010). These absorption data can be
a combination of optical particle counters: Optical Parti-        used to determine the complex refractive index of aerosols
cle Counter Grimm SKY-OPC model 1.129 (OPC), Passive              (Petzold et al., 2009). Three impactor-sampling devices were

www.atmos-chem-phys.net/11/2245/2011/                                               Atmos. Chem. Phys., 11, 2245–2279, 2011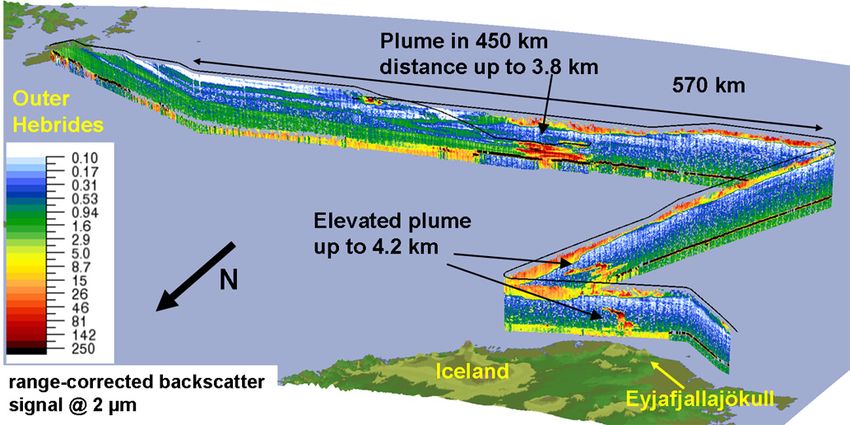
2250                                U. Schumann et al.: Airborne observations of the Eyjafjalla volcano ash cloud over Europe

mounted inside the aircraft to collect VA particles for off-line      In the analysis of the particle size distributions of the opti-
single particle analysis (Ebert et al., 2002; Kandler et al.,      cal aerosol spectrometer probes, we initially use Mie calcula-
2009). The PCASP, FSSP, 2D-C, and, in addition, the Giant          tions assuming spherical particles. The channels are grouped
Particle Collector (GPaC) were mounted under the wings of          into larger size bins to account for ambiguities in the Mie
the aircraft. All other instruments were operated in the cabin,    scattering cross section as a function of particle size, to im-
sampling air from the Falcon aerosol inlet, which is sampling      prove counting statistics in particular for high channel num-
in forward direction close to isokinetic sampling conditions.      bers, and to smooth the resulting size spectra. In principle,
For large particles, the sampling efficiency of this inlet falls   prolate ice particles cause a shift in size distribution toward
off rigorously. The cut-off diameter, at which 50% of the          lower sizes (Borrmann et al., 2000). To estimate the im-
particles pass the isokinetic inlet, depends on outside pres-      pact of particle non-sphericity of ash particles (Munoz et al.,
sure and air speed. For a typical Falcon speed, the cut-off is     2004) we assessed the FSSP response by T-matrix calcula-
near 2.5 µm at ground level and decreases to about 1.5 µm at       tions for randomly-oriented prolate spheroids (Mishchenko
10 km altitude (Fiebig, 2001; Wendisch et al., 2004).              and Travis, 1998), see Sect. 3.2.
                                                                      The specific particle volume V and projected particle
2.1.3   Method for derivation of particle size distribution        cross-section area A, both per unit ambient volume, as
        and ash mass concentration                                 needed to determine the effective diameter Deff = 3V /(2A)
                                                                   (Hansen and Travis, 1974; McFarquhar and Heymsfield,
The mass concentration of ash particles is derived from par-       1998), are computed by integrating over the respective size
ticle number size distributions measured by the three optical      distributions assuming spherical particles. For ash parti-
laser aerosol spectrometers, PCASP, OPC, and FSSP, speci-          cles of equal volume but spheroidal shapes and aspect ratio,
fied above (Table 1) for a given particle refractive index and     e.g., 2:1, the effective diameter would be about 10% larger
density. In the literature, many papers discuss the refrac-        (Krotkov et al., 1999; Schumann et al., 2011). For the accu-
tive index of mineral dust (Balkanski et al., 2007; Petzold        mulation and coarse mode particles (D > 160 nm) the inte-
et al., 2009), but only a few data for volcanic ash are re-        grals are taken directly from the PCASP and FSSP measure-
ported. For visible wavelengths, the real part of the refractive   ments. For the size distribution below this size range, we as-
index varies between 1.5 and 1.6 for silicate glasses simi-        sumed that a single log-normal mode represents all particles
lar to volcanic ashes (Patterson, 1981) and between 1.48 and       in the Aitken mode. This is justified because in all VA cases
1.57 for naturally occurring rocks (obsidian, basaltic glass       measured, the contribution of particles below 10 nm size, i.e.
and andesite) (Pollack et al., 1973). While the size distribu-     from a nucleation mode, was negligible. For simplicity, we
tions for small particles (measured by OPC and PCASP) are          used the same scale and shape parameters for the lognormal
rather insensitive to variations of the imaginary part of the      Aitken mode and adjusted the fit only to the total number
refractive index, this is not the case for the FSSP instrument     concentration of Aitken particles, which is calculated as the
(Weinzierl et al., 2009) because it is much more selective for     total condensation nuclei concentration from CPC measure-
forward scattering angles. With increasing particle absorp-        ment minus the total amount of accumulation mode particles
tion, the size distribution derived from the FSSP data in gen-     from the PCASP. With a count median diameter of 80 nm and
eral shifts toward larger particle sizes. The imaginary part of    a geometric standard deviation of 1.5 of the lognormal fit we
the refractive index of volcanic ash varies widely. Values be-     obtained overall the best overlap of the fitted Aitken mode
tween 0.00027 and 0.0015 have been reported for naturally          with the PCASP size distributions, see Sect. 3.3.
occurring rocks (Pollack et al., 1973). Patterson et al. (1983)
investigated ash samples of the 1982 El Chichón eruption          2.1.4   Trace gas instruments
collected at three surface sites at distances between 12 and
80 km from the volcano. The imaginary part of the refrac-          The trace gases ozone (O3 ), carbon monoxide (CO), and sul-
tive index at 632 nm (the laser wavelength of the PCASP and        fur dioxide (SO2 ), and water vapor (H2 O) were measured
FSSP) decreased from about 0.0015 for the sample collected         with in-situ instruments. The individual instruments sampled
at a distance of 12 km to the vent to 0.0008 for an 80 km dis-     air inside the cabin through rearward facing inlets mounted
tance sample. Clarke et al. (1983) obtained a value of 0.0034      on top of the Falcon. Teflon (PFA) was used for the inlet
at 550 nm for the imaginary part of the El Chichón ash. Pat-      tubes of the SO2 and O3 instruments to avoid wall losses.
terson (1981) found an imaginary part of the refractive in-        The inlet tubing of the CO instrument was stainless steel.
dex for Fuego ash of 0.02 at 650 nm. In this study, the re-           Sulfur dioxide was measured using pulsed fluorescence
fractive index value is confined from the measured composi-        (Luke, 1997). The instrument deployed was a Thermo Elec-
tion of particles collected by the impactors (see Sect. 3.2 and    tron SO2 Analyzer (Model 43C Trace Level). In the op-
3.3). The density ρP of the (possibly porous) ash particles        tical cell of the instrument, SO2 is electronically excited
varies from 0.7 to 3.2 g cm−3 (http://volcanoes.usgs.gov/ash/      by radiation in the wavelength range 190–230 nm gener-
properties.html#density). Here, the density ρP is estimated        ated by a Xenon flash lamp pulsed at 10 Hz. Excited SO2 *
based on the impactor samples of 2 May 2010, see below.            is partly quenched and photolyzed, and partly fluoresces at

Atmos. Chem. Phys., 11, 2245–2279, 2011                                               www.atmos-chem-phys.net/11/2245/2011/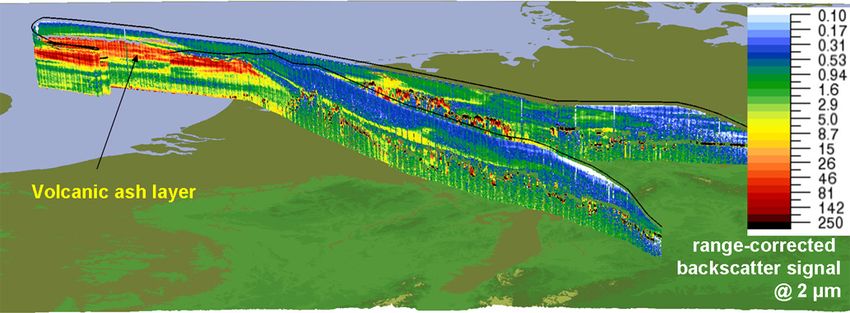
U. Schumann et al.: Airborne observations of the Eyjafjalla volcano ash cloud over Europe                                      2251

320 nm. This radiation is detected by a photomultiplier tube.        (Buck Research Instruments) measures the temperature of a
The photomultiplier sampling gate is delayed by 30 µs from           mirror carrying a thin dew or frost layer held in equilibrium
the trigger of the flash lamp to reduce electronic noise as-         with the ambient water vapor. The detection limit of the frost
sociated with the flash. The fluorescence intensity is lin-          point hygrometer is better than 2 µmol mol−1 at a pressure of
early proportional to the SO2 mixing ratio. The fluores-             200 hPa for a time resolution of 2 s. The uncertainty in the
cence technique is subject to a weak positive interference           water vapor mixing ratio is mainly determined by the uncer-
from aromatic hydrocarbons, CS2 and NO. Hydrocarbons                 tainty in the temperature measurement and amounts to ± 8%.
are removed from the sample air in the instrument by dif-            This uncertainty does not include oscillations of the mirror
fusion through a semi-permeable membrane (hydrocarbon                temperature induced by the control circuit after steep gradi-
kicker). Rejection ratios (ratio of the concentration of in-         ents in humidity, which have to be removed from the data
terferant to SO2 required to produce an equivalent instru-           set. Depending on water vapor gradients, the response time
ment signal) for CS2 and NO were determined in laboratory            of the frost point hygrometer is in the order of one minute
experiments to 20 (Luke, 1997) and 35 (Roiger, 2007), re-            to few seconds. The ambient air temperature was measured
spectively. Interferences from CS2 and NO are considered             with an accuracy of 0.3 K with a PT100 sensor with a Rose-
to be negligible for the present measurements in view of ob-         mount inlet.
served CS2 /SO2 and NO/SO2 concentration ratios of about
0.01 (Cronn and Nutmagul, 1982) and 0.001 (Rose et al.,              2.2   Modeling methods
2006) in volcanic plumes. The detection limit of the SO2
monitor is 0.2 nmol mol−1 . The precision and accuracy are           For flight planning and for analysis of the plume age and
3% and 5%, respectively. The response time of the instru-            source altitude and strength at time of emission at the vol-
ment is 80 s (t95% ).                                                cano, we use the FLEXPART model (run at Norwegian Insti-
   Ozone was measured with a Thermo Environment ultra-               tute for Air Research (NILU) and DLR) and the HYSPLIT
violet (UV) photometric ozone analyzer (Model 49C). The              model (run at DLR) in backward or forward mode driven
instrument employs a mercury lamp to produce UV light at             with different meteorological reanalysis data. The use of dif-
a wavelength of 254 nm. The degree of absorption of the              ferent models, different atmospheric datasets and different
UV light is linearly proportional to the ozone concentration         methodologies serves to provide a first guess of the robust-
in the optical cell. The sample air drawn into the instrument        ness of the corresponding results.
is passed to two optical cells, one equipped with an ozone              The FLEXPART model (Stohl et al., 2005) driven with
scrubber to serve as a reference gas. The flow to the reference      ECMWF reanalyzed data with 0.5◦ × 0.5◦ horizontal reso-
and measurement cell is alternated every 4 s using solenoid          lution is used for age analysis from backward trajectories of
valves. The light intensity of each cell is measured by sepa-        virtual particles released at the points of measurements along
rate detectors. A particle filter (Teflon, 5 µm pore) is installed   the flight paths. The backward transport method accounts for
upstream of the optical cells to avoid scattering or absorption      turbulence and convection and has been validated by compar-
of UV light by particles. A weak interference of the UV              ison to other methods (Seibert and Frank, 2004). For each
absorption technique with SO2 (rejection ratio of 70) was            grid cell along the flight tracks, 10 000 particles are released.
considered during data reduction. The detection limit and re-        The particles are classified as passing over the volcano when
sponse time of the instrument is 1 nmol mol−1 and 15 s with a        approaching the volcano within 50 km distance. Some parti-
10 s lag time. Precision and accuracy are 3% or 1 nmol mol−1         cles passed over the volcano several times so that their ages
(whichever is larger) and 5% respectively.                           spread over several hours or even days. Besides minimum
   Carbon monoxide was measured using a fast-response                and maximum ages, we report the age occurring most fre-
(< 2 s) vacuum UV resonance fluorescence detector (Model             quently as best estimate.
AEROLASER AL 5001). UV light at a wavelength of                         Alternatively, the ash-plume age was computed using the
150 nm is mirrored by an optical filter into a fluorescence          National Oceanic and Atmospheric Administration (NOAA)
cell. The light is produced by a resonance lamp excited by           Air Resources Laboratory (ARL) HYSPLIT model (Draxler
a radio frequency discharge. The fluorescence is detected by         and Hess, 1998; Draxler, 2003). The model was driven with
a photomultiplier tube. The detection limit of the instrument        reanalyzed atmospheric data from the Global Forecast Sys-
is 3 nmol mol−1 . Precision and accuracy are 3% and 5%, re-          tem/Global Data Analysis System (GFS/GDAS) model. The
spectively (Gerbig et al., 1999).                                    calculations were performed using GFS data with 0.5◦ × 0.5◦
   Water vapor was measured with two independent instru-             or 1◦ × 1◦ horizontal resolution. The physics in HYSPLIT
ments: a Lyman-α absorption water vapor instrument oper-             was parameterized using the recommended standard settings.
ated by the DLR flight department and a dew point hygrom-            For the forward simulations, the Eyjafjalla ash emission was
eter (Voigt et al., 2010). The Lyman-α instrument has an             modeled using a vertical line source located at the volcano
accuracy of 5% for humidity mass mixing ratios above 10−4 .          with varying mass flow rate and vertical extent. The top
Humidity data with 10 Hz time resolution are available at al-        height ht of the source was taken from the 6-h updated graph-
titudes below 8 to 9 km. The dew point hygrometer CR-2               ics issued by the VAAC. The bottom end of the line source

www.atmos-chem-phys.net/11/2245/2011/                                                  Atmos. Chem. Phys., 11, 2245–2279, 2011
2252 U. Schumann et al.: Airborne observations of the Eyjafjalla volcano ash cloud over Europe
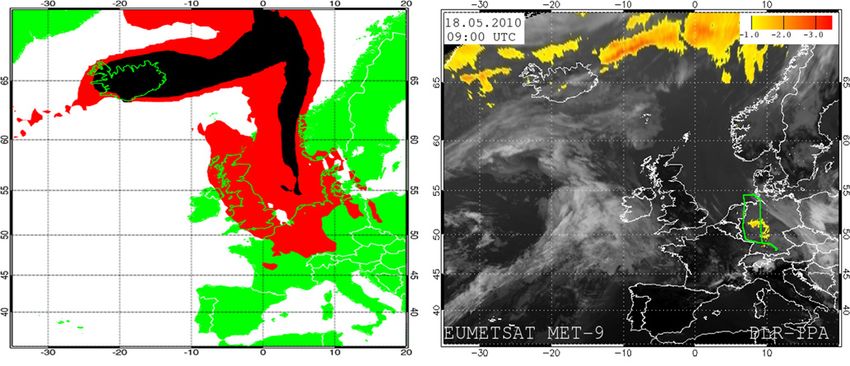
was estimated to be (ht, min + hS )/2, were hS is the volcano It is well known that transparent ash clouds can be detected
height and ht, min the minimum top-height reported for the by evaluation of the brightness temperature (BT) difference
6-h period. The mass flow rate is computed from of channels at 12 µm and 10 µm due to the so-called reverse
absorption effect (Prata and Grant, 2001; Prata, 2009). Usu-
1/a
ally, BT(10 µm)–BT(12 µm) < 0 for ash particles and > 0 for
ht − hS
ṁ = ṁref (1) clouds, but atmospheric humidity, surface properties and the
ht,ref − hS
satellite viewing angle modify this threshold. For a refined
using a = 0.25, which is between the values 0.241 and 0.259 ash product, the threshold was tuned to −1 K by visual in-
given in Mastin et al. (2009) and Sparks et al. (1997), respec- spection to provide a fair balance between a low false alarm
tively. The reference mass flow rate ṁref was adjusted such rate and high detection efficiency. In a further step, the data
that the total ash mass ejected during the first 72 h of the vol- was low-pass filtered in order to reduce the pixel noise in-
cano eruption equals the total airborne tephra mass, mt times herent in the temperature difference data. As background we
the fraction of fine-grained ash below 63 µm, m63 (grain size have chosen the BT(10.8 µm) grayscale image for better as-
8 = 4). For mt an average value of 5 × 10⁵ kg s−1 during the sessment of cloudiness in the meteorological situation. It has
first three days was used according to the preliminary esti- to be kept in mind, that the intensity of the ash product is not
mates published by the IES. A lower bound of the fine ash linearly related to ash concentration.
fraction m63 was estimated to be ≥ 3% from an ash sample
taken 2 km west of the active vent on 28 April. The true fine- 2.4 Flight planning
ash mass fraction in the eruption column is probably larger
if we consider that the largest particles fall out fastest and Flight planning at DLR was based on numerical weather
hence the ground samples may underestimate the finer par- forecasts, trajectory-based particle-dispersion models, satel-
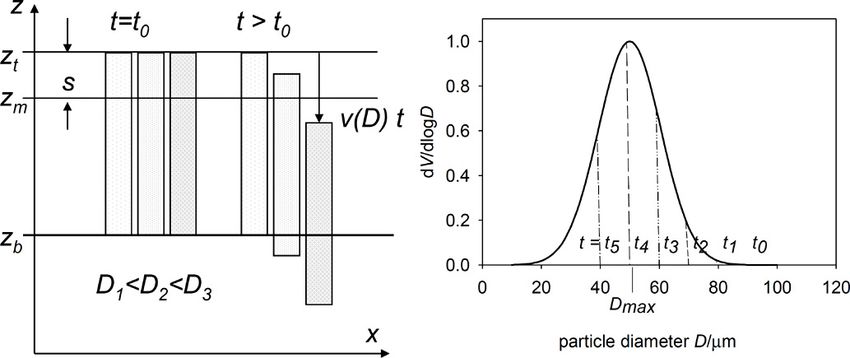
ticle’s frequency. The total “fine” ash mass was distributed lite observations and ground based lidar observations from
equally on six representative ash particle size classes with di- many sources. The Falcon was operated as a “state aircraft”
ameters of 2, 6, 15, 25, 40 and 60 µm, which are handled in allowing for operations in otherwise closed air space. If nec-
HYSPLIT as different pollutant species in order to account essary, the Falcon pilots were able to change the flight plan
for the different sedimentation velocity of the particles. Fig- in-flight in direct contact with air traffic control.
ure 2 shows the time-series of the source characteristics as In order to estimate the current and future spatial and tem-
used in this study. For a given point of measurements, an poral distribution of VA layers, the flight planning team re-
ensemble of backward trajectories was computed, to obtain a lied on satellite products from Meteosat SEVIRI. In addi-
first estimate of the plume age and source altitude at the time tion, model predictions were used from various sources, in-
of eruption. The results were checked and corrected based cluding the VAAC NAME model (http://www.metoffice.gov.
on forward trajectories. The source strength was then taken uk/aviation/vaac/vaacuk vag.html), the Lagrangian particle
from the lower panel of Fig. 2. dispersion model FLEXPART (Stohl et al., 2005) of NILU
(http://transport.nilu.no/browser/fpi), and calculations with
2.3 Volcano plume identification from Meteosat the same model at DLR. Other VA forecasts like those from
SEVIRI data the EURAD model of the Rheinisches Institut für Umwelt-
forschung, University of Cologne (http://db.eurad.uni-koeln.
In order to monitor the VA plume, we utilize the Spinning de/), from the COSMO-ART model of the Deutscher Wet-
Enhanced Visible and Infrared Imager (SEVIRI) “dust” im- terdienst (DWD, German Weather Service) and FLEXPART
age, which is a standard product used for visualization. This results from the Austrian Center for Meteorology and Geo-
dust image is a red-green-blue (RGB) composite based on the dynamics (ZAMG) in Vienna (http://www.zamg.ac.at/) were
brightness temperature differences between the 12 µm and also available for some cases. Especially during the first
10.8 µm channel in red, the 10.8 µm and the 8.7 µm channel days, the ash-dispersion model predictions suffered from in-
in green and the brightness temperature of the 10.8 µm chan- complete knowledge about the VA source. Hence, the model
nel in blue. This imagery allows identification and tracking results were mainly interpreted qualitatively to identify re-
of the ash cloud 24-h a day and indicates regions where the gions with high or low ash concentration.
ash might be obscured by ice on the volcanic ash particles or A critical part of the flight planning process was the fore-
by overlying clouds. The 15-min frequency of these images cast of the expected (water) cloud cover to decide on whether
allows a very good judgment of the position (but not of al- the predicted ash plumes were embedded in clouds. Mea-
titude and density) of the ash cloud if interpreted correctly. surements in VA plumes inside clouds had to be avoided,
However, such an interpretation is not possible from single as lidar signals are strongly attenuated in water clouds and
images without further information, since the image some- the optical particle counters cannot easily distinguish be-
times exhibits weak contrast between ash and water clouds tween ash particles and water droplets. For long distance
(see Sect. 3.4, Fig. 14 below). Therefore, we have developed flights, airports had to be selected for refueling which were
a variant of this method for ash. forecast to be free of VA impact. For these purposes, both
Atmos. Chem. Phys., 11, 2245–2279, 2011 www.atmos-chem-phys.net/11/2245/2011/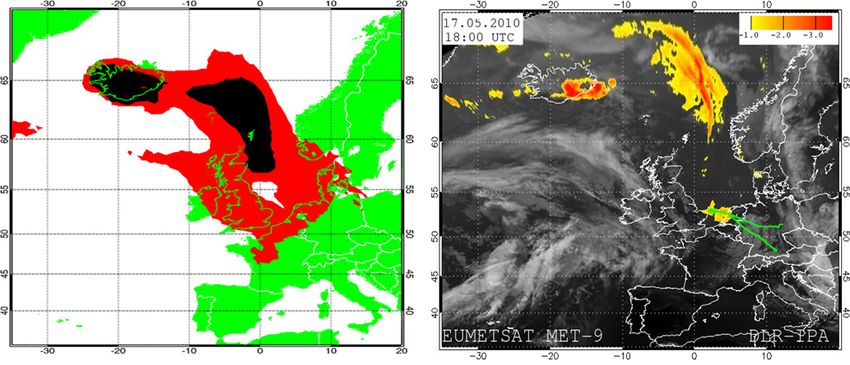
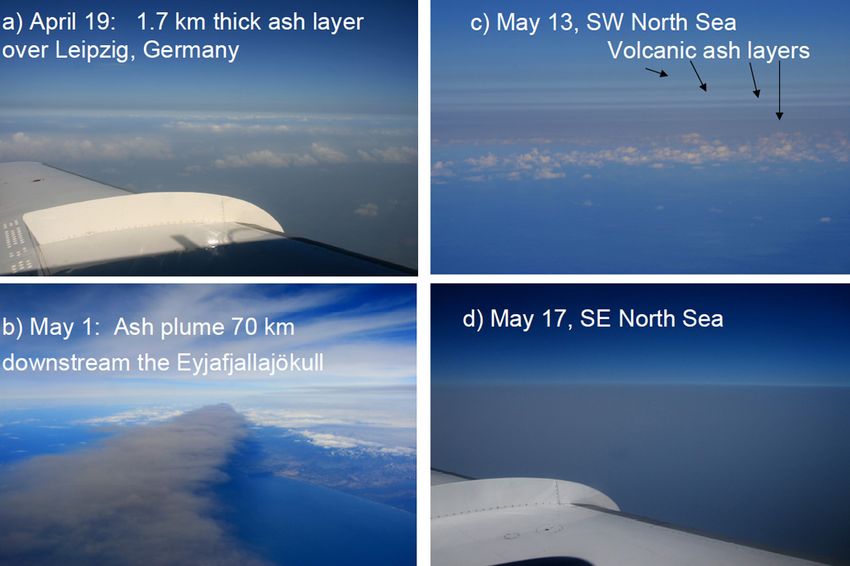
U. Schumann et al.: Airborne observations of the Eyjafjalla volcano ash cloud over Europe                                               2253

Fig. 2. Ash source characteristics used in the model. The upper panel depicts the ejection height (upper and lower bound, shaded area;
FL = flight level in hectofeet). The lower panel shows the mass flow rate and the cumulative mass (red line) in relative (rel.) units. The unit
mass flow rate corresponds to a plume top at 4.6 km (FL 150).

VA prediction and weather prediction data were inspected                  Inspection showed that the nozzle damages were not caused
simultaneously. Weather prediction was based on deter-                    by the VA. The engines were repaired within 3 days.
ministic meteorological forecasts from the European Cen-
tre for Medium Range Weather Forecasts (ECMWF) and on
COSMO-EU and COSMO-DE forecasts of DWD. For fore-                         3     Results
casting, we strongly built on experience gained in previous
campaigns. For instance, refined versions of software used                3.1    Overview
during a recent campaign (Voigt et al., 2010) were employed.
   When possible, the flight path of the Falcon was di-                   In this section, we describe the observation results for eight
rected over several ground-based lidars: Munich-Maisach                   missions, partly comprising several flights. Table 2 lists
(48.21◦ N, 11.26◦ E, operated by the Meteorological Insti-                information on the 17 flights performed by the DLR Fal-
tute of the Ludwig-Maximilians University, MIM-LMU),                      con research aircraft to survey and sample the emissions of
Leipzig (51.35◦ N, 12.44◦ E; Leibniz Institute for Tropo-                 the Eyjafjalla volcano on Iceland. The table includes take-
spheric Research, IfT), Cabauw and Bilthoven, Netherlands                 off/landing times and a brief summary of the mission objec-
(52◦ N, 5◦ E, Royal Netherlands Meteorological Institute,                 tive. A compilation of the flight tracks is shown in Fig. 3.
KNMI, and National Institute for Public Health and the Envi-              Data from the instruments listed in Table 1 are available
ronment, RIVM), and Stuttgart (48.71◦ N, 9.21◦ E, Institute               for all flights with following exceptions: Impactor sampling
of Physics and Meteorology of the University Hohenheim).                  and SO2 detector were not flown on the first flight. The
   After landing and cooling of the engines (minimum 2 h                  GPaC instrument sampled large particles successfully only
duration), the Falcon engines were inspected for ash deposits             on 2 May 2010. The dew point hygrometer was only flown
or damage visually and by using boroscopy (endoscopy with                 on 8 flights between 22 April and 3 May 2010. The 2D-C
a 1.5 m flexible video probe of 5 mm diameter). Moreover,                 probe was added for all flights from 29 April onward.
samples of engine oil were analyzed in standard laboratories                 From all flights, 34 flight legs were identified, when the
for sulfur content. On 20 April, several of the fuel injec-               Falcon was clearly inside a VA plume. Table 3 lists 12 rep-
tion nozzles in the combustion chamber of the Falcon engines              resentative examples. These legs were selected based on in-
showed corrosion damage slightly exceeding standard toler-                creases in the particle concentration of coarse mode particles
ance, because of erosion since last replacement in July 2003.             and SO2 mixing ratio significantly above background. The

www.atmos-chem-phys.net/11/2245/2011/                                                        Atmos. Chem. Phys., 11, 2245–2279, 2011
2254                                  U. Schumann et al.: Airborne observations of the Eyjafjalla volcano ash cloud over Europe

Table 2. List of Falcon flights during the DLR volcanic ash missions in April/May 2010.

       Date       Take-off      Landing     Mission
                time (UTC)    time (UTC)    objective
       19 Apr    14:12:02      17:54:50     Aged ash plume over Germany and the Netherlands (air space in Europe largely closed)
       22 Apr    14:14:14      15:35:09     Lidar survey over Germany
       22 Apr    17:12:55      20:29:30     Aged ash plume south of Norway (embedded in clouds)
       23 Apr    11:45:56      14:57:46     Aged ash plume over Germany, Poland and Baltic Sea
       29 Apr    12:00:10      14:09:06     Ferry flight to Edinburgh
       29 Apr    15:39:59      18:28:50     Flight to Iceland with lidar survey of ash plume and in-situ profiling at Keflavik airport
       1 May     10:50:29      14:05:03     Lidar survey of fresh ash plume near volcano and in-situ profiling at Keflavik airport
       2 May     12:58:36      16:17:57     Flight from Keflavik to Stornoway with in-situ measurement in the top part of the fresh plume
                                            over the North Atlantic
       3 May     11:04:40      13:31:27     Ferry flight to Oberpfaffenhofen
       9 May     14:26:52      18:01:24     Aged ash plume over Germany (Munich and Stuttgart airports and air space closed for 6 h)
       13 May    10:06:25      11:20:04     Ferry flight to Niederrhein (Germany)
       13 May    12:44:26      15:49:47     Aged ash plume in the southwest North Sea
       16 May     9:11:17      11:07:31     Ferry flight to Newquay (UK)
       16 May    12:34:50      16:01:16     Aged ash plume over Irish Sea and northern England (UK air space partly closed)
       17 May    10:38:47      13:29:50     Aged ash plumes over Germany, the Netherlands and the North Sea
       17 May    14:36:54      17:57:00     Aged dense ash plume over North Sea, extensive in-situ measurement
       18 May    07:25:32      10:34:56     Aged ash plume survey over Germany and North Sea (German air space closure was under
                                            consideration)

                                                                        listed in Table 3 are the mean values over the descending
                                                                        and ascending legs over the North Sea within the altitude
                                                                        range of 3.2 to 6.3 km. Besides leg-mean values, Table 3
                                                                        also reports the maximum values of the 10-s mean values in
                                                                        these legs. Though not directly comparable, the maximum
                                                                        values are of interest because the VAAC reported maximum
                                                                        values, not mean values. The Falcon altitude above sea level
                                                                        is derived from Global Positioning System (GPS) data. The
                                                                        aerosol parameters reported in Table 3 refer to ambient pres-
                                                                        sure and temperature. Moreover, the ratio of maximum and
                                                                        mean values characterizes the scatter of the data. For anal-
                                                                        ysis of CO and O3 changes in the plumes, background con-
                                                                        centrations are estimated from the data near the plumes; for
                                                                        SO2 , a constant background of 0.2 nmol mol−1 is assumed
                                                                        for this purpose. The relative humidity RH refers to liquid
                                                                        water. The values listed were measured with the Lyman-α-
Fig. 3. Flight routes of DLR Falcon during the volcanic ash mission
                                                                        hygrometer. The CR-2 instrument results differ by less than
in April/May 2010. The photos shown in Fig. 10 were taken at the
positions identified by triangles.
                                                                        7% root-mean-square. Table 3 lists also the effective diam-
                                                                        eter Deff = 3V /(2A). In the VA plumes, the contribution to
                                                                        the total particle surface area of the Aitken mode particles in
                                                                        general exceeds that of the accumulation and coarse modes.
lidar signal was used to check whether a homogeneous ash                Therefore, it was crucial to include the Aitken mode con-
layer was detectable. Moreover, the legs were checked for               tribution in the calculation of the effective diameter. Based
consistency of the computed backward trajectories with an               on the lidar signals, many of the VA layers show a multi-
ash source from the Eyjafjalla eruption. Most legs extend               layer structure with two or even more layers separated by
over a few minutes. The variability of aerosol number con-              gaps of 100–300 m thickness with significant lower signal.
centrations over these times is considerable and about 100%             The boundaries given in Table 3 refer to the maximum ex-
(standard deviation of the average). The results for 17 May,            tent in case of multi-layers. Analysis of the lidar and in-situ

Atmos. Chem. Phys., 11, 2245–2279, 2011                                                      www.atmos-chem-phys.net/11/2245/2011/
U. Schumann et al.: Airborne observations of the Eyjafjalla volcano ash cloud over Europe 2255
Table 3. Plume properties at selected flight legs.
Leg 1 2 3 4 5 6 7 8 9 10 11 12
Position Unit Leipzig Stuttgart Munich/ Skagerrak Baltic Sea North Munich/ SW North NE North Sea Hamburg Stuttgart
Maisach Atlantic Maisach Sea England
Date d.mon 19.04 19.04 19.04 22.04 23.04 02.05 09.05 13.05 16.05 17.05 18.05 18.05
Leg start time h:min:s 15:08:35 17:18:55 17:40:15 19:10:35 12:36:57 15:11:25 14:56:15 14:11:35 14:08:35 15:50:45 09:22:35 10:13:15
Leg end time h:min:s 15:15:35 17:21:25 17:43:45 19:12:55 12:37:59 15:14:35 15:00:35 14:15:15 14:15:55 16:57:35 09:30:45 10:16:45
Longitude deg E 12.45 9.63 11.09 8.57 16.52 −15.17 12.6 1.45 −0.17 2.92 9.12 9.97
Latitude deg N 51.29 48.58 47.89 58.05 54.66 60.17 48.38 53.41 54.76 52.83 53.17 48.87
Height km 4.2. ± 0.2 3.8. ± 0.1 4.0. ± 0.1 2.6. ± 0.0 2.7. ± 0.0 3.5. ± 0.2 4.1. ± 0.2 5.1. ± 0.0 6.1. ± 0.4 5.2. ± 1.6 3.1. ± 0.1 5.2. ± 0.1
Pressure hPa 598 634.5 621 725.4 724.4 661.5 609.4 528.6 459.9 530.7 697.3 527.9
Temperature ◦C −14.4 −9.8 −10.8 −13.2 −12.8 −6.3 −11.8 −22.0 −28.5 −23.7 −7.3 −21.3
Wind speed m s−1 15.8 7.4 6.7 6.4 15.8 15.4 9.1 12.9 10.2 13.9 7.5 16.2
Wind direction deg 270 293 318 288 267 330 250 196 225 340 304 304
SO2 mixing ratio 10−9 – – – 1.8 0.6 74.9 3.6 9.7 14.3 27 14.3 4.6
CO mixing ratio 10−9 129.5 135.7 138.5 140.5 138.4 200.9 130.6 121.8 116.6 133.9 125.4 117.2
CO background 10−9 129.0 135.0 138 140.5 138.5 128.5 129.0 114.0 108.0 120.0 115.0 115.0
O3 mixing ratio 10−9 55.6 53.6 57.3 46.6 55.9 30.1 54.2 51.9 114.3 59.5 85.5 74.4
O3 background 10−9 55.0 53.5 57.0 57.0 53.0 52.0 59.0 59.0 130.0 110.0 110.0
Rel. humidity liq. % 17 17.7 13.7 56.1 66.5 59.2 74.6 49.2 8.3 32 17 11.2
N10 cm−3 744 804 586 5464 7466 6465 2080 4944 5423 4875 2179 1877
N10non−volatile cm−3 187 196 227 200 351 3334 677 189 154 215 278 219
N160 cm−3 46 44 50 39 57 422 282 78 45 175 202 75
N250non−volatile cm−3 5.6 5.2 4.3 0.9 0.9 21.2 0.9 1.4 5.6 11.4 7.0 2.3
N1500 cm−3 0.27 0.22 0.18 0.03 0.05 1.48 0.08 0.12 0.28 1.34 0.56 0.25
N6000 cm−3 0.0093 0.0048 0.0072 0.0043 0.0090 0.1129 0.0017 0.0011 0.0022 0.0840 0.0194 0.0044
Mass conc. (M) µg m−3 25 16 17 16 19 219 11 12 21 186 54 20
Mass conc. (L-H) µg m−3 17–42 13–29 12–27 11–21 13–16‡ 121–301 10–16 11–20 19–40 105–283 38–93 16–38
Max mass c. (N) µg m−3 48 22 52 40 24 558 22 32 54 544 110 52
Max mass c. (L-H) µg m−3 31–107 19–42 26–105 21–58 15–27 283–765 16–36 13–56 48–112 282–830 66–214 26–88
Deff (M) µm 1.5 1.1 1.3 0.3 0.2 1.8 0.3 0.2 0.3 2.1 1.2 0.7
Deff (L-H) µm 1.1–2.2 0.9–1.7 0.9–1.9 0.2–0.4 0.2–0.2 1.1–2.2 0.3–0.4 0.2–0.4 0.3–0.6 1.3–2.8 0.9–1.9 0.6–1.3
Dmax (M) µm 9.1 5.9 6.3 13.5 7.6 8.9 5.4 3.3 3.6 11.3 9.5 11.6
Dmax (L-H) µm 4.9–8.5 3.6–6.0 5.0–6.3 10.3–21.9 5.8–16.1 5.9–16.8 4.2–5.4 2.6–4.6 2.8–4.1 6.2–18.2 5.1–19.9 3.5–19.6
Age FLEXPART h 111 108 108 50 58 12 129 78 66 66–82 81 66
Age HYSPLIT h 105 104 105 49 40 7.1 97 71 58 76–88 100 78
Source altitude km 4.5–5.7 3.5–6 4.6–5.5 na 2.8–3.2 2.6–2.9 3–6 2–7 1.8–3 1.8–3 2.5–4.5 3–8
Source strength rel. units 5–20 3–15 3–15 0.2–1.5 0.2–3 0.5–1.5 2–10 1–6 5–20 3–50 3–15 3–15
Layer top km 5.6* 3.8 4.2 5.5** 3.4* 3.7* 4.9 5.4*** 7.0* 6.3* 3.4 5.7*
Layer bottom km 3.9* 3.5 3.9 0.7** 2.1* 1.6* 3.5 2.8*** 3.6* 3.2* 2.8 4.0*
Explanations: Height = flight altitude above sea level from Global Positioning System data, GPS. Particle number concentrations: N10 = total particles > 10 nm.
N10non−volatile = total non-volatile particles > 10 nm. N160 = accumulation mode, > 160 nm, PCASP. N250non−volatile = non-volatile particles > 250 nm, OPC. N1500 = coarse
particles, FSSP channels 11–23, > 1.5 µm for case M. N6000 = super super-coarse particles, FSSP channels 17–23, > 6 µm for case M. Mass conc. = mass concentration average.
Max mass c. = Maximum of 10-s mean values of mass concentration. Deff = 3 × specific volume/(2 × specific cross-section area) = effective diameter. Dmax = diameter of maximum
coarse mode volume-size spectrum, dV/dlogD(D). Age = plume age from backward trajectories (resolution of FLEXPART: 0.5◦ × 0.5◦ , HYSPLIT: 1◦ × 1◦ ). Altitude = altitude
above sea level of backward trajectory above the volcano. Source = source strength of volcano at the time when the trajectory started from the volcano (from Fig. 2). Layer
depth = geometrical depth of the ash layer as derived from the lidar observations (layer top/bottom values with *: include multiple layers; **: no clear layer identified; ***: tilted
layer of depth 400–700 m). ‡ : For leg 5, the mass concentration (M ) exceeds that for case H; this exception occurs once among the 34 legs analyzed, and is a consequence of a local
maximum in the volume size distribution and the different channel assignments for cases M and H.
data for 9 May over Munich show a mass detection limit for with an attached energy dispersive X-ray (EDX) detector.
separated VA layers with enhanced aerosol backscatter of the This analysis yields particle size, aspect ratio, morphology,
order of 10 µg m−3 . and the element chemical composition for each single parti-
cle. Based on morphology, chemical composition and beam
3.2 Volcanic particle properties stability, the particles are assigned to one of the following
groups: silicates, quartz, oxides, chlorides, phosphates, car-
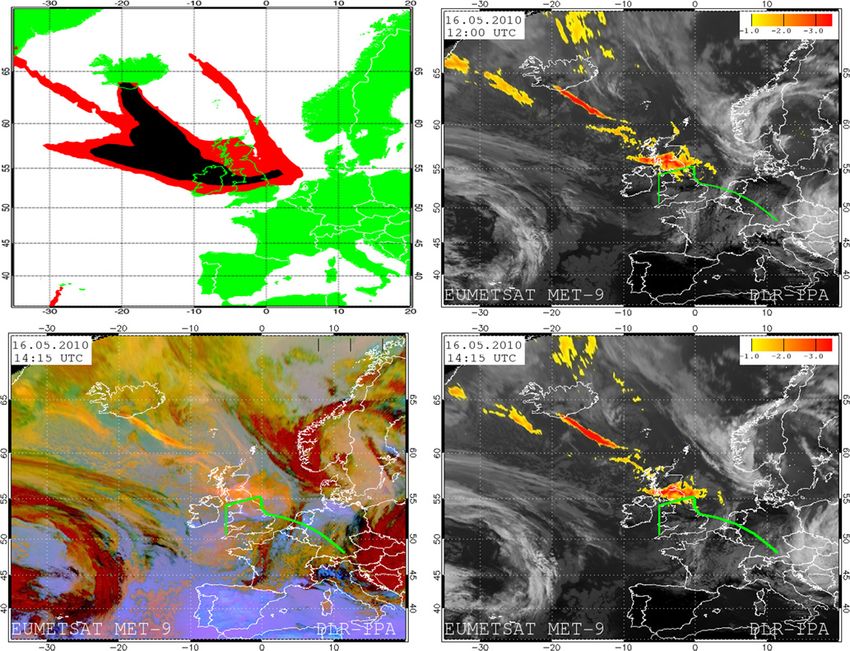
Well-loaded samples of VA particles suitable for single par- bonates, sulfates, soot, biological, secondary, and mixtures of
ticle analysis were collected by the impactor-sampling de- these groups. The particles inside VA plumes were found to
vices inside the cabin downstream of the Falcon aerosol in- consist of a mixture of ash particles and sulfuric acid droplets
let on 2 May and 17 May, legs 6 and 10 of Table 3. These or sulfate particles. Figure 4 shows typical ash particles,
samples were taken in VA clouds of different eruption pe- with maximum size of 20 µm. Figure 5 shows sulfuric acid
riods and different plume ages over the North Atlantic (7– droplets and aggregates. Based on TEM studies (selected
12 h age) and over the North Sea (60–84 h). GPaC sam- area electron diffraction) of the samples of both days, most
ples are available for 2 May. The particles were collected particles are crystalline, i.e. no glasses.
on TEM (transmission electron microscopy) grids covered
with formvar foil and adhesive carbon substrate for electron The particles collected on the TEM grids of the impactors
microscopy. In the post-flight analysis, several hundred par- operated downstream of the aerosol inlet have sizes up to
ticles were investigated in a scanning electron microscope about 3 µm (equivalent projected area diameter). The mean
www.atmos-chem-phys.net/11/2245/2011/ Atmos. Chem. Phys., 11, 2245–2279, 20112256 U. Schumann et al.: Airborne observations of the Eyjafjalla volcano ash cloud over Europe
The element chemical composition of the particles can be
used to infer the complex index of refraction with an effective
medium mixing rule (Ouimette and Flagan, 1982). Applying
this mixing rule, the real and imaginary part of the refractive
index is calculated as a linear combination of the refractive
indices of the individual components weighted by their vol-
ume fraction. The refractive index of the individual compo-
nents is taken from the literature, for details of the procedure
refer to Kandler et al. (2009). As no further phase informa-
tion on the specific iron minerals present in the volcanic dust
is available, hematite is assumed to be the main absorbing
component. The according refractive index data are taken
from Sokolik and Toon (1999). The estimated uncertainties
Fig. 4. Typical volcanic ash particles from the plume penetration
over the North Atlantic on 2 May 2010. Left: sampled inside the are 0.02 for the real part and possibly a factor of 3 for the
fuselage, right: sampled outside. Particle sizes 0.7, 2, and 20 µm. imaginary part. (Balkanski et al. (2007) estimate 0.04 and
50% for the real and imaginary part based on an extensive
study for mineral dust).
Table 4 shows the calculated refractive indices at 630 nm
and 2 µm (wavelengths of the FSSP and lidar lasers) for
2 May and 17 May. While there is no variation between the
two ash clouds for the particles smaller than 0.5 µm, consist-
ing mainly of sulfates, the data suggest larger composition
changes from 2 May to 17 May for the larger particles. There
could certainly be changes in the composition of the volcanic
Fig. 5. Examples of ammonium sulfate particles (left), a silicate
material ejected during the course of the eruption. The high-
particle with droplets of ammonium sulfate (middle) and an ag-
glomerate of large silicate particles with iron oxide (small particles;
est values of light absorption are generally found between 0.5
right) from the sample of 2 May. and 1 µm in diameter, decreasing toward larger particles sizes
in the volcanic mineral dust fraction. Particles larger than
2 µm and up to 20 µm collected with the GPaC instrument in
aspect ratio is about 1.8 for particles smaller 500 nm and the wing station showed imaginary refractive index values of
about 2 for larger particles. The relative number abundance 0.001 with low variation. While on 2 May 40% of the par-
of the different particle groups is shown for the two sampling ticles had imaginary refractive index values at 630 nm wave-
days in Fig. 6 as function of size. Below 500 nm, the aerosol length smaller than 0.0005, 47% between 0.0005 and 0.002
is dominated on both days by secondary particles (ammo- and 13% of greater than 0.002, on 17 May 64% were weakly
nium sulfates/nitrates). For the larger particles, silicates and light-absorbing (< 0.0005), 29% were between 0.0005 and
mixed particles are the most abundant groups (Fig. 4). The 0.002 and only 7% of the particles showed higher values of
mixed particles mostly consist of silicates with small ammo- greater than 0.002.
nium sulfate particles on their surface, which crystallized out The mean particle density ρP derived from the relative
of droplets (Fig. 5). number abundance of particle classes and published den-
In both samples, most silicate grains (more than 90%) are sities for the individual minerals (Tröger, 1982) is about
mixtures of various minerals. Based on the chemical com- 2.7 g cm−3 . The smaller particles with large sulfate content
position, the mixtures predominantly consist of feldspars, probably have a density similar to that of ammonium sulfate
amphiboles/pyroxenes, and pure SiO2 minerals in variable (1.77 g cm−3 ). We assumed ρP = 2.6 g cm−3 to hold for all
proportions. The composition of the silicates (external and VA layers investigated in this study.
within the mixtures) is different for the two sampling days
(reflecting variable proportions of the different silicate min- 3.3 Volcanic particle size distributions and
erals). For example, the Si/Al atomic ratio (± one-sigma mass concentrations
standard deviation) decreases from 3.6 ± 2.8 on 2 May to
2.8 ± 1.2 on 17 May indicating an increasing feldspar com- The particle size distributions and mass concentrations are
ponent. The iron content is higher on 2 May with an atomic computed from the data of the optical sensors assuming three
Fe/Si ratio of 0.33 compared to Fe/Si = 0.08 for 17 May. The different but constant particle refractive index values, and a
lower iron content will lead to less absorption in the older constant density value as given before. For the FSSP data,
plume. Furthermore, the sodium content is higher and the we consider three cases (see Table 5) which should embrace
calcium concentration lower on 17 May. the true values as low (L), medium (M) and high (H) esti-
mates. Case M is considered to serve as best guess for the
Atmos. Chem. Phys., 11, 2245–2279, 2011 www.atmos-chem-phys.net/11/2245/2011/You can also read