Animal Testing and its Alternatives - the Most Important Omics is Economics
←
→
Page content transcription
If your browser does not render page correctly, please read the page content below
Erschienen in: ALTEX ; 35 (2018), 3. - S. 275-305
                                                       https://dx.doi.org/10.14573/altex.1807041

                                                                                                    Regulation needs to catch up with innovation.
                                                                                                                                          Henry Paulson
                                                                                                                        (American public servant, 1946-)

                                                                                             Not all chemicals are bad. Without chemicals such
                                                                                          as hydrogen and oxygen, for example, there would be
                                                                                               no way to make water, a vital ingredient in beer.
                                                                                                                            David “Dave” McAlister Barry
                                                                                                                                (American author, 1947-)

Food for Thought …

Animal Testing and its Alternatives – the Most
Important Omics is Economics
Lucy Meigs 1,2, Lena Smirnova 2, Costanza Rovida 3, Marcel Leist 3 and Thomas Hartung 2,3
1 Senior, Friends School of Baltimore, Baltimore, USA; 2 Center for Alternatives to Animal Testing (CAAT), Johns Hopkins Bloomberg School of Public
Health, Baltimore, MD, USA; 3 CAAT-Europe, University of Konstanz, Konstanz, Germany

      Abstract
      For a long time, the discussion about animal testing vs its alternatives centered on animal welfare. This was a static
      warfare, or at least a gridlock, where life scientists had to take a position and make their value choices and hardly
      anyone changed sides. Technical advances have changed the frontline somewhat, with in vitro and in silico methods
      gaining more ground. Only more recently has the economic view begun to have an impact: Many animal tests are
      simply too costly, take too long, and give misleading results.
      As an extension and update to previous articles in this series written a decade ago, we reanalyze the economic
      landscape of especially regulatory use of animal testing and this time also consider respective alternative tests. Despite
      some ambiguity and data gaps, which we have filled with crude estimates, a picture emerges of globally regulated
      industries that are subject to stark geographic and sectorial differences in regulation, which determine their corre-
      sponding animal use. Both animal testing and its alternatives are industries in their own right, offering remarkable
      business opportunities for biotech and IT companies as well as contract research organizations. In light of recent
      revelations as to the reproducibility and relevance issues of many animal tests, the economic consequences of incorrect
      results and the reasons for still maintaining often outdated animal test approaches are discussed.

1 Introduction                                                               for change (Hartung, 2017c), which should prompt the strategic
                                                                             development of safety sciences (Busquet and Hartung, 2017).
About 10 years ago, work by Annamaria (“Antonella”) Bottini                     Now, it seemed timely to update these figures. In many in-
in the context of a thesis at the London School of Economics,                stances these are simple updates, e.g., the animal use figures in
Milan Campus, co-supervised by one of the authors (T.H.), led                Europe from 2005 were adapted to the most recent available val-
to a series of publications that addressed economic aspects,                 ues, i.e., 2011. The costs of animal tests had relied on Fleischer
globalization, and the regulatory acceptance process of animal               (2007) and were updated now with data from our own survey.
testing and its alternatives (Bottini et al., 2007, 2008; Bottini and        Very often, websites served as sources, such as those of trade as-
Hartung, 2009, 2010). Astonishingly, there was hardly any study              sociations or simply Wikipedia. We cannot quality-control these
reported before that addressed this aspect of the debate and the             sources and where discrepant data are found, they are simply
articles in this series, especially Bottini and Hartung (2009), con-         presented as such. Some discrepancies arise as different report-
tinue to attract many readers: As one indicator, about 10% of the            ing years are found in the sources.
70,000 reads of articles by T.H. on ResearchGate are owed to this               In general, data from the last decade were considered ade-
article. Economic aspects actually constitute an important driver            quate. The restriction to sources in English and German leads

Received July 4, 2018;                                                       This is an Open Access article distributed under the terms of the Creative Commons
© The Authors, 2018.                                                         Attribution 4.0 International license (http://creativecommons.org/licenses/by/4.0/),
                                                                             which permits unrestricted use, distribution and reproduction in any medium, provi-
ALTEX 35(3), 275-305. doi:10.14573/altex.1807041                             ded the original work is appropriately cited.
Correspondence: Thomas Hartung, MD PhD, Johns Hopkins Bloomberg School
of Public Health, Center for Alternatives to Animal Testing (CAAT),
615 N Wolfe St., Baltimore, MD, 21205, USA
(THartun1@jhu.edu)

ALTEX 35(3), 2018                                                                                                                                           275
                                                   Konstanzer Online-Publikations-System (KOPS)
                                          URL: http://nbn-resolving.de/urn:nbn:de:bsz:352-2-18z7vzsxqghdv9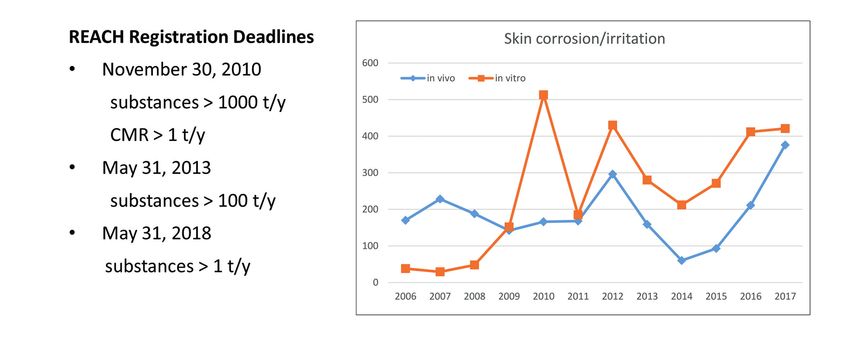
Meigs et al.

to an unavoidable trans-Atlantic focus and often only rough
estimates of the situation in South-American or Asian countries
and elsewhere is possible. All numbers are given in US$ or
€ and, where necessary, a conversion rate of 1.3 was used, which
was roughly the exchange rate earlier in this decade when most
reports used here originated. The report is structured by product
sectors and this time also includes medical devices and tobacco
products, the latter mainly because of the emerging testing needs
for lower risk tobacco products.
   We focus again on regulatory testing and product develop-
ment, i.e., the industrial uses of animal testing and its alterna-
tives. Regulatory testing is still a necessary evil. Dee Hock, the
former CEO of the Visa credit card association said, “Heaven is
purpose, principle, and people. Purgatory is paper and proce-
dure. Hell is rules and regulations.” With notable differences in
approaches on both sides of the Atlantic, Europe has become a
pacemaker of regulation with international consequences, while
the US, which was rather light on regulations in many areas
already, as will be discussed in more detail, goes even further
in this direction under the current administration: To quote the
current president, “Excessive regulation is costing America as
much as $2 trillion a year. And I will end it very, very quickly”
(Donald Trump). As a consequence, companies in the US have
to worry mainly about product liabilities in court (“Tort Law”)
(Silbergeld et al., 2015), while in Europe, after more extensive
testing requirements, companies are largely protected from such
liability claims.                                                              Fig. 1: Number of animals in percentages used in the EU for
                                                                               scientific purposes
                                                                               Adapted from1
2 Animal testing by numbers

Taylor et al. (2008) wrote “Relatively few countries collate and               France for 2010). This is a reduction of over half a million ani-
publish animal use statistics, yet this is a first and essential step          mals used in the EU from the number reported in 2008. Notably,
toward public accountability and an informed debate, as well                   the three-year-reporting cycle was interrupted by the introduction
as being important for effective policy-making and regulation”.                of the new Directive 2010/63/EU2 for the protection of laboratory
They found estimates of worldwide annual laboratory animal                     animals (summarized in Hartung, 2010a); the next statistics will
use for 2005 ranging from 28-100 million. Their own estima-                    be published only in November 2019 and will likely not be com-
tion, the best we are aware of, collated data for 37 countries                 parable because of the altered reporting standards.
that publish national statistics, standardized these against the                  For 2011, as found in previous reports, rodents and rabbits ac-
European definitions and developed a statistical model, based on               counted for 80% of the total number of animals used in the EU.
publication rates, for a further 142 countries. This yielded their             Mice were the most commonly used species with 61% of the total
most conservative estimate of global animal use of 58.3 million                use, followed by rats with 14%. The second most commonly used
animals in 179 countries as of 2005. By extrapolation, the ani-                group of animals was, as in previous years, the ectotherm animals
mals killed for the provision of tissues, animals used to maintain             (reptiles, amphibians, fish), which represented almost 12.4%. The
genetically-modified strains, and animals bred for laboratory use              third largest group of animals used was birds with 5,9% of the
but killed as surplus to requirements were added, resulting in                 total use. The Artiodactyla and Perissodactyla groups including
115.3 million animals.                                                         horses, donkeys and cross-bred animals, pigs, goats, sheep and
   In the EU, the total number of animals used for experimental                cattle make up 1.3% of the total number of animals used for sci-
and other scientific purposes (Daneshian et al., 2015) from the                entific purposes in the EU. Carnivores (which include dogs and
data collected in 20111 in accordance with the provision of the                cats) represent 0.25% and non-human primates represent 0.05%
Directive for this report is just under 11.5 million (with data from           of the total number of animals used in 2011 (Fig. 1).

All websites were accessed in June/July 2018.
1 http://eur-lex.europa.eu/legal-content/EN/TXT/HTML/?uri=CELEX:52013DC0859&from=EN
2 https://eur-lex.europa.eu/legal-content/EN/TXT/?uri=celex%3A32010L0063

276                                                                                                                              ALTEX 35(3), 2018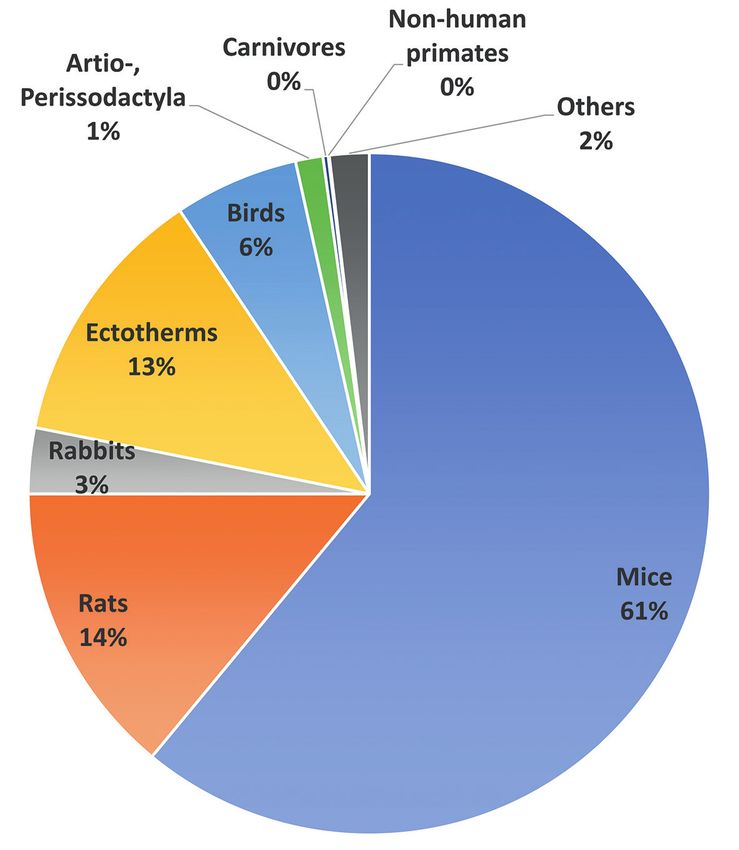
Meigs et al.

                                                                                         Tab. 1: Number of animals used for scientific purposes
                                                                                         in the USA in 201610

                                                                                           Species                   Number        % of          % change
                                                                                                                     of            total         from 2015
                                                                                                                     animals

                                                                                           Guinea pigs                183,237        22.3%         6%

                                                                                           Rabbits                    139,391        17.0%         1%

                                                                                           Hamsters                   102,633        12.5%         4%

                                                                                           Non-human primates          71,188         8.8%        15%

                                                                                           Dogs                        60,979         7.4%         0%

                                                                                           Pigs                        50,226         6.1%         8%

                                                                                           Cats                        18,898         2.3%        -5%

                                                                                           Sheep                       12,196         1.5%        14%

                                                                                           Other farm animals          40,597         2.5%         0%

                                                                                           Other covered species      161,467        19.7%        24%

                                                                                           Total                      820,812      100.0%        6.9%

                                                                                         10 https://speakingofresearch.com/facts/animal-research-statistics/

Fig. 2: Animal use for scientific purposes by purpose
of the experiments
Adapted from1

   Around 65% of animals were used for research and devel-                               but were not involved in any research studies. Direct comparison
opment in the fields of human medicine, veterinary medicine,                             with the EU statistics is impossible as there is no clear relation-
dentistry, and in biological studies of a fundamental nature. Pro-                       ship. For example, the EU uses proportionally many more rab-
duction and quality control of products and devices in human                             bits and fewer hamsters than the US and therefore basing a guess
medicine, veterinary medicine, and dentistry required 14% and                            of the number of rats and mice used in the US on EU percentages
other safety evaluation represented 8.75% of the total number of                         of species would lead to an unacceptably large error. It is pos-
animals used for experimental purposes (Fig. 2).                                         sible that the US is actually using many more rodents as such
   The data from 2011 still seem to be quite representative as,                          experiments require a minor level of authorization compared to
for example, numbers released every year by the UK Home Of-                              the EU. The pro-animal research advocacy group Speaking of
fice on animal research in Great Britain3 have remained stably                           Research stated5, “In the UK, where mice, rats, fish and birds
around 4 million and in Germany around 3 million4 in the years                           are counted in the annual statistics, over 97% of research is on
since then.                                                                              rodents, birds and fish. Across the EU, which measures animal
   In the US5, overall, the number of animals used for scientific                        use slightly differently, 93% of research is on species not counted
purposes covered by the Animal Welfare Act rose by 6.9% from                             under the Animal Welfare Act (AWA). If similar proportions were
767,622 (2015) to 820,812 (2016) (Tab. 1). This includes both                            applied the US, the total number of vertebrates used in research
public and private institutions. These statistics do not include                         in the US would be between 12 and 27 million, however, there
all animals as mice, rats, birds and fish are not covered by the                         are no published statistics to confirm this.”
US Animal Welfare Act – though they are still covered by other                              In Canada6, in 2016, 4.3 million animals were used in research,
regulations that protect animal welfare. They also do not include                        teaching, and testing as reported to the CCAC (Canadian Coun-
the 137,444 animals that were kept in research facilities in 2016                        cil on Animal Care). The three animal types most often used in

3 https://speakingofresearch.com/facts/uk-statistics/
4 https://speakingofresearch.com/facts/animal-research-statistics/german-animal-research-statistics/
5 https://speakingofresearch.com/2017/06/19/usda-publishes-2016-animal-research-statistics-7-rise-in-animal-use/
6 https://www.ccac.ca/Documents/AUD/2016-Animal-Data-Report.pdf

ALTEX 35(3), 2018                                                                                                                                         277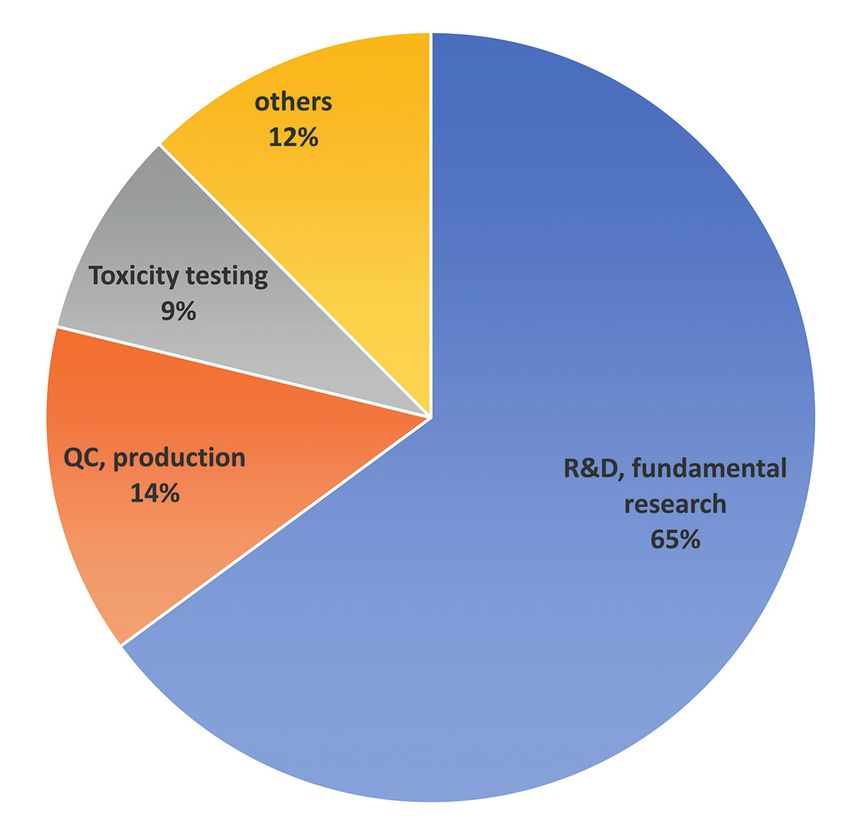
Meigs et al.

2016 were fish (37.2%), mice (34.8%), and cattle (12.2%). The                            − New regulatory programs such as REACH (Registration,
majority of animals (57.3%) were used in studies of a funda-                                Evaluation, Authorisation and Restriction of Chemicals; EC,
mental nature/basic research, representing 2.6 million animals7.                            2006) have created additional testing demands.
14.1% were used for studies for the development of products or                           − The use of alternatives is hindered by non-acceptance in some
appliances for human or veterinary medicine; 12.8% were for                                 regions of the world so that global industries have to do the
studies for medical purposes, including veterinary medicine, that                           animal test anyway.
relate to human or animal diseases or disorders; 9.7% were for                           − The implementation of alternatives lags behind (see, for ex-
teaching and training to communicate scientific concepts and                                ample, pyrogen testing, Hartung, 2015)
develop practical skills and expertise in specific techniques; and                       Overall animal use reduction is probably the wrong metric of
6.1% served for regulatory testing of products for the protection                        success (Leist et al., 2008): Many uses of alternatives are not
of humans, animals, or the environment.                                                  recorded as such. Outside regulatory toxicology, in vitro and in
   The total number of animals used in Australia8 in 2015 was                            silico technologies are indeed being used to a very large extent,
over 9.9 million. South Korea reported 3 million animals in                              and their everyday implementation by far exceeds public percep-
20179 (up 7.2% from the previous year), Norway 11.6 million                              tions. The performance of the new animal-free approaches is often
(notably, two large projects on salmon vaccination alone rep-                            so high that they have made animal experimentation obsolete or
resented 10.5 million), New Zealand 200,000 in 2015, Israel                              reduced it by 80% and more. In addition to the substitution of
1.2 million in 2017 and Switzerland 600,000 animals in 201610.                           in vivo testing, the in vitro and in silico approaches are used as
   In summary, world-wide animal use appears relatively stable                           enabling technologies in many fields, sometimes complementing
in recent years and the earlier studies (Taylor et al., 2008; Bottini                    data obtained from animals, sometimes providing for entirely new
and Hartung, 2009; Daneshian et al., 2015) are not challenged                            information. Important use areas comprise among others:
in this respect. An overall market size of about €3 billion for                          − Drug discovery: Since the peak times of animal-based screen-
regulatory animal testing as calculated in 2008 is probably still                           ing in the 1970s and 80s, the use of animals in this area has
realistic, but we will attempt to refine this below. Quite reassur-                         been reduced by > 80%; there has been, for example, a steady
ing, MarketsandMarkets released a report on February 15, 201811                             increase in the use of in vitro tests by the pharmaceutical in-
stating, “The in vivo toxicology market is expected to reach USD                            dustry between 1980 and 2013 (Goh et al., 2015).
6.14 Billion by 2022 from an estimated USD 4.40 Billion in 2017,                         − Non-regulatory toxicology and internal prioritization of
at a CAGR of 6.9% … In 2017, the US is estimated to account                                 drugs: Non-animal approaches, such as testing for hERG
for the largest share of the in vivo toxicology market, followed                            channels, mutagenicity, cytotoxicity, etc. are being used from
by Germany and the UK. However, China is expected to grow at                                the earliest stages of chemical profiling; hundreds of methods
the highest CAGR during the forecast period”. The compound                                  have been evaluated for specific use within companies, with-
annual growth rate (CAGR) is the mean annual growth rate of an                              out ever undergoing an official evaluation by EURL-ECVAM,
investment over a specified period of time longer than one year.                            the OECD, or other (inter)national validation bodies.
                                                                                         − Basic biological research and biomedical research: Here, the
                                                                                            number of animals used per publication has been continuously
3 Alternative methods                                                                       decreasing over the past 10-20 years, as these approaches have
                                                                                            been (i) either completely substituted, e.g., by use of human
There are about 50 validated and, in part, accepted alternative                             stem cells, or (ii) as in vitro and in silico approaches are being
methods12,13,14. These approved, mainly in vitro methods, have                              used to complement animal data and thus reduce the need for
not changed gross animal use. Reasons are multiple:                                         large animal numbers. Put simply, the number of researchers is
− Most work on alternatives addresses only toxicological tests                              continuously increasing but animal numbers are largely stable:
  (7-10% of animal use) (Daneshian et al., 2015).                                           For example, the number of researchers increased by almost
− The replaced tests were mostly acute and topical tests with                               a third (32.2%) in the EU from 2006 to 2016, from 1.42 to
  relatively small animal numbers.                                                          1.88 million15.
− The reductions in animals are (over-)compensated by rising                             − Vaccines: Enormous progress has been made in the areas of
  numbers in basic research, especially genetically modified                                safety, quality and efficacy testing of vaccines, where alterna-
  mice (Daneshian et al., 2015).                                                            tives replace animal-based tests16,17.

7 https://www.ccac.ca/Documents/Publications/CCAC-Facts-and-Figures.pdf
8 http://www.humaneresearch.org.au/statistics/statistics_2015
9 https://speakingofresearch.com/2018/04/12/rise-in-animal-research-in-south-korea-in-2017/
10 https://speakingofresearch.com/facts/animal-research-statistics/
11 https://www.marketsandmarkets.com/PressReleases/in-vivo-toxicology-testing.asp
12 http://alttox.org/mapp/table-of-validated-and-accepted-alternative-methods/
13 https://ntp.niehs.nih.gov/pubhealth/evalatm/accept-methods/index.html
14 https://eurl-ecvam.jrc.ec.europa.eu/validation-regulatory-acceptance
15 http://ec.europa.eu/eurostat/statistics-explained/index.php/R_%26_D_personnel
16 https://eurl-ecvam.jrc.ec.europa.eu/alt-animal-testing-safety-assessment-chemicals/alt_test_biological_vaccines
17 https://ntp.niehs.nih.gov/pubhealth/evalatm/test-method-evaluations/biologics-and-vaccines/vaccine-testing/index.html

278                                                                                                                                           ALTEX 35(3), 2018
Meigs et al.
Tab. 2: Market sizes and estimated growth by MarketsandMarkets™
A compilation of study summaries with compound annual growth rates (CAGR) from advertisements of the company is given.
Market Current worth Projected worth CAGR (%)
in billion US$ (year) in billion US$ (in year)
High Throughput Screening 13.73 (2013) 19.63 (2018) 7.4
Global Pyrogen Testing 0.46 (2014) 0.82 (2019) 12.2
Global Mycoplasma Testing 0.34 (2014) 0.61 (2019) 14.6
Global Metabolomics 0.57 (2014) 2.10 (2019) 30
Live Cell Imaging 3.57 (2014) 5.45 (2019) 8.8
Global Biologics Safety Testing 1.76 (2014) 3.13 (2018) 12.2
Cell Analysis Market 19.0 (2015) 26.0 (2020) 6.6
Global Cell Culture 11.31 (2015) 18.63 (2020) 10.5
Biochips 7.63 (2015) 17.75 (2020) 14.6
Global Cell-based Assays 10.80 (2015) 18.33 (2020) 11.6
Mouse Model 1.05 (2015) 1.49 (2020) 7.1
Cellular Analysis 28.66 (2016) 41.34 (2021) 7.6
Global Metabolomics 1.03 (2016) 2.39 (2021) 14.6
Biomarkers 27.95 (2016) 53.34 (2021) 13.8
Global Vaccines 32.24 (2016) 48.03 (2021) 8.3
3D Cell Culture 0.47 (2016) 1.35 (2021) 23.6
Global Pyrogen Testing 0.61 (2016) 1.09 (2021) 12.2
Blood Collection 7.65 (2016) 9.90 (2021) 5.3
In Vitro Toxicology Testing 14.15 (2016) 27.36 (2021) 14.1
Global Stem Cell Banking 1.58 (2016) 3.96 (2021) 20.2
Global Regenerative Medicines 17.06 (2016) 49.41 (2021) 23.7
Research Antibodies 9.33 (2017) 12.60 (2022) 6.2
In Vivo Toxicology 4.40 (2017) 6.14 (2022) 6.9
Organs-on-Chips 0.001 (2017) 0.005 (2022) 36.6
In Vitro Toxicology Testing 6.34 (2017) 8.74 (2022) 6.6
3D Cell Culture 0.68 (2017) 1.72 (2022) 20.3
Biological Safety Testing 2.75 (2017) 4.90 (2022) 12.2
Cell Based Assays 13.34 (2017) 19.92 (2022) 8.4
Next Generation Sequencing 5.02 (2017) 12.45 (2022) 20.5
Protein Assays 1.42 (2017) 2.41 (2022) 11.1
Human Liver Models 1.35 (2017) 2.56 (2022) 3.6
Stem Cell Banking 6.28 (2018) 9.30 (2023) 8.2
In Vitro Lung Model 0.19 (2018) 0.42 (2023) 17.5
Stem Cell Assay 0.79 (2018) 1.98 (2023) 20.1
Neuroscience Antibodies and Assays 2.57 (2018) 4.18 (2023) 10.2
ALTEX 35(3), 2018 279Meigs et al. − Biologics: Recombinant proteins used as drugs (e.g., calci- 4 Animal testing and the contract research industry tonin or insulin) pose large problems for animal-based testing and, accordingly, many alternative tests have been developed Most animal testing and alternative methods are currently out- in this particular field. sourced to contract research organizations (CRO). Only a few − Clostridial neurotoxins: Large research programs have led to large companies keep experimental toxicologists on staff. Most, multiple non-animal test methods in this field. For instance, however, have only regulatory toxicologists who commission several proprietary assays are available for the quantification testing. We have argued earlier that the pressure to move from of Botulinum neurotoxin A bioactivity. This is of high impor- animals to new approaches is actually a business opportunity tance for products such as “BOTOX” that required hundreds (Goldberg and Hartung, 2008). of thousands of animals for potency testing18. MarketsandMarkets states, “Some key factors driving market Some economical metrics of success of new approaches could growth are the increasing pharmaceutical R&D activities, man- be market sizes for these technologies (Tab. 2): Estimates from datory government regulations for animal testing, innovations MarketsandMarkets, who see in vivo toxicology in 2017 at $4.4 in animal models, and the development of exclusive in vivo tox- billion, see the in vitro toxicology testing market at an estimated icology tests. Factors such as increasing research in oncology $6.3 billion in 2017 (press release December 21, 2017), with and personalized medicine and the rising demand for humanized a CAGR of 6.6%. They see the global cell culture market at animal models are expected to offer lucrative opportunities for $11.3 billion in 2015 (press release November 20, 2017), players in the global market.” The following views were made with a CAGR of 10.5%. In another report (press release July publicly available: 10, 2017), they estimate the cell-based assay market at $13.3 − In 2017, the consumables segment is expected to account for billion in 2017, at a CAGR of 8.4%. The prohibitive pricing the largest share of the global market. The large share of this makes the reports themselves inaccessible for academia, but segment is attributed to the increasing R&D funding for the assuming a similar approach in the various reports and taking development of new transgenic animal models, advancements the summary results at face-value, the press releases indicate in the development of genetically modified animals, and in- that an economy of alternative approaches has developed that creasing pharmaceutical research for developing new drug is outperforming traditional animal testing. This is in line with molecules. our observations that increasing numbers of biotech companies − In 2017, the chronic toxicity testing segment is expected to are exhibiting at the pertinent conferences and that alternative account for the largest share of the global market. Increasing methods are now offered in the portfolio of contract research research focused on drugs used for long-duration therapies organizations (CRO). such as anti-cancer, anti-convulsive, anti-arthritis, and anti-hy- In conclusion, new tests and services are flourishing as part pertensives is driving the growth of the chronic toxicity test- of the biotech revolution. It is extremely difficult to distinguish ing market. However, the sub-acute toxicity testing segment what tests are in fact replacing directly animal testing and what is expected to register the highest CAGR during the forecast tests are reducing demands for in vivo tests through technolog- period. ical progress. Often the new in vitro and in silico approaches − The immunotoxicity segment is expected to account for the are enabling technologies, which can do much more than just largest share of the global market in 2017, followed by the replace an animal test. Outside of regulatory testing, where we systemic toxicity segment. The rising demand for the develop- have a formal acceptance step and can monitor animal numbers, ment of biologics and biosimilars is driving the growth of the it is much more difficult to quantify market shares versus animal immunotoxicity segment. reduction. The estimates from market research organizations − Based on the testing facility, the global in vivo toxicology are the best proxy here. A number of market research compa- market is segmented into outsourced testing facilities and in- nies monitor technologies and industries relevant to compound house testing facilities. In 2017, the outsourced testing facili- regulation. These reports are in general too costly for academia. ties segment is expected to account for the largest share of the However, the public teasers allow extraction of market sizes and global market. The large share of this segment is attributed projections, as at least MarketsandMarkets typically includes to the increasing R&D investments and cost-saving strategies these parameters. of pharmaceutical, biopharmaceutical, and medical device Table 2 shows these numbers over the last five years. Notably, companies, which in turn results in increasing outsourcing of source data and methods cannot be scrutinized. It is our personal services to CROs. impression that numbers tend to be inflated, but at least a similar − Geographically, North America is estimated to dominate the approach in the various reports can be assumed. Although these market in 2017 with the highest market share in the in vivo figures have to be taken with a grain of salt, they do provide a toxicology market. The largest share of this regional segment basis for interesting comparisons. The compound annual growth is attributed to the increasing investments in R&D activities, rates (CAGR) are quite remarkable in these biotech sectors. scientific developments in biotechnology, and the presence 18 Addressed in an ICCVAM/NICEATM/ECVAM Scientific Workshop on Alternative Methods to Refine, Reduce, and Replace the Mouse LD50 Assay For Botulinum Toxin Testing (November 13-14, 2006, Silver Spring, MD; http://iccvam.niehs.nih.gov/docs/biologics-docs/BoNTwkshprept.pdf) 280 ALTEX 35(3), 2018
Meigs et al.

   of major pharmaceutical and preclinical testing companies in                            6. Pharmaceutical Product Development (PPD) ($1.90 bil-
   the region. However, Latin America (LATAM) is expected to                                   lion revenues in 2017)
   grow at the highest CAGR during the forecast period. Factors                            7. Charles River Laboratories International Inc. (CRL)
   such as the flourishing pharmaceutical and biopharmaceuti-                                  ($1.86 billion revenues in 2017)
   cal industry in Brazil are in turn propelling the drug devel-                           8. ICON Public Limited Corporation ($1.76 billion revenues
   opment activities and increases in the number of CROs that                                  in 2017)
   offer cost-effective in vivo toxicology services are driving the                        9. Wuxi Apptec ($1.01 billion revenues in 2017)
   growth of the global market in Latin America.                                           10. Medpace Holdings, Inc. ($0.44 billion revenues in 2017)
− While the overall in vivo toxicology market is expected to                            Two examples of those more prominent in toxicology: Charles
   grow at a high rate, growing pressures to develop and conduct                        River Laboratories, for example, achieved a revenue of $1.13
   alternatives to animal testing and disadvantages associated                          billion in 2012 with 7,500 employees22. Covance reached a rev-
   with the latter are likely to restrain the growth of this market                     enue of $2.6 billion in 2013 with a net income of $179.2 million
   to a certain extent.                                                                 with more than 12,500 employees23.
Wikipedia19 states that as of 2013, there were over 1,100 CROs                             Large parts of commercial animal testing are executed by CROs
in the world, despite continued trends toward consolidation.                            as companies tend to outsource routine testing. Fleischer (2007)
The industry is fragmented, with the top ten companies con-                             assessed prices and capacities in 2007. During the past years of
trolling 55% of the market in 2009. The market was seen for                             activity in the preparation of REACH registration dossiers, some
2018 by Statista20 at $79 billion, with $7.4 billion for discovery,                     quotations were collected (by C.R.) from different CROs that were
$11.2 billion for preclinical development and safety, $58.5                             offering the service. For confidentiality reasons, no indication of
billion for clinical development, and $2.3 billion for central                          the name of the CRO and no reference to the substance are given.
laboratory.                                                                             Table 3 reports the summary of this survey, separating the price
   The major players in the global market include ThermoFisher                          for each individual OECD TG that is generally requested to fulfil
(US), Danaher (US), Charles River (US), Covance (LabCorp),                              the correspondent REACH endpoint. Even though the data set is
Eurofins (Luxembourg), Envigo (US), DSI (US), and The Jack-                             insufficient to allow a good statistical assessment, these numbers
son Laboratory (US). IgeaHub21 considered the top CROs by                               give a realistic picture of the situation as per experience. The costs
revenue to be:                                                                          of good GLP facilities located in the EU are generally comparable
   1. Laboratory Corporation of America Holdings (Covance)                              and only minor cases of large differences were recorded. There are
       ($10.44 billion revenues in 2017)                                                also many examples of quotations from the same lab made in dif-
   2. IQVIA ($9.74 billion revenues in 2017)                                            ferent years, typically from 2010 to 2018. In general, over this time
   3. Syneos Health ($2.67 billion revenues in 2017)                                    there was an increase in the cost of in vivo studies and a decrease
   4. Paraxel International Corporation ($2.44 billion revenues                         in the cost of the new in vitro methods (skin/eye irritation, skin
       in 2017)                                                                         sensitization), considering also that the first proposals were offered
   5. PRA Health Sciences ($2.26 billion revenues in 2017)                              when the corresponding OECD guidelines were not yet available.

19 https://en.wikipedia.org/wiki/Contract_research_organization
20 https://www.statista.com/statistics/814232/total-addressable-cro-market-estimates-worldwide-by-function/
21 Luca Dezzani (2018-03-15). “Top 10 Global CROs 2018”. IgeaHub Pharmaceutical Club. Retrieved 2018-06-25. (cited from Wikipedia19)
22 https://en.wikipedia.org/wiki/Charles_River_Laboratories#Animal_rights_issues
23 https://en.wikipedia.org/wiki/Covance

Tab. 3: Price ranges for OECD test guideline studies by various contract research organizations
The costs in column “Full test” are the result of the average of all costs collected in the CRO proposals, indicating in brackets the lowest and
highest cost. The column “Full test (extensions)” includes extra costs that should be added.

 Endpoint OECD TG                                                        Average cost        Pre-test         Full test     Full test         Analytical
 		                                                                      (x €1,000) 		                        average cost (extension)        determination
 		                                                                      (Fleischer et al., 		                (lowest and 		                  of the dose
 		                                                                      2007)		                              highest cost)
 Skin Irritation (in vivo)                          439                  1.1                                  1.2                             not required
 Skin Corrosion (in vitro)                          431                  not yet available                    3.9                             not required
 Skin Corrosion (in vitro)                          435                  not yet available		                  2.4		                           not required
 Skin Irritation (in vitro)                         439                  not yet available                    2.5 (1.9-4.5)                   not required
 Eye Irritation (in vivo)                           405                  1.1                                  1.2                             not required
 Eye Irritation (in vitro) BCOP                     437                  not yet available		                  1.8 (1.6-2.0)		                 not required

ALTEX 35(3), 2018                                                                                                                                         281
Meigs et al.
Endpoint OECD TG Average cost Pre-test Full test Full test Analytical
(x €1,000) average cost (extension) determination
(Fleischer et al., (lowest and of the dose
2007) highest cost)
Eye Irritation (in vitro) 492 not yet available 4.2 (4.1-4.3) not required
Skin Sensitization (LLNA) 429 3.29 4.7 (3.7-6.0) not required
Skin Sensitization (modified LLNA) 442B not yet available 4.3 (4.0-4.6)a not required
Skin Sensitization 429 R 2 Never not required
proposed
Skin Sensitization (Guinea pig methods) 406 4 71.5 (6.8-75.5) 1.1 not required
Skin Sensitization (DPRA) 442C not yet available 3.8 (2.2-6.8) not required
Skin Sensitization (LuSens) 442D not yet available 3.7 (3.0-4.3) not required
Skin Sensitization (hCLAT) 442E not yet available 6.9 (6.6-7.2) not required
Oral Acute Toxicity (in vivo) 420, 423, 425 1.5 1.5 1.1 not required
Inhalation Acute Toxicity (in vivo) 403 11.7 3.9b not required
Dermal Acute Toxicity (in vivo) 402 2 1.5 (1.0-2.0) 2 not required
Acute Toxicity (in vitro) 3T3 NRU not yet available 4.5 not required
Repeated Dose Toxicity (28d oral) 407 49.4 11.5 46.5 8.5 9.3
(54.7-35.0)c
Repeated Dose Toxicity (28d, dermal) 410 49.6 42d
Repeated Dose Toxicity (28d, inhalation) 412 105.5 64.5 e
Repeated Dose Toxicity (90d, oral) 408 115.7 10 105.6 12
(87.2-161.2) f
Repeated Dose Toxicity (90d, dermal) 411 135 120g 19.5
Repeated Dose Toxicity (90d, inhalation) 413 250 137.6h
Mutagenicity (Ames test, 5 strains) 471 3.2 3.8 (3.4-4.2) 0.5 not required
Mutagenicity (In vitro micronucleus test) 487 8.5 (6.6-11.0) 4.5 not required
Mutagenicity (In vitro mammalian 473 11-19.2 13.2 7.3 not required
chromosome aberration test) (12.5-13.5)
Mutagenicity (In vitro mammalian 476 17.2 14.3 4.5 not required
chromosome aberration test) (11.9-17.8)
Mutagenicity (in vivo) 475 62.5d
Carcinogenicity 451 780.4 700
Reproductive Toxicity 421 54.6 10.5 63.2 9.3
(55.5-78.5)
Reproductive Toxicity 422 92 18.8 112 (75-152.4) i 9.3
Reproductive Toxicity 414 (rat) 63.1 23 77.7 (75-90) j 12
Reproductive Toxicity 414 (rabbit) 92.5 40 126d 12
Reproductive Toxicityk 416 328
Reproductive Toxicityk 416 481
(2nd species)
282 ALTEX 35(3), 2018Meigs et al.
Endpoint OECD TG Average cost Pre-test Full test Full test Analytical
(x €1,000) average cost (extension) determination
(Fleischer et al., (lowest and of the dose
2007) highest cost)
Extended one-generation reproductive 443 not yet available missing 566 l 180.4 missing
toxicity study (EOGRTS)
Reproductive Toxicitym 426 1100
Bioaccumulation (fish) 305 10 11.4b missing
Growth inhibition study on algae 201 4.5 3.5 (2.5-6.0)n 6.5
Short term acute toxicity study on 202 3.7 0.5 3.2 (1.7-5.5)n 1.5 6.5
daphnia
Long term toxicity study on daphnia 211 13.4 11.4 missing
(21 d)
Short Term Toxicity (fish) 203 4.2 0.5 3.8 (2.0-6.5)n 1.5 6.5
o
Long Term Toxicity (fish) 210 (212, 215) 26.3 8.6 5.4 5.1
Avian Toxicitym 205, 223 96.2
Short term toxicity testing on 207 4.2 3.6 b missing
earthworms
Short term toxicity testing on plants 208 7.6 18.4 5.6
(12.1-27.6)
a Lower price than some years ago; OECD TG 442A never proposed; b Chinese notification; cAll oral, rat. 13,000€ (excluded) for Chinese
notification. The lowest cost comes from a lab with an Indian facility; d Only one quotation; e Never requested. Cost from the price list of an Indian
lab; f All oral, rat. Highest cost from 2018. Same lab in 2012, much lower price. 22,100€ (excluded) for a Chinese notification; g Never requested.
Cost from the price list of an EU lab; h Never requested. Cost from the price list of an Indian lab; iAll oral, rat. Highest cost from 2018. Same
lab in 2012, much lower price; j No difference between gavage or diet; kGenerally replaced by OECD TG 443; l Never requested. Cost from the
price list of an EU lab; m Never requested; n No big difference since 2010 and no big difference to Chinese labs. More importance to the protocol
(static, semi-static, WAF, etc.); o From a price list
In many cases, a pre-test is necessary to define suitable doses according to the GLP requirements and this procedure may
for the main experiments. It may happen that the pre-test needs strongly increase the final costs.
to be repeated to refine these values, though this is fairly rare. The table also lists the average costs as reported by Fleischer
The extra costs (Tab. 3, “Full test (extensions)” column) may (2007). A comparison with the new collected costs reveals that
arise as a follow up of the main study, for example to repeat these numbers are still roughly valid. The only problem is that
an ambiguous experiment or to introduce a new biochemical Fleischer did not consider the additional costs derived from the
endpoint or a new tested dose. The extent of this cost is variable pre-tests and the need for the analytical determinations.
as it strongly depends on the result of the main experiment. The A list of study costs, apparently mostly from the US, was com-
standard acute aquatic tests usually begin with the limit dose and piled by the Humane Society International24 (Tab. 4), contrast-
new experiments are added if some toxicity is recorded. Another ing them with the respective in vitro alternatives.
high variable cost is the analytical determination of the doses, The European REACH regulation (EC, 2006) was adopted
which is mandatory for GLP studies. This cost depends on the to improve the protection of human health and the environment
analytical technique that is used, ranging from ICP for metals from the risks that can be posed by chemicals while enhancing
to HPLC for standard organic substances. Many chemicals are the competitiveness of the EU chemicals industry. REACH cov-
UVCB (Unknown Variable Composition Biological materials) ers also older chemicals on the market. There now is an increas-
and the analytical determination requires the development of a ing number of new regulatory schemes / amendments of existing
customized method that can be very expensive. The costs report- regulations in other countries (Canada, China, Korea, Malaysia,
ed in this column represent only the analysis performed during Russia, Taiwan, Turkey, USA, etc.). The different legislations
the main test. The analytical method requires a full validation and legislative proposals have some similarities with REACH
24 http://www.hsi.org/issues/chemical_product_testing/facts/time_and_cost.html
ALTEX 35(3), 2018 283Meigs et al.
Tab. 4: Prices for OECD TG studies and their alternatives compiled by the Humane Society International 24
Type of Toxicity Test Type Study Cost (US$)
Genetic toxicity
Chromosome aberration animal test $30,000
in vitro test $20,000
Sister chromatid exchange animal test $22,000
in vitro test $8,000
Unscheduled DNA synthesis animal test $32,000
in vitro test $11,000
Eye irritation/corrosion
Draize rabbit eye test animal test $1,800
Bovine corneal opacity and permeability (BCOP) test in vitro test $1,400
Skin corrosion
Draize rabbit skin test animal test $1,800
EpiDerm™ human skin model in vitro test $850
CORROSITEX® membrane barrier in vitro test $500
Skin sensitization
Guinea pig maximization test animal test $6,000
Local lymph node assay (LLNA) reduction alt. $3,000
Phototoxicity
Rat phototoxicity test animal test $11,500
3T3 neutral red uptake test in vitro test $1,300
Embryotoxicity
Rat developmental toxicity test animal test $50,000
Rat limb bud test in vitro test $15,000
Non-genotoxic cancer risk
Rat 24-month cancer bioassay animal test $700,000
Syrian hamster embryo (SHE) cell transformation test in vitro test $22,000
Pyrogenicity
Rabbit pyrogen test animal test $475-$990
Limulus amoebocyte lysate (LAL) 1st gen. in vitro $85-$160
Human blood method (Endosafe-IPT) 2nd gen. in vitro $83-$100
Estrogen hormone interactions
Rat uterotrophic assay (OVX) animal test $29,600
Subcellular receptor-binding assay in vitro test $7,200
Androgen hormone interactions
Rat Hershberger assay animal test $37,000
Subcellular receptor-binding assay in vitro test $7,300
24 http://www.hsi.org/issues/chemical_product_testing/facts/time_and_cost.html
284 ALTEX 35(3), 2018Meigs et al. Fig. 3: Comparison of the number of in vivo and in vitro tests performed per year to assess skin irritation/corrosion of chemicals Data were extracted from the e-ChemPortal of OECD45. but also many important differences as to timing for notifications REACH is implemented according to the valid ECHA guidance, or registrations, thresholds such as tonnages triggering registra- this type of testing will contribute 70% of costs and 80% of an- tions, availability of exemptions, data requirements (e.g., eco- imals (Hartung and Rovida, 2009; Rovida and Hartung, 2009) toxicity testing), acceptance of QSAR and alternative methods, through the main driver – OECD Test Guideline (TG) 416 – the defining product composition / impurities, and communication in two-generation reproductive toxicity study. Thus, the discussion the supply chain. The new US legislation (Frank R. Lautenberg regarding the implementation of the extended one-generation re- Chemical Safety for the 21st Century Act – TSCA 2016 update) productive toxicity study (now OECD TG 443) quickly became and its implementation, with breakthroughs in the demand for very important (Gilbert, 2010), as it can reduce the number of an- alternative approaches, will be the subject of an upcoming paper imals to 1,400 per chemical from up to 3,200 for TG 416. This is in this series. Some examples of other legislations (China, Ma- an interesting test case demonstrating the balance between testing laysia, Korea) have been summarized elsewhere25. The import- demands, costs and test capabilities. CEHTRA (Consultancy for ant conclusion is that there are enormous demands on test data. Environment and Human Toxicology and Risk Assessment), UK, Regardless of the comprehensive registration of a substance in prepared a report commissioned by ECHA “Report on Survey of one country, this does not mean that testing is completed also for Worldwide CROs: Costs and Practicalities of Two New OECD other registrations, since the data remain proprietary (in REACH, Guidelines for Testing Chemical Substances OECD 443, Extend- for example, data are owned by the mandatory consortia – SIEF ed One-Generation Reproductive Toxicity Study, and OECD 488, – substance information exchange forum), there can be other Transgenic Rodent Somatic and Germ Cell Mutation Assay”26. A companies registering the same compound without legitimate total of 50 CROs were identified as being potentially able to per- access to the earlier data, and information requirements can vary. form the OECD 443 extended one-generation reproductive toxic- Legitimate access to the information has to be clarified in each ity study. Based on the survey, it is estimated that the worldwide and every case. This is of critical importance as otherwise an capacity for the OECD 443 test may be in the region of 63 studies enormous number of replicate studies becomes necessary. In fact, per year. However, we showed that the first registrations for the REACH has made test data a commodity. As the compensation first deadline alone suggested about 159 TG 416 studies would for data-sharing has not been set by the legislation and a brok- be needed (extrapolated from 400 randomly sampled dossiers) ering mechanism is lacking, this has forced individual negotia- (Rovida et al., 2011), which represents 2.5 years of all capacity tions between the different parties. Often it is difficult to identify to run such studies. Studies from the 2nd deadline and those that whether specific data is available as only the lead registrant of a requested waivers or category formation not accepted by ECHA SIEF is easily found on ECHA’s website. Thus, a high number of must still be added. additional experimental animal and resource use is to be expected The price range for testing one chemical in the two-genera- from the mushrooming chemical legislations world-wide. tion OECD TG 416 (without formulation analysis) is between Reproductive toxicity triggers enormous demands for REACH €141,000 and €408,000 (worldwide average €285,842; Europe- (EC, 2006) compliance. We calculated earlier that in case an average €318,295). For an extended-one-generation OECD 25 http://www.cefic.org/Documents/IndustrySupport/REACH-Implementation/Workshops/RIEF-II-18-December-2013/Chemical%20legislation%20 around%20the%20world%20(A.Jalba%20-%20Cefic).pdf 26 https://echa.europa.eu/documents/10162/13628/survey_report_worldwide_cros_en.pdf ALTEX 35(3), 2018 285
Meigs et al.

TG 443, the average price for the first-generation basic study                    Tab. 5: World chemicals turnover (2016) – total €3.36 trillion
(without second generation and extra cohorts) is €414,273; with
inclusion of the second generation €469,778; with the extra                         Country / economic region                    Sales       %
neurotoxicity cohort €507,444; with the extra immunotoxicity                        NAFTA (US, Canada, Mexico)                   528         15.7%
cohort €440,414; with both cohorts €655,195. Notably, there
                                                                                    Latin America                                127         3.8%
is a three-fold difference between the minimum and maximum
prices for the basic TG 416. But obviously, saving on animal                        EU                                           507         15.1%
numbers comes at a price: The European average for a full                           Rest of Europe                               90          2.7%
OECD TG 443 (including all cohorts but no 2nd generation) is                        (Switzerland, Norway, Turkey, Russia
€607,119, which is almost double the average European price for                     and Ukraine)
the OECD 416. On this basis it is clear that when comparing like
                                                                                    South Africa                                 13          0.7%
for like (OECD TG 416 vs OECD TG 443 with 2nd generation),
the extended one-generation study is 41% more expensive than                        China                                        1,331       39.6%
the OECD 416.                                                                       South Korea                                  113         3.4%
   But the impact of REACH on testing is also visible for the
                                                                                    India                                        76          2.2%
simpler tests. Figure 3 shows the example of skin irritation and
corrosion. The three peaks of the graph are clearly related to                      Japan                                        140         4.2%
the three REACH deadlines, the first at the end of 2010 and the                     Rest of Asia                                 407         12.1%
second mid-2013 and the third, which is still clearly incomplete,
in mid-2018. The number of in vitro tests is higher than in vivo                    Rest of World                                28          0.8%
tests, but the data clearly shows that the in vivo tests are still
very much used despite the fact that these endpoints have been
“fully” replaced.
   In summary, CROs represent a sizable industry. Their eco-                      0.4% growth from 2014. Global sales increased from 2006 to
nomic interests can be in favor of animal testing and against                     2016 by 86.3%, to which China alone contributed 70.2% with
transitioning to new and often cheaper alternatives. This can,                    an annual growth rate of 12.4%. Table 5 shows increase in
for example, be witnessed in the ISO process for deriving safety                  world chemicals turnover, led by China with 39.6%, a three-fold
standards. This decade-long process is based on volunteers and                    increase from 2006, followed by the EU with 15.1% (17.8%
requires international travel, which is very costly and so typi-                  including the non-EU European countries) and the US with
cally weeds out those with no vested interest. Many CROs, who                     14.2%. Global R&D spending reached €39.4 in 2016 (up from
may be tempted to maintain or increase testing demands, are                       €24.7 in 2006, a growth rate of 4.8% per year). In 2016, Chi-
part of this process. As CROs often consult the customer in what                  na contributed 30% to global R&D, Europe 23.2% and the US
tests should be done, they are key for any transition. Notably,                   20.0%. The major chemical companies in the world30 are BASF
some CROs have become part of the change: they aim to offer                       ($78.7 billion in 2014), Dow Chemical ($58.2 billion), Sinopec
cutting-edge methods and establish them early under quality re-                   ($58.0 billion), SABIC ($43.3 billion), ExxonMobil ($38.2 bil-
gimes – they thus often participate in validation studies of alter-               lion), Formosa Plastics ($37.1 billion), LyondellBasell Industries
natives and their professional attitude in executing protocols is                 ($34.8 billion), DuPont ($29.9 billion), Ineos ($29.7 billion),
often an advantage over academic groups who are often tempted                     Bayer ($28.1 billion), Mitsubishi Chemical ($26.3 billion) and
to vary protocols.                                                                Shell ($24.6 billion).
                                                                                     In the EU, according to Eurostat, chemical industry (exclud-
                                                                                  ing pharmaceuticals) is the fifth largest industry, contributing
5 Chemical industry                                                               about 7% of total EU manufacturing added value. The European
                                                                                  industry currently comprises approximately 29,000 compa-
Chemical safety testing and its alternatives has been addressed                   nies (96% of which are Small Medium Enterprises (SMEs)),
earlier in this series (Hartung, 2010b). The European trade as-                   employing roughly 1.2 million people directly and a further
sociation CEFIC (Conseil Européen de l’Industrie Chimique                         3-4 million people indirectly, generating a turnover of over €500
– European Chemical Industry Council) provides facts and                          billion and net exports of nearly €50 billion. Germany (28.7%),
figures for 2017 27,28,29 (numbers not referenced below come                      France (13.9%), Italy (10.0%), The Netherlands (9.1%) and the
from these sources), some of which are extracted here: Chem-                      UK (7.9%) are the largest producers within the EU. While total
ical products are used in making 95% of all goods. World                          sales increased (€334 billion in 1996 to a reported maximum of
chemical turnover in 2016 was €3.36 trillion, which represents                    €553 billion in 2012), they fell to just €408 billion in 2009 due to

27 http://www.cefic.org/Documents/RESOURCES/Reports-and-Brochure/Short-Introduction-To-the-European-Chemical-Industry-2014.pdf
28 http://fr.zone-secure.net/13451/451623/#page=1
29 https://www.chemlandscape.cefic.org/country/eu/
30 https://cen.acs.org/articles/93/i30/Global-Top-50.html

286                                                                                                                                      ALTEX 35(3), 2018
Meigs et al. the financial crisis (from €530 billion in 2008), and after the re- and development34. The business of chemistry accounts for covery around 2012 declined to €507 billion in 2016. But, while 14% of US goods exports35, $174 billion in 2016, and is among European chemical sales have continued to grow over the past the largest exporters in the US. 20 years, Europe’s share of global sales over the same period has The European REACH (EC, 2006) had a major impact on declined from 32% to 15%. 30% of European production is sold the field world-wide as discussed above. When REACH was outside the EU (22% to the US, 10% to China and 8% to Switzer- published in 2006, the date of the final deadline of May 31, 2018 land as the most important customers). The spread of products by seemed far away. Now, we are there and can compare what was sales in Europe shows 25.9% petrochemicals, 13.6% consumer predicted and how it went in reality. First of all, the number of chemicals (sold to final consumers such as soaps, detergents, per- registered substances: 36,000 substances in the EINECS list and fumes and cosmetics), 11.7% basic inorganics (fertilizers, gases, 4,000 in the ELINCS list made a total of 40,000 substances of- etc.), 21.6% polymers; these 59.2% of chemicals are considered ficially circulating in the EU market (2007), which appears still base chemicals to be distinguished from 27.2% specialty chem- to be underestimated. In fact, at the end of the pre-registration icals (paints and inks, crop protection, auxiliaries for industries, period about 143,000 substances had their own pre-registration etc.). The costs of regulation for the industry were assessed in the number (ECHA Press release, which is no longer available on REFIT program of the European Commission (EC), “The total the webpage, see Rovida and Hartung (2009) for details). Based costs amount to €10 billion per year (33% for industrial emis- on those numbers, the expected registrations could have been sions, 30% for chemicals and 24% for worker safety). These between 40,000 and 80,000. Now the ultimate deadline has figures vary strongly by subsector amounting to 23.2% of val- passed, but the ECHA public database of registered substances ue added for pesticides and only 2.7% for plastics; most other counts only 20,920 records, according to the update of June 23, chemicals range from 12 to 17%, with a total average of 12% 201836, which represents only 14% of the pre-registered sub- representing 30% of the gross operating surplus. Compared to stances. At the moment it is not clear what has happened. We 2004, by 2014 the costs of regulation have doubled.” are tempted to sing following freely Pete Seeger’s Where Have The North American chemical market according to Bos- All the Flowers Gone: ton Consulting Group31 generated sales of approximately $1 trillion in 2014 and is projected to grow at roughly 3.5% per Where have all the chemicals gone? year through 2020. Overall, it grew at an annual rate of 2.4% Long time passing from 2011 through 2014. According to the American Chem- Where have all the chemicals gone? istry Council (ACC)32, the US trade association, with the Long time ago… development of shale gas and the surge in natural gas liquids supply, the U.S. has moved from being a high-cost producer The difficulty in comparing the registered substances with the of key petrochemicals and resins to among the lowest-cost lists of the EINECS and ELINCS, lies also in the fact that in producers globally. This shift in competitiveness is driving many cases the original EC number has been changed, and significant flows of new capital investment toward the U.S., there is no way to understand what was lost in the process. It with 317 natural-gas related projects already announced, val- is unclear whether groups of substances were registered as cat- ued at more than $185 billion (as of December, 2017). More egories, which might hold especially true for petrochemicals. than $88 billion in new projects have been completed or are Thus, currently, a high number of chemicals is not registered currently under construction. It is one of the top US export- and their marketing in the EU will be forbidden. Even consid- ing industries, with $174 billion in annual exports, accounting ering substances that are in the scope of other regulations (such for 14% of all U.S. exports in 2016. The industry employs as active biocides or plant protection products) and substances 811,000 people, and of these jobs, more than 30 percent are that do not pass the REACH registration threshold of 1 ton export dependent. According to the U.S. Bureau of Labor per year, the gap still remains large. Probably, in many cases Statistics, the chemical industry has an injury rate that is 55% companies preferred not to register and stop the manufacturing lower than overall manufacturing. This contrasts impressively or the importation of a substance as the high costs of compil- with Justus von Liebig’s advice to August Kekulé “If you want ing the registration dossier made the investment unprofitable. to become a chemist, you will have to ruin your health. If you don’t BASF, the largest chemical company, ultimately registered ruin your health studying, you won’t accomplish anything these about one third fewer substances than originally anticipated days in chemistry”. According to the ACC33, the U.S. chemi- (Dr Robert Landsiedel, BASF, personal communication). There cal industry invested $14.3 billion in 2016 in environmental, is also the possibility that some substances were simply forgot- health, safety, and security programs and $91 billion in research ten or postponed and we will see the total number of registra- 31 https://www.bcg.com/publications/2016/supply-chain-management-specialty-chemical-distribution-north-america.aspx 32 https://www.americanchemistry.com/Pro-Growth-Pro-Competitiveness-Agenda-for-Chemical-Manufacturing.pdf 33 https://www.americanchemistry.com/Policy/Security/Chemical-Safey-and-Security-Fact-Sheet.pdf 34 https://www.americanchemistry.com/Jobs/EconomicStatistics/Industry-Profile/Industry-Facts/Chemistry-Industry-Facts.pdf 35 https://www.americanchemistry.com/Jobs/EconomicStatistics/Industry-Profile/Industry-Facts/Chemistry-Industry-Facts.pdf 36 https://echa.europa.eu/information-on-chemicals/registered-substances ALTEX 35(3), 2018 287
Meigs et al.

tions increase in the coming months. This situation may cause                         from a scientific point of view, ECHA noted that in many cases
trouble to the EU economy by moving the manufacturing and                             they were inadequately justified and contained deficiencies. As
use of the orphan chemicals outside its border.                                       a consequence, in 2016 ECHA published a detailed document
   This “loss” of chemicals concerns only the last of the three                       on Read-Across Assessment Framework (RAAF), updated
deadlines. In 2009, we predicted the numbers of chemicals to be                       in 201742 , representing a very helpful guide to a successful
registered under REACH (Hartung and Rovida, 2009; Rovida                              application of the read-across approach. Simultaneously, in
and Hartung, 2009): In total, we suggested 68,000 registrations,                      2016, ECHA decided to introduce a manual check on all newly
which would lead to the use of 54 million animals if following                        submitted dossiers and updates of the previously submitted
ECHA’s test guidance by the letter. Now, at least we know the                         dossiers controlling all main aspects that were often found to
number of registrations: Since 2008, 13,620 companies have                            be problematic during the previous evaluations, including the
submitted 88,319 registration dossiers in all tonnages to ECHA.                       possibility of waiving the most demanding in vivo tests. There
For deadlines 1 and 2 we predicted a minimum of 12,007 and                            is still no official data, but from personal experience (C.R.), we
13,328 were received37. For 2018, we predicted a minimum of                           know that indeed many new in vivo tests will be performed or
56,202 chemicals. Ironically, while the number of chemicals                           are currently running in this period. On average, considering
was way off, the number of registrations with about 60,00038                          the scheduling of the testing proposals plus the time necessary
was point on. As the 2018 registrations have to come with exe-                        for running the tests, the new updates will be available in 2-3
cuted animal tests, to the extent the registrations are complete,                     years. Calculation of the number of animals used for REACH
the predicted number of necessary animal tests was correct. The                       purposes should begin no earlier than 2020.
submitted registrations cover 21,551 substances, which means                             Another important aspect of REACH is that it has been a
that the portion of extensively tested chemicals in daily use rose                    major boost for the use of novel technologies for regulatory
from about 3 to 8% (though many tests are still at the proposal                       purposes. It should be noted that REACH was the very first
stage) and for the somewhat tested ones with public data from                         regulation that accepted adaptations to the standard set of tox-
about 8 to 16%. Europe does not track new chemicals below an                          icological information. Annex XI describes how to use alter-
annual market or production volume of one ton, but the some-                          native strategies to waive the requests for new in vivo tests.
what smaller US chemical industry brings about 1,000 chemicals                        This opportunity was extensively described elsewhere (Rovida
to the market at this tonnage range each year.                                        and Hartung 2009; Rovida et al., 2011). ECHA also published
   It is too early also for a reasonable balance of the number of                     suitable guidance that helped submitters to dramatically reduce
animals that were sacrificed in in vivo tests performed for the                       the number of new tests. This guidance (developed under the
preparation of the REACH registration dossiers. REACH An-                             coordination of T.H. for the EC) was first published in 2008
nexes IX and X, i.e., those defining the information for substanc-                    and afterwards regularly updated as soon as new information
es manufactured or imported in quantities above 100 and 1000                          was available43. ECHA hosted perhaps the majority of the
tons per year, respectively, are the most demanding in terms of                       discussion on this topic and in 2016 organized an important
new in vivo tests. Deadline for registering chemicals in compli-                      workshop to form the basis for the use of non-standard strate-
ance with Annex X was November 30, 2010, while the deadline                           gies for regulatory purposes. The report of that workshop still
for Annex IX was May 31, 2013. However, any new in vivo tests                         represents an important milestone in the field44 and probably
described in those annexes need to go through the testing pro-                        was key for the shift of the focus of discussion on non-animal
posal procedure (Article 12), which takes some time, and many                         methods from animal welfare organizations to regulatory toxi-
dossiers still need to be updated.                                                    cologists in general.
   In addition, compared to the REACH requests, very few                                 This was further improved by the amendments of the REACH
testing proposals were submitted and most of the registration                         Regulation that deleted the request for in vivo tests for skin sen-
dossiers claimed the waiving options as described in Annex                            sitization (Regulation 2016/1688) and skin/eye irritation (Regu-
XI of REACH. In the first three ECHA reports on the use of                            lation 2016/863). Actually, the publication of those amendments
alternatives to animal tests for the REACH Regulation39, 40,                          would have been superfluous as the compulsory use of alterna-
41, the analyses of the registration dossiers revealed that there                     tives to in vivo tests as soon as validated methods are available
were very few testing proposals and in many cases the need                            was already foreseen in the text of REACH. However, the formal
for the information was fulfilled through alternative ways, such                      request for in vitro tests as the only way to fulfill a toxicological
as read-across with other chemicals. Even though acceptable                           endpoint was very important to send the message that regulators

37 http://www.cefic.org/Documents/IndustrySupport/REACH-Implementation/Workshops/RIEF-IV-16-6-2015/12%20Reach%20and%20%20non-animal%20
  testing%20-%20Katy%20Taylor.pdf
38 https://www.echa.europa.eu/documents/10162/13609/work_programme_2018_in_brief_en.pdf/9412a2bd-64f1-13a8-9c49-177a9f853372
39 https://echa.europa.eu/documents/10162/13639/alternatives_test_animals_2011_en.pdf
40 https://echa.europa.eu/documents/10162/13639/alternatives_test_animals_2014_en.pdf
41 https://echa.europa.eu/documents/10162/13639/alternatives_test_animals_2017_en.pdf
42 https://echa.europa.eu/documents/10162/13628/raaf_en.pdf
43 https://echa.europa.eu/documents/10162/13632/information_requirements_r7a_en.pdf
44 https://echa.europa.eu/documents/10162/22931011/non_animal_approcches_en.pdf/87ebb68f-2038-f597-fc33-f4003e9e7d7d

288                                                                                                                                        ALTEX 35(3), 2018
You can also read