Challenges D2.2.1: Market Opportunities and Challenges - CORDIS
←
→
Page content transcription
If your browser does not render page correctly, please read the page content below
WP2 : 2nd Screen, Social Media Vision and
                       Challenges

      D2.2.1: Market Opportunities and Challenges

                                  Deliverable Lead: BDS

                             Contributing Partners: BDS, ALL

                                  Delivery Date: 2014-10

                               Dissemination Level: Public

                                           Final

The purpose of this SAM deliverable D2.2.1 Market
Opportunities and Challenges is to deliver an initial
description of the potential target market sectors and the
prospective customers, in alignment with the SAM vision.
Furthermore the report will identify the current state of the
market and its challenges and opportunities, the
competitors and incumbents and identify the market from
the perspective of the use case partners.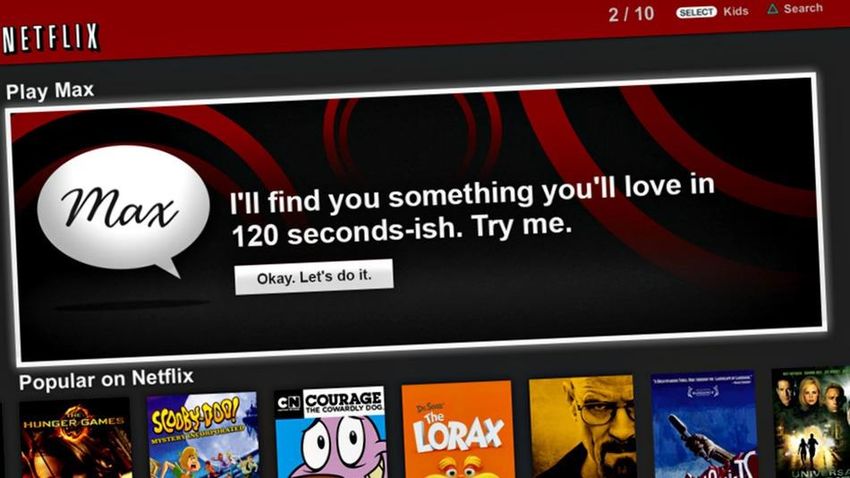
SAM                                             Public                                          D2.2.1

 Document Status

 Deliverable Lead      Barry Smith, BDS

 Internal Reviewer 1   TIE – Juan Vincente Vidagany Espert, Fran Rodriguez Montero v0.6, 22.10.2014

 Internal Reviewer 2   TPVision – Koen Cooreman v0.8, 07.11.2014

 Type                  Deliverable
                                 nd
 Work Package          WP2 – 2 Screen, Social Media Vision and Challenges

 ID                    D2.2.1: Market Opportunities and Challenges

 Due Date              10.2014

 Delivery Date         11.2014

 Status                For Approval

 Document History
                       V0.1: First Draft produced by Editor
                       V0.2: Part contributions by BDS and DW
                       V0.3: With edited contributions from majority of contributor partners
                       V0.4: With all contributions from partners – commented and edited
                       V0.5: Edited by Editor
 Versions
                       V0.6: Final contributions edited by Editor
                       V0.7: First internal reviewers’ comments
                       V0.8: For 2nd Review
                       V0.9: BDS: Final Version

                       BDS: Barry Smith - Rosie Harley - Mark Klose – Document structure, Lead –
                       Sections 2 and 3
                       TIE:   Juan Vte. Vidagany - Fran Rodriguez - Sections 2 and 3
                       DW:    Sections 2 and 3
                       UA:    David Tomás - Section 2
 Contributions         TPV: Koen Cooreman – Sections 2 and 3
                       TALK: Fredrik Kronlid – Alex Berman Section 2
                       ASC: Norman Wessel – Sections 2 and 3
                       UOR: Marco Tiemann – Section 2
                       NTUA: Andreas Menychtas - Christina Santzaridou, - Section 2
                       ALL: SWOT Analysis Contributions

Disclaimer
The views represented in this document only reflect the views of the authors and not the
views of the European Union. The European Union is not liable for any use that may be
made of the information contained in this document.
Furthermore, the information is provided “as is” and no guarantee or warranty is given that
the information is fit for any particular purpose. The user of the information uses it at its
sole risk and liability.

                                                                                                2 / 74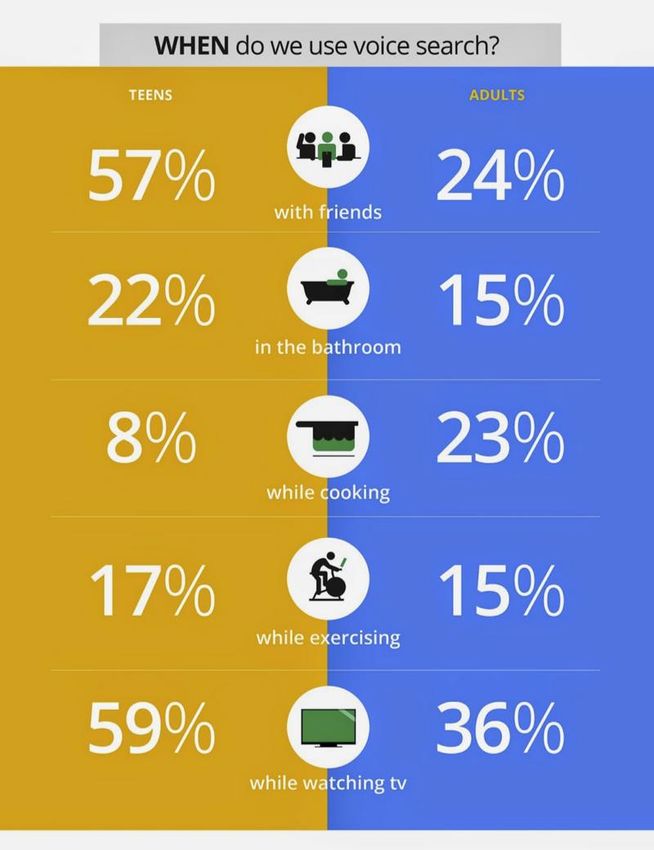
SAM                                           Public                                      D2.2.1

                                   Project Partners

      TIE Nederland B.V., The Netherlands                    Ascora GmbH, Germany

            Talkamatic AB, Sweden                         TP Vision Belgium NV, Belgium

  Institute of Communication and Computer
  Systems, National Technical University of               The University of Reading, UK
                Athens, Greece

         Universidad de Alicante, Spain                     Deutsche Welle, Germany

                             Bibliographic Data Services Limited, UK

                                                                                          3 / 74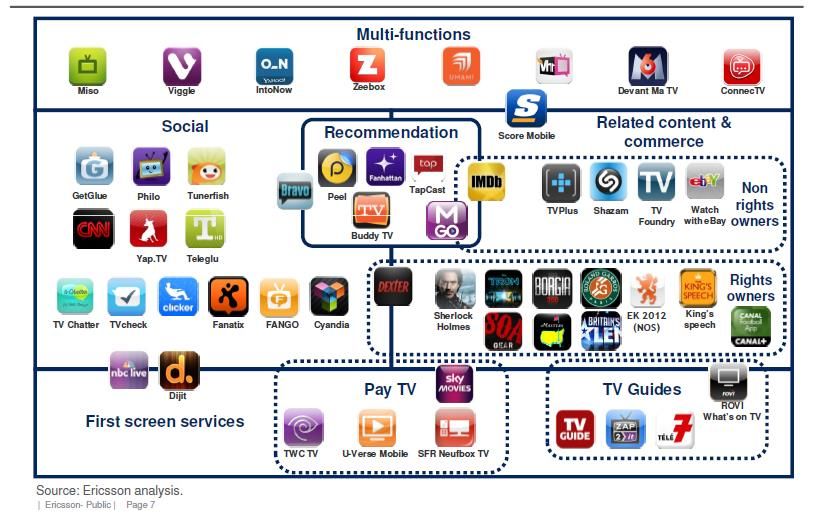
SAM                                       Public                                       D2.2.1

Executive Summary
The purpose of this SAM deliverable D2.2.1 Market Opportunities and Challenges is to
deliver an initial description of the potential target market sectors and the prospective
customers, in alignment with the SAM vision, which is organised around three main pillars:
Content Syndication, Social Media and Multi-device Representation and 2nd Screen.
Furthermore the report will identify the current state of the market challenges and
opportunities, the competitors and incumbents and identify the market from the
perspective of the use case partners.
The market opportunities and challenges, as defined in the report, will be used not only to
guide the scope of the RTD and the purpose of the prototypes, but also to ensure that
SAM develops a system that is actually needed by prospective users and that has a
position in the business ecosystem which is commercially exploitable.
Innovative technologies, new entrants, emerging business models and a burgeoning
connected world means that the marketplace is dynamic and that SAM may need to react
to the market variations. Therefore, this deliverable is not intended to be a one-off static
plan but will be active throughout the project by detecting and reporting possible market
opportunities and threats and will develop dynamically with incremental input including that
from WP8 where the user scenarios will be developed.
This document will help to elaborate the overall goals of the project whilst integrating
requirements and constraints coming from the use case partners and to create the criteria
for the evaluation of WP8 and the exploitation strategies in WP9.

                                                                                       4 / 74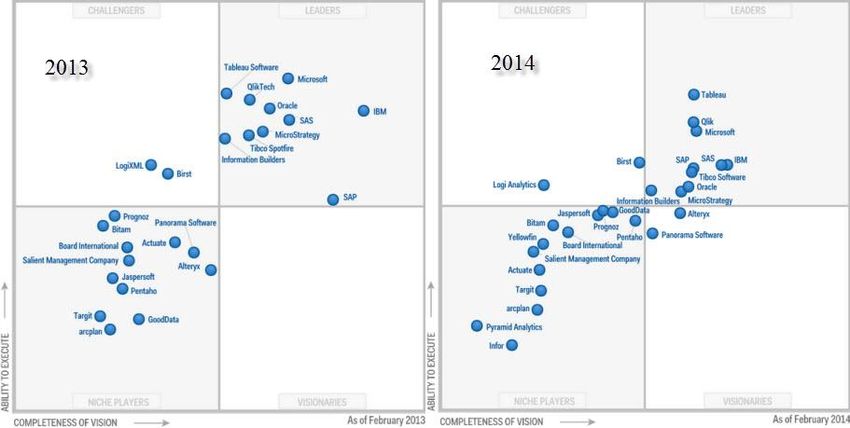
SAM                                                            Public                                                             D2.2.1

                                                Table of Contents
1     Introduction .................................................................................................................... 7
      1.1 SAM Project Overview ........................................................................................... 7
      1.2 Deliverable Purpose, Scope and Context .............................................................. 7
      1.3 Document Status and Target Audience ................................................................. 8
      1.4 Abbreviations and Glossary ................................................................................... 8
      1.5 Document Structure ............................................................................................... 9
2     Market Environment ..................................................................................................... 10
      2.1 Market Themes.................................................................................................... 11
            2.1.1 2nd Screen................................................................................................ 11
            2.1.2 Content Syndication................................................................................. 14
            2.1.3 SmartTV and Connected Devices ........................................................... 17
            2.1.4 Social Media ............................................................................................ 20
            2.1.5 Dynamic Contextual Social Media Community Creation.......................... 21
            2.1.6 Business Intelligence & Analytics ............................................................ 22
            2.1.7 Dialogue Speech Control Systems .......................................................... 24
            2.1.8 Sentiment Analysis & Social Mining ........................................................ 27
            2.1.9 Content Monetisation ............................................................................... 31
            2.1.10 2nd Screen Content Editing and Linking ................................................. 34
      2.2 SAM’s Position in the M&E Ecosystem ............................................................... 36
            2.2.1 Trends Relevant to SAM Which Are Transforming M&E ......................... 36
            2.2.2 Innovative Ways to Monetise Content ..................................................... 37
            2.2.3 Collaboration in Creative Content Production and Distribution ................ 37
      2.3 Major Players in the Market ................................................................................. 38
            2.3.1 2nd Screen and Social TV Ecosystem ...................................................... 39
3     Stakeholder Viewpoints ............................................................................................... 43
      3.1 Broadcasters ....................................................................................................... 43
            3.1.1 Definition.................................................................................................. 43
            3.1.2 SAM Use ................................................................................................. 44
            3.1.3 Competition ............................................................................................. 45
            3.1.4 Post SAM ................................................................................................. 46
            3.1.5 Stakeholder SWOT .................................................................................. 46
      3.2 Content Providers ................................................................................................ 47
            3.2.1 Definition.................................................................................................. 47
            3.2.2 SAM Use ................................................................................................. 47
            3.2.3 Competition ............................................................................................. 48
            3.2.4 Post SAM ................................................................................................. 49
            3.2.5 Stakeholder SWOT .................................................................................. 50
      3.3 SmartTV and Device Providers ........................................................................... 50
            3.3.1 Definition.................................................................................................. 50
            3.3.2 SAM Use ................................................................................................. 52
            3.3.3 Competition ............................................................................................. 52
            3.3.4 Post SAM ................................................................................................. 53
            3.3.5 Stakeholder SWOT .................................................................................. 53
      3.4 App Developers ................................................................................................... 53
            3.4.1 .Definition................................................................................................. 54
            3.4.2 SAM Use ................................................................................................. 54
            3.4.3 Competition ............................................................................................. 54
            3.4.4 Post SAM ................................................................................................. 55

                                                                                                                                  5 / 74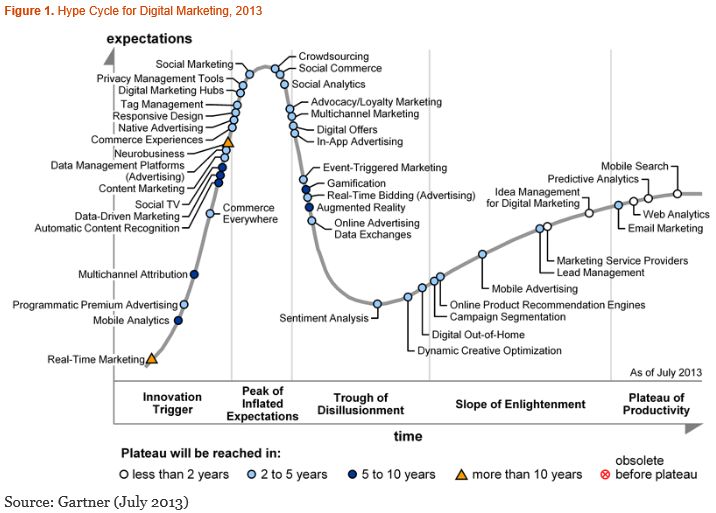
SAM                                                          Public                                                            D2.2.1

        3.4.5 Stakeholder SWOT .................................................................................. 56
   3.5 Service/SaaS Provider ........................................................................................ 56
        3.5.1 Definition.................................................................................................. 56
        3.5.2 SAM Use ................................................................................................. 57
        3.5.3 Competition ............................................................................................. 57
        3.5.4 Post SAM ................................................................................................. 58
        3.5.5 Stakeholder SWOT .................................................................................. 58
   3.6 A Comprehensive SAM SWOT............................................................................ 59
   3.7 Comparison of SAM Rivals .................................................................................. 61
4 Conclusion ................................................................................................................... 64
Annex A: M&E Companies Relevant to SAM ..................................................................... 66
Annex B. Sources of M&E Industry Reports ...................................................................... 69
Annex C: 2nd Screen and Social TV Related Companies Similar to SAM ......................... 70
References ........................................................................................................................ 74

                                                                                                                               6 / 74
SAM                                       Public                                        D2.2.1

1 Introduction
SAM – Dynamic Social and Media Content Syndication for 2nd Screen – is a project funded
by the Seventh Framework Programme of the European Commission under Grant
Agreement No. 611312. It provides a content delivery platform for syndicated data to be
consumed in a contextualised social way through 2 nd Screen devices.

1.1 SAM Project Overview
Today’s generation of Internet-connected devices has changed the way users are
interacting with media, exchanging their role from passive and unidirectional to proactive
and interactive. Under this new role, users are able to comment or rate a TV show and
search for related information regarding characters, facts or personalities. They do this
both with friends and wider social communities through the so called “2 nd Screen”.
Another coupled phenomenon is “Content Syndication” which is a field of marketing where
digital content is created once and delivered to many different marketing channels
(devices, social media channels, websites and stakeholders) together and so allowing
efficient content control, delivery, and feedback.
However, the 2nd Screen phenomenon has grown in an unordered way. Tools are provided
by the media providers companies (e.g. as mobile or tablet apps) which limits outreach
and as a result, users are not stimulated and fed with relevant contextual syndicated
information. European enterprises wishing to provide services have limited potential to
receive feedback, which restricts the business intelligence that can be extracted and
applied therefore to profit from and enrich this market.
SAM will change this disorder by developing an advanced Social Media delivery platform
based on 2nd Screen and Content Syndication within a Social Media context. This is
achieved by providing open and standardised ways of characterizing, discovering and
syndicating media assets interactively. Users will be able to consume and prosume digital
assets from different syndicated sources and different synchronised devices (e.g.
connected TVs), thus creating richer experiences around the original media assets.
SAM's innovation is that instead of users reaching for the data; it is the data, which
reaches the user through the syndication approach and their 2nd Screen. This is based on
the creation of dynamic social communities related to the user and digital asset context
(e.g. profiles, preferences and devices connected). These are dynamic hangouts where
people share interests, socialise and build virtual communities. SAM will enable
syndication of comments, ratings, facts, recommendations and new information that will
enrich and energise the community as well as enhance personalised knowledge and
satisfaction.

1.2 Deliverable Purpose, Scope and Context
The purpose of this deliverable, D2.2.1 Market Opportunities and Challenges (first
version), is to provide some guidelines to the project to help to specify the scope of what
the RTD should serve and the goal of the prototypes and also to ensure that SAM is going
to develop a system that is actually needed – and used – by the target audience.
To achieve this goal, this document will provide information about the general positioning
of the SAM project in the current Media and Entertainment (M&E) ecosystem, business

                                                                                       7 / 74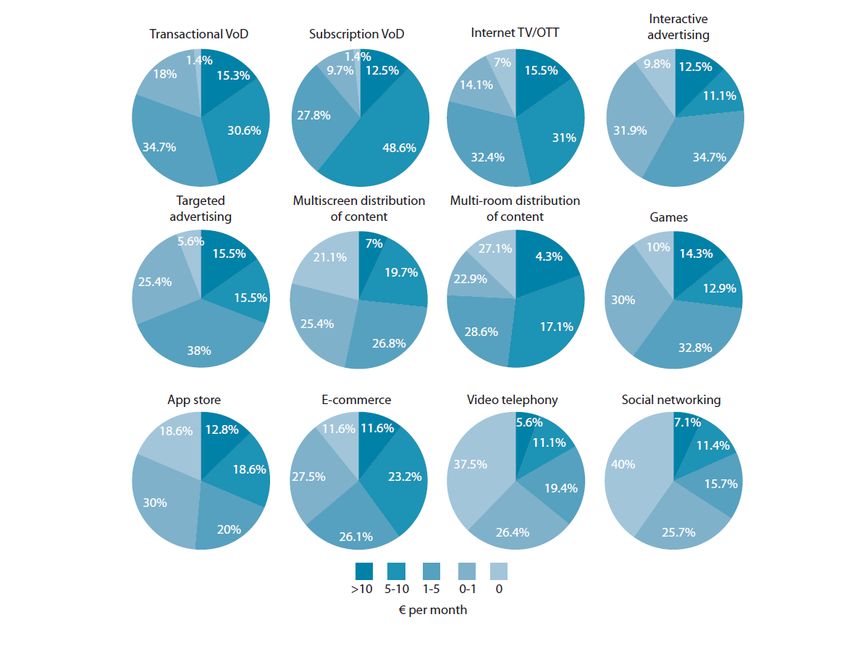
SAM                                         Public                                         D2.2.1

and research/technological objectives, partner perspectives, underlying vision enablers
and applicable preliminary usage scenarios.
In order to react to the market variations, this deliverable will be used by all partners as a
snapshot of the market helping the Technical Tasks of the project to stay focused on the
main ideas and goals of the project whilst introducing insights into the “connected
community” which will maximise the potential for commercial exploitation.
This document contains high-level information, with two further versions providing
incremental and updated description of the M&E ecosystem, its players, and the
challenges and opportunities that it presents for project, the partners and to the project
developments. Deeper insights will be found in two different use cases: T8.2 (Content
Syndication and Media Enrichment) and T8.3 (Social Consumption). These are to be
implemented to demonstrate the objectives, concepts and ideas of SAM in an environment
in which media, content, technology and the consumer are constantly changing. The
preliminary use case scenarios described in T8.1 may be altered and adapted due to
market variations, resulting in a high-level, user-driven business basis on which technical
developments can develop and guide the commercial strategy and exploitation plans for
SAM, linked to T9.1 (IPR, Exploitation and Sustainability).
This deliverable required a great deal of research and following discussions between the
partners it was agreed that the DOW allocated percentages should be amended.
Consequently the original allocation of D2.2.1 - 40%, D2.2.2 - 25%, D2.2.3 - 35%,
allocation has been amended to 60%, 20%, 20% as the subsequent reports will be
incremental updates comparing, highlighting and reflecting significant changes in the
market.
This deliverable will act as a ‘placeholder’ and, as the market will be monitored throughout
the entire project, all significant changes will be noted and highlighted in the subsequent
deliverables and will be presented in updates in month 25 and 37.

1.3 Document Status and Target Audience
This document is listed in the Description of Work (DOW) as “public” since it provides an
initial description the M&E ecosystem, with a focus on the current market sectors of
importance to SAM. These are Content Syndication, Social Media and 2nd Screen and the
opportunities and challenges faced by SMEs in that business ecosystem and so may be
used by external parties to gain additional business insight.
Whilst the document is primarily aimed at the project partners, this public deliverable may
also be useful for the wider business, academic and scientific community including other
publicly funded projects, which may be interested in collaborative activities.

1.4 Abbreviations and Glossary
A definition of common terms and roles related to the realization of SAM as well as a list of
abbreviations is available in the SAM Glossary.
Further information can be found at
http://wiki.socialisingaroundmedia.com/index.php/Glossary

                                                                                           8 / 74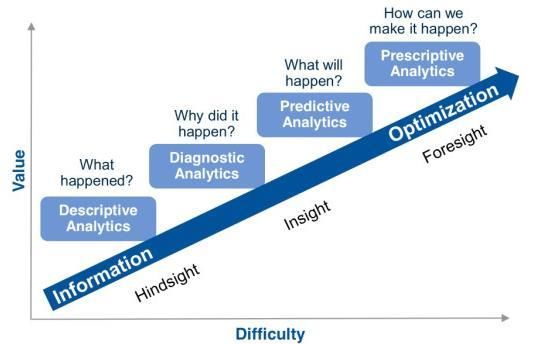
SAM Public D2.2.1
1.5 Document Structure
This deliverable is broken down into the following sections:
Section 1 (Introduction): Includes a general overview of the project, and an outline of
the purpose, scope, context, status, and target audience of SAM
Section 2 (Market Environment): Presents the Marketplace and commercial themes
of relevance for the SAM platform and its elements, from the point of view of the
partners. It also examines SAM’s position in the M&E ecosystem and identifies
competing platforms
Section 3 (Stakeholder Viewpoints): Presents the current perceived opportunities
and challenges SAM may face in the commercial world from the perspective of SAM
based on a SWOT analysis as well as providing a view of future enhancements
Section 4 (Conclusion): Provides a high-level view of where SAM sits in the current
M&E ecosystem and where it might best maximise its potential for commercial
exploitation
Annexes:
Annex A: (M&E Companies Relevant to SAM): Provides a list of noteworthy
companies operating in the same M&E space as SAM
Annex B. (Sources of M&E Industry Reports): Presents a list of research sources
reviewed to identify the market opportunities and challenges.
Annex C: (2nd Screen and Social TV Related Companies Similar to SAM):
Provides examples of companies identified as offering similar services as those to
be available via the SAM platform
9 / 74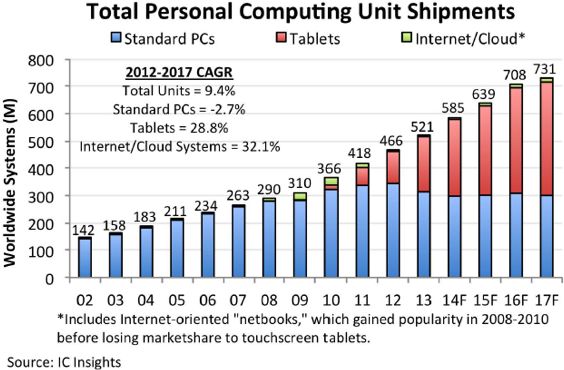
SAM Public D2.2.1
2 Market Environment
Today, the Internet and the Web have transformed commerce, creating entirely new ways
for retailers and their customers to make transactions, for businesses to manage the flow
of production inputs and market products, and for the consumer to be entertained.
According to ITU World Report 2014, the total number of Internet users will reach 3 billion
(40% of the world’s population) by 2014.1 Information technology (IT) continues to be a
driving factor in the process of globalisation as the improvements in computer hardware,
software and telecommunications has greatly increased people’s access to information. In
addition, advancements in Internet-based tools over the past five to ten years - such as
social networking websites, Twitter, and other Web2.0 applications - have changed the
way people use and share information for personal, political and commercial purposes.
As a result of this, the last few years have seen the M&E ecosystem evolving faster than
ever before, undergoing a digital revolution which in 2013 signposted a shift to digital
formats across the M&E industry. As a broad sector, this is somewhat unique in that
revenues are generated by multiple methods shared in an open association with many
market segments such as software/video game design, television, radio, mobile and
particularly movies, advertising and marketing - through which the industry seeks to gain
from the two-way dialogue with consumers primarily via the Internet and, increasingly, the
2nd Screen and multiple-device interaction.
Business ecosystems almost guarantee disruptive results, because by breaking up a
previously integrated structure barriers to entry are reduced for new players, and this
encourages new people with new ideas, new money, new tools and new technologies to
participate and create new businesses as exemplified by the proliferation of mobile apps.
Thus, SAM positions itself in the middle of the M&E ecosystem so that it is able to
capitalise on the opportunities presented by consumers who, using myriad of connected
devices in an ‘always on’ environment, have broadly shifted away from engaging in
traditional media newspapers, analogue TV and radio to online digital entertainment. This
has driven new media companies to examine and change the traditional way of conducting
business and, as many consumers switch over to the digital media sector and engage in
more digital content, there has been a rise in the number of innovative, agile companies
who have identified what the new digitally savvy consumer wants and exploited current
gaps in the market.
The SAM project aims at developing an advanced federated Social Media delivery
platform and will merge three promising and growing business areas into an open
approach:
2nd Screen and Multi-device Representation
Content Syndication
Social Media
In order to be able to facilitate the adoption and exploitation of the solution by the different
stakeholders, it is important to note that SAM is not about the isolated delivery of 2nd
Screen experiences, content syndication methods or social media tools. Rather it is about
the fusion of these areas, how both challenges and opportunities arise in the different SAM
related areas and how these can be addressed in order to be able to deliver a platform
1
http://www.itu.int/en/ITU-D/Statistics/Documents/facts/ICTFactsFigures2014-e.pdf
10 / 74SAM Public D2.2.1
which will facilitate business innovation both for well-established companies as well as
SMEs, who currently may not be able to take part in the growth of the new ecosystem.
2.1 Market Themes
The following sections will examine the themes and related areas which are relevant to
SAM from the point of view of the partners and stakeholders and will provide a snapshot of
the market environment. The extrapolation of the sections, Market Themes, SAM’s
Position in the M&E Ecosystem and Major Players in the Market will then be used in
Section 3.7 to compare SAM against the different platforms and apps in the market to
shows growing value chain for media related metadata marketplaces, related content
creation, multi-device delivery and social consumption within the SAM environment.
2.1.1 2nd Screen
Whilst there is no accepted standard definition of 2nd Screen, there are a number of
existing definitions and in 2010 a British Broadcasting Corporation (BBC) R&D project
adopted a working definition as:2
“Second screens are a class of applications (or devices) that are designed to be
complementary to TV watching or radio listening by displaying content that is contextual
and synchronised to what is showing on the primary screen whether that is live or on-
demand. The second screen may be completely passive or it may allow interaction with
itself, the primary screen, other people in the same room or even wider social interactions.
Ultimately second screens could communicate with other second screens in the same
domestic environment”.
As TV increasingly becomes (as seen in
Figure 1) part of a multi-screen experience, many viewers are multi-tasking as use of 2nd
Screen is growing rapidly and changing the way consumers engage with TV programmes. 3
Figure 1: Popular 2nd Screen Activities for TV Viewers (Source: Ericsson)
2
http://www.bbc.co.uk/blogs/legacy/researchanddevelopment/2010/11/the-autumnwatch-tv-companion-e.shtml
3
http://www.ericsson.com/res/docs/2013/consumerlab/tv-and-media-consumerlab2013.pdf
11 / 74SAM Public D2.2.1
Ericsson’s list of identified activities being carried out on 2nd Screens focuses more on TV-
related than unrelated activities, whilst research has shown that the commonest multi-
screen behaviours identified involved unrelated activities:
Reading email while watching TV/video content (63%)
Using applications or browsing the internet to kill time (56%)
Utilising apps or browsing the internet to find out more information (49%)
Enjoying using social forums at the same time as watching TV/video content (40%)
The study found fewer viewers competing with others watching the same show (14%)
and interacting with the show through voting (13%)
However, there is increasing evidence that Millennials4, the generation born between 1980
and 2000, who are taking the lead in exploiting the new platforms of the digital era — the
internet, mobile technology, social media — to construct personalised networks of friends,
colleagues and affinity groups, have differing 2nd Screen habits.
Recent research on 2nd Screen usage of teenage Internet users worldwide carried in the
fourth quarter of 20135, found that:
72% of teenage internet users aged 16 to 19 years chatted to friends when watching
TV whilst 52% played games
39% kept up with the news and searched for products to buy
28% looked for information related to the main screen viewing
Figure 2: Activities of teenagers whilst watching TV: (Source: Statista 2014)
4
"Millennials Rising" by Neil Howe and William Strauss, published in 2000
5
http://www.statista.com/statistics/295016/teens-tv-internet-second-screen-usage/
12 / 74SAM Public D2.2.1
Today most 2nd Screen services are mostly designed to gain viewers by spreading the
“buzz” and SocialTV is taking on greater significance for revenue creation as new
technologies lead to new business opportunities and subsequent increase in market size,
as shown by the 2nd Screen Society research6 (see Figure 3).
Figure 3: Market Size of 2nd Screen Monetization (Source: The Intersection)
According to the new market research report, Social TV Market: Global Advancements
Forecasts & Analysis (2012-2017)7 published by MarketsandMarkets, 2nd Screen has
made TV a more active and interactive experience. TV viewers are currently looking for
something interesting to watch and get opinions from their friends and family. Thus,
Internet and social networking act as media for the convergence of the social layer with
TV, and enable viewers to communicate electronically with friends watching the same
programme.
TV viewers are also able to personalise their experience by analysing the various statistics
provided by Social TV, and using a wide variety of choices from content discovery, check-
in and social programming apps. Many Social TV tools and applications have given a
customised TV experience based on the viewer’s choice of interest and, therefore, many
companies have developed 2nd Screen apps to engage more viewers and increase the
targeted audience.
The future for the television is predicted to be social through integration of social
interaction on the TV, and broadcasters are developing and enriching Social TV
6
http://mesalliance.org/blog/category/2nd-screen-blog/
7
http://www.marketsandmarkets.com/Market-Reports/social-tv-market-815.html
13 / 74SAM Public D2.2.1
integration. They are targeting the tune-in customer, their engagement and their loyalty to
boost the rating, and they are also discovering the Social TV challenges, which are:
The global Social TV market revenue is expected to grow from $151.14 billion in 2012
to $256.44 billion by 2017, at an estimated Compound Annual Growth Rate (CAGR) of
11.2% from 2012 to 2017
Europe commanded the largest share of the Social TV market revenue in 2012 at
$55.48 billion; and is expected to reach $77.74 billion by 2017, at a CAGR of 7% from
2012 to 2017
The hardware/Smart TV segment accounted for the largest share; i.e. 97.6% of the
overall Social TV market at $147.58 billion in 2012. This segment is expected to reach
$243.76 billion by 2017, at a CAGR of 10.6% from 2012 to 2017
2nd Screen and smart devices have changed the way consumers engage with – and
respond to – advertising, according to data from GfK’s Connected Consumer 2014
research8:
Almost two thirds (64%) of people have used another device when watching TV
The most common device is a laptop/netbook (61% up from 43% in 2013), followed by
a smartphone (56% up from 40% in 2013), and then a tablet (31% up almost double
from 16% in 2013)
The relationship with TV advertising is changing: 39% of people agreed that they
would like the TV to deliver adverts that match the types of programmes they watch.
This is 12 percentage points higher than a year ago
One quarter (24%) would like to be able to buy products they see advertised on TV at
the same time from another device, such as a smartphone or tablet. Figures are even
higher for Subscription Video on Demand (SVOD) subscribers (41%) and 16-24 year
olds (40%).
One in five (20%) would like the websites for products, personalities or adverts that
have just been shown on television to appear on their computer/smartphone/tablet
automatically so they don’t need to search for them online (up from 13% in 2013)
Most people want to keep the activities on their different devices separate - only 20%
would like the content being viewed on another device displayed on the TV screen
It is clear that the Millennials are beginning to have more influence over the direction of the
M&E industry and are playing an increasingly defining role determining what, when, where
and how content is consumed for years to come and so will therefore be essential that
there is a programme of monitoring developments in the M&E ecosystem and this will be
reflected in the subsequent deliverable updates in month 25 and 37.
2.1.2 Content Syndication
According to the Internet Content Syndication Council’s definition, "Content Syndication is
the sale or controlled placement of the same content on multiple partnering Internet
destinations. In this online business model, the content’s destinations and placements are
selected by the content owner or its syndication agent so as to maximize the content’s
exposure to desired audiences. The content owner monetizes the content through sale,
subscription and various revenue-sharing models.” For more generic information about
Content Syndication, please visit the SAM Wiki.
8
http://gcmagazine.co.uk/second-screening-changing-nations-engagement-advertising/
14 / 74SAM Public D2.2.1
Content Syndication is considered a marketing automation solution dealing specifically
with part of Through Partner Marketing Automation (TPMA) solutions, allowing
personalisation of content on the indirect partnership chain.
Figure 4: Forrester report US Interactive Marketing Forecast
Marketing automation solutions are considered to be one of the most effective methods in
Digital Marketing as a way of managing campaigns over a variety of different channels.
The article “30 Shocking Marketing Automation Stats for 20149” states that: “If there’s one
area of sales and marketing technology that’s en vogue for 2014 it’s hands-down the
marketing automation software industry. While those of us in the B2B software marketing
space might think marketing automation is old news, that’s because we’re actually the
early adopters of this massive market that’s just beginning its growth trajectory. The
marketing automation stats we’ve uncovered show that there’s plenty of room for
expansion, and that the industry is prime for even more growth and attention in the coming
year, as new industries and B2C companies jump on board.“
The expectations for the Digital Marketing marketplace are increasing year on year as well
as the competition to occupy a niche in it. The market is large, with different types of
solutions covering all areas of the market and, in the last three years, the number of
companies promoting different solutions for Digital Marketing has risen from approx.100 to
approx. 95010 (see Figure 5Error! Reference source not found.).
Figure 5: Digital Marketing Technology Landscape (Source: chiefmartec.com)
9
http://blog.capterra.com/30-marketing-automation-stats-2014/
10
http://chiefmartec.com/2014/01/marketing-technology-landscape-supergraphic-2014/
15 / 74SAM Public D2.2.1
These companies offer different types of solutions that range from Social Commerce to
Online Advertising, and as can be seen in Figure 6, are in different maturity stages.
Figure 6: Hype Cycle for Digital Marketing (Source: Gartner)
The main industries with the highest marketing automation adoption rates are:
Software & Internet
Telecommunications
Computer & Electronics
Health & Pharma
Business Services
Figure 7: Marketing Automation Industry Adoption (Source: Mintigo)
Although syndication and marketing automation solutions are new in the media industry,
there are some recent innovation initiatives, such as content syndication features provided
by the broadcaster Fox. During 2013, Fox launched its Digital Content Syndication
Network, which is designed to allow Fox to create, manage and syndicate content to Smart
TVs, connected TVs and television service providers looking to increase audience
16 / 74SAM Public D2.2.1
engagement. David Wertheimer, the president of Fox Broadcasting said "By syndicating
the content we've built around our show broadcasts, we're extending the Fox experience
to viewers across all digital platforms and providing our partners with new and valuable
opportunities around our content.”11 The new service allows Fox partners to take
advantage of Fox’s high-quality content and ensures that fans can enjoy a premium,
cohesive Fox digital content and advertising experience across multiple TV apps and
platforms.
It is apparent that the future of online content will include a shift to more images (including
video) and less text; research12 shows people respond more to images than text but as
people respond instinctively to images they are wide open to misinterpretation without
contextual text. Consumers start to ignore images if they don’t change often so the visual
cues must change frequently and images must be offered in context or the risk of
misinterpretation is likely not to deliver the desired consumer perceptions and reactions to
brands or content.
Content Syndication is one of the three pillars of SAM and, within the project, it acts as an
effective delivery mechanism for media related information — including linked content —
to the end users’ devices. In SAM the content provisioning is dynamically optimised based
on the users’ context, which is primarily defined by who they are, what they are watching
on the 1st Screen, what are they feeling about the content, where they are, etc.
Additionally, Digital Marketing utilise Content Syndication because it will provide the
mechanisms for products’ and campaigns’ delivery and consumption.
2.1.3 SmartTV and Connected Devices
In the last five years the worldwide TV market has gone through a significant evolution,
with the move to flat displays, the analogue signal switch off and the introduction of new
features such as 3D, Smart TV and more recently Ultra HD. These changes initially led to
big sales growth, but recently the sales growth is slowing and in some regions year-on-
year sales are even decreasing.
11
http://get.viggle.com/2013/02/26/feb-26-fox-digital-syndication-network/
12
http://blog.hubspot.com/blog/tabid/6307/bid/33423/19-Reasons-You-Should-Include-Visual-Content-in-Your-Marketing-Data.aspx
17 / 74SAM Public D2.2.1
Figure 8: TV Market Forecast Per Region (millions) (Source: GFK)
Looking at the available TVs in the market, a large part of them are relatively new: in
around 50% of households of Western Europe, the age of the main TV is less than 4 years
and only 10% of televisions in Germany are older than 7 years.
Figure 9: Percentage of Households Having a TV Less Than 4 Years Old (Source: gfu.de)
However, the recent evolution to Smart TV is one of the drivers that have contributed to an
increase in device sales, so with a Smart TV several new functions have become the
norm:
Online streaming of videos (Video on Demand — VOD)
Catch-up TV
Gaming
Web-browsing
Multiscreen control
The latest research from Strategy Analytics has found that global Smart TV shipments
grew 55 per cent during 2013, with Smart TVs accounting for 33 per cent of total flat panel
TV sales during the year. The 'Smart TV Forecast'13 report found that Smart TV sales were
13
http://www.simplifydigital.co.uk/news/articles/2014/02/smart-tv-shipments-grew-55-per-cent-in-2013/
18 / 74SAM Public D2.2.1
strongest in Western Europe, at nearly 45 per cent of all flat screen TVs sold during the
year. By 2017, Strategy Analytics projects that Smart TVs will make up 73 per cent of
global flat panel TV sales, with all but the cheapest TV models having some sort of internet
connectivity.
More than 40% of TVs sold in Europe have the capability of a Smart TV (source: GFK 14).
In DACH, for 66% of people Smart TV functionality is the underlying driver for buying a
new television (source: GFU survey15). Adding differentiating SmartTV features and
increasing the ‘smartness’ of TVs is a means to increase sales. Additionally, some new
SmartTV features could have the potential of being a new revenue source on their own.
While sales in the TV hardware market are slowing down, shipments of tablets and mobile
phones are expected to still show extensive growth in the coming years – mainly in
developing countries, but still with modest growth in developed countries:
Smartphone shipments will grow at a five-year CAGR of 24% in China, 26% in other
Asian countries (including India but excluding Japan), and 37% in rest of the world (e.g.
Latin America and emerging markets) (source: GigaOM Research16)
Shipments of tablets worldwide will grow at a 29% CAGR, from 179 million in 2013 to
427 million by 2017. Tablet shipments are overtaking PC sales and global tablet sales
will exceed those of PCs in 2015. Also for tablets, China and emerging Asian markets
will be the growth leaders. Chinese shipments will grow at a 43% CAGR. The rest of
Asia will grow at a rate of 39%. Already in 2013, Android-based tablets accounted for
more than half of the shipments (source: GigaOM Research17)
14
Internal report for TPVI. Report cannot be shared.
15
http://www.gfu.de/srv/easyedit/_ts_1404923535000/page:home/download/insightstrends/sl_1404920023295/args.link01/de_Pra_sent
ation_Kamp_I&T.pdf
16
Internal report for TPVI. Report cannot be shared.
17
Internal report for TPVI. Report cannot be shared.
19 / 74SAM Public D2.2.1
Figure 10: Forecast of Personal Computing Unit Shipments (Source: IC Insights) 18
TV manufacturers now need to find differentiating features to stay competitive. One way of
moving forwards would be to look at the growing smartphone and tablet market and create
compelling 2nd Screen use cases – such as the SAM Platform. The TV device would
therefore remain the central viewing portal, and maintain or even increase market share of
Smart TVs.
2.1.4 Social Media
Social Media have become an integral part of the everyday life of many people both in
developed and in developing markets. According to a 2014 survey published by the Pew
Research Center [Pew14], 74% of all U.S. Internet users and 89% of 18-29 year-olds
reported using social networking sites. The majority of these social networking users
access their preferred social network on a daily basis (e.g. 63% of its users report
accessing Facebook on a daily basis [DS13]).
The success with users of specific Social Media services appears to be determined by
several key factors:
The number of active users may serve both to attract and to “lock in” users of Social
Media sites. [STA14] identified Facebook as the largest Social Media site in terms of
active users in June 2014 with a reported 1,280 million users
User numbers may be influenced by regional or cultural factors, where a Social Media
provider may not be available in a country or may not be as widely used as in other
regions. For instance, [STA14] reports a user figure of 644 million users for Tencent
QZone, a social networking platform focusing on the Chinese market, as of June 2014.
The Russian Social Media platform VK similarly has largely regional appeal
The perceived makeup and user population of Social Media platforms is plausible both
for platforms with specific topic focus (e.g. the LinkedIn social networking site), and for
18
http://www.icinsights.com/news/bulletins/Personal-Computing-Units-Rising-Despite-Drop-In-Desktops-Notebooks/
20 / 74SAM Public D2.2.1
platforms that are perceived to focus on specific user populations such as Social
Media platforms that appear to allow users to express themselves where they do not
expect to be supervised by their parents
The core features and complete feature set of the individual Social Media platforms
may for instance focus on:
The presentation of a user’s personal profile (e.g. LinkedIn)
The communication of text messages or status updates (e.g. Twitter)
Photographs or videos (e.g. Instagram)
Ephemeral data such as photographs that are only retained for a limited period of
time (e.g. Snapchat)
It should be noted that the authors are not aware of a definition of Social Media that clearly
differentiates between Social Media and platforms that may be considered not to be Social
Media such as chat or messaging platforms (e.g. WhatsApp or Skype) or specialised
community platforms (e.g. dating services). Given the ongoing active development in the
area of Social Media, it is not clear whether creating such a differentiation would be useful
at the time of writing.
Generally, Social Media platforms generate revenues primarily via advertising income, for
instance through “classic” ad placement or referral fees by following links to online shops
from within a platform. Additional income sources can vary between different Social Media
platforms. Possible sources include the hosting of third-party applications that charge end
users a fee of which part is forwarded to the Social Media platform (e.g. for Facebook) or
provisioning of “professional level” services (e.g. in the form of paid premium user
accounts at LinkedIn) – it should here be noted that it has generally been uncommon to
charge end users directly for use of a general-purpose Social Media platform (note,
however, that paid subscriptions are common for other sites e.g. dating sites).
The competitive landscape of Social Media has remained dynamic in the years prior to the
creation of this report. So, while very large Social Media platforms have continued to grow
[DS13], a number of new competitors have established themselves in the marketplace,
usually propelled by offering distinct sets of novel core features that are offered to end
users. At the time of writing it remains unclear whether the Social Media landscape will
remain dynamic, fuelled by a steady stream of novel ideas, “Social Media fashions” and
users’ desires to differentiate from others via their choice of Social Media, or whether a
mature set of Social Media features will be established and satisfied by an equally
established group of core Social Media platforms.
2.1.5 Dynamic Contextual Social Media Community Creation
SAM proposes the automated, and timely, “dynamic” creation and management of Social
Media communities related to content being viewed on a 1st Screen device. The authors
are currently not aware of any system that provides such a functionality related to 2nd
Screen experiences, therefore the remainder of this subsection discusses the main
approaches to social community creation in Social Media irrespective of whether they are
carried out automatically or manually and irrespective of whether they are related to 2nd
Screen or not.
Social Media platforms generally enable the creation of community hubs around
organisations, topics or events, either by representing them as “users” (e.g. on Facebook)
or via specific markers such as hashtags that can be associated with messages and media
related to organisations, topics or events. These features can be used for the creation of
21 / 74SAM Public D2.2.1
Social Media communities as services, that are manually created and curated for and by
Social Media users, and it is common for broadcast media productions to be represented
on major Social Media platforms in these ways - usually for promotional purposes.
Social Media platforms analyse available user data and suggest users to connect to
potentially similar users in order to increase the number of network connections for the
user. Users may also receive suggestions for “non-person entities” on a Social Media
platform to which they may be interested in connecting. These suggestions are usually
based on user profile data, but may also be advertising messages purchased by
organisations represented on a Social Media platform. The latter feature is the one most
closely related to SAM dynamic communities amongst the ones described in this
subsection.
In all of the cases above, community creation is a functionality that is provided in order to
facilitate improvement in marketing reach and user engagement. Community creation is
generally based purely on user relations and static, unlike the community creation
approach in SAM, which is centred on creating communities around content and using
context and which is dynamic.
2.1.6 Business Intelligence & Analytics
The concepts of “business intelligence” (BI) and “business analytics” have been defined in
many ways, from being interchangeable, to contrasting, through to overlapping. A suitable
definition for the context of this document was given by Howard Dresner (a Gartner Group
analyst) who proposed that the term "business intelligence" be understood as an umbrella
term to describe the concepts and methods which aim to improve business decision-
making by using fact-based support systems. In this definition, business analytics is the
subset of business intelligence, focusing on statistics, prediction, and optimisation rather
than the reporting functionality.
The underlying base of the techniques and tools of business intelligence is data. This data
can originate from the external data sources as well as internal sources: external data
include the market and customers; internal data include financial and operations data. The
results of business intelligence lead to business decisions which range from operational
(which include products’ position and pricing) to strategic (which include priorities, goals
and directions).
As the underlying technologies and user requirements have evolved, the scope of
business intelligence has changed significantly over time. In 2014, Gartner [GAR14]
defines business intelligence and analytics as a software platform that delivers the
capabilities across the following main categories:
Information Delivery, relates to how information and analytics tools are displayed and
presented to the end user. Capabilities include reporting, dashboards, ad hoc reports
and queries, Microsoft Office integration, and mobile device integration
Analysis, relates to advanced tools and techniques provided to interpret and derive
information from data. Capabilities include interactive visualization, search-based data
discovery, geospatial and location intelligence, embedded advanced analytics, and
online analytical processing
Integration, relates to how the BI platforms fit into business processes, both emerging
and existing. Capabilities include infrastructure and administration, metadata
management, business user data modelling and mashups, development tools,
embedded analytics, and collaboration
22 / 74SAM Public D2.2.1
The major recent transformations in the business intelligence market have been towards
the analytics aspects of the field. As can be seen in Figure 11, business intelligence
systems are moving from being primarily used for measurement and reporting, (report-
centric), to supporting analysis, prediction, forecasting and optimization, (analysis-centric).
This is driven by a demand for “smart data discovery” technologies such as natural-
language query and search, automated, prescriptive advanced analytics and interactive
data discovery capabilities. Another significant trend is the move to cloud based systems
which is driven by lower costs, faster timelines, mobile access and collaboration.
Figure 11: Business Intelligence Decision Chart (Source: Rose Business Technologies)19
According to Gartner, worldwide business intelligence software revenue is expected to
reach $13.8 billion in 2013, a 7% increase from 2012, with a market forecast to reach
$17.1 billion by 2016.
Figure 12 (below) shows details of the different players in this market in 2014 as opposed
to 2013.
19
http://www.rosebt.com/blog/descriptive-diagnostic-predictive-prescriptive-analytics
23 / 74SAM Public D2.2.1
Figure 12: Gartner's BI Magic Quadrants
The world of Business Intelligence is one that is constantly evolving, changing with the
ever-increasing complexity in sales and marketing. In much the same way that technology
tends to transition from being used by the elite to the general population, BI is in the
process of evolving into a vital series of tools that greatly inform real-time decisions for
executives not only in large companies but also in SMEs.
SAM will implement Business Intelligence techniques linked to advanced Social Mining
functions, such as sentiment analysis, to provide the perfect playground for fact-based
decision making. Applying these techniques, the Content Providers will be capable of
discovering trends, specific reactions in specific film sequences and more; thus allowing
the Media Producers, Publishers or Broadcasters to take further decisions quickly, further
facilitating the commercialisation, exploitation opportunities and monetisation for them.
2.1.7 Dialogue Speech Control Systems
Dialogue is currently an area of growth. The first commercial dialogue system was
deployed in the early Nineties, capable of distinguishing between the utterances “collect
call” and “credit card”, allowing telephone clients to select the mode of payment in the
AT&T network. Since then, dialogue and speech has spread to a variety of different
domains: car infotainment, navigation systems, Internet search, dictation, etc. Although
some products have been successful, the industry is still waiting for the real take-off and in
a Forrester report20, the voice control area is predicted to be the main battleground of 2020
for the current big five (Amazon, Apple, Facebook, Google and Microsoft). The view of the
future home sketched in the report includes array microphones ready for voice input in
every home, with voice services ubiquitously available.
20
https://www.forrester.com/Brief+The+Future+Of+Voice+Control+Goes+Far+Beyond+Dictation/fulltext/-/E-RES114143
24 / 74SAM Public D2.2.1
Today, voice and dialogue are becoming standard features in mobile phones, cars and
home electronics:
Software development kits for Mobile Voice are becoming more frequent (e.g.
Microsoft Cortana21, Nuance Nina22)
Every Android phone comes with voice search enabled and basic enabling
technologies (Text-to-Speech and Automatic Speech Recognition) built-in. The total
number of Android phones sold is approaching 1 billion23.
Every iPhone since 4S comes with the Siri dialogue system (about 300 million iPhones
have been sold since the 4S launch)24
Smart TVs come with voice interaction capabilities25
Most high-end cars and many others (Ford Sync26) come with voice interaction
capabilities
Cars are already being equipped with the Apple CarPlay27 system, allowing users to
interface with Siri when driving
The Apple Watch and the Google Android Wear smart watches are expected to be
voice controlled to a large extent
55% of teen smartphone users use voice search daily28
In the current situation, voice is ready for take-off, not only in the traditional areas (dial-in
IVR systems, cars, mobile phones), but for all kinds of services and all kinds of devices.
The above mentioned devices and services show that the infrastructure for a voice
revolution is already there, with a huge number of voice-supporting devices and a
customer base more accustomed to using voice as a means of interaction.
One of the main benefits of dialogue interfaces is reduced distraction. For example, a
study of in-vehicle interaction showed that speech interaction is less distracting than a
strictly visual and/or touch based interface.29 This is particularly relevant for 2nd Screen
interaction, since it distracts the user from content and advertisements on the 1 st screen.30
A voice-enabled system has the potential to be less distracting and both faster and easier
to use than a strictly touch and screen based interface.
A Google study on the use of voice search31 showed that 59% of teens and 36% of adults
use voice search while watching TV (See Figure 13). Furthermore, a survey by Rovi32 ,of
2,000 Pay TV subscribers has shown that many customers would prefer to use a voice
interface and that customers are willing to extend their service contract for better search or
recommendation features. SAM can benefit from both the general improvements in speech
technologies and the willingness for using voice while watching TV, and even paying for it.
For example, instead of typing search queries or navigating complex menu hierarchies,
users can simply ask “Show other films with Nicole Kidman” or “Who directed this movie?”
21
http://msdn.microsoft.com/en-us/library/dn630430.aspx
22
http://www.nuance.com/landing-pages/products/nina/
23
http://www.gartner.com/newsroom/id/2665715
24
http://www.theverge.com/2014/1/27/5350106/apple-q1-2014-earnings
25
http://www.trustedreviews.com/lg-smart-tv-review-voice-recognition-and-recommendations-page-2
26
http://www.ford.com/technology/sync/
27
https://www.apple.com/ios/carplay/
28
http://searchengineland.com/teens-unihibited-voice-search-many-adults-feel-embarrassed-205881
29
http://www.macs.hw.ac.uk/InteractionLab/Semdial/semdial14.pdf
30
See e.g. http://wywy.com/wp-content/uploads/2013/10/white-paper-second-screen-study.pdf
31
http://googleblog.blogspot.se/2014/10/omg-mobile-voice-survey-reveals-teens.html
32
http://www.rovicorp.com/company/press-releases/2014/9/12/new-multi-region-survey-reveals-pay-tv-subscribers-entertainment.html
25 / 74SAM Public D2.2.1
Figure 13: Teen and Adult Usage of Voice Search33
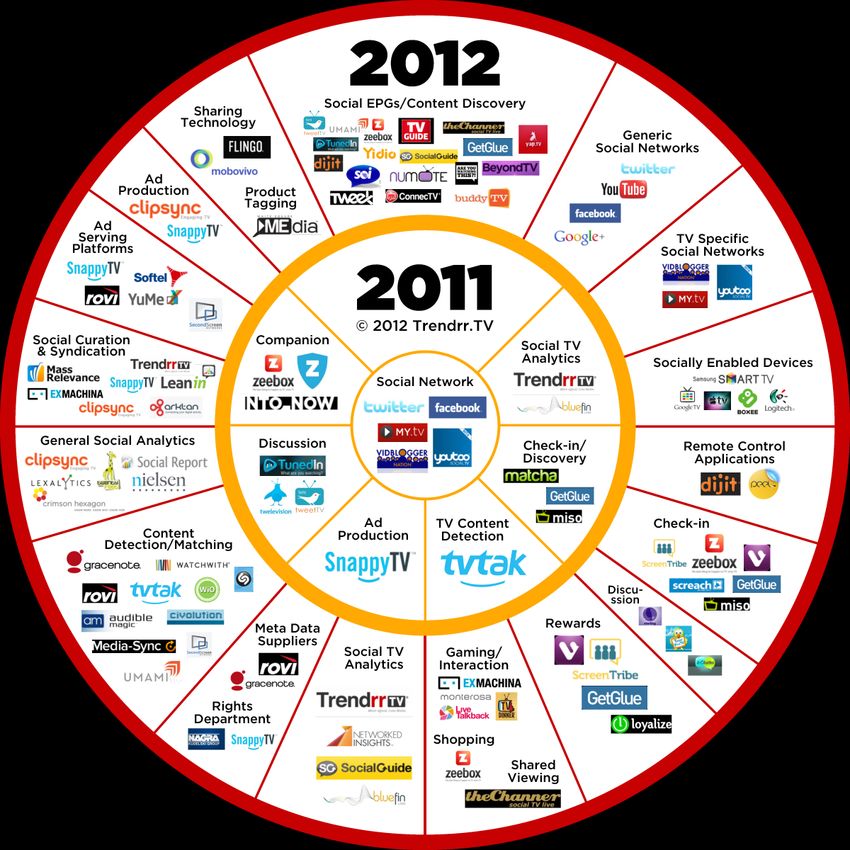
There are already conversational interfaces for 2 nd Screen interaction entering the market.
Rovi recently introduced a dialogue interface to their video and music data, see section
Error! Reference source not found. for details.34 Netflix also see a value in
conversational interfaces and has launched a voice-enabled recommendation service (see
Error! Reference source not found. below).35
33
http://marketingland.com/google-study-voice-search-directions-103985
34
http://www.rovicorp.com/company/press-releases/2013/9/4/rovi-and-nuance-to-bring-voice-enabled-content-to-devices.html
35
http://mashable.com/2013/06/28/netflix-max-voice-ps3-voice/
26 / 74You can also read