Genetic Assessment of Breeding Patterns and Population Size of the Sicklefin Lemon Shark Negaprion acutidens in a Tropical Marine Protected Area: ...
←
→
Page content transcription
If your browser does not render page correctly, please read the page content below
Genetic Assessment of Breeding Patterns
and Population Size of the Sicklefin Lemon
 Shark Negaprion acutidens in a Tropical
 Marine Protected Area: Implications for
 Conservation and Management

 James Henry Robert McClelland

 Master of Science by Research

 University of York
 Environment and Geography
 March 2020
Abstract

The sicklefin lemon shark (Negaprion acutidens) is found in coastal waters of the Indo-West
Pacific where it has been assessed by the IUCN as threatened with extinction. Information on
the species’ reproductive ecology and local abundance, which are important considerations
for effective management, remain limited. I used genetic analyses of tissue samples collected
from juvenile N. acutidens, at the Curieuse Marine National Park (CMNP), Seychelles,
between 2014-2017, to (1) estimate the number of adults reproducing at CMNP annually and
(2) identify their breeding patterns through pedigree reconstruction.

I report strong evidence of philopatry; primarily in females. Over the study period 25
reconstructed females produced multiple litters; the majority (88%) displayed biennial
parturition. The remaining 12% displayed annual parturition. Multiple paternity was common
(66% of 58 litters; mean number of sires per litter = 1.92). Convenience polyandry provides a
likely explanation for this and may be driven by biased operational sex ratios during mating.
Male philopatry to CMNP was low (17% of 114 reconstructed males) and may be influenced
by habitat availability. Males likely breed over broader geographic scales than females. The
breeding patterns I report are similar to those identified in other populations of lemon sharks
and are likely applicable across the genus.

In Seychelles, shark stocks are in decline due to overfishing. The high female philopatry in N.
acutidens suggests protection of parturition sites, such as CMNP, is likely important to the
conservation of local populations. However, adult life-stages, particularly males due to wider-
ranging behaviour, are still subject to fishing pressure outside the park. Additional
management measures are required to prevent further population declines. Species-specific
management appears to be the best approach. The introduction of science-based fisheries
control measures, for N. acutidens and other shark species, should be an urgent priority in
the Seychelles.

 2
List of Contents
Abstract............................................................................................................................. 2
List of Contents .................................................................................................................. 3
List of Tables ..................................................................................................................... 4
List of Figures .................................................................................................................... 4
Acknowledgements ........................................................................................................... 5
Declaration........................................................................................................................ 7
1. Introduction ............................................................................................................... 8
 1.1. Ecology, Molecular Techniques and Species Management ............................................. 8
 1.2. The Ecology and Management of Sharks ...................................................................... 13
 1.3. This Study .................................................................................................................... 16
2. Methodology ........................................................................................................... 23
 2.1. Ethics Statement ......................................................................................................... 23
 2.2. Sample Collection ........................................................................................................ 23
 2.2.1. Study Site ..................................................................................................................................... 23
 2.2.2. Sampling Protocol ........................................................................................................................ 24
 2.3. Laboratory Work ......................................................................................................... 25
 2.3.1. DNA Extraction ............................................................................................................................. 25
 2.3.2. Polymerase Chain Reaction and Microsatellite Multiplex Optimization...................................... 26
 2.3.3. Sequencing and Scoring ............................................................................................................... 29
 2.4. Statistical Analysis ....................................................................................................... 30
 2.4.1. Preliminary Analysis ..................................................................................................................... 30
 2.4.2. Population Estimates ................................................................................................................... 31
 2.4.3. Breeding Patterns ........................................................................................................................ 35
3. Results ..................................................................................................................... 38
 3.1. Microsatellite Description............................................................................................ 38
 3.2. Population Estimates ................................................................................................... 38
 3.2.1. Number of Adults ......................................................................................................................... 38
 3.2.2. Evaluating NRA Estimates .............................................................................................................. 40
 3.2.3. Cohort Size ................................................................................................................................... 41
 3.3. Breeding Patterns ........................................................................................................ 41
 3.3.1. Instances of Philopatry................................................................................................................. 41
 3.3.2. Further Analysis ........................................................................................................................... 42

4. Discussion ................................................................................................................ 44
 4.1. Population Size ............................................................................................................ 45
 4.2. Breeding Patterns ........................................................................................................ 48
 4.3. Implications for Conservation and Management Options ............................................ 55
5. Conclusions .............................................................................................................. 65
Appendices ...................................................................................................................... 66

 3
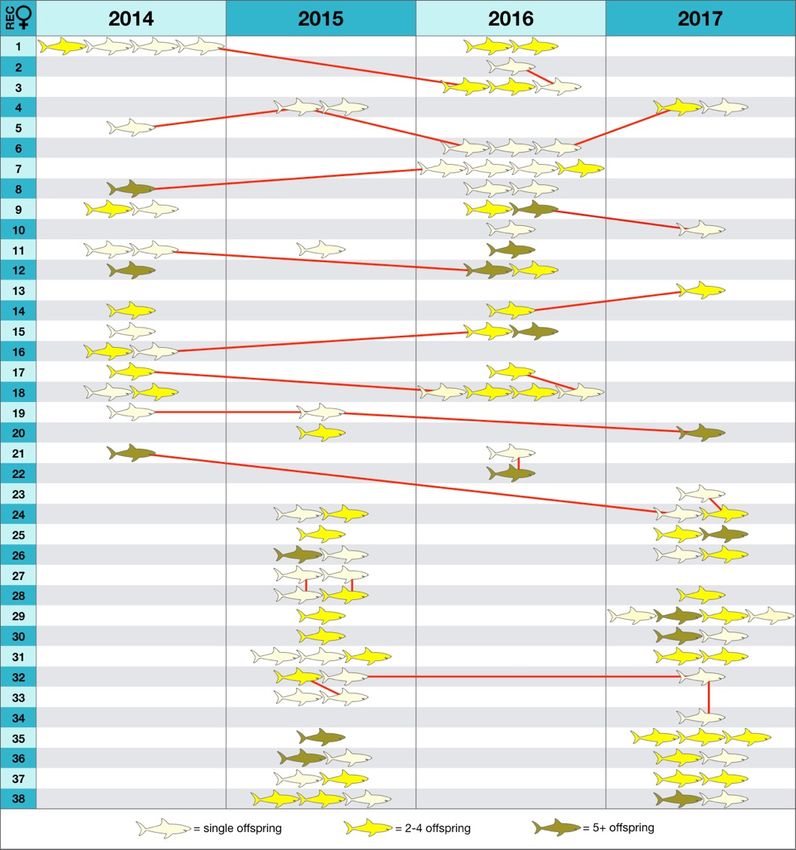
References ....................................................................................................................... 73

 List of Tables
Table 1: Single sample estimators of effective population size and corresponding software
programmes ........................................................................................................................... 12
Table 2: Number of sharks sampled by month ....................................................................... 25
Table 3: Microsatellite loci, primer sequences and multiplexes ............................................. 28
Table 4: Existing estimates of cohort size............................................................................... 32
Table 5: Estimates of adult population size............................................................................ 39
Table 6: New and existing estimates of cohort size ............................................................... 41

 List of Figures
Figure 1: Geographic location of the sampling site within the Curieuse Marine National Park,
Seychelles ............................................................................................................................... 24
Figure 2: Plots of iterative NRA sub-sampling curves and adult population size, by cohort .... 40
Figure 3: Breeding patterns of N. acutidens ........................................................................... 43
Figure 4: Characteristics of shark conservation and management options ........................... 63

 4
Acknowledgements

I have been lucky enough to work alongside a great many talented people over the last five
or so years since the lemon shark tagging project first started in the Curieuse Marine National
Park. Without many of these people, this project would likely not have been possible. I am
now fortunate to call many of these people my good friends. Sincere thanks to everyone
involved and apologies to any I may have missed.

I must of course start my thanks with my supervisors Prof. Callum Roberts, Dr. Julie Hawkins
and Dr. Serge Planes for their guidance and encouragement throughout this project, even
when we had to navigate through some challenging situations.

Serge allowed me to use the excellent facilities at the CRIOBE laboratory in Perpignan. Celine
Tardy was charged with keeping an eye on me and she shared her knowledge of the
laboratory, its equipment and protocols, and most importantly the best burger restaurants of
Perpignan, with both willingness and patience. The many other staff, researchers and
students of CRIOBE were all welcoming and extremely helpful. Dr. Johann Mourier, Natalie
Tolou, Claire Peyren, Eli Nebot Colomer, Dr. Emilie Boissin, Charles Loiseau and Peter Esteve
were all influential to my time there, while a good deal more provided the occasional much
needed social distraction.

The staff and students at the University of York were equally helpful and I must specifically
thank Dr. David Shaw for his crash course in using Matlab and Karine Rasool who helped
source documents and information from Seychelles Fishing Authority.

In 2017 a draft of Dr. Karl Philips’ work on parentage analysis in Green Turtles came across
my desk whilst I was working on Cousine Island. He is probably unaware how important that
manuscript was in sparking the idea for this current study, but he then went on to provide
great advice for my original project proposals, so I must take the opportunity to thank him
here.

 5
I am of course entirely indebted to Seychelles National Parks Authority, who allowed me to
use their lemon shark tissue samples in this study; also to all the staff and volunteers at GVI
Curieuse who helped in sample collection, especially Daniel Davies, Cheryl Sanchez, Alan
Grant, Bridget Rakemakers and Peter Kowalski. Finally within GVI, I owe much to Regional
Director Christophe Mason-Parker who hired me in 2014 to join the team on GVI Curieuse
where I first became ‘hooked’ on lemon sharks. He has continued to support me long after I
left GVI and acted as the man ‘on the ground’ in Seychelles, helping with all things logistical.

I cannot conclude without of course thanking my family and friends for tolerating my long
absences and offering their continued support. Georgina Drew kindly gave me a bedroom and
free run of her home during my time in Yorkshire. Finally, to my girlfriend Rebecca Hodgkiss,
who has been involved in this journey since the beginning, thank you for all your love and
encouragement.

 6
Declaration

Between 2014-2016 I was employed by Global Vision International (GVI) on Curieuse Island
where I was involved in the joint GVI/Seychelles National Parks Authority lemon shark tagging
project from which the samples used in this present study originate.

Throughout the writing of this thesis I received guidance and support from my supervisors
Prof. Callum Roberts and Dr. Julie Hawkins. Dr. Serge Planes provided specific support with
the genetic components of this study.

I declare that this thesis is a presentation of original work and I am the sole author. This work
has not previously been presented for an award at this, or any other, University. All sources
are acknowledged as References.

James Henry Robert McClelland

1st March 2020

 7
1. Introduction

 1.1. Ecology, Molecular Techniques and Species Management

Fisheries management is traditionally based on data relating to abundance, distribution and
age-classes of fish caught but, without also considering aspects of a species’ ecology and
evolution, such approaches are often ineffective (Hutchings 2000). In particular mating
systems should be a major consideration in conservation planning and fisheries management
as they may affect a populations ability to withstand, or recover from, exploitation (Rowe and
Hutchings 2003).

In natural populations, reproduction is rarely monogamous, and several polygamous mating
systems are commonly encountered (Freeland 2005). Polygyny, where a male mates with
multiple females, has a clear and direct evolutionary benefit to the male as it allows him to
maximise his reproductive output (Freeland 2005). By contrast the drivers of polyandry,
where a female mates with multiple males, appear more complicated and the evolutionary
benefits are less obvious (Tregenza and Wedell 2002). Polyandry can lead to multiple
paternity, where a single litter or egg clutch is sired by multiple males. This may provide
indirect benefits to the female such as inbreeding avoidance, increased offspring survival and
higher female reproductive output (Zeh and Zeh 2001, 2006; Tregenza and Wedell 2002).

However, multiple mating can carry increased costs to females, such as risk of injury or
disease, which may outweigh any potential benefits (McKinney and Evarts 1998; Pratt and
Carrier 2001). In many different species of animals, including insects, mammals and birds,
males may employ coercive tactics in an attempt to force resistant females into mating
(Clutton-Brock and Parker 1995). When the physical costs of resisting coercion exceed the
costs associated with copulation, the female may submit to superfluous mating in an
attempted to reduce additional stress that would come from continued resistance; this is
known as convenience polyandry (Cordero and Andrés 2002; Daly-Engel et al. 2010; Lubanga
et al. 2018).

 8
Another important consideration in conservation planning is philopatry (Feldheim et al.
2014). Philopatry is a term derived from the Greek for ‘home-loving’; it is commonly used
interchangeably with site fidelity, and refers to the behaviour of returning to a specific site or
locality (Hueter 1998; Feldheim et al. 2014). Philopatry is also commonly associated with
reproduction (Hueter et al. 2005) and for the purposes of this study should be considered the
act of returning to a particular site specifically for reproduction. Several specific types of this
behaviour exist, such as natal philopatry, which involves returning to the natal nursery site,
and sex-specific philopatry, where the degree of philopatry varies between sexes (Hueter et
al. 2005). When philopatry is common in both sexes it can lead to closed populations that are
sustained by intrinsic reproduction (Feldheim et al. 2014). And, in highly philopatric
populations, exploitation or habitat degradation at one location can have detrimental
implications for a whole population (Hueter et al. 2005).

Many questions on the mating systems and reproductive ecology of wild populations that
were previously extremely challenging to address through direct observation, can now be
answered through studies in molecular ecology (Freeland 2005). This field utilises modern
genetic techniques to quantify genetic diversity in natural populations and applies this to
answer traditional ecological questions (Freeland 2005). Much theory in the field of molecular
ecology is underpinned by Mendel’s laws of Inheritance, which dictate that in sexually
reproducing diploid organisms, each pair of chromosomes in the offspring will comprise of
one chromosome inherited from the mother and one from the father (Freeland 2005). It
follows that for a specific segment of DNA on a chromosome, known as a locus, diploid
organisms will have two versions of said locus, known as alleles, one from each chromosome
in the pair (Freeland 2005). Within an individual these two alleles can be identical or different,
in which case the individual is considered to be either a homozygote or a heterozygote
respectively. In cases where alleles of an identical DNA sequence have been inherited from a
common ancestor these are described as identical by descent (Freeland 2005).

The use of molecular markers is essential to the field of molecular ecology as they allow
researchers to target equivalent sections of DNA in different individuals and identify genetic
similarities and differences. In particular, co-dominant markers allow researchers to identify
the size of both alleles at a particular locus and as such determine whether the individual is a

 9
hetero- or homozygote (Freeland 2005). Microsatellites are co-dominant markers that
comprise of short tandem repeats (STR) or simple sequence repeats (SSR), which are tracts of
DNA comprising a repetitive sequence of 1-6 base pairs in length, sandwiched between
flanking regions of unique non-repetitive DNA (Freeland 2005). Microsatellites have long
been favoured in parentage analysis (Jones et al. 2010). In comparison to normal DNA they
are characterised by extremely high mutation rates, which means they are particularly
effective for making comparisons between individuals (Freeland 2005). These high mutation
rates are most typically attributed to the loss or addition of repeat sections during the DNA
replication process; this changes the sequence length and results in a polymorphic locus with
multiple potential alleles (Freeland 2005).

By designing primers which bind to the unique flanking regions it is possible to amplify the
variable repetitive sections and identify the length of each allele (Freeland 2005). By way of
an example, consider the following microsatellite sequence, (AC)15:

 ATCGGCTAGACACACACACACACACACACACACACACACACTGCTAATCG

(AC)15 is an STR because it comprises of two base pairs (A and C) that repeat 15 times
(underlined) between the two unique flanking regions (bold). During DNA replication this
sequence may be copied correctly and stay as (AC)15. It may gain a repeat to become (AC)16 or
lose one to become (AC)14 leading to individuals with differing length alleles, as below:

Individual 1 (homozygote – locus scored as 15, 15)
Allele 1: (AC)15 – ATCGGCTAGACACACACACACACACACACACACACACACACTGCTAATCG
Allele 2: (AC)15 – ATCGGCTAGACACACACACACACACACACACACACACACACTGCTAATCG

Individual 2 (heterozygote – locus scored as 15,16)
Allele 1: (AC)15 – ATCGGCTAGACACACACACACACACACACACACACACACACTGCTAATCG
Allele 2: (AC)16 – ATCGGCTAGACACACACACACACACACACACACACACACACACTGCTAATCG

 10
Individual 3 (heterozygote – locus scored as 14,16)
Allele 1: (AC)14 – ATCGGCTAGACACACACACACACACACACACACACACACTGCTAATCG
Allele 2: (AC)16 – ATCGGCTAGACACACACACACACACACACACACACACACACACTGCTAATCG

It is the relative frequencies with which these various alleles are found in a population, and
the proportion of individuals which appear as either homo- or heterozygotes, that forms the
basis of a number of fundamental principals in the statistical discipline of population genetics.
For example, the Hardy-Weinberg Equilibrium (HWE) states that, in an idealised population,
the frequency of alleles within that population will remain constant across generations
(Freeland 2005). Using HWE’s supporting equation it is possible to estimate the level of
expected heterozygosity (He) in a population. This can in turn be compared to the observed,
true, heterozygosity (Ho) to identify potential deviation from the equilibrium. If deviation is
evident this signifies a change in genetic diversity, which when it represents a reduction in
heterozygosity could be attributed to factors such as inbreeding. This derivation of HWE
forms the basis of the inbreeding coefficient (ƒ or F; Wright 1922) where:

 !
 = 1–
 "

From this, commonly used F-statistics are derived, which measure the degree of
heterozygosity across various levels of population structure to test for inbreeding. For
example FIS and FIT are inbreeding coefficients for an individual (I), relative to a subpopulation
(S) or the total population (T) (Freeland 2005).

Using data from co-dominant markers it also possible to calculate the size of the “effective
population” (Ne) which can essentially be thought of as the number of reproductive
individuals that an idealised or model population would need to be comprised of, for it to
exhibit the same genetic traits as the study population (Freeland 2005). This is a hugely
important parameter in conservation biology as it influences evolutionary forces such as
migration and natural selection, determines the rates of inbreeding and genetic drift, and is
an important factor in determining population viability (Ackerman et al. 2017). This concept
was first introduced by Wright (1931), and since then a number of accepted methods of

 11
calculating Ne in natural populations have been developed which are implemented in freely
available software programmes (Table 1; Wang, 2016). When Ne is calculated using samples
taken from individuals in overlapping generations an estimate of the size of the wider
reproductive population is produced (Freeland 2005). By using samples taken from a single
cohort of offspring, within a population with overlapping generations, an estimate of the
effective number of breeders (Nb), that is the number of parents which produced that specific
cohort, can be calculated (Ackerman et al. 2017).

Table 1: Single sample estimators of effective population size and corresponding software
programmes (Table 2; Wang 2016)

The analysis of pedigrees and parentage in natural populations is a corner stone of molecular
ecology and can provide indispensable information in the study of sexual selection, patterns
of dispersal and recruitment, inbreeding depression, effective population size, conservation
biology, quantitative genetics, speciation and natural selection (Pemberton 2008; Jones et al.
2010; Flanagan and Jones 2019). Again, Mendel’s laws of Inheritance form the core principals

 12
of all parentage analysis, but this can be achieved through a number of different approaches
(Flanagan and Jones 2019). These vary in the way pedigree relationships are considered and
statistically evaluated (Jones et al. 2010). Crucially, all but one of these approaches require
knowledge of parental genotypes or of shared parentage between individuals (Jones et al.
2010; Flanagan and Jones 2019). When no adults have been sampled and no common
parentage is known, as is the case in this study, only methods that rely on the sibship
reconstruction approach can be employed. Essentially, this approach first establishes sibling
relationships to provide information on common parentage, then employs parental
reconstruction methods to establish parentage using common alleles in these now ‘known’
sibling groups (Jones et al. 2010).

There are numerous well tested parentage analysis software programmes available to
researchers (Jones et al. 2010; Flanagan and Jones 2019). However, many of these only
consider single pairwise relationships in their analysis, an approach which can cause
compatibility issues in relationship allocations. By comparison, programmes which consider
the full-likelihood of the entire reconstructed pedigree are generally more robust (Jones and
Wang 2010).

 1.2. The Ecology and Management of Sharks

Elasmobranchs (sharks and rays) form a taxonomic subclass of Chondricthyes, the
cartilaginous fishes, whose origins can be traced back over 400 million years (Compagno 1990;
Amaral et al. 2018; Boisvert et al. 2019). Extant sharks, of which there are approximately 500
recognised species, often occur at or near the top of ecological pyramids (Dulvy et al. 2017)
from where they can exert top-down control on food webs by removing weak and diseased
prey or restricting the foraging behaviour of prey species (Ferretti et al. 2010). Some
elasmobranchs occupy important central roles in complex food webs (Bornatowski et al.
2014) and large sharks are the most important predators of smaller elasmobranchs (Heithaus
and Vaudo 2012). In some ecosystems the loss of large sharks has been linked to trophic
cascades (Ferretti et al. 2010) and in others it could lead to mesopredator release (Heupel et
al. 2014; Bornatowski et al. 2014). Sharks may also provide other ecosystem functions, for

 13
example, mobile species are responsible for translocating nutrients between pelagic and
coastal habitats (Williams et al. 2018).

In the 21st century significant population declines have been reported in many shark species,
with some populations reduced by up to 99% (Baum 2003; Myers et al. 2007; Ferretti et al.
2010). These declines are primarily due to overfishing and globally, a quarter of all shark and
ray species are now threatened with extinction (Dulvy et al. 2014, 2017). Large, shallow water
species face the greatest risk and tropical shark species that utilise coastal nurseries are
especially vulnerable to anthropogenic threats (Knip et al. 2010; Dulvy et al. 2017). Due to
common life history traits such as slow growth rates, late sexual maturity, low fecundity and
long gestation periods, many shark populations do not readily recover once depleted (Cortés
2000).

One potential management approach to protect, and aid the recovery of, depleted shark
populations is the implementation of Marine Protected Areas (MPAs) (e.g. Speed et al. 2018).
Over the last decade there has been a major increase in the designation of MPAs globally.
This has been driven by targets such as the United Nations’ Convention on Biological Diversity,
which established the target to protect 10% of the global ocean by 2020, and the United
Nations’ Sustainable Development Goal 14, which reinforced this (Lubchenco and Grorud-
Colvert 2015; Sala et al. 2018). When they are well managed MPAs can promote recovery in
fish stocks (Lester et al. 2009), including shark species (Speed et al. 2018). However, as a
management tool on their own, MPAs generally offer insufficient levels of protection for
sharks and rays (MacKeracher et al. 2019) and there are many other policies and tools
managers should also consider (Shiffman and Hammerschlag 2016)

As discussed earlier, life history, ecology and behaviour are all influential to a species ability
to tolerate or recover from exploitation; within this reproductive ecology and mating systems
play a particularly important role. Shark reproductive strategies vary at both family and genus
level, relative to the mode of parity (Parsons et al. 2008). For example, viviparity is more
common in elasmobranchs than oviparity (Dulvy and Reynolds 1997) but both strategies
require internal fertilisation (Cortés 2000; Parsons et al. 2008).

 14
Copulation can be very violent in sharks and it is common for a male to bite or orally hold a
female as part of the process (Pratt and Carrier 2001). Females of many shark species have
been documented with substantial copulation related wounds to their trunk, dorsum and fins
which may have considerable costs in terms of individual fitness (Stevens 1974; Ritter and
Amin 2019). Biting can occur: (1) prior to copulation to signal male intent, stop the female
and/or encourage her to submit to copulation or, (2) during copulation to hold the female in
position while the male inserts his claspers (Stevens 1974; Carrier et al. 1994; Conrath and
Musick 2012). Upon insertion the clasper will splay, often erecting a hook or spur, to help
maintain its position inside the female’s reproductive tract (Conrath and Musick 2012). This
can cause internal damage and a subsequent reduction in female fitness (Pratt and Carrier
2001; Byrne and Avise 2012).

Polygamous mating systems have been reported for many shark species (Byrne and Avise
2012). Polyandry has been directly observed in only a few species (e.g. nurse shark: Carrier et
al. 1994), but through genetic parentage analysis, numerous cases of multiple paternity have
been reported in the offspring of both viviparous and oviparous sharks (Griffiths et al. 2011;
Byrne and Avise 2012). DiBattista et al. (2008a) found no evidence of indirect genetic benefits
from polyandry in Lemon sharks Negaprion brevirostris, and in line with this, convenience
polyandry has been suggested as the main driver of polyandry in that, and other, shark species
(Daly-Engel et al. 2010; Griffiths et al. 2011; Mourier et al. 2013).

Post-copulatory female sperm storage has been identified in many shark species and in some
species viable sperm can be stored for several years (Pratt 1993; Parsons et al. 2008). This
allows for delayed fertilisation (Holt and Lloyd 2010) and may enable female sharks to self-
inseminate at a time of good reproductive fitness, for example once mating wounds have
healed or energy reserves have been replenished after a long migration (Pratt 1993). Sperm
storage may also facilitate multiple paternity in sharks (Griffiths et al. 2011).

Following internal fertilisation, gestation periods in elasmobranchs vary widely between
species, ranging from several months to over three years (Conrath and Musick 2012). Many
commercially important species of carcharhinid sharks have a gestation period of
approximately one year, followed by a resting period of approximately one year before the

 15
next ovulation: a potential biennial reproductive cycle (Clark and Von Schmidt 1965; Conrath
and Musick 2012). Other species may exhibit a biennial cycle with a gestation period of almost
two years, but no resting phase, or have an annual cycle with a gestation period of
approximately 12 months, equally with no rest phase (Conrath and Musick 2012).

Shark pups begin life well developed and independent (Cortés 2000). However, they still face
considerable risk of predation, primarily from larger sharks. As such, juvenile sharks
frequently utilise, sheltered, shallow water habitat which can offer protection from the threat
of predation (Branstetter 1990). Such sites can be accurately defined as nursery areas when:
(1) juvenile sharks are more commonly encountered in that area than in other areas; (2)
juvenile sharks have a tendency to remain in or return to said area for extended periods of
time; (3) the area or habitat is repeatedly used across years (Heupel et al. 2007). Philopatry
appears to play a role in occurrence of nursery site as there are no reported cases of separate
pupping and nursery grounds in sharks (Parsons et al. 2008), but there is evidence of long-
term parturition site fidelity at nursery sites in some shark species (e.g. Feldheim et al. 2014),
which suggests that nursery sites are selected by mothers. Philopatry and even natal
philopatry have been observed across numerous shark species via molecular ecology and
tagging/tracking based studies (Hueter et al. 2005; Parsons et al. 2008; Feldheim et al. 2014).

 1.3. This Study

The Republic of the Seychelles (henceforth ‘Seychelles’) is an Indian Ocean archipelago of 115
islands, with a population of 96,750 inhabitants, that is commonly divided into two groups.
The ‘Inner Islands’ are a cluster of primarily granitic islands located on a shallow submarine
plateau (approx. 41,000 km2,
Seychelles’ Exclusive Economic Zone (EEZ) covers almost 1.4 million km2 of ocean and the
nation’s two primary industries are fisheries and tourism (Le Manach et al. 2015). The fishing
fleet has been categorised by Le Manach et al. (2015) as:
 (1) Small artisanal boats (5-13m) which target shallow water banks and reefs from which
 the catch is primarily for local consumption
 (2) Small domestic semi-industrial longline vessels that target large pelagic fish further
 offshore than the artisanal fleet
 (3) Industrial foreign owned purse-seine and longline vessels which target large pelagic
 fish throughout the EEZ

As reported by Seychelles Fishing Authority (2016a), in 2015 the industrial fleet was
responsible for 94% of the total catch (54100Mt; comprising 85% purse-seine; 9% longliners)
in the Seychelles EEZ; industrial longliners were responsible for the majority of the total shark
catch (208.9Mt; 88%). In the early 2000s, to capitalise on the valuable trade in shark fins, the
semi-industrial fleet targeted sharks as a priority and finning was common practice within the
fishery (Le Manach et al. 2015). Shark finning is the practice of removing and retaining a
shark’s fins and disposing of the shark carcass whilst at sea (Worm et al. 2013). Anti-finning
legislation was implemented in 2006, which requires all sharks to be landed whole (Fisheries
(Shark Finning) Regulations 2006). Subsequently the semi-industrial fleet now accounts for
the smallest proportions of total and shark catch (195Mt [0.3%] and 1Mt [0.4%] respectively
in 2015; Seychelles Fishing Authority 2016a). However those fleets target pelagic species
throughout the large Seychelles EEZ and are prohibited from fishing in shallow water (
declines in many species groups targeted by the fishery (Robinson et al. 2020), although some
fishers have been able to maintain CPUE by switching to targeting species of lower trophic
value (Robinson et al. 2019).

Seychelles has a long history of shark fishing dating back to the 18th century and the practice
carries significant historical and socio-economic importance (Seychelles Fishing Authority
2007). For example, “Shark Chutney” is a popular Seychellois dish and it is a local belief that
consumption of shark meat has physical benefits (e.g. makes you stronger; personal
observation, James McClelland 2014-2018). Due to historically unregulated fishing, some
local shark populations were considered over-exploited by the 1950s (Seychelles Fishing
Authority 2007; Le Manach et al. 2015). Within the artisanal shark fishery specifically, CPUE
has more than halved since 1990 (Robinson et al. 2020) suggesting further declines driven by
the increase in artisanal fishing pressure. Despite this, fishery management for sharks remains
limited in Seychelles. The remit of the 2007 National Plan of Action for the Management and
Conservation of Sharks expired in 2011 (Seychelles Fishing Authority 2007) and a revised
management plan is yet to be implemented.

Seychelles has a strong record for terrestrial nature conservation, and with over 43% of its
landmass protected under national parks or nature reserves, the country has been hailed as
a leader in sustainable tourism (Gerlach 2008). Comparatively, marine protection measures
were historically far more limited. The Saint Anne Marine National Park was established in
1973 and was the first no-take MPA in the Western Indian Ocean. Further MPAs were
established in the years since, however until recently, less than 0.1% of Seychelles’ EEZ
constituted no-take MPAs (Jennings et al. 1996). These reserves should offer protection for
local sharks, however, within the Inner Islands poaching is a recognised issue (Jennings et al.
1996; Wood 2004).

Reform of Seychelles MPA network is however underway: the government, in partnership
with the international conservation NGO ‘The Nature Conservancy’, is currently undertaking
a large scale Marine Spatial Planning Initiative covering the country’s entire EEZ. In 2018,
phase one of this four-year project was completed and two new large scale MPAs were
designated to protect 16% of the EEZ including a no-take zone of 74 400km2 (~5% of EEZ)

 18
surrounding Aldabra Atoll (Seychelles Marine Spatial Plan 2019). Enforcement of these new
MPAs begins in 2020 and additional areas have now been gazetted for protection bringing
the total protected area of the Seychelles EEZ to 30% (Seychelles Marine Spatial Plan 2020).

The Curieuse Marine National Park (CMNP), designated in 1979, is one of the country’s oldest
MPAs. The waters surrounding Curieuse Island are managed by Seychelles National Parks
Authority (SNPA) as a no-take marine reserve (Hodgkiss et al. 2017). The island hosts a
research station run by Global Vision International (GVI), a community development and
conservation NGO, who work in partnership with SNPA to maintain a permanent
conservation-focused scientific monitoring programme within the park (Kowalski et al. 2017).
This research is used by SNPA to make informed management decisions relating to the Parks
flagship species. On land, the island provides important nesting habitat for endangered
marine turtles (Burt et al. 2015) and supports populations of endemic Coco de Mer (Lodicea
maldivica), Seychelles Paradise Flycatcher (Terpsiphone corvina) and free roaming Aldabra
giant tortoises (Aldabrachelys gigantea), which are all monitored under GVI programmes
(Kowalski et al. 2017). The surrounding marine reserve protects 10.8km2 of shallow water
coastal habitat including mangrove forest, seagrass beds, and granitic and carbonate reefs
(Jennings et al. 1996; Hodgkiss et al. 2017)

In 2014, SNPA and GVI established a long-term mark-recapture study to investigate
population parameters of juvenile sicklefin lemon sharks (Negaprion acutidens) utilising the
CMNP as a nursery area. This study has provided valuable information on the population size,
structure and growth rates of juvenile N. acutidens in the CMNP and it has highlighted the
importance of the MPA as a pupping ground and nursery area for this species (e.g. Hodgkiss
et al. 2017; Kowalski et al. 2017). From this research it is estimated that 255-611 N. acutidens
were pupped annually in the reserve between 2014-2018 (Hodgkiss et al. 2017; Kowalski et
al. 2017; Beasley et al. 2018).

N. acutidens is one of two extent species of lemon shark found globally. This species of large
carcharhinid shark can grow up to 310 cm in length and is found in coastal waters of the Indo-
West & Central Pacific (Compagno 1984). Mature individuals are generally associated with
coral reefs and deeper sandy plateaus whilst atoll lagoons, shallow coastal habitat and

 19
mangroves provide nursery habitat for juveniles (Stevens 1984; Hodgkiss et al. 2017). This
preference for coastal environments makes N. acutidens particularly susceptible to
anthropogenic pressures such as habitat loss and unregulated inshore fisheries which can
lead to local depletions (Filmalter et al. 2013; Dulvy et al. 2017). Over-exploitation across
much of its range, has caused population declines in N. acutidens, to the extent that the
species is described as Vulnerable to extinction globally, extirpated in India and Thailand, and
locally Endangered in South East Asia (IUCN Red List; Pillans 2003). To my knowledge no local
status assessment has been conducted for N. acutidens in Seychelles. However, the species is
caught within the general artisanal shark fishery (Seychelles Fishing Authority 2007). Given
the ongoing expansion of this fishery and N. acutidens susceptibility to such pressure,
improved conservation measures are necessary for this species.

Relatively little is known about N. acutidens compared to the closely related and extensively
studied Atlantic and Eastern Pacific lemon shark (N. brevirostris; Schultz et al. 2008; Filmalter
et al. 2013). Young N. brevirostris have been shown to utilise their birthing grounds as nursery
sites until they are approximately three years old, after which they disperse further afield
(Chapman et al. 2009). In N. brevirostris there is strong evidence of female reproductive
philopatry, a biennial reproductive cycle, and a polyandrous mating system, which generates
high levels of multiple paternity (Feldheim et al. 2004; DiBattista et al. 2008b). Mature
females have been shown to return to their natal nursery grounds for parturition (Feldheim
et al. 2014), but there is little evidence of reproductive philopatry in males of this species.

N. acutidens is placentally viviparous, producing litters of 1-13 (mean = 9.3) pups (Compagno
1984; Stevens 1984). Length at maturation is 220-240cm (Compagno 1984; Stevens 1984) but
the age at which this is reached, and the species’ longevity has not been reported. At CMNP,
parturition usually occurs from mid-September but has been observed as early as late August
(GVI and SNPA unpublished data). An earlier study at Aldabra Atoll in Seychelles suggested
that females breed biennially whereby ovulation and mating occur in October-November,
pregnancy in December and parturition happens after a gestation period of 10-11 months in
the following October (Stevens 1984). In that study biennial parturition was assumed given
that approximately 50% of mature females were not gravid at the time of dissection. A
primarily biennial parturition cycle was also observed in the Society Islands, French Polynesia

 20
(Mourier et al. 2013). In that study parentage analysis of offspring was used to investigate
breeding patterns.

Mourier et al. (2013) also demonstrated clear evidence of female philopatry in that same
population of N. acutidens, in additional to polyandrous mating and high levels of multiple
paternity. In contrast to N. brevirostris, male N. acutidens in the Society Islands appear to be
polygamous within a single nursery site and exhibit much higher levels of philopatry (Mourier
et al. 2013). Specifically, that male breeding population is reported to comprise of a few, very
active males who mate with multiple females each year. However, a small sample size,
observed inbreeding and a number of potentially confounding factors lead to the question: Is
this divergent behaviour due to inter-specific variation, or is it influenced by local factors? For
example, habitat fragmentation due to the isolated nature of deep water oceanic islands and
atolls may be limiting to shark movement (Mourier et al. 2013) and shark feeding by local dive
operators is known to increase residency of male sharks at the study site (Clua et al. 2010). A
small number of these resident males can then become socially dominant (Brena et al. 2018).
In animal populations crowding can lead to increased polygamy (Shuster 2009) and coercive
mating (Cordero and Andrés 2002), hence breeding patterns in the Society Islands may be
influenced by the high level of residency observed in that population. As such it is unclear
whether similar behaviour should be expected in N. acutidens outside the Society Islands,
where external influences may differ.

The threatened status of N. acutidens implies that more effective management and
conservation efforts are required for the species, particularly in areas where the species is
subject to fishing pressure such as in Seychelles. An improved ecological understanding is
necessary to inform this. In recent years more has been learned about the site fidelity (Lea et
al. 2016; Oh et al. 2017), physiology (Bouyoucos et al. 2018), trophic ecology (Matich et al.
2017) and social behaviour (Brena et al. 2018) of N. acutidens, but knowledge gaps and
uncertainties still remain about local abundances, mating systems, reproductive cycles and
philopatry. Some of these can be addressed by studying lemon sharks at sites where the
previously discussed problems do not apply.

 21
Due to its location on the shallow Mahe Plateau, the habitat in the wider area surrounding
CMNP could be considered coastal. Much of the plateau is located in less than 100m water
depth and includes granitic and carbonate reefs, seagrass beds and mangroves connected by
areas of sandy seabed. This aligns closely with Compagno’s (1984) description of suitable N.
acutidens habitat. Additionally, no baited shark dives are conducted in the area around CMNP
and wide-ranging behaviour has been reported in local N. acutidens (Filmalter et al. 2013; Lea
et al. 2016), implying that unusually high male residency, caused by feeding activities and
habitat fragmentation, should not apply at CMNP. As such, CMNP is considered a suitable
study site to examine breeding patterns in a coastal population of N. acutidens.

In this study I analysed tissue samples, collected from juvenile N. acutidens at the CMNP as
part of the SNPA/GVI tagging project between 2014-2018. I produced estimates of the
number of adults that reproduced in each year (henceforth ‘adult population’): firstly the
number of reconstructed adults was identified through pedigree reconstruction; secondly the
effective number of breeders was estimated using two different methods (sibship-frequency
and linkage-disequilibrium). I also analysed sibling relationships within and between years,
which allowed me to describe the mating systems, breeding cycles and degree of philopatry
exhibited by free ranging N. acutidens in a coastal system. I then used new information
generated in this study to estimate the population size of offspring cohorts at CMNP. This
new information provides estimates of local abundance in CMNP and furthers our
understanding of reproductive ecology in N. acutidens, which is key to effective management
both within Seychelles and across the species’ range.

 22
2. Methodology

 2.1. Ethics Statement

Tissues samples used in this study were collected prior to the design of this study as part of a
joint tagging project between GVI Seychelles and Seychelles National Parks Authority, with all
necessary permissions and in compliance with all local legislation. They were and remain,
property of the Seychelles government. Samples and associated data were accessed and
exported with permissions from Seychelles National Parks Authority and the Seychelles
Ministry of Environment, Energy and Climate Change for the purpose of this present study.
Genetic work was conducted in Perpignan, France, in full compliance with local legislations.

 2.2. Sample Collection

 2.2.1. Study Site

The tissue samples used in this study were collected at the Curieuse Marine National Park
(4°16ʹ S, 55°43ʹ E). Curieuse Island is located north of Praslin Island, the second most populous
island in Seychelles. The two islands are separated by a narrow, shallow channel,
approximately 1.1km wide and 20.5m maximum depth. All sampling was conducted in a
shallow lagoon of 0.16km2, known locally as ‘The Turtle Pond’ (Figure 1). This site was
believed to be a pupping site as in previous years shark pups were regularly seen during the
pupping season. The lagoon provides a heterogeneous inter-tidal environment with
mangrove forest concentrated in the north-west corner. At spring high tide this forest is
inundated up to a depth of 1.24m and sections of the lagoon abutting the causeway have a
maximum depth of 3m with sandy substrate and occasional coral. The southern section of the
lagoon is up to 1.5m deep but at tide heights of less than 0.7m the forked section of the
causeway forms a small shallow pool. Seagrass beds are located in the centre of the lagoon
and are only partially exposed at spring low tide (Hodgkiss et al. 2017).

 23
Figure 1: Geographic location of the sampling site within the Curieuse Marine National Park, Seychelles

 2.2.2. Sampling Protocol

Sampling was conducted at either dawn (approximately 05:00-08:00) or dusk (approximately
17:00-1900), while tourists were not visiting the Park, and effort was concentrated during the
pupping season (October-December), but continued year-round. Sharks were captured using
gill nets, seine nets, or baited hook and line. During work-up sharks were placed in a water
filled trough with integrated tape measure which enabled them to maintain respiration
throughout the process. Each individual was tagged with a Passive Integrated Transponder
(PIT), which contains a readable microchip with unique ID number, and biometric data
including length and state of umbilicus closure were recorded. Because N. acutidens is
placentally viviparous, the presence of an open umbilicus in sampled sharks can be used to
confirm whether the individual is a neonate. For all new captures a small tissue sample was
collected and immediately fixed in 2ml 100% ethanol. Initially these were collected from one
of either pectoral fin using a leather hole punch. As of September 2015 onwards, a fin clip
was taken from the trailing edge of the anal fin as this was more efficient and appeared to
reduce sampling stress. Samples were collected from 409 sharks over four sampling periods

 24
2014-2015, 2015-2016, 2016-2017, 2017-2018 (henceforth ‘2014, 2015, 2016, 2017’
 respectively) and were used in this study (Table 2).

 Table 2: Number of sharks sampled by month

Sampling Month Total
Period Sep Oct Nov Dec Jan Feb Mar Apr May Jun Jul Aug Sep
2014 9 32 22 16 1 2 1 2 2 87
2015 9 38 25 7 5 2 1 4 1 1 1 1 95
2016 1 47 53 10 1 1 2 1 1 117
2017 30 65 9 1 2 1 1 1 110
Mean 5 31 44 12 6 2 1 2 2 2 1 1 1
 Grand total 409

 In some cases sharks sampled at the beginning of September were believed to have been part of the preceding
 years cohort, then neonates (determined by the presence of an open umbilicus) were sampled for the first time
 at the end of the same September (i.e. that was the beginning of the new pupping season). Subsequently the
 left most ‘Sep’ represents the September at the beginning of that sampling period while the right most
 represents the following September at the end of that period/start of the following sampling period.

 2.3. Laboratory Work

 2.3.1. DNA Extraction

 Genomic DNA extraction was conducted using a QIAGEN QIAcube HT extraction robot and
 associated extraction kit (QIAGEN, Hilden, Germany), following manufacturer’s instructions,
 as follows. A small piece of tissue from each sample was placed into a separate well of a 96
 well S-block with 200µl of cell lysis solution (Proteinase K and VXL buffer prepared to
 manufacturer’s instructions). Each loaded S-block was then sealed and placed in a Bain Marie
 overnight (set to 55˚C; typically for around 16 hours), to break down cell structure. Each S-
 block was then placed into the QIAcube HT extraction robot running an ‘elution 100µl’
 protocol.

 To evaluate the effectiveness of the DNA extraction, the quality of extracted DNA was
 visualized using agarose gel electrophoresis following the standard CRIOBE laboratory

 25
protocol (Appendix 2). Agarose gel was stained with BET, electrophoresis was run for 30-35
minutes and the resulting DNA migration was then viewed and photographed under
ultraviolet light. Electrophoresis separates charged molecules, such as DNA, according to their
size and allows the visualisation of this DNA. Under ultraviolet light, equal lengths of DNA
appear as a discrete band in the agarose gel, indicating successful DNA extraction while DNA
fragments of different lengths will produce multiple or diffuse band(s) indicating a problem
with the extraction or the original DNA quality itself.

 2.3.2. Polymerase Chain Reaction and Microsatellite Multiplex Optimization

Polymerase Chain Reaction (PCR) is a common laboratory technique used to produce many
replicates of DNA in vitro (Freeland 2005). As explained in the introduction, the addition of
primers allows for targeted replication of specific DNA fragments. Freeland (2005) explains
the three stages of PCR as:
 1. Denaturing – heating the DNA to split the double helix structure of DNA into two
 separate strands
 2. Annealing – reduced temperature allows the DNA primers to anneal to the now
 separated strands of DNA
 3. Extending – the new section of DNA is formed by the addition of the corresponding
 bases following the primer

All PCRs were processed in 96 well PCR plates (or parts thereof) fitted with compatible sealing
caps, using the ‘TYPE IT’ PCR kit (QIAGEN, Hilden, Germany) and a ‘Mastercycler’ PCR machine
(Eppendorf, Hamburg, Germany) running the ‘TYPE IT’ 40 cycle protocol. Each well was loaded
with 1µl of DNA and 11µl of PCR Mix (for specifics on PCR mixes see Appendix 3.1)

I utilised 16 microsatellite loci that had previously been used with N. acutidens (Mourier et
al. 2013). These comprise of two N. acutidens specific loci (NA3, NA6), seven developed for
N. brevirostris (LS11, LS15, LS24, LS32, LS53, LS54, LS75, NA3, NA6) and a further six from
other carcharhinid sharks (Cs08, Cpl90, Cpl166, Cpl169, Ct-05, Cli102, Cli107) (see Table 3 for
additional loci information, primer sequences and original sources). To assess the suitability
of these microsatellites for this study, preliminary PCR was conducted using primers for all 16

 26
loci and DNA from four samples (three from Seychelles and one control sample from French
Polynesia previously analysed by Mourier et al. (2013)). Primers were each tested at five
different annealing temperatures (53, 55, 57, 60, 63˚C) and the quality of amplified DNA
fragments in the PCR product were assessed using electrophoresis as described above. Locus
Cpl166 failed to cross-amplify cleanly at any temperature and was removed from the study.

The remaining 15 loci were grouped into 3 multiplexes, each of 5 loci, based on compatible
annealing temperatures and locus size. To help differentiate the amplified fragments, primers
for each locus were labelled with one of four coloured dyes (NED, VIC, FEM, PET; Table 3).
The proposed multiplexes were tested using DNA extracted from eight individual N. acutidens
(six from this study and two controls from French Polynesia) at the corresponding multiplex
annealing temperature. The PCR product was then sequenced and evaluated as described in
sequencing/scoring below.

Two additional microsatellite loci (Cli102 and Cli107) failed to produce scorable readings in
their respective multiplexes and were excluded from the study. This left 13 remaining loci
divided into three final multiplexes of five, four and four colour labelled loci (Table 3). PCR
was conducted for all samples using these final multiplexes.

 27
Table 3: Microsatellite loci, primer sequences and multiplexes
 Locus
 Primer sequence 5'-3' Repeat sequence Source Dye H0 HE k FIS
 Name

 F: TGACACAACCATTTATTCCCACG 0.735 0.917
 Cpl169 (TG)42 A NED ± ± 25 0.198
 R: GGTTTCCTTGAGTGAAAGAGAGAGC 0.049 0.002

 F: GGCAGCCTTGCGTATTTACA
 Annealing temperature 57℃

 Na3 (CT)5(CA)13 B VIC - - - -
 R: GGTAGTGGGAATCGACTGGA
Multiplex 1

 F: GGCCATCAGTTTGCTTA 0.884 0.907
 Cs08 (CA)28 C FAM ± ± 23 0.026
 R: AATCCAGTTCCATCTTCAATA 0.031 0.007

 F: TCTACTCTATTTTCTGCCCAATTAC 0.910 0.862
 Ct05 (GT)19 C NED ± ± 21 -0.056
 R: TTTGGTAAGGCCAACTCCAG 0.019 0.013

 F: GTTGTTGCCTTGTCTTTCAATCG 0.778 0.781
 Cpl90 (AC)24 A PET ± ± 8 0.004
 R: TGTGTCACTGTGTCTCTGTGTGCC 0.034 0.009

 F: GCCTCATTCTGCTCCTGTGTTTT 0.491 0.472
 LS53 (AC)14 D FAM ± ± 4 -0.041
 R: CACATAACCTCCTCCTCTGCTTCC 0.034 0.019
 Annealing temperature 60℃

 F: TTAAGTCAGGCTATTGTGGACTCGT 0.596 0.607
 LS32 (AC)4(AG)2(AC)7 D NED ± ± 7 0.019
Multiplex 2

 R: GCTTGCTTTCACACCTACCCATTT 0.022 0.020

 F: CCAGGAGAGAAGCATCTCACAG 0.860 0.849
 LS11 (AC)33 D FAM ± ± 25 -0.013
 R: TGTCATTAGGATTTGCAGCC 0.019 0.010

 F: TGTTACTGGGCACTATTATTC 0.801 0.801
 LS75 (TC)11(AC)11AG(AC)10 E PET ± ± 11 0.000
 R: GAGGTTATCTTTTCTGTGTAGT 0.010 0.001

 F: TTGGAAACCGTGGAGGTGAA 0.491 0.493
 LS54 (CT)10(CA)8 E NED ± ± 3 0.003
 R: GGGGAAAAAGAACTGGGACTAATCC 0.019 0.015
 Annealing temperature 63℃

 F: TGCGTGGGTTGTTGTTTTGG 0.826 0.784
 LS15 (AC)2§0 D VIC ± ± 20 -0.054
Multiplex 3

 R: GCACCTTGGATAGTTTGAGCAGG 0.021 0.018

 F: GGATGTGTTAGTGAGGTGGTGAGTG 0.511 0.502
 LS24 (AC)12 D NED ± ± 3 -0.017
 R: AGGGCAGAGACAGCAGGGAATATC 0.023 0.003

 F: AGACGCATTGGTTGCCTAGT 0.193 0.186
 Na6 (ATGG)4-(TAGA)4 B PET ± ± 2 -0.042
 R: GAATCACCATCACCCACAAG 0.044 0.044

 F: TGGACATGACAATTACAGCACAGG
 Cpl166 (GT)17 A - - - - -
Removed from study

 R: CTGTTTACAACTTCCCTGGAGTGC
 prior to PCR

 F: GACTGGCTGACCTAACTAAGC
 Cli102 (GA)9 F - - - - -
 R: ATCCTGTGGTCCTTCTATC

 F: GGATTCACAACACAGGGAAC
 Cli107 (GT)14 F - - - - -
 R: CTCATTCTTAGTTGCTCTCG

 H0, HE, k, FIS represent values from analysis of all CMNP samples Mean - - 12.66 0.002

 *A, Portnoy et al. (2006); B, Mourier et al. (2013); C, Ovenden et al. (2006); D, Feldheim et al. (2001);
 E, Feldheim et al. (2002); F, Keeney and Heist (2003)

 28
You can also read