Uneven growth: tackling city decline - Joseph Rowntree ...
←
→
Page content transcription
If your browser does not render page correctly, please read the page content below
Uneven growth: tackling
      city decline

by Andy Pike, Danny MacKinnon, Mike Coombes, Tony Champion, David Bradley, Andrew Cumbers,
                                Liz Robson and Colin Wymer

               This report focuses on the scale and nature of city decline in the UK and
  what can be learnt from international experience. Economic and social conditions in UK cities are
                                 diverging and increasingly different.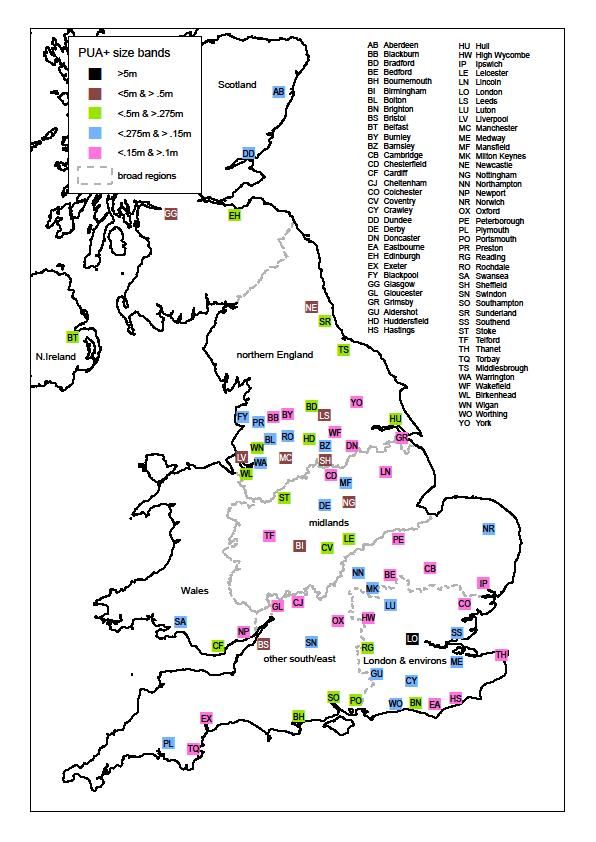
Unequal growth: tackling declining
cities
Andy Pike, Danny MacKinnon, Mike Coombes, Tony Champion, David Bradley, Andrew Cumbers, Liz
Robson and Colin Wymer

This report focuses on the scale and nature of city decline in the UK and
what can be learnt from international experience. Economic and social
conditions in UK cities are diverging and increasingly different.
Comparatively less attention has been given to the situation and policies
for cities coping with relative decline. The report details the overall findings
and analysis of the key demographic and economic trends in UK cities and
the main policy responses adopted internationally.

City growth is a central focus of national economic policy in the UK. But not all UK cities are growing at
the same levels; some cities are falling behind and failing to keep up with national trends. Cities coping
with such relative decline have particular economic and social conditions that require policy attention.

The report:
•   analyses the scale and nature of long-term population and economic decline in UK cities;
•   identifies and assesses the different policy responses to long-term population and economic decline
    in cities;
•   assesses the effects and implications of different policy approaches on people at risk of poverty in
    declining cities;
•   identifies different types of cities experiencing long-term decline in the UK and appropriate policy
    responses.

                                                                                                             i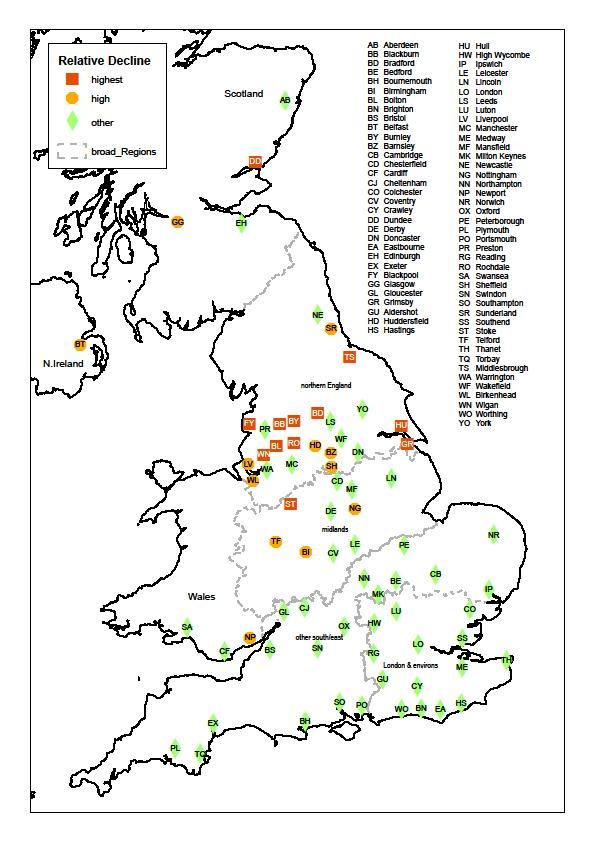
Contents

        Executive summary                                                          1
 1 Introduction                                                                    4
        Defining decline                                                           4
        Research methodology                                                       5
 2 The scale and nature of city decline in the UK                                  6
        Identifying cities in the UK                                               7
        Population trends                                                          9
        Employment trends                                                          14
        An index of relative decline                                               17
        Results of the index of relative decline                                   18
        Typology of relatively declining cities                                    21
        Differences between types of city                                          24
        Summary                                                                    25
 3 Responding to city decline: the international and UK evidence                   26
        Literature review method                                                   26
        City recovery strategies and initiatives                                   27
        Rationales and targets for intervention                                    27
        Leadership and strategic repositioning                                     28
        Governance and institutional structures                                    30
        Employment and skills                                                      31
        Physical regeneration and infrastructure                                   33
        Community engagement                                                       35
        Policy outcomes and impacts                                                36
        Summary                                                                    38
 4 Conclusions and policy implications                                             39
        Summary of main findings                                                   39
        Policy implications and recommendations                                    41
        What sorts of policies for what kinds of cities?                           43
        Conclusions                                                                46

        Appendix 1: Definition of the PUA+s                                        47
        Appendix 2: Data sources                                                   49
        Appendix 3: Ranking of cities on the indicators in the index of relative   50

                                                                                        ii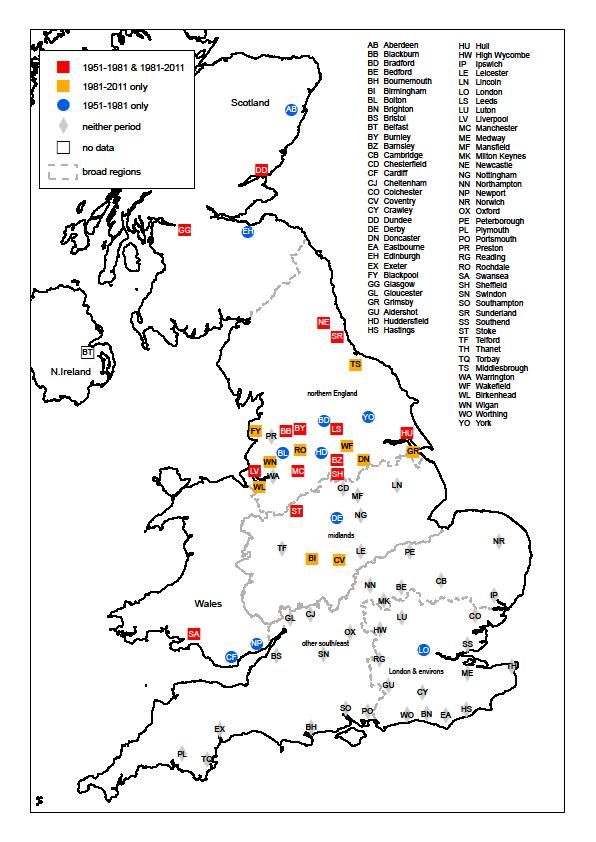
decline
     Appendix 4: Modelling relative decline                                     53
     References                                                                 59
     Acknowledgements                                                           64
     About the authors                                                          65

     List of figures
1    Framework for the analysis of relatively declining cities in the UK        7
2    Number of cities seeing absolute population decline by decade 1981–
                                                                                9
     2011
3    Components of population change 2001–2013 for city size groupings, %
                                                                                12
     per year (compound rate)
4    City group per cent change 1991–2011 in the age cohort who were 5–
                                                                                13
     14 in 1991
5    Change in broad sector full-time equivalent jobs by city employment rate   16
6    Distribution of cities on the index of relative decline by city category   19
7    Framework for analysis of city recovery strategies                         27

     List of tables
1    Cities ranked on the proportion of 16 to 64-year-olds with a degree,
                                                                                14
     2001 and 2011
2    Average employment rates of cities classified by employment rate in 2001   15
3    Change in total number of workplace jobs by city size category, 2001–
                                                                                15
     2011
4    Change in total full-time equivalent jobs, best and worst ten cities       17
5    The 24 cities with the highest scores on the index of relative decline     18
6    Typology of the 24 relatively declining cities                             23
7    Selected indicators for cities grouped by typology of relative decline     24
8    Selected rationales and targets for intervention                           28
9    Types of investment frameworks and instruments                             34
10   Selected urban regeneration initiatives and outcomes                       37

     List of maps
1    Urban area population size and broad regional location of the 74 PUA+s     8
2    Relative population decline 1951-1981 and/or 1981–2011                     11
3    Results of the index of relative decline                                   20

                                                                                     iii
Executive summary
City growth is a key concern of national economic policy in the UK but some cities are falling behind and
failing to keep up with national trends. Cities coping with such relative decline have particular economic
and social conditions needing policy attention.
Key points
• No UK cities are currently experiencing absolute population loss, but growth in many northern cities
is lagging behind national levels.
• 10 of 12 cities ranked highest on the study’s index of relative decline are in the north of England,
while no city in southern England is among the 24 relatively declining cities identified by this index.
• The condition of relative rather than absolute decline among some UK cities signals the potential for
policy intervention to foster stronger and more inclusive growth in these cities.
• Relatively declining cities in the UK require integrated programmes of policy interventions,
underpinned by effective strategic leadership in bringing together key actors around a clear and
shared vision for the city.
• Poverty reduction needs to be integrated into city recovery strategies as growth per se will not
necessarily reduce poverty in cities.
• Policy interventions need to be based on an understanding of the circumstances of the different
types of city experiencing relative decline and the tailored packages of policies appropriate to address
them.
What is the evidence of decline in UK cities?
There are two main types of city decline. Absolute decline is the outright reduction in specific indicators
– such as population or employment – for a particular city over a certain period. Relative decline is the
comparatively weaker performance of a city on certain indicators in relation to similar cities or to the
national average.
While no UK cities are experiencing absolute population loss, many northern cities are characterised by
relative decline or low growth: their increases in population or employment are at relatively low levels
compared with other cities.
London has led an ‘urban renaissance’ and continues to out-pace smaller cities, attracting young talent
and losing older people through intra-UK migration flows. Young adult migration to London and the
south is a ‘brain drain’ detrimental to the growth of many provincial cities.
Between 2001 and 2011, job growth was lower in cities outside the south east of England, with growth
fastest in London, and to a lesser extent the smallest cities. Public sector employment made a major
contribution to growth in all groups of cities in 1980–2008, while the initial period of austerity in 2009–
2013 has impacted most on low employment rate cities, although the differences are small.
Focusing on single indicators of population and employment trends and relatively short time periods
provides only a partial picture of city decline. This study therefore developed an index of relative decline
to capture the numerous factors involved in city decline over a longer time scale. The cities experiencing
the highest levels of relative decline on the index were primarily in northern England: Rochdale, Burnley,
Bolton, Blackburn, Hull, Grimsby, Dundee, Middlesbrough, Bradford, Blackpool, Stoke and Wigan. The
next group of 12 high scoring cities includes several in the Midlands and other countries of the UK, but
no city in southern England.
An analysis of the performance of employment changes in the 24 cities with the highest values on the
index of relative decline (i.e. the worst performing cities) compared with the 50 better performing cities
reveal a number of important differences, with the former group having:
1• lower rates of net in-migration of economically active age groups;
• lower rates of employment growth in 1998–2008 and a higher rate of contraction in 2009–2012;
• substantially higher rates of poverty as measured by the Unadjusted Means-tested Benefits Rate,
indicating that relative city decline is linked to a higher risk of poverty for its residents.
What kinds of UK cities are facing relative decline?
The factors most strongly associated with relative city decline in the UK are skill levels, industrial history
and location at both city-regional and national scales. City size and the reduced presence of consumer
services in cities that are overshadowed by larger neighbours emerged as the key differentiating factors
between the 24 relatively declining cities in the study. Three types of cities experiencing relative decline
are identified:
• Core cities are the principal cities of their city regions, hosting high-level services and anchor
institutions that attract investment and people. Examples include Glasgow, Liverpool and Sheffield.
• Overshadowed cities have larger neighbouring cities that host the higher-level functions, main
employment sites attracting commuters and provide the principal growth opportunities. Examples of
overshadowed cities include Bradford, Stoke and Sunderland.
• Freestanding cities are not overshadowed but are smaller than core cities and some distance from
them. Examples include Dundee, Hull and Newport.
What kinds of policies have been used to address city
decline?
Cities across the world have been struggling with city decline and ‘shrinkage’ in recent decades. Evidence
on the effectiveness of different interventions is limited and partial. However, it is still possible to identify
several broad themes that characterise the more effective approaches:
• co-ordinated and integrated programmes of policy interventions to tackle the multi-faceted and
inter-related problems of city decline;
• strategic leadership involving the development of a clear and shared vision for the future of the city;
• institutional innovations to support recovery strategies including special purpose agencies, research
and planning institutes, and mechanisms for incorporating public, private and civic actors;
• sector-based initiatives have had some success in generating employment and earning increases,
contributing to poverty reduction;
• community engagement through the active involvement of local residents in the improvement of
their neighbourhoods.
While many international policy responses have sought to address absolute declines in population and
employment, the broad lessons above can inform policies for UK cities facing relative decline.
What are the implications for cities facing relative
decline in the UK?
Cities facing relative decline are growing in population and employment terms but at relatively lower
levels than other cities in the UK. Relative decline provides more scope for policy intervention to boost
growth performance.
Given the different combinations of factors generating relative decline, ‘one-size-fits-all’ policy
approaches are inappropriate and likely to be ineffective. The different types of cities facing relative
decline require both general and tailored responses.
Addressing the shared aspects of relative decline, UK cities can:
• clarify the aims, aspirations and purposes of city recovery, based upon identifying the specific roles
that cities are able to develop in the broader urban system.
2• better connect and integrate poverty reduction into city recovery strategies through ‘inclusive
growth’ strategies;
• foster greater community engagement and participation by engaging local residents in the
improvement of their neighbourhoods;
• promote inclusive and responsible forms of decentralisation by offering additional powers to cities
with weaker economic potential while ensuring that such areas are not disadvantaged by fiscal
devolution.
Relating to the particular circumstances of the different types of cities facing relative decline, specific
policies include:
• Core cities: long-term and strategic city-regional planning; prioritising inclusive growth; and co-
ordinating anchor institutions.
• Overshadowed cities: developing distinctive and complementary economic roles and strategies;
improving accessibility; and enhancing training and skills.
• Freestanding cities: building on internal assets and capabilities; bolstering anchor institutions; co-
operating with larger cities in broad-scale functional economic areas; and repositioning and
rebranding.
Conclusions
Relative decline in UK cities is shaped by their industrial history, skill levels and location at the city-
regional and national scales. The majority of relatively declining cites are in northern England, reflecting
the geographically uneven legacies of economic restructuring and de-industrialisation.
Facing relative rather than absolute decline, there is scope for integrated policies to address the
economic and social conditions of such cities. Tailored policies are needed based on the specific
circumstances of core, overshadowed and freestanding cities.
Greater national policy recognition of the particular predicaments of cities characterised by relative
decline can also play an important role in increasing their employment growth and poverty reduction.
31 Introduction
In recent years, the phenomenon of city decline has attracted growing international interest. Indeed,
decline has been described as a ‘fairly normal’ pathway of urban development, affecting more than one in
four cities in the world between 1990 and 2000 (Bernt, 2009, pp. 754). About 40 per cent of European
cities were found to have experienced decline between 1960 and 2005 (Turok and Mykhnenko, 2007).
In the US, decline has been particularly concentrated in the ‘rustbelt’ cities of the north east and mid-
west (Beauregard, 2012), and symbolised by the plight of Detroit. City decline in the UK has received
comparatively less attention in recent years, following the high profile cases of population loss in
industrial cities in the 1980s and early 1990s (Martin et al., 2014). While increased interest in stimulating
the further growth of larger urban conurbations is driven by the expanding body of research and popular
commentary on their agglomeration economies and productivity benefits (see for example Glaeser,
2012; Leunig and Swaffield, 2008; The Economist, 2015), the implications of this emphasis for smaller
and economically weaker cities remain largely unexamined.
The process of urban decline is multi-dimensional, reflecting the interaction between a number of
mutually reinforcing factors including population loss and outward migration especially of the young
and/or qualified; economic restructuring and de-industrialisation; contracting labour markets with limited
job and training opportunities; unemployment and under-employment; deprivation and poverty; ageing
populations; poor health; low educational attainment and skills; vacant properties; high crime rates;
declining tax bases; and rising service needs of remaining residents (see for example Haase et al., 2014;
Power et al,. 2010). Urban decline is geographically uneven, often having the most adverse effects on the
economically weakest cities and their most disadvantaged social groups and neighbourhoods (Fol, 2012).
Policy responses to urban decline have typically sought to counter it through the promotion of renewed
urban growth and recovery, although new strategies of seeking to manage and steer decline or
‘shrinkage’ have recently emerged (Hospers, 2014). Yet clear gaps in understanding, empirical evidence
and policy evaluation remain. Potential learning from international experiences has yet to be
systematically identified, despite the emergence of innovative approaches. The evidence base is
fragmented, relying upon either case studies of transformation by ‘phoenix cities’ (see Power et al., 2010)
or continued decline and shrinkage (Bontje and Musterd, 2012).
Policy responses to urban decline in the UK go back to the identification of the inner city problem in the
1970s (HMSO, 1977). Many industrial cities and larger towns experienced decline and job loss related to
de-industrialisation in the 1980s and early 1990s, prompting some discussion of the option of ‘managed
decline’ among ministers (Gainsbury et al., 2011). By the late 1990s and early 2000s, however, cities
were being seen as assets rather than liabilities with some experiencing urban growth and renaissance
(Urban Task Force, 1999). This ‘resurgent cities’ narrative drew attention away from problems of decline,
given the growing disparities between London and the wider South East England region and the rest of
the UK (Centre for Cities, 2013; Martin et al., 2014). To address this gap in research and understanding,
this report provides a detailed analysis of the scale and nature of city decline in the UK over recent
decades, alongside a review of international policy responses, drawing these together to outline a number
of policy recommendations for different types of UK cities.
Section 2 examines the nature of relative decline in UK cities, presents the results of the index of relative
decline and explains the typology of relatively declining cities. Section 3 presents the main themes from
the review of the international and UK literature on policy responses to city decline. Section 4 sets out
the conclusions and policy implications for actors at the national and city levels in the UK.
Defining decline
Reduction in population is the most common definition of city decline, using the most basic indicator
(Turok and Mykhnenko, 2007). Other widely used measures include job loss, employment and
unemployment rates, land and housing vacancy rates, birth rates and migration trends, and various
measures of poverty and social deprivation (Haase et al., 2014).
4The distinction between absolute and relative decline is key. Absolute decline refers to the outright
reduction in specific indicators – such as population or employment – for a particular city over a certain
time period. Relative decline compares the performance of a city to similar cities or to the national
average. Relative decline means that a city is under-performing in relation to these comparators.
Research on declining cities has been dominated by a focus on absolute forms of decline, with less
attention paid to relative decline.
The term decline – meaning to grow smaller, deteriorate or move downwards – has problematic
connotations in policy discussions as it appears to impose a negative label upon individual cities (Audirac,
2015). The term is often at odds with regeneration and place promotion initiatives. Avoiding the negative
connotations of decline and shrinkage (the latter emphasising physical contraction), researchers and
planners in the US have coined the term ‘legacy cities’ to refer to declining ‘rustbelt’ cities that have
experienced de-industrialisation and population and employment losses in recent decades (Mallach,
2012). The language of decline needs to be used with particular caution when it is the relative decline of
cities that is being discussed. This is because relatively declining cities may still be experiencing increases
(rather than reductions) in population or employment, but such increases are at a relatively low level or
slow rate when compared with other cities and/or the national average. This report focuses largely upon
relative decline as this is the experience of some industrial cities in the UK since at least the 1990s.
Relative decline is more commonly understood by policy-makers as low or weak growth.
The distinction between absolute and relative decline is most pertinent at the city-wide scale. To some
extent, the similarities in the underlying causes and symptoms of decline are more apparent at the
neighbourhood scale in disadvantaged areas. Whether the city as a whole is experiencing absolute or
relative decline, the residents of such areas are typically confronted with similar problems of
unemployment, poverty, low skills, abandonment and dereliction, although they may be more acute in
conditions of absolute decline. As such, there is considerable scope for UK cities to learn from
international policy approaches, even when these were designed to address absolute decline.
Research methodology
The research followed a three-part methodology:
1. Analysis of the scale and nature of long-term population and economic decline in UK cities. This was
based upon assessments of demography, job availability and employment rates plus identification of
key drivers of decline to construct an index of relative decline and a typology of relatively declining
cities.
2. Review and analysis of the international and UK literature on policy responses to city decline. This
involved a systematic review of the existing literature to assess key policy approaches and initiatives,
particularly in relation to their effects on specific dimensions of urban decline. It also incorporated
case studies of innovative policy initiatives in individual cities based on desk research with secondary
sources and inputs from international research team members.
3. Assessment of the implications of the evidence for UK cities. This involved drawing out the policy
ramifications of the scale and nature of long-term city decline in the UK and discussion of the
lessons of the international review and case studies.
52 The scale and nature of city
decline in the UK
This section addresses the scale and nature of city decline in the UK and sets out the framework for
analysis in the study. Establishing the particular scale and nature of city decline in the UK through a
review of key demographic and employment trends, covering the supply and demand sides of the labour
market, is important in providing a clearer picture of the policy problem to be addressed. One of the aims
of this report is to move beyond the commonplace rejection of ‘one-size-fits-all’ approaches in urban
policy, instead identifying specific policies that are appropriate for different types of relatively declining
city. To do this for cities in the UK, it is necessary to develop a typology of the cities needing these policy
responses. What are the key differences between types of relatively declining cities? What distinctive
weaknesses or strengths are shared by separate types of city? This section provides the analyses which
build towards identifying policy-relevant types of relatively declining cities in the UK.
There are two initial steps: identifying the cities to be analysed and producing the most appropriate
measure of relative decline, moving from a range of single indicators to an approach combining multiple
indicators (Figure 1). The approach builds upon the conception of relative city decline as multi-
dimensional, the result of inter-related and mutually reinforcing processes, with a particular emphasis on
forms of decline that increase the risk of poverty.
As outlined in Figure 1, the analytical steps comprise:
• an established set of city definitions extended to cover 74 UK cities each including an urban area
with a population of more than 100,000 together with its wider labour market within which key
poverty-related dynamics are framed;
• demographic analyses, starting with the possibility that a basic measure of population loss could
provide an adequate measure of city decline in the UK, then moving on to consider other key
demographic processes such as migration;
• shifting to more directly poverty-related measures of relative decline, reviewing a series of analyses
on change in employment rate levels, and job growth or decrease, as part of a broader understanding
of relative city decline;
• building upon the analyses of employment and population trends, their primary measures of potential
city decline are combined to create a new index of relative decline;
• presenting the results of the index of relative decline, with a particular emphasis on the geographical
distribution of the 24 cities that make up the third of cities with the highest ranking on the index (i.e.
those with the strongest evidence of recent relative decline);
• investigating the factors associated with relative decline as measured by the index to support the
creation of the typology of relatively declining cities;
• examining the differences in performance between the identified types of cities for selected
indicators, including estimates of their levels of poverty.
6Figure 1: Framework for the analysis of relatively declining cities in the UK
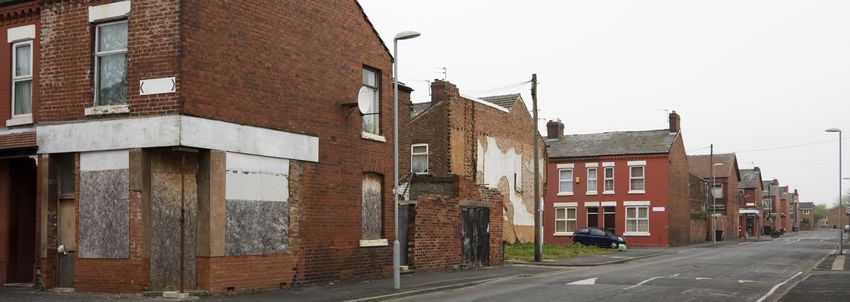
Identifying cities in the UK
In measuring city decline, the first challenge is identifying which urban areas should be considered the
‘cities’ to be studied. Cities are distinct from other urban areas because of their larger populations. This
was the key criterion defining the Primary Urban Areas (PUAs) for the State of the English Cities study
(Parkinson et al., 2006), areas which have become widely used (e.g. Lee et al., 2014; Martin et al., 2014).
PUAs were defined as urban areas with at least 125,000 residents in 2001. The definition here extends
to capture slightly smaller urban areas by reducing the PUA population minimum to 100,000. The
additional cities mean that 74 cities are included and the term ‘PUA+’ is used to distinguish them from
their more narrowly defined precursors (see Appendix 1for definition).
The definition of the PUA+s combines each city with areas in its local labour market. This is appropriate
because the level of poverty risk is shaped by labour market processes such as sectoral and occupational
change in labour demand and the location of job vacancies that operate at the geographical scale of
labour markets. The cities are often grouped by either their size or their broad regional location in the
analysis, depending on whether one or other of these factors was found to be an important influence.
Map 1 illustrates that most parts of the UK have at least one of the 74 PUA+s, and shows which of the
size and broad regional groupings each city falls within
7Map 1: Urban area population size and broad regional location of the 74 PUA+s
Source: Population Census 2001. Crown copyright data
8Population trends
The most common way to identify declining cities is by falling populations. However studies reveal that
the absolute population decline recently seen in the cities of several other countries has become rare in
the UK (e.g. Turok and Mykhnenko, 2007). In addition, the broad PUA+ definitions covering whole labour
market areas make finding absolute decline less likely: decline in an old urban centre is often cancelled
out by growth in nearby commuting areas. Absolute population decline over the 30 years up to 2011 was
limited to just 10 cities. The only substantial absolute falls were seen in Glasgow and Liverpool where the
recent growth has been insufficient to cancel out major losses late in the last century. The cities with
marginal 30-year population losses were, apart from Dundee, all in the north of England: Sunderland,
Birkenhead, Middlesbrough, Newcastle, Burnley, Grimsby and Wigan, in declining order of loss (Appendix
2 lists the datasets and variables used throughout this report).
While the 74 cities vary in their rate of population growth, none had a declining population between
2011 and 2013 and only two (Burnley and Sunderland) experienced slight population decline from 2001
to 2011. As in the cases of Glasgow and Liverpool, the trend away from absolute decline has been
established for some time. This situation has been interpreted as an ‘urban renaissance’ fuelled by
national population growth and a reversal of the tendency late in the last century for the population
growth rate of cities to be lower than that of more rural areas. Figure 2 shows a rapid fall in the number
of cities seeing population loss over the last three full decades. It also reveals a persistent north–south
contrast in population change: of the 43 instances of a city with population loss over one of these
decades, there is one solitary case in the south (Plymouth in the 1990s). Regional context shapes how
national trends affect a city. Central to the north–south contrast is the impact of London and its
distinctive trends. The capital preceded other large cities in seeing population decline early in the
twentieth century, and then later led the trend towards urban renaissance (Parkinson et al., 2006).
Figure 2: Number of cities seeing absolute population decline by decade 1981–
2011
Source: Calculated from ONS mid-year population estimates. Crown copyright data
Although recent population loss is now uncommon among UK cities, some cities are still facing issues
associated with decline which can increase the risk of poverty for their residents. The analysis therefore
needs to address relative rather than just absolute population decline. This is measured here in terms of
the city’s share of the total population of all cities in Britain (Belfast is excluded from this one analysis due
to reduced data for Northern Ireland). For any period in the analysis, around half of all cities see their
share of total urban population decline. To highlight those cities where relative decline may be at
worryingly high levels, we focus on the third of cities whose share of the national urban population
declined fastest.
Map 2 assesses the persistence of relative population decline by comparing the last 30 years (1981–
2011) with the preceding three decades (1951–81). Among the 24 cities that comprise the third whose
population share declined fastest in 1981–2011, there are 14 (red squares) that were also among the
third of cities suffering relative decline during 1951–1981. Ten of these 14 cities which experienced
persistent relative population decline are in northern England.
9Another 10 cities (orange squares) are the remainder of the third of the cities with the fastest rates of
relative decline over the recent 30 years. These cities have slipped into relative decline recently following
stronger 1951–1981 demographic trends. These cities include Birmingham and Middlesbrough, where
the manufacturing-led growth of the mid-twentieth century has been followed by major de-
industrialisation and job loss from the 1980s.
In contrast, 10 cities (blue circles) that experienced relative decline in the earlier 1951–81 period have
‘bounced back’ in recent decades. London had by far the most dramatic of turnarounds, while more
modest shifts from decline to strong growth were evident in Cardiff and Aberdeen, for example. These
cities have begun holding their own in terms of their share of Britain’s city population and they have the
most diverse regional distribution of the four categories on Map 2. It may be that each city has its own
particular reasons for recovery, rather than them all being the result of some more general process. Of
particular interest is that this group includes not only the national growth hub of London but also some
northern cities like Bradford which are widely seen to be at the other end of the prosperity spectrum.
Thus recent recovery from relative population decline is not strong evidence that a city’s residents face a
lower risk of poverty. Demographic growth can also lead to increased poverty risk, notably where labour
supply grows more quickly than the number of local jobs.
Finally, there are the 39 cities (grey diamonds) which avoided relative population decline in both the 30-
year periods. Of these steadily growing cities, only eight are outside the southern regions of England and
even more remarkably this category includes every single southern city except London.
10Map 2: Relative population decline 1951-1981 and/or 1981–2011
Source: Calculated from ONS mid-year population estimates. Crown copyright data
11In many cities in southern England, relative population growth is the result of their prosperity stimulating
net in-migration. Figure 3 breaks down recent overall population trends into key components of
demographic change in 2001–2013. The natural change rates reflect surpluses of births over deaths,
while the other columns show various net migration effects (‘other changes’ are predominantly
unrecorded migration). The numbers of births in the UK exceed that of deaths, while there is also now a
persistent net inflow of international migrants (Champion, 2014). London, the only city in the largest size
grouping, stands apart. It has the highest natural change rate, the only high rate of net loss through
migration to the rest of the UK, and the highest rate of net international in-migration.
Figure 3: Components of population change 2001–2013 for city size groupings, %
per year (compound rate)
Source: Calculated from ONS mid-year population estimates. Crown copyright data
Figure 3 illustrates the role of within-UK migration in UK city population change. Internal migration flows
boost or diminish cities’ numbers of residents and shape who is living where. London has a very youthful
age structure, reflecting the net out-migration of older people and strong net gains of young adults. This
is the ‘escalator’ pattern originally identified in south-east England where young people migrated towards
the UK’s largest concentration of work opportunities to advance their careers more rapidly (Fielding,
1992).
The scale of this process is evident in changes in size of the 5–14 age group in a city over the 20-year
period 1991–2011. Figure 4 compares the size of a city’s 25–34 age group in 2011 with that of the 5–
14 age group 20 years earlier. The changes in age group numbers are due almost entirely to migration
because this age group experiences few deaths. All the city-regional and size groups saw a net inflow of
this young adult group, partly because cities attracted the bulk of international migrants – who are
largely young adults – but also because of the net inflows of young adults from smaller UK towns and
rural areas. Figure 4 shows that after London’s unique role has been recognised, it is the regional rather
than the city size contrasts that are the more pronounced.
12Figure 4: City group per cent change 1991–2011 in the age cohort who were 5–
14 in 1991
Source: Calculated from ONS mid-year population estimates. Crown copyright data
These specific population flows have cumulative effects on different cities. Champion et al. (2007) show
that better qualified young people, such as graduates, are more likely to migrate. A city with strong net
intra-UK inflows of young people gets a boost to its skill levels. Selective migration thus reinforces the
uneven geography of job opportunities: young skilled people respond to the personal benefits of the
regional ‘escalator’ while collectively they fuel the skills gaps between cities.
The finding that young adult migrants are often from the better educated end of the spectrum means
that cities with net inflows benefit not only through the quantitative growth of their labour supply gains,
but also in qualitative terms. Here, the focus is on more highly qualified labour supply because of the
sustained reduction in numbers of the middle stratum of jobs (Goos and Manning, 2007). Table 1 shows
for both 2001 and 2011 the proportion of the economically active age population (EAA, taken as 16–
64) with at least a degree. It reflects strong growth in this proportion across all 74 cities over the decade,
mainly due to the transition into retirement of the age group who had left school by the early 1960s (i.e.
before the expansion of higher education opportunities). If recent migration flows of young adults were a
new phenomenon then the relative skill levels of whole city labour forces would be little affected.
However, the recent pattern continues a longstanding brain drain towards the capital and the cumulative
effect of these migration flows is that the London, Oxford and Cambridge ‘golden triangle’ is firmly
established at the top of the EAA skill ranking (Table 1). Edinburgh also has a persistently well-qualified
EAA, and in 2011 is joined by York as a northerly city with one of the ten best qualified labour forces.
The national trend towards a more highly qualified labour force ‘lifted all boats’ but the relativities are
largely unchanged: nine of the ten cities with the lowest share of their EAA having degrees in 2001
remained in the equivalent list in 2011 (Table 1). These low-skill cities include some southern resorts that
have some of the highest young adult out-migration rates, together with cities such as those in former
coalfield areas where a continuous brain drain has been recognised for decades (Beatty et al., 2007).
13Table 1: Cities ranked on the proportion of 16 to 64-year-olds with a degree, 2001
and 2011
2001 % Rank 2011 %
Cambridge 33.3% 1 Cambridge 43.3%
London 31.1% 2 Oxford 40.2%
Oxford 30.9% 3 London 39.5%
Reading 29.7% 4 Reading 39.1%
Aldershot 28.1% 5 Aldershot 38.3%
Edinburgh 27.1% 6 High Wycombe 37.0%
High Wycombe 26.6% 7 Cheltenham 36.6%
Brighton 26.3% 8 Edinburgh 36.4%
Cheltenham 25.2% 9 Brighton 36.2%
Cardiff 25.2% 10 York 35.3%
Torbay 13.9% 65 Thanet 21.6%
Burnley 13.7% 66 Stoke 21.2%
Thanet 13.5% 67 Burnley 21.0%
Stoke 13.2% 68 Rochdale 20.9%
Wakefield 13.0% 69 Southend 20.8%
Doncaster 12.2% 70 Wakefield 20.0%
Southend 12.0% 71 Barnsley 19.3%
Barnsley 11.6% 72 Doncaster 18.4%
Grimsby 10.9% 73 Grimsby 17.6%
Mansfield 9.8% 74 Mansfield 17.5%
Source: Calculated from data extracted from 2001 and 2011 Population Censuses. Crown copyright data
So do population trends identify the UK cities in relative decline? Absolute population decline is almost
non-existent now, but there are still cities with poverty-related problems associated with decline so a
different way to measure decline is needed. Relative population decline highlights the important north–
south contrast in growth which has persisted since at least the de-industrialisation period from the
1980s. But there are northern cities such as Bradford whose relative population stability or even growth
may increase the risk of poverty due to it outstripping the growth in local job opportunities. In other
cities, the brain drain loss of younger well-qualified migrants towards London in particular can entrench
local disadvantage because residents with low skills are less able to move to opportunities elsewhere.
These diverse patterns mean that no single measure of population change can consistently identify the
cities experiencing the forms of decline likely to be associated with increased risk of poverty.
Employment trends
According to the European Commission (2010), increasing employment rates are key to reducing
poverty. For many of the 74 cities over the decade 2001–2011, there was a positive change in
employment rates (see Table 2). Those cities with lower employment rates in 2001 experienced the
faster increases, while the third of cities with the highest employment rates in 2001 had a near static
average employment rate. More economically buoyant cities tended to see high net in-migration both
from within the UK and from abroad, and this produced similar levels of growth on both the supply and
demand sides of the labour market.
14Table 2: Average employment rates of cities classified by employment rate in 2001
% employment rate
Cities classified by employment rate in 2001 2001 2011 change 2001-2011
Highest third 72.1% 72.0% - 0.1%
Middle third 67.0% 67.5% + 0.5%
Lowest third 62.8% 64.4% + 1.6%
Source: Population Censuses 2001 and 2011. Crown copyright data
While helpful for poverty reduction, this convergence in employment rates only marginally reduced the
gap between cities with higher and lower employment rates. Most of the cities with low growth in
employment rates had high rates to start with, and they still had the highest rates in 2011, so their
poverty risk level remained low. Their stable employment rates reflect strong net in-migration linked to
job growth. This suggests that job trends could be a better indicator of relative city decline.
Recent job trends have seen dramatic shifts between two periods: significant growth in the decade
before 2008, after which came the global financial crisis and recession followed by austerity and public
sector cuts. Such divergent trends would be averaged out over the 2001–11 period used for much of
the analysis in this study. Table 3 shows the main difference that remains, in which city size plays a key
role. Job growth was fastest in London (the only five million-plus city) and, to a lesser extent, in the
smallest cities, many of which are also in southern England.
Table 3: Change in total number of workplace jobs by city size category, 2001–
2011
Cities classified by urban size % change 2001–2011
Greater than 5 million 17.7
Between 5 million and 500,000 8.2
Between 500,000 and 275,000 8.7
Between 275,000 and 150,000 9.3
Between 150,000 and 100,000 12.4
Source: Population Censuses 2001 and 2011. Crown copyright data
To unpack this pattern of employment change in greater detail it is necessary to look at the periods
before and after the crisis of 2008, and separate the public services of public administration, education
and health from all other sectors. Figure 5 provides the results using full-time equivalent job numbers to
indicate the amount of paid work available and grouping the cities by their employment rates in 2001.
The 1998–2008 period saw a rate of growth in public service jobs which made a major contribution to
jobs growth in all three groups of cities, with little variation according to their relative need for more jobs,
as implied by employment rates. Job growth in other sectors was virtually nil across the low employment
rate cities over this period. Even the more successful higher employment rate cities only saw growth
through this ‘long boom’ decade amount to just over 5 per cent across the sectors other than public
services. This period was one of slight convergence and relatively little variation in the employment
trends of cities and the patterns do not consistently identify relatively declining cities.
15Figure 5: Change in broad sector full-time equivalent jobs by city employment rate
Sources: Annual Business Enquiry; Business Register and Employment Survey
The 2009–2013 period shows very different trends in the context of recession and public sector job
cuts. The low employment rate cities have again seen virtually no change in job numbers outside the
public service sectors. The same stagnation occurred in the high employment rate cities. This initial period
of austerity has been having more impact on the low employment rate cities with an end to public service
job growth, whereas the cities with less acute need for jobs still had some growth in the public services.
Having said that, Figure 5 does show that the differences in these relatively short-term trends between
whole categories of cities are not very large.
In general, it is clear that employment trends exhibit contrasting sub-periods, while public services have
been more volatile than other sectors. The implication is that there is no single measure of employment
trends which robustly identifies relatively declining cities. This conclusion is reinforced by looking at data
for individual cities whose trends underlie the summary patterns in Figure 5. Table 4 lists the ten cities
with the most positive and the most negative trends over each of the periods before and after 2008.
Over the period 1998–2008, High Wycombe was one of the ten cities with the least positive results,
while in the 2009–2013 period one of the worst trends was experienced by Exeter. It is notable that
Exeter was also the city with the most positive trend in the earlier period. Such highly volatile trends are
due to this dataset relying on sample surveys, making it less robust than data from the Census. This
confirms the unreliability of the employment rate as the sole criteria for identifying relatively declining
cities, while recognising its value as an indicator which generally provides the best available measure of
one important aspect of decline.
16Table 4: Change in total full-time equivalent jobs, best and worst ten cities
1998–2008 FTE % change 2009–2013 FTE % change
Exeter 31.8% Cheltenham 12.6%
Milton Keynes 26.6% Milton Keynes 9.5%
Northampton 24.5% London 8.9%
Preston 21.9% Chesterfield 7.1%
Eastbourne 20.3% Mansfield 5.2%
Wakefield 20.1% Barnsley 5.1%
Cambridge 18.6% Coventry 4.8%
Cardiff 18.6% Aberdeen 4.6%
Swansea 18.2% Warrington 4.6%
Brighton 17.9% Burnley 4.5%
National total 8.7% National total 1.9%
Huddersfield -0.3% Wigan -3.3%
Telford -1.4% Lincoln -3.8%
High Wycombe -2.3% Grimsby -3.8%
Chesterfield -2.6% Glasgow -5.7%
Birkenhead -3.3% Blackpool -5.8%
Blackburn -3.4% Dundee -5.9%
Barnsley -4.0% Exeter -7.1%
Swindon -5.1% Gloucester -7.5%
Burnley -8.8% Swindon -8.1%
Stoke -9.3% Rochdale -8.8%
Sources: Annual Business Enquiry, ONS; Business Register and Employment Survey, ONS
An index of relative decline
On their own, population and employment trends do not provide adequate single measures by which to
identify the cities most affected by relative decline. The multi-faceted nature of relative city decline
emphasises the need to bring several key indicators together in an overall index (see Figure 1), rather like
the widely used Index of Multiple Deprivation (McLennan et al., 2011). Such an approach provides a more
analytically robust measure, drawing strength from several indicators. To produce the index in a
transparent way, each indicator is transformed into a ranking, and the final index score for each city is
then derived by adding together its indicator rank values. Choice of the indicators included in the index is
the primary influence on the results. Indicators which on their own failed to identify UK cities in relative
decline can still be key inputs to the overall measure of city decline.
Recent total population growth or decline remains a central concern. The earlier analyses of
demographic change emphasised that much longer-term change continues to have an impact on cities,
so a measure of relative population decline over a century is also included. The analysis above emphasises
the importance to cities and their economic potential of the migration of younger people – particularly
those with high skills who are the most mobile – so the index includes a measure of net flows by those in
the age group most likely to graduate within the decade analysed. Finally, the analysis of the importance
of skills in the workforce leads to the inclusion of an indicator with a direct focus on the proportion of
the economically active age group with high qualifications. The four population indicators included in the
index are:
17• per cent change in total population 2001–2011;
• change in city size ranking position 1901–2001;
• estimated net in-migration rate 2001–2011 of those aged 15–19 as at 2001;
• percentage point change in the share of those aged 16–64 with a degree or higher qualification
2001–2011.
Given the importance of employment as key to poverty reduction, decline or low growth in the number
of FTE jobs is a central concern, requiring a separate analysis of the pre-recession and subsequent
periods. Drawing also upon the above analysis of employment rates, the following three employment
indicators are included in the index:
• percentage point change in the level of employment rate 2001–2011;
• per cent change in full-time-equivalent jobs at local workplaces 1998–2008;
• per cent change in full-time-equivalent jobs at local workplaces 2009–2012.
Appendix 2 lists the data sources used for the indicators. Appendix 3 provides the ranking of all 74 cities
on each of these 7 indicators. The final step in producing the Index of Relative Decline is to sum the
rankings on the seven indicators for each city, and then rank the cities on this value. The city ranked
number one has the highest score on the overall index. As a result, this index follows the convention of
the Index of Multiple Deprivation: the areas of highest policy concern have the highest ranking on the
index.
Results of the index of relative decline
The focus of the analysis of the index of relative decline is on the third of the 74 cities whose scores put
them top of the ranking. The higher the score on the index then the stronger the evidence that the city
is experiencing relative decline. Table 5 lists the 12 cities scoring highest on the index, and the 12 with
the next highest scores which make up the rest of the third of the cities at the top of the ranking. Map 3
shows the location of these 24 cities which on this evidence are experiencing signs of relative decline.
Table 5: The 24 cities with the highest scores* on the index of relative decline
Highest 12 scores Next 12 high scores
1 Rochdale 7 Dundee 13 Nottingham 19 Liverpool
2 Burnley 8 Middlesbrough 14 Huddersfield 20 Newport
3 Bolton 9 Bradford 15 Sunderland 21 Sheffield
4 Blackburn 10 Blackpool 16 Glasgow 22 Barnsley
5 Hull 11 Stoke 17 Belfast 23 Telford
6 Grimsby 12 Wigan 18 Birkenhead 24 Birmingham
* Where two cities had identical index scores, the ranking reflects the lower value on the key indicator ‘%-point change in level of
employment rate 2001-2011’
Source: Calculations based on datasets listed in Appendix 2
Each country of the UK includes at least one of these 24 relatively declining cities. There is a clear
north/south contrast: none of the 32 cities in the southern regions of England are among the 24 cities
of primary concern (see Figure 6). All but 2 of the highest ranked 12 cities are located in northern
England. They account for over 40 per cent of all cities in this northern region, and this proportion
reaches two-thirds when considering all 24 cities with high scores (see Figure 6). Looking at the top 24
rather than the top 12 cities on the index broadens the geographical coverage from northern England to
18the Midlands, plus the other countries of the UK. Each of these broad regional categories had just one
city among the highest scoring 12, but they become over-represented when the analysis is extended to
the 24 cities with high scores.
Setting aside London as the one case in the largest size category, smaller city size categories have lower
proportions of cities among the third with high index scores (see Figure 6). Over half of the cities in the
second largest size category have high index scores, but it is also noteworthy that none of them has a
score placing them among the highest 12, perhaps due to recent urban renaissance trends being
strongest in the largest cities. Many of the 12 cities which do have the highest scores are close
neighbours of these large cities, including several near Manchester. In such city regions, the central city is
performing better than some of its near neighbours.
Figure 6: Distribution of cities on the index of relative decline by city category
Source: Own calculations based on datasets listed in Appendix 2
19Map 3: Results of the index of relative decline
Source: Own calculations
20Typology of relatively declining cities
Creating a typology of different kinds of relatively declining cities needs analysis of key differences
between the 24 cities with high scores on the index of relative decline and this depends upon having
identified the key factors in relation to city decline from the wider literature (see Appendix 4). For each
such factor an appropriate measurement was identified, and then for each such measurement data for
the 74 cities was compiled. This dataset provided the input to a statistical model to identify which factors
were the most closely associated with higher or lower values on the index of relative decline (see
Appendix 4).
The model results suggested the risk of recent relative decline was lower for cities with:
• more highly qualified people among its working age group;
• no nearby larger city attracting away service trade;
• faster rail access to London (representing the broader issue of peripherality);
• little history of dependence for work on mining/manufacturing.
The skill level of the workforce is a longstanding and widely accepted key factor (Moser and Scott, 1961).
Highly skilled people tend to have higher incomes, creating positive economic multipliers and other job
opportunities. The importance to cities of the migration patterns of more highly qualified people has
been a recurring focus for this study.
Historical and geographical legacies are apparent here. History is most evident in the last factor, but it has
also bequeathed a closely spaced urban system which leaves some cities overshadowed by a nearby larger
city which has negative impacts on local services (McGough and Thomas, 2014). While being close to a
larger city offers the potential benefit of access to a larger labour market, this is of limited benefit if the
larger city can fill these jobs locally: few cities beyond London have surplus jobs needing lower skill
commuters from nearby cities. The other geographical factor, journey time by rail to London, is used
here as a proxy for more general peripherality and has no direct implications related to high-speed rail
facilities. The legacy of de-industrialisation means that cities with little previous dependence on
manufacturing and/or mining employment are less likely to now suffer relative city decline.
In using the results of the model, the key issue for the identification of city types relevant to policy
targeting is whether some of the 24 declining cities have distinct strengths in terms of the four
significant variables listed above. This can be tested by asking whether any of the 24 cities with high
decline index scores ranked among the best 24 in terms of highly skilled labour force, speed of train
access to London or lack of earlier dependence on heavy industry. Almost without exception the answers
are negative, meaning that these three variables are not sufficient to differentiate between different
types of relatively declining city (the exceptions are due to details of the indicators, such as the low
measure for Blackpool on the indicator of historic dependency on heavy industry, which masks the city’s
dependence on what proved to be a similarly vulnerable tourist trade).
The remaining significant variable in the model is a ‘yes/no’ issue for cities: whether they are
overshadowed by larger neighbours. Cities which are overshadowed have seen reductions in their higher-
order services and their attractiveness as a result, a trend also noted as a major concern by the
Commission for Underperforming Towns and Cities (2015). This is the one factor in the model to affect
only some relatively declining cities, with their closeness to core cities putting them among the category
Coombes et al. (1982) previously termed ‘sub-dominant’.
The development of a typology is also informed by the recent international literature on declining cities.
The most directly related study is Power et al. (2010) which identified recovery factors among ‘weak
market’ cities in Europe that had experienced severe de-industrialisation. City size emerged as an
important factor, with the ongoing concentration of services in main regional centres playing a role.
Accordingly, the first type of relatively declining city identified is that of core cities which are the principal
cities of conurbations and in some cases wider regions. Core cities host high-level services and anchor
institutions which attract investment and people. As demonstrated above, these large cities had recently
followed London in experiencing urban renaissance, and the index results echoed this by finding none of
these core cities among the 12 cities with the highest relative decline scores.
21Box 1: Core cities
The 24 declining cities include several core cities but exclude three in northern England. Strong relative
population decline over a lengthy period (see Map 2) may make it surprising that Manchester and
particularly Newcastle are excluded. This partly reflects the role of such core cities as the principal cities
not only of conurbations but also their wider regions. As a result, they host high-level service facilities,
and both also hold strong attractions for students. Major education, health or other anchored institutions
can support the renewal of cities where they are based, boosting the inflows and restraining the outflows
of high-skill migrants while increasing demand for consumer services. Manchester and Newcastle have
gained from such processes to a greater extent than other core cities outside the south including
Sheffield and Liverpool.
The second type of relatively declining city is the overshadowed city with larger neighbouring cities and a
reduced level of consumer services. Overshadowed cities persistently lose higher-level functions to their
larger neighbours and this provides much of the extra growth opportunities enjoyed by those cities. The
links that bind the core and the overshadowed cities together include strong net commuting flows
towards the core cities.
Box 2: Over-shadowed cities
The issue of overshadowing sees contrasting rates of growth in neighbouring cities. This can be charted
over time in changing commuting patterns, as with neighbouring Preston and Blackburn (Lancashire) and
Leeds and Bradford (West Yorkshire). Hall et al. (2001) showed that Leeds and Preston became service
centres when better-paid jobs replaced those in old industries, while their slightly smaller neighbours
struggled to make the transition from their old industrial base. The 1921 Census gives the earliest
commuting data, revealing that the flow from Leeds to Bradford of 1,635 was larger than that in the
opposite direction (847). Similarly the flow from service centre Preston to manufacturing-based
Blackburn outnumbered that the other way. However, the decline in the manufacturing centres meant
that even by 1951 flows from Leeds to Bradford and from Preston to Blackburn had fallen, while those
from Bradford and Blackburn to their more successful neighbours nearly doubled. The 2011 Census
reveals flows to strongly growing Leeds and Preston from their overshadowed neighbouring cities had
become roughly twice as high as flows in the opposite direction, massively reversing the position of
nearly a century earlier.
The third type of relatively declining cities covers those which are too small to be core cities, while also
not being overshadowed. These freestanding cities are characteristically located some distance from the
largest urban conurbations of the UK.
Box 3: Freestanding cities
Middlesbrough (Teesside) and Grimsby are relatively freestanding cases among the 24 relatively declining
cities. They are neither locally overshadowed nor core cities themselves, illustrating some features of a
third declining city type. Both were in the city category Donnison and Soto (1980) highlighted because
their relatively higher paying manual jobs fostered diverse benefits like social mobility. Since that analysis
de-industrialisation has reduced skilled manual work, reducing demand for level 2 and 3 skills. Teesside
grew rapidly in the 1960s and 1970s, but former growth industries declined as the children of earlier in-
migrants entered the labour force. In this it was far from unique but – apart from Grimsby and Coventry
– all the other cities among the 74 in this study which Donnison and Soto had been optimistic about
were in the southern regions of England, where de-industrialisation in cities like Swindon occurred along
with a diversification which has been largely absent in Middlesbrough and Grimsby.
Table 6 identifies which of the 24 relatively declining cities has the characteristics of each of the three
types defined here, grouped by urban size. The key factor that differentiates between core and
overshadowed cities is their level of local service provision. Overshadowed cities have lower level services
than would be expected for their size due to the impact of larger cities nearby. There is one city – Stoke
– which is less close to a large city, but it has the same characteristic of low service provision due to its
distinctive industrial development history. The third category covers the freestanding cities whose service
22You can also read


