CITY OF CAPE TOWN STATE OF
   THE ENVIRONMENT REPORT
                      2018
←
→
Page content transcription
If your browser does not render page correctly, please read the page content below

CITY OF CAPE TOWN STATE OF
THE ENVIRONMENT REPORT
2018
FOREWORD
                                      Surrounded by mountains and oceans, Cape Town is home to some of the
                                      world’s most significant and diverse natural vegetation and landscapes. It is a
                                      vibrant city, unique and distinctive, a place in which people are able to express
                                      their culture and art, and to celebrate their shared histories. However, Cape
                                      Town, as with many urban areas globally, faces a number of environmental
                                      challenges. These include rapid urbanisation, increasing scarcity of resources,
                                      (including water, energy, the ability to treat waste products) and pollution of the
                                      city’s air, water and open spaces. Cape Town must also deal with the emerging
                                      reality of climate change, which exposes the city and its residents to increased
                                      risk from extreme weather events and long-term climatic shifts. The need to
                                      conserve natural and cultural heritage in a rapidly growing and ever-changing
                                      city, while also ensuring the effective provision of services and amenities to all
                                      citizens, is a significant challenge.

The City of Cape Town recognises that the natural environment is an irreplaceable resource, which provides a myriad
of ecosystem goods and services with a host of associated economic and social benefits to the citizens of Cape Town.
Functions such as climate regulation, waste assimilation, natural hazard regulation and the supply of fresh food, water,
and air are essential for preserving and maintaining a well-run city. Recreational activities such as hiking, picnicking,
birdwatching, and water sports; educational and scientific research opportunities; and spiritual, cultural and
religious benefits offer the opportunity for diverse communities to come together in shared outdoor spaces and are
essential for maintaining the social and cultural character of an inclusive city. Most importantly, Cape Town’s natural
environment is a collective resource that belongs to all citizens of Cape Town, which must remain accessible and
deliver benefits to all citizens.

The new Environmental Strategy adopted by the City of Cape Town is committed to ensuring the long-term
sustainability of the city in order to ensure that the economic and social benefits that the natural environment provides
continue to be accessible to all, and to be preserved for future generations. The State of the Environment Report is an
essential tool for tracking and measuring progress towards the goal of becoming a more sustainable city. It provides
a snapshot of the environment in a particular moment in time, as well as an analysis of trends over time, and ensures
that city leaders and decision makers have access to accurate and transparent data and information about a range
of environmental issues. This enables us to act on environmental problems as they are identified, based on clear
supporting information and evidence.

It is important to remember that sustainability cannot be achieved by local government alone but requires the
participation of all members of our society, including all spheres of government, the private sector, residents and
visitors to Cape Town. I therefore encourage everyone reading this report to actively participate in working towards
a more sustainable Cape Town.

Executive Mayor
City of Cape Town

                                                                                                                      01
TABLE OF CONTENTS
FOREWORD                                                 01

OVERVIEW                                                 08
The natural environment in the City of Cape Town         09
The State of the Environment Report                      09
Goods and services of the natural environment            09
Targets and policy linkages                              10
Indicators                                               10

CHAPTER 1: BIODIVERSITY                                  11
Understanding Cape Town’s biodiversity                   12
Understanding flora in Cape Town                         12
State of the environment                                 14
Key management responses                                 21
Trends and targets                                       22
Policy linkages                                          22

CHAPTER 2: INVASIVE ALIEN SPECIES                        23
Understanding invasive alien species in Cape Town        24
State of the environment                                 26
Key management responses                                 29
Trends and targets                                       29
Policy linkages                                          29

CHAPTER 3: NATURAL PUBLIC GREEN SPACE                    30
Understanding natural public green spaces in Cape Town   31
State of the environment                                 32
Key management responses                                 34
Trends and targets                                       34
Policy linkages                                          34

CHAPTER 4: FRESHWATER QUALITY                            35
Understanding freshwater quality in Cape Town            36
State of the environment                                 39
Key management responses                                 42
Trends and targets                                       42
Policy linkages                                          42

CHAPTER 5: COASTAL WATER QUALITY                         43
Understanding coastal water quality in Cape Town         44
State of the environment                                 45
Key management responses                                 48
Trends and targets                                       49
Policy linkages                                          49

                                                              02
CHAPTER 6: WATER USE                          50
Understanding water use in Cape Town          51
State of the environment                      52
Key management responses                      54
Trends and targets                            55
Policy linkages                               55

CHAPTER 7: WASTEWATER                         56
Understanding Cape Town’s wastewater system   57
State of the environment                      59
Key management responses                      69
Trends and targets                            69
Policy linkages                               69

CHAPTER 8: CLIMATE CHANGE                     70
Understanding climate change in Cape Town     71
State of the environment                      71
Key management responses                      74
Trends and targets                            75
Policy linkages                               75

CHAPTER 9: AIR QUALITY                        76
Understanding Cape Town’s air quality         77
State of the environment                      78
Key management responses                      82
Trends and targets                            82
Policy linkages                               82

CHAPTER 10: SOLID WASTE                       83
Understanding solid waste in Cape Town        84
State of the environment                      85
Key management responses                      88
Trends and targets                            89
Policy linkages                               89

CONCLUSION                                    90

REFERENCES                                    92

APPENDIX                                      93

                                                   03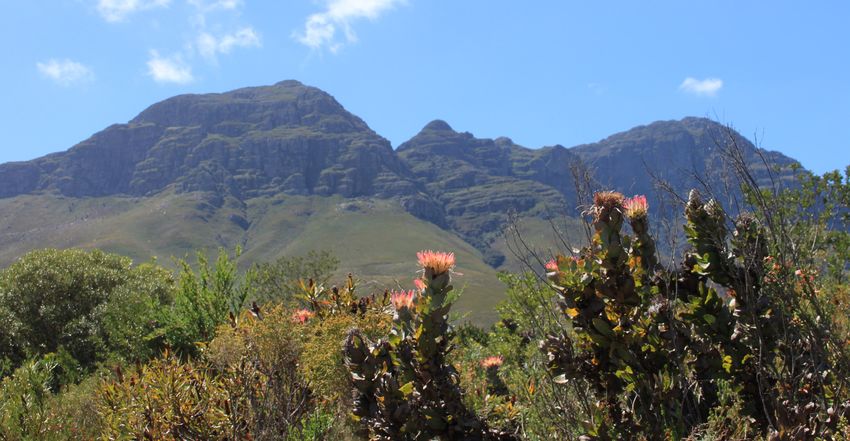
ABBREVIATIONS/ACRONYMS
BioNet		Biodiversity Network
CBAs 		       Critical Biodiversity Areas
CCT 		        City of Cape Town
CCT-IWMP 		   Integrated Waste Management Policy
CESAs 		      Critical ecological support areas
CFR 		        Cape Floristic Region
City 		       The administrative body of the City of Cape Town city
              The region of City of Cape Town
COD 		        Chemical oxygen demand
CO2 		        Carbon dioxide
CO2e 		       Carbon dioxide equivalent
CRO 		        Chief Resilience Officer
DWA 		        Department of Water Affairs
DCCP 		       Dassenberg Coastal Catchment Partnership
DWS 		        Department of Water and Sanitation
E. coli 		    Escherichia coli
EDRR 		       Early Detection and Rapid Response programme
IDP 		        Integrated Development Plan
IMEP 		       Integrated Metropolitan Environmental Policy
IUCN 		       International Union for Conservation of Nature
IWMP 		       Integrated Waste Management Plan
GEF 		        Global Environment Fund
GHGs 		       Greenhouse gases
Hh 		         Low-risk
HH 		         High-risk
METT 		       Management Effectiveness Tracking Tool
NEMBA 		      National Environmental Management: Biodiversity Act
NEMWA		National Environmental Management: Waste Act
NO2 		        Nitrogen dioxide
PM10
     Particulate matter
PV 		         Photovoltaic
SDF 		        Spatial Development Framework
SMMEs		Small, Medium and Micro-sized Enterprises
SO2 		        Sulphur dioxide
SSEG 		       Small-scale embedded generation
SUDS 		       Sustainable urban drainage systems
WCWDM 		      Water conservation and water demand management
WFW 		        Working for Water
WHO 		        World Health Organisation
WSUD 		       Water sensitive urban design
WWF 		        World Wildlife Fund
WWTW 		       Wastewater treatment work

                                                                        05
LIST OF FIGURES
Figure 1.    Percent of test results for specific rivers in Cape Town which met DWS intermediate contact guideline
             during 2016
Figure 2.    Percent of test results for specific wetlands and vleis in Cape Town which met DWS intermediate contact
             guideline during 2016
Figure 3.    Trophic tendency in specific Cape Town rivers during 2016
Figure 4.    Trophic tendency in specific Cape Town wetlands and vleis during 2016
Figure 5.    Adherence of coastal water quality to DWS guideline – False Bay Coast
Figure 6.    Adherence of coastal water quality to DWS guideline – Atlantic Coast
Figure 7.    Annual water treated and provided by the City of Cape Town, 1996 – 2016
Figure 8.    Daily water use per capita, 1996 – 2016
Figure 9.    Megalitres of water reused, 2009 – 2016
Figure 10.   Average compliance of all W WT Ws with DWS standards, 2007 – 2016
Figure 11.   Compliance with DWS standards, 2016
Figure 12.   Average compliance of all W WT Ws with DWS standards for suspended solids, 2007 – 2016
Figure 13.   Compliance with DWS standards for suspended solids, 2016
Figure 14.   Average compliance of all W WT Ws with DWS standards for pH, 2007 – 2016
Figure 15.   Compliance with DWS standards for pH, 2016
Figure 16.   Average compliance of all W WT Ws with DWS standards for conductivity, 2007 – 2016
Figure 17.   Compliance with DWS standards for conductivity, 201
Figure 18.   Average compliance of all W WT Ws with DWS standards for COD, 2007 – 2016
Figure 19.   Compliance with DWS standards for COD, 2016
Figure 20.   Average compliance of all W WT Ws with DWS standards for ammonia, 2007 – 2016
Figure 21.   Compliance with DWS standards for ammonia, 2016
Figure 22.   Average compliance of all W WT Ws with DWS standards for orthophosphate, 2007 – 2016
Figure 23.   Compliance with DWS standards for orthophosphate, 2016
Figure 24.   Average compliance of all W WT Ws with DWS standards for nitrate/nitrite, 2007 – 2016
Figure 25.   Compliance with DWS standards for nitrate /nitrite, 2016
Figure 26.   Average compliance of all W WT Ws with DWS standards for E. coli, 2007 – 2016
Figure 27.   Compliance with DWS standards for E. coli, 2016
Figure 28.   Carbon emissions by source, 2015
Figure 29.   Carbon emissions by sector, 2015
Figure 30.   Annual NO2 averages, 2005 – 2016
Figure 31.   Annual SO2 averages, 2005 – 2016
Figure 32.   Annual PM10 averages, 2005 – 2016
Figure 33.   Number of PM10 exceedances, 2009 – 2016
Figure 34.   Total waste generated, 2008 – 2016
Figure 35.   Total waste disposed, 2008 – 2016
Figure 36.   Total waste disposed per capita, 2008 – 2016
Figure 37.   Total waste diverted from landfills, 2008 – 2016

                                                                                                                     06
LIST OF MAPS
Map 1.         The Greater Cape Floristic Region
Map 2.         City of Cape Town Biodiversity Network
Map 3.         Historical distribution of indigenous vegetation in Cape Town
Map 4.         Current extent of indigenous vegetation in Cape Town
Map 5.         Ecosystem status of indigenous vegetation in Cape Town
Map 6.         The extent of invasive alien vegetation in the City of Cape Town nature reserves.
Map 7.         Distance to natural green public space in Cape Town
Map 8.         Cape Town’s freshwater system
Map 9.         Adherence to DWS guidelines for each beach in 2016
Map 10.        Blue Flag beaches in the City of Cape Town, 2016

LIST OF TABLES
Table 1.       Percentage of historical vegetation remaining
Table 2.       NEMBA categories
Table 3.       Some invasive species in Cape Town
Table 4.       Alien species assessed for clearing methods in Cape Town
Table 5.       Prevailing environmental characteristics of varying phosphate levels
Table 6.       Blue Flag beaches in Cape Town
Table 7.       Cape Town water tariffs as per water restrictions, including VAT, for 2017/18
Table 8.       South African National Ambient Air Quality Standards.

ACKNOWLEDGEMENTS
Text: Amy Cuff and Amy Davison
Environmental Management Department
Photography: City of Cape Town/Bruce Sutherland

                                                                                                   07
OVERVIEW

           08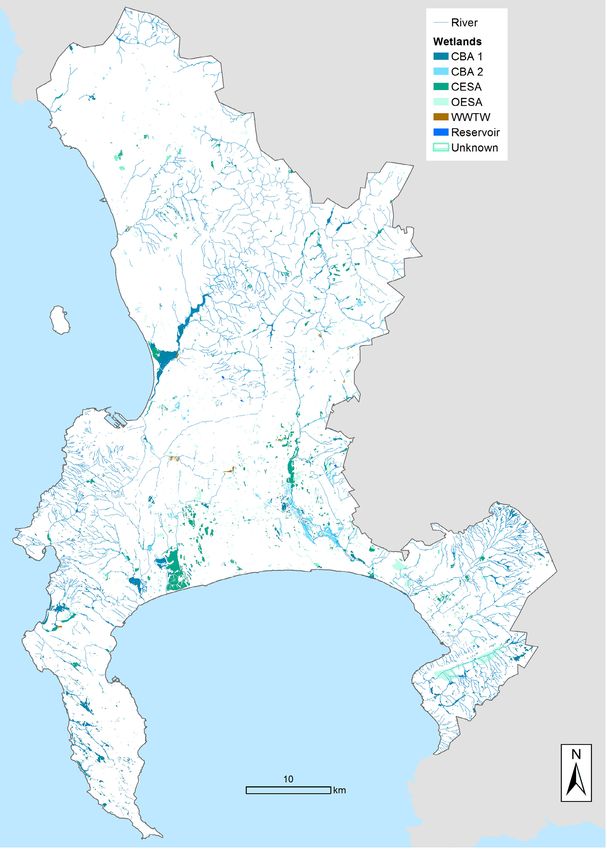
The natural environment in the                                    The Integrated Metropolitan Environmental Policy
City of Cape Town                                                 (IMEP) adopted in 2001, followed by the Environmental
                                                                  Agenda 2009 – 2014 and a new Environmental Strategy,
A healthy natural environment is a requirement for all life,      brings the City’s environmental policy approach into
including humans. Natural systems are responsible for             line with more contemporary thinking on the matter.
ensuring that we have clean air, clean water, and soils,          The new Environmental Strategy was approved in
which are the basis of life. These three primary services of      2017. Additionally, environmental concerns have been
natural systems allow us to grow food and fuel to sustain         integrated into strategic City planning documents, such
our needs. Additionally, a healthy environment provides           as the Integrated Development Plan and the Cape Town
cultural, aesthetic, and recreational benefits to all residents   Spatial Development Framework.
of and visitors to the city.
                                                                  The State of the Environment Report
The natural environment has been negatively affected
by urban development and impacted by various threats              The State of the Environment Report is an essential
associated with urbanisation. These threats have the ability      monitoring and evaluation tool that is used to identify
to impact water and air quality through pollution and the         and report on changes to the city’s natural environment
disruption of ecological functions, disturbing the delicate       and the goods and services it provides. Recording and
balance in biological diversity. Human development                reporting such changes is a critical step in working
has also increased the demand for water, solid waste              towards ensuring appropriate action is taken to reduce
management, and electricity. It is essential for local            risks to the environment and address environmental
governments, such as Cape Town, to actively work towards          degradation. This report provides a snapshot of the
conserving and promoting a healthy environment while              state of the environment at a particular moment in
ensuring that economic and social development continues           time, but more importantly, shows trends in the state
in a sustainable manner.                                          of the environment over time. This supports informed
                                                                  environmental decision-making.
Climate change presents a further challenge, with
changing and somewhat unpredictable climatic conditions           Goods and services
becoming more evident over time. These changes affect             of the natural environment
the ability of the environment to provide its essential
goods and services, impacting negatively on development           Five environmental benefits are used as themes
and, most notably, human health.                                  throughout this report to highlight the overarching goods
                                                                  and services that the environment provides, enhancing our
Environmental sustainability is an essential component            ability to acknowledge the value of environmental systems
of ensuring healthy social and economic growth in Cape            and their connection to the way we live our lives.
Town. The City of Cape Town is committed to adopting
and implementing the principles and approaches needed
to reach this goal.

                                                                                                                            09
These themes are:                                             aligned with the wealth gap. Resource-use targets and
                                                              strategies were therefore aimed at reducing current over-
            Aesthetic value: The maintenance or               consumption patterns in middle and upper classes while
            functioning of this environment provides          increasing appropriate resource use in impoverished and
            significant aesthetic value to those who          disadvantaged communities so as to extend quality living
            interact with it.                                 environments and basic services.

            Ecological value: The maintenance or              This report uses the Environmental Agenda 2009 – 2014
            functioning of this aspect of the natural         targets as a baseline target for most chapters. Where there
            environment significantly affects the             are updated targets set for specific City functions, these
            ecological integrity of this natural              are used. The future State of the Environment Reports will
            space and space within it.                        use the Environmental Strategy adopted in 2017 as a basis
                                                              for measuring progress.
            Recreational value: The maintenance or
            functioning of this aspect of the natural         Indicators
            environment provides recreational space for
            those who interact with it.                       This report is based on the 2016 calendar year – January
                                                              2016 to December 2016 – unless stated otherwise. The
            Human health: The maintenance or                  data in the report is used in accordance with indicators.
            functioning of this aspect of the natural         Indicators set measurement in order to be able to track
            environment affects the quality of                environmental changes over time. The selected indicators
            human health.                                     are aligned with the Integrated Development Plan (IDP)
                                                              and the Strategic Environmental Policy for the City of
            Socio-economic value: The maintenance             Cape Town. The selection of indicators was also guided
            or functioning of this aspect of the natural      by international and local experience in this field, scientific
            environment provides socio-economic               research and consultation with key stakeholders.
            advantages to those who interact with it, in
            the form of social or economic development.
                                                                           Situation improving

Targets and policy linkages
The Five-Year Review of the City’s first Integrated
Metropolitan Environmental Policy (IMEP), adopted in
2001, identified the need for the City and its communities                 Situation deteriorating
to actively shift from a business-as-usual approach towards
a driven and targeted sustainability agenda. As such, IMEP
was reviewed to include key measurable environmental
commitments for the five-year period 2009 – 2014. These
environmental commitments to a sustainable future were                     No significant change
formalised as the City’s Environmental Agenda 2009 –
2014.

The Environmental Agenda 2009 – 2014 was adopted to           It is important to note that the indicators provide only a
uphold the City of Cape Town’s commitment to increasing       glimpse of a situation at a particular point in time and do
levels of ecosystem and heritage protection, while            not necessarily tell the whole story. However, monitoring
reducing overall resource consumption. This commitment        indicators over time allows one to draw fair conclusions
took place with the recognition that quality environments     about trends, while working towards ensuring that
and resource-use patterns are significantly skewed and        necessary action is taken in a timely fashion.

                                                                                                                          10
CHAPTER 1:
BIODIVERSITY
11Understanding Cape Town’s biodiversity Understanding flora in Cape Town
Cape Town is abundantly rich in biological diversity and The indigenous vegetation of Cape Town comprises four
recognised around the world for its natural beauty. The broad categories – Mountain Fynbos, Lowland Fynbos,
city is located within the Cape Floristic Region (CFR), Renosterveld and Strandveld. Fynbos is characterised by
part of the Greater Floristic Region biogeographical unit, plants with small and fine leaves, the dominance of shrubs
as indicated in Map 1. The most biologically diverse of and Cape reeds, as well as its ability to thrive in poor soils
the six plant kingdoms, the Cape Floristic Region is also and seasonally hot and dry conditions.
recognised as one of the planet’s 25 most-threatened
ecosystems. The region is home to 9 600 plant species, of Mountain Fynbos
which over 70% are found nowhere else in the world1.
Found on the upper and lower mountain slopes, Mountain
Fynbos has been negatively impacted by agriculture
With such a unique plant kingdom both within the urban
and plantation forestry, particularly on the richer granite
fabric and around the outskirts of Cape Town, the City
and shale-derived soils, and by urban development on
of Cape Town has the complex task of managing this
the lower slopes. There are many plant species within
important natural heritage resource. This rich biodiversity
this fynbos ecosystem that are locally endemic and/or
must be conserved and integrated into present and future
threatened. Mountain Fynbos comprises eight vegetation
spatial planning of the city.
types: Peninsula Sandstone Fynbos, Kogelberg Sandstone
Fynbos, Western Coastal Shaleband vegetation, Elgin
Shale Fynbos, Peninsula Granite Fynbos, Boland Granite
Indicators:
Fynbos, and Cape Winelands Shale Fynbos. Peninsula
• Indigenous vegetation remaining, Sandstone Fynbos and Peninsula Granite Fynbos are
by national vegetation type endemic to Cape Town. Plants that characterise this
• Extent of natural vegetation within vegetation type include proteas (Proteaceae), such
the city as the King Protea (Protea cynaroides), Sunshine
Conebush (Leucadendron salignum) and Tree Pincushion
• METT-SA and Protected Area
(Leucospermum conocarpodendron), as well as Cape
Review scores
reeds (Restionaceae), Ericas (Ericaceae) and other fine-
leaved shrubs.
Lowland Fynbos
Located on the Cape Flats and coastal plains, Lowland
Fynbos is threatened by land-use changes and increasing
urbanisation. Lowland Fynbos comprises five vegetation
types: Cape Flats Fynbos, Atlantis Sand Fynbos, Hangklip
Sand Fynbos, Lourensford Alluvium Fynbos, and Swartland
Alluvium Fynbos. Of these five types, Cape Flats Sand
Fynbos and Lourensford Alluvium Fynbos are endemic to
Cape Town (Table 1). Plants that characterise this type of
fynbos include numerous Erica species, proteas such as
the Cape Flats Conebush (Leucadendron levisanus), Cape
reeds (Restionaceae) and bulbous plants of the lily and
iris families. Lowland and Mountain Fynbos collectively
Map 1: The Greater Cape Floristic Region2. comprise of about 80% of the CFR3. Historically, Cape Flats
Sand Fynbos was the most widespread vegetation type in
Cape Town, but now a mere 11% of this remains, mostly in
Over two thirds of the natural vegetation types in a degraded state, with only 2% conserved.
the city are classified as endangered or critically
endangered.
Over 300 of Cape Town’s plant species are
threatened with global extinction.
12Renosterveld There are 74 mammal species thought to occur within Cape
Town, 16 of which are endemic to South Africa.
Renosterveld is thought to be named after the black
The nocturnal nature of these mammals in the CFR makes
rhinoceros historically found in this vegetation. There are
them difficult to observe6. The City’s reserves are home
four remaining Renosterveld vegetation types found in
to many smaller mammals, including the Cape Leopard,
Cape Town: Peninsula Shale Renosterveld, Swartland
Large and Spotted Genet, Honey Badger, Caracal, Grey
Shale Renosterveld, Swartland Silcrete Renosterveld
Mongoose, Striped Mouse, Rock Hyrax (or Dassie) and
and Swartland Granite Renosterveld. Peninsula Shale
small antelope such as the Cape Grysbok, Steenbok and
Renosterveld is endemic to Cape Town (Table 1). This
Duiker. Baboons are also commonly found within the city,
vegetation type is characterised by low, small-leaved
particularly within the Steenbras Nature Reserve and Table
shrubs of one to two metres tall comprised of ericoids
Mountain National Park.
with a ground layer of grasses4. Renosterveld is dominated
by the grey Renosterbos (Elytropappus rhinocerotis), but
Insects and invertebrates
historically may have been dominated by grass species
such as Rooigras (Themeda triandra). Renosterveld is rich There are thousands of species of insects and spiders
in shrubs from the daisy family (Asteraceae) and bulbous throughout Cape Town, although the exact number of
plants, such as orchids, irises and lilies5. invertebrate species is unknown. Pollinating species include
flies, moths, bees, butterflies and beetles. Some flowers are
Strandveld pollinated by dozens of different species while others have
evolved to rely on a single, highly specialised pollinator.
Strandveld grows in alkaline coastal sands and dunes and
Two locally endemic butterflies, the Unique Cape Flats
has been considerably impacted by coastal development.
Ranger and the Barber’s Cape Flats Ranger, are on the brink
It is confined mainly to the coastal margins and extends
of extinction and urgently need their remaining habitats
inland only on the dune fields of the Cape Flats and West
secured into conservation.
Coast. Cape Flats Dune Strandveld (CFDS) is endemic
to Cape Town and consists of two subtypes, False Bay
Amphibians
CFDS and West Coast CFDS. Plants that characterise this
type include Sea Guarrie (Euclea racemosa), Blombos Cape Town’s watercourses and wetlands are home to an
(Metalasia muricata), Bietou (Osteospermum monilifera), abundance of frogs and toads. There are 27 species within
annual daisies and numerous succulent vygie species. the city boundaries. Two of these, the Table Mountain
CFDS differs from fynbos and Renosterveld as it is not Ghost Frog and the Lightfoot’s Moss Frog, are endemic
fire-prone and should burn infrequently, with a fire cycle of to the CFR7 and both are found in the Table Mountain
typically 20-to-100 years. National Park. The Cape River Frog and the endangered
Western Leopard Toad are also commonly found within
Understanding fauna in Cape Town the city.
Cape Town has a rich fauna, mirroring the plant diversity. The Western Leopard Toad lives and breeds in the low-
However, many of the city’s indigenous animals are lying regions of Cape Town, with further populations
inconspicuous and nocturnal, occurring at low densities. found along the coast to the Agulhas Plain. These
amphibians are endangered due to their confinement to
Mammals sandy coastal lowlands of the Western Cape. Also, as a
The CFR was once home to vast herds of game animals, result of urbanisation, their wetland habitats have been
which now is a characteristic more associated with the impacted by drainage, in-fill, pollution and building.
savannas in the eastern regions of South Africa. Highly Invasive alien flora species invade their breeding sites
nomadic, these animals would move great distances in and fauna prey on them. The Western Leopard Toad is a
the search of food availability, favouring recently burnt crucial part of Cape Town’s biodiversity as it is an ‘indicator
vegetation. Renosterveld vegetation types, occurring on species’ that indicates a healthy Cape Town biodiversity.
nutrient-rich clay and granite soils that support palatable Visit the City website to see ways on joining efforts to
grasses, would have been more densely populated than the conserve these endangered toads (click here).
nutrient-poor fynbos vegetation types. Most of these game
animals were hunted out by early European settlers.
13Reptiles consists of a series of interconnected critical biodiversity
areas (CBAs) ranging from pristine habitats to degraded
There are an estimated 65 species of reptile within the city,
highly threatened ecosystems and critical ecological
30 of which are endemic to South Africa8. Lizards such as
support areas (CESAs). The City aims to have 65% of the
the Southern Rock Agama, the Smooth Cape Skink and the
BioNet conserved by 2019. The extent of the BioNet is
Black Girdled Lizard are commonly found. Until recently
shown in Map 2.
Cape Town was home to the world’s second rarest and
most endangered tortoise, the Geometric Tortoise, which is
The total area of land formally conserved within the BioNet
now locally extinct. The Angulate Tortoise and the Common
has increased significantly over the past decade. By 2014
Padloper, also known as the Parrot-beaked Tortoise, are
60.81% of the BioNet had been formally conserved, rising
often seen in City nature reserves, while wetlands and
to 64% in 2016. This steady increase has put the City on
streams are home to Marsh Terrapins.
track to reaching its 2019 target of 65% of the BioNet
conserved. The BioNet covers a total of 87 902 ha of land,
Birds
with 85.6% of the land being outside the urban edge.
There are 374 recorded bird species in the Cape Town
area, 16 of which are endemic to South Africa and 24 of There is a total of 90 587 ha of indigenous terrestrial
which have been assigned Red Data Status9. This includes vegetation remaining in the city. This indigenous terrestrial
numerous species adapted to suburban gardens and a vegetation comprises 37.1% of its original historical extent,
diversity of water birds. with 21.9% of that original extent proclaimed or managed.
In addition, all wetlands and rivers form part of the BioNet.
Cape Town is home to six CFR endemic bird species:
the Cape Sugarbird, Orange-breasted Sunbird, Cape Table 1 lists the percentage of each vegetation type remaining
Siskin, Protea Canary, Cape Rock-jumper and Victorian’s in Cape Town. Maps 3, 4 and 5 provide a visual representation
Warbler. These species attract many birdwatchers to the of the table. The table compares the extent remaining of each
city. Other fynbos birds include the Red-winged Starling, vegetation type and the proportion of historical extent. It also
Ground Woodpecker, Cape and Sentinel Rock-thrush, indicates how much of this remaining vegetation is currently
Cape Grassbird, Neddicky, Karoo Pinia, Pied Crow and proclaimed or managed, as well as the ecosystem status of
White-necked Raven. The most common birds of prey the existing indigenous vegetation. The ability to conserve
are the Rock Kestrel, Peregrine Falcon, Rufous-chested the various vegetation types depends on a number of factors,
Sparrowhawk and Jackal Buzzard. including location of the remnants, land ownership and
competing priorities.
Cape Town is also home to many marine birds along its
long coastline. These include the African Penguin, Cape Conservation of endemic vegetation types is a high priority.
Gannet and Bank Cormorant, all of which are vulnerable The City recognises that there are certain endemic vegetation
to extinction and endemic to South Africa. Various types types that are better conserved than others. The most
of gulls, terns, waders, cormorants and gannets can well-conserved endemic vegetation types are the Mountain
commonly be found along the coast throughout the year, Fynbos areas, including Peninsula Sandstone Fynbos and
while pelagic birds such as albatrosses, shearwaters, skuas Peninsula Granite Fynbos. The most poorly conserved
and petrels may sporadically be seen from clifftops along endemic vegetation types are Lourensford Alluvium Fynbos
the coastline. and Cape Flats Sand Fynbos.
State of the environment There are currently 21 039 ha of Peninsula Sandstone
Fynbos remaining, or 95.9% of the historical extent. This
vegetation type occurs on very steep mountain slopes with
When land is formally ‘conserved’ it means that the the poorest soil, factors that are significant as they do not
land is proclaimed in perpetuity and managed by the allow for easy infrastructure development or productive
City, or other entities such as SANParks, CapeNature, agricultural activity10. As such, 81.43% of this type is
private landowners/managers, and parastatals, such managed or proclaimed. As is the case for all Mountain
as Eskom. Fynbos areas, this vegetation is important to conserve as a
water catchment area, in addition to its unique biodiversity.
The Biodiversity Network (BioNet) is the fine-scaled
conservation plan for the City of Cape Town municipal area.
Aimed at securing national conservation targets, the BioNet
14There are currently 3 949 ha of Peninsula Granite Fynbos
remaining, or 42.8% of its historical extent. A significant
proportion of the South Peninsula Granite Fynbos subtype
is recovering from pine plantation impact and invasive
alien species are a major additional threat. Peninsula
Granite Fynbos occurs on gentle slopes with deep, fertile,
sandy-loam soils that are well suited for vineyards and
pine plantations. This makes areas historically containing
Peninsula Granite Fynbos attractive for agricultural and
urban development. However, some of this vegetation
type is conserved in the Table Mountain National Park and
within the Kirstenbosch National Botanical Garden and is a
very popular vegetation type for recreational activities such
as hiking, cycling, dog walking and horse riding11. A total
of 30.7% of this is proclaimed, but a lack of fire is allowing
invasion by forest species to the detriment of
the Peninsula Granite Fynbos species.
The most poorly conserved endemic vegetation types
include Cape Flats Sand Fynbos and Lourensford Alluvium
Fynbos. There are currently 5 951 ha of Cape Flats Sand
Fynbos remaining, which is only 11% of its historical extent
and only 2.3% of this type is proclaimed or being managed.
This vegetation type and its associated soils drain easily and
are suitable for housing and urban development. Due to the
suitability of this vegetation for urban activity, urbanisation
has considerably reduced its extent and fragmented
remaining habitat. Furthermore, side effects of urbanisation
have also impacted the existence of the vegetation.
Mowing, fire protection, dumping, polluted waterbodies
and alien plant invasion are identified to be threats to this
fynbos type12.
Only 228 ha of Lourensford Alluvium Fynbos remain, which
is 6.3% of its historical extent, mostly highly degraded.
Only 2.1% is managed or proclaimed. This vegetation
type is found in the low-lying areas between Firgrove and
Gordons Bay, including areas of Strand and Somerset West
extending up the Lourens River Valley. This area, in common
with all vegetation types bordering natural remnants,
has been irreversibly modified by urban development,
agriculture, and pine plantations, resulting in this type being
one of the most impacted endemic veld types in the city13.
To date no lowland vegetation types have met their
minimum national targets in conservation areas. This
inability to meet conservation targets is due to historical
widespread agriculture and rapid urbanisation.
15Map 2: City of Cape Town’s Biodiversity Network14 15
16% Historical
Ha Vegetation % Remaining
Vegetation type Proclaimed/ Ecosystem Status
Remaining of Historical
managed
Atlantis Sand Fynbos 14 696 58.4 19.0 Critically endangered
Boland Granite Fynbos 5 601 59.7 21.7 Vulnerable
Cape Flats Dune Strandveld 18 315 44.4 23.8 Endangered
*Cape Flats Sand Fynbos 5 951 11.0 2.3 Critically endangered
Cape Winelands Shale Fynbos 2 937 55.7 38.5 Vulnerable
Elgin Shale Fynbos 331 39.3 38.0 Critically endangered
Hangklip Sand Fynbos 1 850 56.1 43.4 Endangered
Kogelberg Sandstone Fynbos 9 201 97.5 88.1 Critically endangered
*Lourensford Alluvium Fynbos 228 6.3 2.1 Critically endangered
Peninsula Granite Fynbos 3 949 42.8 30.7 Endangered
Peninsula Sandstone Fynbos 21 039 95.9 81.3 Endangered
*Peninsula Shale Renosterveld 275 11.6 10.3 Critically endangered
Southern Afrotemperate Forest 345 99.2 90.9 Least threatened
*Swartland Alluvium Fynbos 56 3.2 0.0 Critically endangered
*Swartland Granite Renosterveld 1 834 25.1 2.9 Critically endangered
*Swartland Shale Renosterveld 3 516 7.4 2.2 Critically endangered
*Swartland Silcrete Renosterveld 149 13.7 0.4 Critically endangered
Western Coastal Shaleband 316 99.8 95.6 Least threatened
TOTAL 90 587 37.1 21.9
Table 1: Percentage of historical vegatation remaining16
* Indicates vegetation types that have insufficient
habitat remaining to meet minimum national targets.
Italicized and bolded vegetation types are endemic to
Cape Town and can only be conserved within the
city area.
17Map 3: Historical distribution of indigenous vegetation in Cape Town17
18
alia%20GIS%20Maps/ERM/State%20of%20Environment%20Reports/20171025_SOER_HistoricExtentOfVegeMap 4: Current extent of indigenous vegetation in Cape Town18
19Map 5: Ecosystem status of indigenous vegetation in Cape Town19
20Key management responses The Atlantis revitalisation scheme
The City runs a number of programmes to promote the In May 2013 Council approved the Atlantis Industrial
sustainable conservation of fauna and flora, with a key Incentive Scheme, which includes biodiversity off-sets
focus on job creation and enhancing social benefits. Some in the targeted area. Over 906 hectares of vacant land
key management responses helping to achieve the City’s in Atlantis contains critically endangered Atlantis Sand
BioNet targets are outlined below. Fynbos and/or endangered Cape Flats Dune Strandveld
vegetation and numerous plant species of conservation
Dassenberg Coastal Catchment Partnership significance. The mitigation for the loss of this biodiversity
requires the identification of an off-set area or financial
The Dassenberg Coastal Catchment Partnership (DCCP)
contribution to biodiversity conservation and is therefore
is a multi-stakeholder landscape initiative. The area is a
an additional cost and deterrent to investment in Atlantis.
conservation priority for CapeNature (highlighted on the
By proactively purchasing and conserving key biodiversity
Provincial Protected Area Expansion Strategy) and was
properties outside the urban edge within the DCCP, these
identified as a critical Climate Change Adaptation and
conservation gains can be used to proactively mitigate
Mitigation Corridor in the 2010 WWF-Table Mountain
the loss of biodiversity remnants within the urban edge
Fund study20. It is included in the BioNet and is also
and industrial area of Atlantis, thereby facilitating new
acknowledged as a conservation area on the City’s Spatial investment opportunities in Atlantis.
Development Framework. The DCCP is prioritised on the
basis of having extremely high biodiversity value, with some This scheme is supported by the provincial Department
of the most extensive critically endangered lowland habitat of Environmental Affairs and Development Planning,
within Cape Town. It comprises the last relatively intact which is the competent authority to process applications
and ecologically functional area of critically endangered for Environmental Authorisation. This approach facilitates
and poorly protected Atlantis Sand Fynbos, and includes development while ensuring priority land is added to the
critically endangered Swartland Shale Renosterveld, DCCP conservation estate, securing biodiversity resources
Swartland Granite Renosterveld, Swartland Silcrete and the vital ecosystem services they deliver.
Renosterveld and endangered Cape Flats Dune Strandveld
habitat. Protected Area Reviews and the METT-SA audits of
Nature Reserves managed by the City
The area is also important for Cape Town’s water security as
it contains the Witzands Aquifer protection zone. It is also A robust evaluation and audit system is crucial to ensure
an excellent locality for skills development projects and effective management of areas designated for biodiversity
economic development opportunities. The clearing of alien conservation in protected areas such as nature reserves.
vegetation alone can create numerous job opportunities. The Management Effectiveness Tracking Tool (METT) was
Not only is this an important biodiversity intervention, but developed by the International Union for Conservation of
clearing alien vegetation will also enhance the productivity Nature (IUCN) as a mechanism to facilitate standardised
of the aquifer. Recreation and tourism activities, such evaluation of the management of protected areas
as Mamre Heritage and the Wild Flower Show, can be internationally. The use of this tool is now mandatory
expanded, leading to further recreation and tourism in projects where the World Bank, World Wildlife Fund
opportunities, such as game-viewing, following the possible (WWF) and Global Environment Fund (GEF) are funders.
reintroduction of Eland and Red Hartebeest. It was adapted for use in the local context and named
the METT-SA. The purpose of the tool is to identify
The initiative aims to identify opportunities to secure formal interventions required to ensure management effectiveness
conservation protection for all the land parcels identified to international standards and to identify ‘next steps’ for
within the project area. The ultimate goal is to proclaim aspects of underperformance. The application of this tool
all conservation-worthy land in terms of the National is not to compare performance of different sites with each
Environmental Management Protected Areas Act (No. 57 of other, but rather to allow organisations to track progress at
2003). each conserved area over time.
21The first METT-SA audit of the City’s Nature Reserves
was conducted in 2007. This highlighted the need to
set lower-level targets for the reserves, many of which
were newly proclaimed and managed according to
conservation principles. To facilitate identification of steps
towards reaching METT standards, an assessment tool, the
Protected Area Review (or PA Review,) was designed to be
conducted at each nature reserve annually to break these
steps up into achievable targets.
The City conducted METT-SA audits in 2007 and 2012,
and has conducted the PA Review every year since 2007,
showing gradual improvement in scores with an increase
from 49% in 2007 to 76% in 2016. Comparison between
2007 and 2012 METT-SA overall scores for the City’s
Nature Reserves shows an increase from 40% in 2007 to
51% in 2012. The next METT-SA audit was scheduled for
August 2017.
Trend and target
Trend: More land is being proclaimed, but biodiversity
remains under threat
Target: 65% of the BioNet conserved by 2019
Current: 64% of the Biodiversity Network
is formally conserved
Policy linkages
IDP: Strategic Focus Area 1 – The Opportunity City
Environmental Agenda 2009 – 2014: Target 1 – Biodiversity
City of Cape Town Bioregional Plan: 65% Target for 2019
Local Biodiversity and Action (LAB) programme: Local
Biodiversity Action Plan (LBSAP) 2009 – 2019.
Sustainable Development Goal (SDG) 15: Life on Land
See also: Chapters on Invasive Alien Species and Natural
Public Green Spaces.
22CHAPTER 2:
INVASIVE ALIEN
SPECIES
23Understanding invasive alien species Plants and animals that are introduced become a problem
in Cape Town if they dramatically increase in numbers, outcompete
indigenous species or alter the environmental conditions
to the detriment of the local biota. Invasive species
generally reproduce rapidly, spreading and invading local
Indicators: ecosystems. This may hold serious implications for water
• Extent of invasive species in the city. yields, rangeland productivity, biodiversity and associated
tourism, human health, and fire safety22.
• Effectiveness of invasive species
clearing operations.
Cape Town experiences a number of problems caused by
• Number of jobs created as a result of the presence of invasive species. These include:
invasive species clearing programmes.
• Loss of habitat and indigenous species due to being
crowded out by invasive species.
For the purposes of this report invasive species are • Fire risk, as invasive plants often burn much hotter and
defined as those species that are “non-native (alien) to for longer periods of time than indigenous plants.
the ecosystem under consideration, whose introduction
• Water loss in an already water-scarce city, as invasive
causes or has the potential to cause harm to the economy,
trees and shrubs use a significantly larger amount of
environment or human health”21. Invasive species may be
water than indigenous plants.
plants, animals or other organisms.
• Alteration in nutrient content of soils by invasive
Invasion by alien species is one result of globalisation, a species with negative effects on the indigenous
process that allows for the easy movement of people and ecosystem.
goods around the world. Species often arrive at different
destinations accidentally, although many exotic species are Invasive alien species
intentionally introduced into gardens or native ecosystems Many different types of species, both plant and animal, are
for various purposes. If the introduced species is able to deemed to be invasive in Cape Town. National guidelines
adapt to the climatic and environmental conditions in their set by the National Environmental Management:
new destination they have the potential to naturalise and Biodiversity Act (NEMBA) categorises
become invasive, especially if they are free from pests and the status of invasive species. The City of Cape Town
parasites in their introduced environment. However, it is adheres to these categories and addresses them as
important to note that not all introduced species become part of their environmental management responsibilities.
invasive; only a small percentage become a problem in The categories set out by NEMBA and their management
their new destination. actions are outlined in Table 2.
NEMBA Categories Legislated/required management action
Invasive species in this category must be combatted and eradicated. Any form of trade
Category 1a
or planting is strictly prohibited.
Invasive species in this category must be controlled and whenever possible removed
Category 1b
and destroyed. Any form trade or planting is strictly prohibited.
Invasive species in this category require a permit to carry out a restricted activity.
Category 2 Species covered in this category include commercially important species such as certain pine,
wattle and gum species used in forestry.
Invasive species in this category may remain in prescribed areas or provinces.
Category 3 Further planting, propagation or trade is prohibited. Plants in riparian areas are however classified
as Category 1d and must be controlled.
Table 2: NEMBA Categories
24Some of the most prevalent and problematic invasive species in Cape Town and their associated NEMBA categories are
outlined in Table 3.
Name Description NEMBA Category
Invasive alien plants and trees
Black Wattle Tree native to Australia. It grows rapidly, crowding Category 2
(Acacia mearnsii) out indigenous vegetation, increasing fire severity
and depleting water sources.
Port Jackson An Australian shrub/tree introduced in the mid-19th Category 1b
(Acacia saligna) century to stabilise sand dunes. It grows rapidly,
crowding out indigenous vegetation, increases fire
severity and uses large amounts of water.
Pine (Pinus spp.) A fast-growing coniferous tree that invades fynbos Category 2 for plantations and
and Renosterveld areas. It also increases fire risk wind-rows and Category 1b elsewhere
and severity. Uses significantly more water than
native fynbos vegetation.
Gum These Australian trees grow rapidly, are highly NEMBA Category 1b in riparian areas,
(Eucalyptus spp.) flammable increasing both fire risk and severity, protected areas and fynbos. NEMBA
and use significantly more water than native Category 2 for plantations, woodlots,
fynbos vegetation bee-forage areas, wind-rows
and the lining of avenues.
Table 3: Most problematic invasive tree species in Cape Town
Methods of control Terrestrial invasive plants
In response to threats posed by invasive species the City The Cape Town Terrestrial Invasives Project uses the
of Cape Town has implemented a variety of projects to following control methods, generally referred to as
combat terrestrial and aquatic plants, new and emerging ‘integrated control’:
invasive plant species, and invasive animals. • Mechanical – using chainsaws or other machines to fell
and cut down invader plants.
• Manual – hand-pulling of seedlings or cutting down
The Cape Town Biological Control Programme
smaller plants with hand tools.
introduces the plant’s natural enemies to reduce the
invasive plant’s competitive edge. Using biocontrol • Herbicides – application of registered herbicides by
methods is cost effective and environmentally friendly. suitably qualified herbicide applicators.
This programme has been successful in tackling • Biological control (biocontrol) – using natural enemies,
invasive water weeds, creating jobs for people including insects, mites, and plant pathogens.
with special needs, and improving environmental • Fire – either by burning an entire area or by burning
awareness with school children. stacks after an initial clearing to reduce fuel loads.
More information can be found on the
Cape Town Green Map.
25Aquatic weeds State of the environment
The City implements a long-term control programme to There are 137 listed invasive alien plant species, including
combat the problem of aquatic weeds using a combination weedy plants and trees across the 16 protected areas
of different control methods: managed by the City, of which 11 are Category 1a, 102
are Category 1b, 13 are Category 2 and 11 are Category
• Manual control – deployment of trained aquatic weed
3. In addition, the City also controls approximately 93
teams to manually remove aquatic weeds.
other species that are not listed as invasive alien species
• Mechanical control – involves the use of heavy but which have invasive traits. These are controlled as
machinery such as long-boom excavators. part of area-based alien vegetation clearance or as part
• Chemical control – involves the use of registered of the EDRR programme. It is estimated that nearly 4 000
herbicides. hectares of protected areas in Cape Town are alien-free,
• Biological control – the introduction of the plant’s while 2 842 hectares have extensive or dominant invasive
natural enemies to its new habitat. alien vegetation cover. About 3 000 hectares of habitat still
need to be assessed in detail. The extent of invasive alien
Invasive animals vegetation in protected areas is indicated in Map 6.
The City runs programmes that monitor, track, and where
Operations to control invasive alien species have had
possible eradicate listed invasive animal species. Illegal
some notable successes, as indicated in Table 4. The
pet trading and the introduction of invasive alien animals
effectiveness of control methods is measured in terms
are addressed in specific programmes. Each species has
of the density of the alien plants remaining after a
an existing specific control programme or one that is still
clearing intervention. If there was a high level of success
to be developed.
the method would score as ‘highly effective’ or a ‘4’ in
Early Detection and Rapid Response programme Table 4. An assessment undertaken in 2016 found that
interventions for 24 of the 29 assessed-species have
The first line of defence is to prevent the introduction of reduced the abundance and impact of the alien species,
invasive species, but this is not always possible. The second while only one species intervention has had no impact and
line of defence is to eradicate recently established invasive four species have not been assessed or no intervention has
species, under the Early Detection and Rapid Response taken place.
(EDRR) programme of the City’s Invasive Species Unit. The
EDRR aims to eradicate or contain invasive species before As indicated in Table 4, control of the Nymphaea mexicana
they become too widespread, in which case extirpation (Yellow water lily) has an effectiveness rating of ‘2’. There
measures (the complete removal) become technically has been no significant impact on this invasive species
and financially impossible. The City recognises that the using manual and chemical control methods. The inability
costs associated with the EDRR management efforts are to control this species highlights its rapid ability to spread
significantly lower than if these species were not tackled by quickly covering water surfaces with large flat leaves.
and long-term invasive species management programmes The rapid spread of this species reduces water movement
were later required. and displaces other submerged aquatic plants as well as
depriving water bodies of oxygen23.
The EDRR programme currently prioritises 28 plant and
animal species that can potentially be eradicated in Cape
Town (click here). Cape Town residents can contribute
to managing invasive species and report sightings of
target plants. Members of the public are encouraged to
inform the Invasive Species Unit if any of their targeted
species are spotted via the Spotter Network. Residents can
become spotters by signing up to the Spotters Network on
the Cape Town Invasives website. More information about
the EDRR can be found here.
26Legend
Invasive Alien Vegetation
Density class
0
0-1
1-5
5-25
25-50
50-75
75-95
95-100
±
10
Kilometers
Map 6: The extent of invasive alien vegetation in the City of Cape Town nature reserves
27Species NEMBA Category Method Ef fectiveness
Acacia elata 1b manual, chemical, mechanical 4
Acacia paradoxa 1a manual, chemical, mechanical 4
Ailanthus altissima 1b manual, chemical, mechanical 4
Anredera cordifolia 1b manual, chemical 4
Bryophyllum delagoense 1b manual 4
Campuloclinum macrocephalum 1b manual, chemical 4
Cardiospermum grandiflorum 1b manual, chemical 4
Centranthus ruber 1b manual, chemical 4
Cortaderia selloana 1b manual, chemical 4
Eichornia crassipes 1b biological 4
Eucalyptus conferruminata 1b manual, chemical, mechanical 4
Genista monspessulana 1a manual 4
Hakea drupacea 1b manual 4
Iris pseudocorus 1a manual 4
Lythrum salicaria 1a manual 4
Melaleuca hypericifolia 1a manual, chemical, mechanical 4
Myriophyllum aquaticum 1b biological 4
Nymphaea mexicana 1b manual, chemical 2
Pennisetum setaceum 1b manual, chemical 4
Pistia stratiotes 1b biological 4
Pittosporum undulatum 1b manual, chemical, mechanical 4
Rivina humilis 1b manual 4
Salvinia molesta 1b biological 4
Spartium junceum 1b manual, chemical 4
Verbesina encelioides NL manual 4
Table 4: Alien species assessed for clearing methods in Cape Town:
(2) Effectiveness: intervention has no discernible impact.
(4) Effectiveness: Interventions are reducing the abundance and impact of alien species.
28Key management responses • Build small restoration works in rivers, such as gabions
and erosion-prevention measures in rivers.
The Kader Asmal Integrated River Catchment Project
• Create a skills development programme with the
In addition to day-to-day invasive species clearing aim of establishing area teams (green wardens)
operations and the EDRR programme, the City of Cape consisting of a supervisor, skilled and unskilled
Town has established the Kader Asmal Integrated River labourers. The team has a variety of different
Catchment Project. This project is integral to the clearing skills, with chainsaw operators, herbicide applicators,
of invasive species through skills development, green re-vegetation and general labour skills.
job creation, and environmental education. The project
• Work with communities to roll out a river
was established by Mayor Patricia de Lille to honour
warden system.
the late Kader Asmal, a former Minister of Water Affairs
who was passionate about creating jobs and conserving Trend and target
water and who established the Working for Water (WFW)
programme. Trend: Invasive alien plant and animal species are a
significant threat to Cape Town’s biodiversity,
As an inter-departmental, multi-stakeholder initiative, and reduce the quality of natural green spaces.
the Kader Asmal project aims to contribute to a healthy
and sustainable natural environment for the benefit of Target: Environmental Agenda 2014 Target: 60% of
all in Cape Town. This is achieved by uplifting communities protected areas and biodiversity network to be
through developing skills and capacity, cleared and under maintenance; populations of
as well as creating job and small business opportunities in significant animal invaders to be eliminated.
the ecosystem service sector. The programme achieved
its objectives through facilitating inter-departmental Current: It is estimated that nearly 4 000 hectares of
collaboration in implementing and managing job creation protected areas are alien free, 2 842 hectares
projects. have extensive or dominant invasive alien
vegetation cover and 3 000 hectares of habitat
During the 2015/16 financial year, 2 305 work still needs to be assessed in detail.
opportunities were created for people indirectly employed
by skilled small, medium and micro-sized enterprises Policy and linkages
(SMMEs). This equates to a total of 620 IDP: Strategic Focus Area – The Opportunity City
full-time equivalents.
Framework for a Strategy and Action Plan for the
The objectives of the programme are to: Management of Invasive Species in the CCT (2008)
• Control invasive alien species through labour-intensive Environmental Agenda 2009 – 2014: Target 2 – Alien
methods. Invasive Species
• Restore biodiversity by propagating indigenous plants
and re-vegetating cleared areas. City of Cape Town Bioregional Plan (2015): Invasive
Species Management (ISM)
• Mass-rear biological control insects, helping create job
opportunities for physically challenged individuals. SDG 15: Life on Land
• Improve infrastructure, such as footpaths and board
walks, in nature reserves. See also: Chapter on Biodiversity.
29CHAPTER 3:
NATURAL PUBLIC
GREEN SPACE
30Understanding natural public green space The City’s Urban Design Policy, approved in 2013,
envisions intentionally creating open space that is scaled
in Cape Town
and configured to suit the functions for which it is planned.
The functionality of space also includes combining open-
Indicators: space uses, such as sustainable urban drainage systems
(SUDS), playgrounds, and allotment gardens, to use space
• Average distance to travel to natural
more effectively and increase accessibility to all facilities26.
public green space
Through policies such as the SDF and the Urban Design
Universal access to safe, inclusive and accessible green Policy, the City aims to incorporate public green spaces
and public spaces by 2030 is a target contained within the into urban environments through parks, open spaces,
United Nations Sustainable Development Goal 1125: Make playing fields, walkways, greenbelts, nature reserves and
cities inclusive, safe, resilient and sustainable. urban gardens. This access to public green space is a key
measure of a healthy city.
The City of Cape Town has also recognised the
importance of incorporating green spaces into the urban This report notes that that not all green spaces perform the
environment for a number of reasons. Socially, public same functions. Public green space is land that consists of
green spaces provide residents with opportunities for a variety of formally managed land types, including nature
nature-based recreational activities, such as walking, reserves and large district parks that are able to support a
hiking, picnicking, bird watching and boating (among range of biodiversity, greenbelts and river corridors, and
others), while also providing for spiritual, aesthetic and smaller parks that do not have a significant biodiversity
educational needs, and meeting the needs of children to function but which provide recreational space. Managed
have an open and well-managed environment in which public green space will generally have some measure of
to play. Environmentally, these spaces allow for both the basic facilities, such as toilets, picnic spots, parking areas,
conservation of biodiversity and the provision of various on-site staff, or security measures, and will generally be
other ecological goods and services. Economically, the maintained. Although unmanaged areas provide important
significance of these spaces is in sustaining Cape Town as ecological goods and services, these areas do not always
an attractive tourism and investment destination. provide the same level of service in terms of meeting
recreational and social needs and can be identified as
The importance of public green space is reflected in undeveloped public open space. This chapter focuses on
various City planning documents. The City’s Spatial managed public green space.
Development Framework (SDF) prioritises the conservation
of biodiversity and green space within the urban fabric and Managed public green space can also be categorised in
recognises it as a vital informant of the future development two further ways: natural and semi-natural. Natural public
of the city. The SDF specifies that the City’s Biodiversity green space includes protected areas that are managed as
Network and targets need to be taken into account in nature reserves by the City, provincial and national govern-
future planning and underpins the incorporation of green ment and private entities, greenbelts and less-developed
spaces. parts of the coastline. Semi-natural public green spaces
include community parks, district parks and more-devel-
oped parts of the coastline. This report focuses on natural
public green space.
31You can also read