The Decline of England's Bees - Policy Review and Recommendations - Tom D. Breeze, Stuart P.M. Roberts and Simon G. Potts 4/29/2012
←
→
Page content transcription
If your browser does not render page correctly, please read the page content below
The Decline of England’s Bees
               Policy Review and Recommendations

                          Tom D. Breeze, Stuart P.M.
                         Roberts and Simon G. Potts
                                         4/29/2012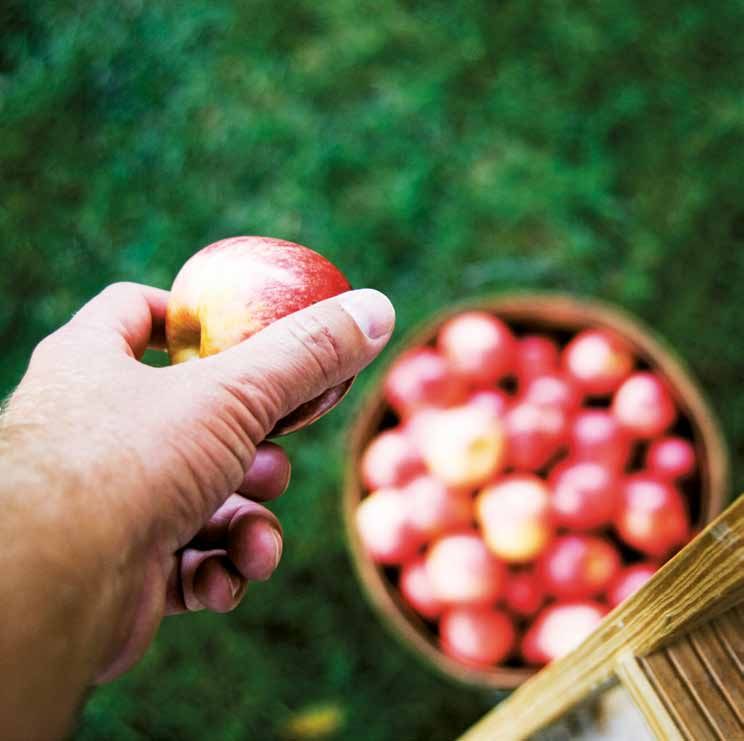
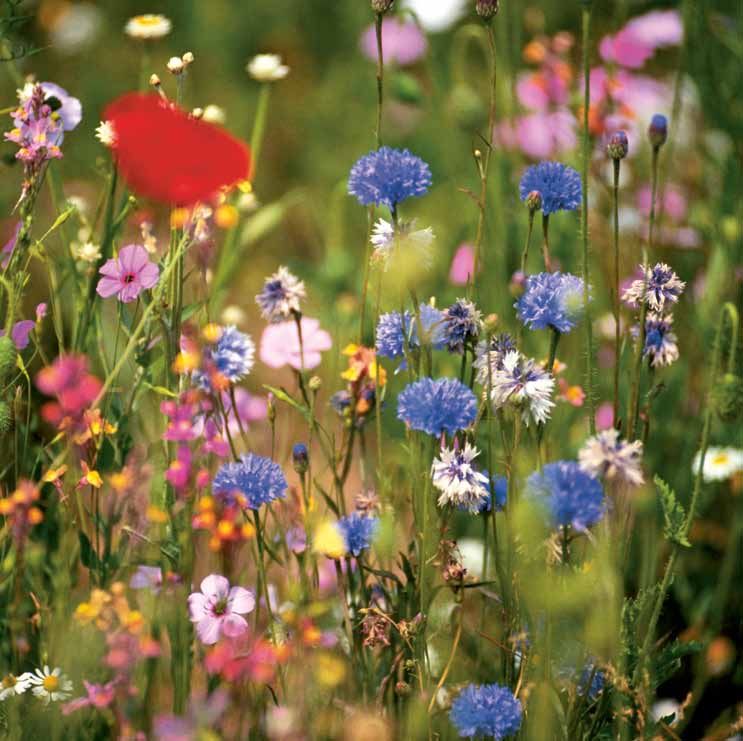
Danny Perez
Honey Bee (Apis mellifera) visiting a garden plant, Californian poppy (Escholtzia sp.)

2                                                                                        The Decline of England’s Bees
Acknowledgements

T
          is study was undertaken by the University of Reading Centre
         h
         for Agri-Environment Research on commission from Friends of
         the Earth England, Wales and Northern Ireland (EWNI). The
         authors wish to thank three anonymous referees for their
         comments and input upon the final manuscript and several
         anonymous staff at Natural England, FERA and DEFRA for their
         contributions to shaping the language of the recommendations.
         The views expressed within this report are those of the Centre
         for Agri-Environment Research and may not reflect those of
         Friends of the Earth England, Wales and Northern Ireland (EWNI).
         Although many of the policies referred to in this document affect
         the whole of the UK, it should be noted that it was not possible to
         consider specific national policies beyond England at this stage.
         All recommendations have been established on the basis of their
         observed or likely benefits to bees only and do not consider other
         species, although to the authors’ knowledge none is likely to have
         a negative impact upon other aspects of biodiversity. The authors
         declare no conflict of interest.

The Decline of England’s Bees                                                  3
Glossary of Abbreviations

AES: Agri-Environment Schemes                    JNCC: Joint Nature Conservancy Council

AONB: Areas of Outstanding Natural Beauty        LNP: Local Nature Partnership

BARS: Biodiversity Action Reporting System       MRL: Maximum Residue Levels

CAP: The European Union’s Common                 NBU: National Bee Unit
Agricultural Policy
                                                 NERC S41: Section 41 of the Natural Environment
CFE: Campaign for the Farmed Environment         and Rural Communities Act 2006

DEFRA: Department for Environment Food           NIA: Nature Improvement Areas
and Rural Affairs
                                                 NPPF: National Policy Planning Framework
EBS: The New England Biodiversity Strategy
                                                 OELS: Organic Entry Level Stewardship
EC: The European Commission
                                                 POST: Parliamentary Office of Science
EFA: Ecological Focus Areas                      and Technology

EFSA: European Food Safety Agency                PPP: Plant Protection Product (inc. Pesticides)

EIA: Environmental Impact Assessment             RPA: The Rural Payments Agency

ELS: Entry Level Stewardship                     RSPB: Royal Society for the Protection of Birds

ETIP: Entry Level Stewardship Training and       RSS: Regional Spatial Strategy
Information Programme
                                                 SAC: Special Areas of Conservation
EU: The European Union
                                                 SFS: Small Farmer Scheme
FERA: Food and Environment Research Agency
                                                 SPA: Special Protection Areas
GI: Green Infrastructure
                                                 SSSI: Sites of Special Scientific Interest
GM: Genetically Modified
                                                 UK: The United Kingdom, comprising England,
Ha: Hectares, a unit of land area equivalent     Wales, Scotland and Northern Ireland.
to 100m x 100m
                                                 UKBAP: The UK Biodiversity Action Plan
IBDA: Integrated Biodiversity Delivery Areas
                                                 UELS: Upland Entry Level Stewardship
IUCN: International Union for the Conservation
of Nature                                        UN: The United Nations

HGCA: Home Grown Cereals Authority               VMD: Veterinary Medicines Directorate

HLS: Higher Level Stewardship                    WTO: World Trade Organisation

HSE: Health and Safety Executive

4                                                                                                  The Decline of England’s Bees
Executive Summary

B
       ees are a vital component in ecological           4. Habitat Conservation
       networks and provide significant social           Many habitats of national conservation priority
       and economic benefits to humans through           provide important forage and nesting resources for
crop pollination and maintaining the character of        bees, however, despite protected designations, many
the landscape. Despite their importance, both to         are still in decline. The report recommends that
people and the natural environment, unsustainable        protection for these sites should be strengthened
agriculture, diseases and habitat degradation have       by designating more sites with priority habitats for
placed significant pressures on many species of          bees, reforming Environmental Impact Assessment
bees, causing widespread declines. In conjunction        regulations and improving cross-policy co-ordination
with the scientific literature this report reviews       to deliver the strongest benefits to bees over the
seven areas of current and proposed government           whole landscape.
policy in England (Agricultural Production,
Agrochemicals, Agri-Environment Schemes, Habitat         5. Planning
Conservation, Planning, Species Conservation and         Despite the importance of bees to the economy and
Bee Health) to identify areas where these policies       human wellbeing, new planning guidelines do not
can affect bees.                                         provide detailed information for local authorities to
                                                         develop green infrastructure that can significantly
1. Agricultural Production                               benefit bees, such as allotments and flower-rich
Agriculture is the largest land use in the UK and can    road verges. The report recommends that new
have a significant impact upon bees by affecting the     guidelines are made available to local authorities
quality and diversity of habitat within the landscape.   that better integrate these beneficial options
The report recommends that the UK government             and that environmental damage regulations are
takes opportunities to further “green” farming in        strengthened to reduce the negative impacts of
the UK and provide much needed support to Fruit          development on bee habitats.
and Vegetable growers and environmentally friendly
farming systems such as agroforestry. This should        6. Species Conservation
be accompanied by supporting research into the           Although several bee species are recognised
pollination requirements of crops, with information      as national conservation priorities, as a group,
disseminated to farmers to reduce risks.                 bees have received little formal monitoring and
                                                         conservation effort. The report recommends that
2. Agrochemicals                                         bees should be included as a priority species group
Even when correctly applied pesticides can have          in the new England Biodiversity Strategy and that a
adverse impacts upon bees by reducing their              network of experts should be established to advise
breeding success and resistance to disease, and by       local authorities on developing bee-targeted action
reducing the availability of valuable forage plants.     plans.
The report recommends that the government should
commit to a targeted reduction in pesticide use by       7. Bee Health
2020. This should be accompanied by substantially        Policy on bee health has been largely effective but
improving pesticide labelling and accreditation          is limited by unnecessary restrictions on veterinary
regulations to mandate detailed assessments of the       medicine products and does not sufficiently
impacts upon all bees, not just honeybees.               recognise wild bee health. The report recommends
                                                         that restrictions on veterinary medicines for bees
3. Agri-Environment Schemes                              should be lifted and that beekeeper registration
Agri-Environment Schemes have great potential            should be mandatory. New policy should also be
to provide forage and nesting sites to bees but          developed to curb the spread of disease between
the uptake of the most beneficial options has            wild and managed bees.
been limited. The report recommends that greater
support is given to Natural England and industry
efforts to improve the uptake of these options
and develop more targeted objectives for Agri-
Environment Schemes.

The Decline of England’s Bees                                                                                    5
SECTION 1

Why are Bees Important?

T
       he UK is presently home to some 267                      mass-flowering oilseed rape (Rader et al, 2009),
       species of bees ranging from the widely                  other species can be more effective at pollinating
       recognised honeybee (Apis mellifera)                     other crops. For instance mason bees (Osmia sp)
and bumblebees which live in social colonies                    are more effective pollinators of apple (Thomson
with a single reproductive queen to over 220                    and Goodall, 2001) and honeybees are ineffective
species of solitary bees that live alone in small               at pollinating tomatoes which require larger bodied
nests in bare soil, masonry or wood. Bees                       bumblebees to “buzz-pollinate” them by vibrating
have great intrinsic value to people across                     the flowers to release pollen (Delaplane and Mayer,
the UK and were widely regarded as a key                        2000). Long-tongued bees are also essential
symbol of the natural world by respondents                      pollinators of field beans as other bees cannot
in a recent survey of attitudes towards nature                  access their deep nectaries without biting into the
conducted by DEFRA (2011a). Due to their                        side of the flower first, allowing them to feed but
diverse life cycles, exclusive diet of pollen and               not providing pollination to the flower (Free, 1993).
nectar and specialised morphology, bees are                     However, for some crops, such as strawberry, a
considered the primary providers of pollination                 combination of wild and managed bees is needed
services 1 for most insect-pollinated crops                     to produce fruits of market quality (Chagnon et
and wildflowers within the UK. Pollination by                   al, 1993). Insect-pollinated crops are also major
insects is thought to be the main reproductive                  sources of vitamins A and C and minerals such as
mechanism in 78% of temperate flowering                         Calcium and Fluoride (Eilers et al, 2011) and yields
plants and is essential to maintaining plant                    of over 20 crops within the UK are increased by
genetic diversity (Ollerton et al, 2011). Declines              pollination services (Klein et al, 2007; Free, 1993).
in wild bees have been closely associated with                  In 2009, these crops covered 19% (0.8m ha) of UK
similar declines in these plants (Beismeijer et                 crop area and represented 24% (£1.27bn) of total
al, 2006; Carvell et al, 2006). These plants, such              UK crop sales (calculated from DEFRA 2011a,b
as bluebells or poppies, can have aesthetic                     using the methods of Breeze et al, 2011). Of this,
importance to people by improving the overall                   some £510m of total crop sales value is thought to
look of the landscape, gardens and other green                  directly arise from pollination services as of 2009
spaces from parks to road verges (Willis and                    (Table 1.1), a rise of £80m from 2007 due to the
Garrod, 1993; Akbar et al, 2003; Lindemann-                     growing farmgate prices of strawberries, apples
Matthies et al, 2009). Insect-pollinated plants                 and oilseed rape (DEFRA, 2011b,c). By contrast, to
and their fruits or seeds are also important to                 replace pollination services provided by bees with
wider biodiversity, providing food, shelter and                 hand pollination could cost farmers around £1.8bn/
other resources to mammals, birds and other                     year in labour and pollen alone (Breeze, 2012 –
insects. For instance hawthorn (Crataegus spp.)                 Chapter 4). The majority of the benefits to crop
is an important forage plant for many of the                    production are found within England, particularly
UKs farmland birds (Jacobs et al, 2009). On a                   the southern and eastern regions where high-value
longer time-scale, pollination can also affect the              fruit crops and large areas of oilseed rape are grown
spread of rare habitats such as heathland which                 (Table 1.2). By maintaining yields, these pollination
has unique biodiversity, cultural and economic                  services also allow supply to better meet demand,
value itself (Wessel et al, 2004).                              stabilising prices to consumers in the process (Gallai
    Pollination by bees is an important component               et al, 2009). In the absence of bees, the farmgate
of UK food security and several species of bees,                price of British Apples for example would double
including honeybees and the buff-tailed bumblebee               (Marris et al, 2008). Pollination by bees can also
(Bombus terrestris) are commercially reared                     improve the market quality (Chagnon et al, 1993),
specifically to provide pollination to crops such as            taste (Hogendoorn et al, 2010) and nutrient profile
apples, strawberries, tomatoes and oilseed rape                 of crops (Volz et al, 1996; Bommarco et al, 2012)
(Delaplane and Mayer, 2000). Although honeybees                 and maintain genetic diversity necessary for
are effective pollinators of most crops, particularly           fighting disease (Somerville et al, 1999). Beyond
                                                                crops, bees also pollinate clovers and other nitrogen
1   Pollination Services represent the enhancement of any
                                                                fixing plants that are important to improving the
    benefits derived from plants which reproduce by insect      productivity of pasture systems for livestock grazing
    pollination. See the Smith et al (2011) for more details.   which are themselves major agricultural enterprises

6                                                                                                                        The Decline of England’s Bees
Table 1.1. Crop dependencies on pollinators and annual
                                                                 value of pollination in 2009
                                                                 Source: DEFRA (2011a,b; Smith et al, 2011)

                                                                 Crop                          Dependence on                Value Per Annum
                                                                                               Pollinators (%)              (£ millions) 2009
                                                                 Oilseed Rape                  25                           117
                                                                 Strawberries                  45                           109

in Wales, the Highlands and northern and western                 Dessert Apples                85                           53
parts of England. The economic benefits of this are              Culinary Apples               85                           39
presently unknown but likely to be high.
     The demands for pollination by bees to crop                 Raspberries                   45                           49
markets across England are likely to grow in the
                                                                 Cucumbers                     65                           28
near future as more oilseed rape is planted to
supply biofuel (Arnoult et al, 2010) and demands                 Tomatoes                      25                           22
for locally-grown produce (Brown et al, 2009) and
new crops, such as blueberries and borage, continue
                                                                 Runner Beans                  85                           12
to grow (Nix, 2011). Furthermore, trials in North                Plums                         65                           7
America have demonstrated that managed bees are
able to provide additional benefits to crop producers            Pears                         65                           7
by helping transmit diseases which infect crop pests,            Other                         5-85                         68
thereby reducing the need for pesticides (Kevan et
al, 2008). In towns and urban areas, bees can also                Total                                                     Approx. 510
provide pollination services to fruits and vegetables
grown in gardens and allotments (Ahrne, 2008).                   Table 1.2: Value of Pollination Services to Crop Production
Allotments are increasingly in demand within urban
                                                                 in different Regions of the UK in 2009
England, with waiting lists rising dramatically from
                                                                 Source: Calculated from June census data from England, Scotland and Northern Ireland.
4.9 persons/plot in 2009 to 5.7 persons/plot in 2011             No data on the area of Insect-pollinated crops is available for Wales as the total grown
(Campbell and Campbell, 2011).                                   is too small to be reported anonymously

                                                                                                    Value of Insect-         % of total
                                                                 Region                             pollinated
                                                                                                    Production
                                                                 North West                         £9.5m                    1.8%
                                                                 North East                         £8.5m                    1.6%
                                                                 Yorkshire & The Humber             £31.8m                   6.2%
                                                                 West Midlands                      £70.1m                   13.8%
                                                                 East Midlands                      £49.8m                   9.8%

Bumblebee (Bombus sp)                                            Eastern                            £88.0m                   17.2%
                                                                 South East                         £137.4m                  26.9%
                                                                 South West                         £38.0m                   7.4%
                                                                 England                            £433m                    84.9%
                                                                 NW Scotland                        £2.0m                    0.04%
                                                                 NE Scotland                        £9.8m                    1.9%
                                                                 SW Scotland                        £3.8m                    0.07%
                                                                 SE Scotland                        £43.9m                   8.6%
                                                                 Scotland                           £59.4m                   11.6%
                                                                 Wales                              NA                       NA
                                                 Amelia Colins

                                                                 N. Ireland                         £17.7m                   3.4%
                                                                 UK Total                           £510.2m

The Decline of England’s Bees                                                                                                                          7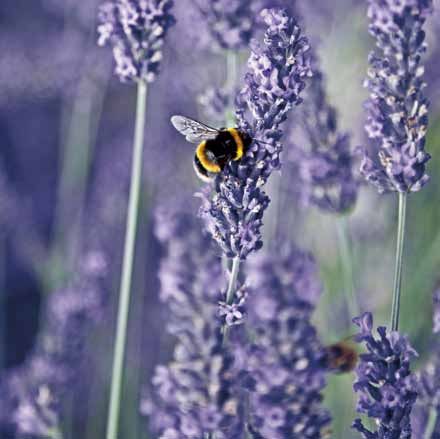
SECTION 2

Bee Declines

2.1. The Decline of English Bees                         throughout the year (Kuussaari et al, 2011; Brittan
In recent years, research has demonstrated               et al, 2010a; Feon et al, 2010; Williams et al, 2010).
substantial declines in many species of bees within      By expanding fields, increasing chemical inputs and
the UK. In particular, the number of managed             ceasing traditional management, many previously
honeybee colonies in the UK fell by 53% between          common, semi-natural habitats that are important
1985 and 2005 (Potts et al, 2010a) and wild              for bees have become increasingly rare within the
honeybees are thought be nearly extinct throughout       British countryside. For example, species-rich hay
the British Isles (Carreck, 2008) although their         meadows, once a common means to provide hay
true status remains unknown. Other studies have          for livestock fodder over the winter period, have
demonstrated significant contraction in the ranges       declined by 97% since the 1930’s as producers moved
of many species of wild bumblebees (Goulson et           towards silage production (Fuller, 1987). Similarly
al, 2008) and solitary bee diversity has declined in     increased use of fertilisers has reduced the area of
52% of English landscapes assessed by Beismeijer         nutrient poor soil, reducing the area of species-rich
et al, (2006).England’s Natural Environment and          bee habitats that require poor soil such as calcareous
Rural Communities Section 41 (NERC S41) list of          grassland (Henle et al, 2008). Such semi-natural
priority species includes 17 wild bees, most of them     habitat losses have resulted in substantial declines
solitary bees, as targets for potential conservation     in the presence of many bumblebee forage plant
action (Natural England, 2010a), as most efforts         species throughout England (Carvell et al, 2006).
have thus far been focused on gathering detailed         This can be very detrimental to species that have
ecological and distributional data into these species    narrow foraging preferences, such as the NERC S41
(e.g. Hymettus, 2011). However, since 1900 only two      listed Shrill Carder Bee (Bombus sylvarum) (Connop
species of bumblebee have become extinct and             et al, 2010). Many of England’s hedges, which act
some of the most common bumblebee species have           as important corridors for wild bees to move safely
become more widespread across England (Edwards           between feeding and nesting sites (Hannon and
and Broad, 2005; Edwards and Roy, 2007), although        Sisk, 2009), have also continued to decline in total
due to a lack of monitoring schemes, the abundance       extent (Countryside Survey, 2009). Subsequently, bee
of these species remains unknown. In general,            populations, particularly solitary bees, can become
solitary bees, species with more specialised feeding     isolated and unable to access sufficient nesting or
and nesting habits and those with a low capacity to      forage resources, a particular problem for smaller
disperse between habitats, typically smaller-bodied      solitary bees with limited capacity to disperse
species, are thought to be the most vulnerable           (Williams et al, 2010). Such isolated populations may
(Williams et al, 2010, 2007; Goulson et al, 2008).       also suffer from inbreeding depression or losses in
                                                         genetic diversity, as has been demonstrated in the
                                                         NERC S41 listed species Colletes floralis (Davis et al,
2.2. Drivers of Bee Declines                             2010) and Bombus muscorum (Whitehorn, 2011).
Over the past 50 years British agriculture has shifted        Modern intensive farming practices within
from labour-intensive, traditionally-managed farms       England have used increasingly large quantities
with numerous small fields to an input-intensive         of synthetic herbicides and insecticides to control
system characterised by large crop monocultures          detrimental plants and insects (DEFRA, 2011b). By
and high density livestock farming (Robinson and         removing flowering plants which provide feeding
Sutherland, 2002). This intensification of agriculture   resources to bees within fields, herbicide use, along
has a number of impacts upon the availability of         with high nitrogen inputs, can reduce the availability
resources for wild and managed bees at a landscape       of forage to bees within already homogenised
scale (Feon et al, 2010) and is widely regarded as       landscapes (Kleijn et al, 2009). Insecticides,
the primary driver of bee declines across Europe         particularly neonicotinoids, can also have a more
(Kundla et al, 2009). This is supported by numerous      direct effect on populations of all bees by reducing
studies from Europe, the UK and North America            breeding success (Lu et al, 2012; Whitehorn et al,
that demonstrate that in homogeneous landscapes          2012), metabolic efficiency (Hawthorne and Dively,
dominated by few crop species and scattered semi-        2011) disease resistance (Pettis et al, 2012) or
natural habitats support significantly fewer wild bee    foraging efficiency (Yang et al, 2008) or by causing
species, often with less individuals than more diverse   direct mortality (Scott-Dupree et al, 2009) or mass
landscapes where abundant resources are available        homing failure in affected social bees (Henry et

8                                                                                                                  The Decline of England’s Bees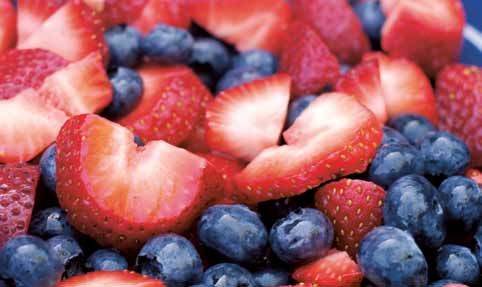
al, 2012). The impacts of insecticides on solitary        include the use of mobile phones and power lines,
bees have rarely been assessed although evidence          although no study has yet produced evidence in
suggests they may be more vulnerable than                 field conditions to support this. A more fundamental
bumblebees or honeybees (Scott-Dupree et al, 2009;        issue concerning honeybees may simply be the
Williams et al, 2010). Uncontrolled, plant feeding        78% decline in beekeepers in England and Wales
pest insects may have detrimental impacts both on         since 1953 as disease control and low honey
crop yields and on the availability of nectar for bees    prices continue to dissuade people from taking up
to forage upon (Sober et al, 2010), although a range      beekeeping in large numbers (Potts et al, 2010a).
of alternative pest management methods are now
in development (section 3.2).
     Pests and diseases are thought to be a major         2.3. The Impacts of
cause of mortality among honeybees and other
managed bees, although their impact on wild bees
                                                          bee declines
remains difficult to assess (Kundla et al, 2009). At      Presently, the impacts of bee declines on pollination
present, the main parasites and diseases afflicting       in wild plants and crops remain largely uncertain
honeybees are the mite Varroa destructor, the             due to gaps in understanding of plant-pollinator
Nosema family of fungi, foulbrood bacteria (e.g.          communities, including the role of hoverflies,
Melissococcus plutonius) and a number of viruses,         approximately 250 species of which are found within
each of which can cause substantial losses within         the UK and can also be important pollination service
honeybee colonies (Formato et al, 2010). V.               providers (Biesmeijer et al, 2006). For instance, while
destructor, now widespread throughout the UK, is          Biesmeijer et al (2006) demonstrate that insect-
not a direct cause of mortality itself but acts as a      pollinated wild plants have declined in parallel with
reservoir of diseases that directly afflict parasitized   solitary bees, it is not clear whether these losses are
bees. Subsequently it is believed to be the main          the cause or effect of bee declines or the result of      Shrill Carder Bee – top,
cause in the virtual extinction of feral honeybees        a common driver. Regardless, several studies have         Tree Bumblebee – bottom
across the UK (Carreck et al, 2008). Foulbrood            demonstrated that diverse communities of pollinators
infections, which infect and kill honeybee brood          provide more effective pollination services to crops
through infected honey, are another potentially           and wild plants than less diverse communities
widespread threat as their spores can persist for         (Winfree and Kremen, 2009; Hoehn et al, 2008).
up to 40 years and they are potentially easily            Furthermore, a recent study by Garibaldi et al (2011)
transmitted between hives (Formato et al, 2010). The      indicates that yields of insect-pollinated crops are
incidence of foulbrood is thought to be widespread,       more unstable when the pollinator community
however the prevalence of Nosema fungi and viruses        comprises fewer species. Breeze et al (2011) also
is almost impossible to determine as they require         note that while the UK’s honeybee populations
direct genetic analysis and dissection of infected        are insufficient to supply more than 34% of British
bees to be identified (Formato et al, 2010).              agricultural demands for pollination services in 2007,
     Climate change has had a notable impact upon         there was no evidence of general declines in crop
the distribution of many wild bees, with several          yields over the study period, suggesting that wild bees
species such as the newly arrived Tree Bumblebee          may play a more important role in crop pollination
(Bombus hypnorum) migrating north in the past 20          than previously believed. As mass-flowering
years as the climate has started to warm (Edwards         crops such as oilseed rape, one of England’s most
and Broad, 2005). Climate change can also disrupt         widespread arable crops (DEFRA, 2011b), can provide
the timing of plant flowering or bee emergence,           attractive short-term resources for bees (Westphal et
resulting in wild bees emerging before or after           al, 2003) it is speculated that honeybee losses have
ample forage is available (Memmott et al, 2007;           caused a shift in wild bee visitation from wild plants
Williams et al, 2007). Some authors have also             to crops, although no data exists to substantiate this
expressed concerns that managed bees may have             (Breeze et al, 2011). However, increased competition
                                                                                                                                          Photographs: Jeremy Early

negative impacts upon wild bees by increasing             between bumblebee species following the end of
competition for forage (Goulson and Sparrow,              mass-flowering crops has been reported by two
2009) and spreading diseases to native populations        studies in Germany, putting pressure on already
(Meeus et al, 2011; Otterstatter and Thomson,             vulnerable long-tongued species (Diekotter et al,
2011). Other suggested causes of bee declines             2010; Holzschuh et al, 2011).

The Decline of England’s Bees                                                                                                                     9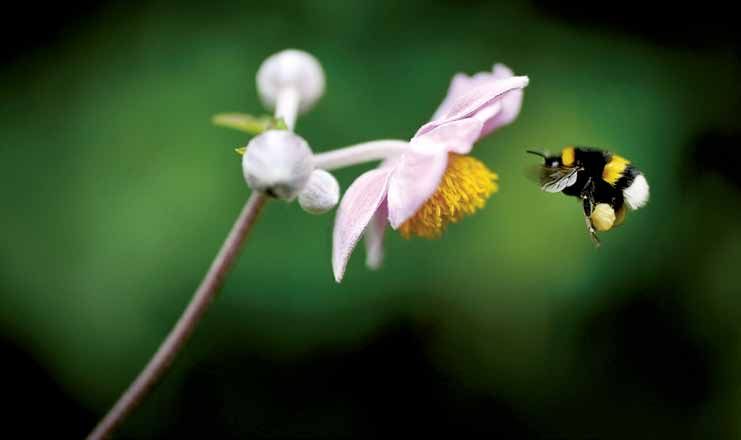
Thinkstock

10   The Decline of England’s Bees
SECTION 3

English policy and Bees

3.1. Agricultural Production                                   maintain a minimal environmental quality (GAEC12
                                                               – RPA, 2011), potentially minimising adverse impacts.
3.1.1. General farming policies                                Conversely, agriculture now occupies 2% less total
Agriculture represents approximately 70% of                    land than in 2005, suggesting that areas may now
England’s land use (DEFRA, 2011b) and as such                  lie totally abandoned as farmers leave the industry.
agricultural production can have a substantial                 The lifting of requirements to remove periodically
impact upon the resources available to bees                    land from production (set-aside) during the 2008
throughout the landscape. In particular mass-                  CAP health check reforms has also seen a 23% drop
flowering crops, such as apples or oilseed rape, can           in rotational fallows which are known to benefit wild
provide short-term but highly abundant forage for              bees (Kuussaari et al, 2011). In their place, DEFRA
local bees and pasture grazing can influence the               has given publicity support to the industry led
quality of nesting sites and bee forage in grasslands          Campaign for the Farmed Environment (CFE) which
(Dicks et al, 2010). Past agricultural production              has seen some success in persuading farmers to
has been heavily driven by the European Union’s                remove land from production and/or manage it for
Common Agricultural Policy (CAP) which promoted                wildlife, including wild bees in particular (CFE, 2011a).
agricultural intensification to maximise production                  Reductions in price controls have also seen an
via yield dependent subsidies (Robinson and                    expansion in market influence on production. In
Sutherland, 2002). Various CAP reforms, notably                particular, the Renewable Energy Directive3 has
the 2003 Mid-Term Review, saw the complete                     driven a sharp rise in demand for biodiesel from
removal of these production dependent subsidies                oilseed rape (Arnoult et al, 2010), causing substantial
in favour of a flat rate per hectare based upon                growth in the area planted across the UK and
past regional payments and subject to a series of              England in particular (DEFRA, 2011d). Large-scale
good environmental practices (cross-compliance2).              production of oilseed rape has been demonstrated
Decoupling payments in this manner was projected               to cause population booms within short-tongue
to reduce the intensity of production, particularly            bumblebees, increasing their competition with
for livestock, although concerns were raised that              long-tongue species over the course of the season
this would lead to increased land abandonment                  (Diekotter et al, 2010). As long-tongued bumblebees
in disadvantaged areas where subsidies had                     are thought to be the main pollinators of field beans
previously made grazing profitable (Stoate et al,              (Free, 1993), commonly grown in crop rotations for
2009). Abandoned agricultural land can quickly                 livestock fodder (DEFRA, 2011b), reductions in long-
become dominated by scrub, reducing resource                   tongue bumblebee populations may have an adverse
availability for bees and other insects (Dicks et al,          effect upon the stability of pollination services in
2010). Although there have been notable reductions             such rotations. Growth in demand for oilseed rape
in sheep herds, particularly in upland regions, since          is likely to continue as the government aims to
the reforms’ introduction in 2005, cattle numbers              meet the fuel obligations of the Renewable Energy
have remained stable and the 5% loss of temporary              Directive (Arnoult et al, 2010) which sets a target of
pasture has been compensated by a 5% increase                  10% of EU member states road fuel to come from
in permanent pasture (DEFRA, 2011b,d). This is                 renewable sources by 2020 (EC, 2009a). This growth
thought to have contributed to a reduction in                  in the area of other biofuel crops which are not mass-
overgrazing, where livestock density is high enough            flowering, such as wheat, may reduce the overall
to damage plant communities by preventing flowers              availability of arable floral resources with negative
from setting seed, however, under-grazing, where so            impacts on wild bee communities.
few livestock are used that land begins to become
dominated by scrub, is thought to be more common               3.1.2. Alternative farming systems
instead (House of Commons, 2011a)                              Low input farming systems, particularly organic
     UK cross-compliance regulations also mandate              farming, are believed to have lower environmental
a minimal management regime for unused land to                 impacts and support greater biodiversity than
                                                               conventional, high input systems. At present there
                                                               is no specific policy encouraging organic production
2   Commission Regulation (EC) No 1122/2009 contains
    the most recent EU cross compliance guidelines and
                                                               systems in England, although the Organic Entry Level
    Agriculture (Cross-Compliance) Regulations 2009 includes
    additions by the UK government                             3   Latest version: Directive 2009/28/EC

The Decline of England’s Bees                                                                                              11
Stewardship provides conversion grants for farmers if implemented this will be likely to have a positive
and additional support subsidies to compensate for impact on bee populations by encouraging beneficial
the added risks involved (Natural England, 2010b). habitat such as rotational fallows (Kuussaari et
Organic farming prohibits the use of synthetic al, 2011), the extent of land required is lower than
fertilisers4 (EC, 2009b) and encourages the use of the 10% previously mandated as set-aside and
crop rotations, diverse crop varieties and sympathetic allows boundary features in addition to managed
habitat management to reduce pest and disease area to be counted towards the target. They also
impacts (Soil Association, 2012; Organic Farmers do not include beneficial farm business measures
and Growers, 2006; Organic Food Federation, such as planting flowering legumes as cover crops
2009). Presently there are 392,000 ha of organic or pasture leys which can provide benefits both to
land within England, 51% of which is permanent bees, through providing diverse floral resources,
pasture (DEFRA, 2011b); however consumer demand and farmers, by increasing soil fertility, reducing
for organic produce has been in decline in recent disease loads and pest populations (Sarrantonio,
years (Nix, 2011), although this trend may reverse. 2007). These requirements would be subsidised in
Several studies have demonstrated that aspects addition to standard payments as part of a revised
of organic farming practices can increase the version of the Single Payment Scheme – the Basic
diversity and abundance of bees at a landscape Payment Scheme – however an alternative scheme
scale in conjunction with well managed semi-natural which does not entail these requirements or cross-
habitats (e.g. Holzchuh et al, 2008; Power and compliance, the Small Farmer Scheme6 (SFS), would
Stout, 2011) although this is not always the case also be available, for farmers with smaller holdings
(e.g. Brittan et al, 2010a; Sarospataki et al, 2009). that have typically received less CAP support in the
Mixed cropping systems, whereby farmers plant past. Although SFS would be capped at 10% of the
two crops within the same field, present a means of total CAP budget per member state, nonetheless a
reducing the impacts of crop monocultures upon significant area could still go without even minimal
bees by providing more mixed resources across a environmental management. Despite promises to
landscape. To date there is no information on the encourage the greening of CAP7 (HM Government,
prevalence of this system within English agriculture 2011a), the Government has been very critical of
and no government support is presently available. these Pillar I reforms, expressing concerns that they
Another mixed cropping system, Agroforestry, may not be cost-effective and do not go far enough
combines crop or livestock agriculture with forestry to reduce the role of subsidies in farm income
or orchard production and has been demonstrated (DEFRA, 2011e). Furthermore, CAP reforms would
to support significantly greater numbers and mandate growing at least three different crops,
diversity of bees (Ricketts et al, 2008). Although the each of which must occupy between 5% and 70% of
EU Rural Development Regulations (1698/2005/ cropped fields >3Ha on each claimants holding (EC,
EC – EC, 2005) set out a definition of agroforestry 2011a). While this will likely encourage the presence
with clauses for government support of 70-85% of at least some mass-flowering crop for bees to
for establishment, to date the UK Government has forage upon within farmed landscapes, periods of
not adopted these or the definition5 of agroforestry resource drought may still result if no mass-flowering
systems (Smith, 2010). Consequently, there are crops are grown following years of extensive growth
no specific schemes to support conversion to and it is possible for farmers to make up these
agroforestry systems and the density of trees requirements using only token small areas of third
planted often qualifies the land as forestry (>500 crops while growing two main crops in large areas
trees/Ha), disqualifying them from receiving over successive years. Furthermore, as highlighted
payments under the CAP Single Payment Scheme previously, there may also be negative impacts upon
and thereby limiting Agri-environmental support some members of bee communities when planting
(Smith, 2010). large areas of a single mass-flowering crop (Diekotter
et al, 2010). Stronger measures on diversification
3.1.3. Future production policy could redress this issue by reducing the extent of
The CAP is due for further reforms in 2013. Current monocultures and encouraging rotational practices.
proposals (EC, 2011a) aim to further “green” Pillar I, Further changes in crop production are likely
the agricultural subsidies axis of CAP, by mandating to arise from current government commitments to
the maintenance of permanent grassland and improving fruit and vegetable consumption (HM
introducing mandatory Ecological Focus Areas (EFA) Government, 2011b) and meeting the demands of
and a requirement for crop diversification. EFA would a growing population with more sustainable and
require that ≥7% of land entitled to CAP payments competitive agriculture (HM Government, 2011a).
should be managed as fallows, buffer strips, Past studies have demonstrated using hypothetical
hedgerows and other low-input features. Although initiatives (e.g. “fat taxes”8) that altering production
4 Council Regulation (EC) No 834/2007
5 Article 44, paragraph b) defines agroforestry as “land 6 Section 92
use systems in which trees are grown in combination with 7 Page 5: Paragraph 19
agriculture on the same land.” This definition is adopted in 8 Fat taxes are not presently within current government
Northern Ireland (Smith, 2010) agendas on food
12 The Decline of England’s Beesto reflect increased demands for fruits and at bees, insecticides have been demonstrated
vegetables over meats produce substantial declines to have severe negative impacts upon bees in
in pastureland, livestock numbers and the areas experimental and field conditions (Whitehorn et
of mass-flowering arable crops grown as fodder al, 2012; Henry et al, 2012; Lu et al, 2012; Pettis
as demand for meat falls (Arnoult et al, 2010). et al, 2012; Scott-Dupree et al, 2009). Trends in
Similarly, replacing imported soybean meal with the use of pesticides across the UK have varied
locally grown protein crops, such as field beans and strongly between crops over the last 5 years (Tables
dry peas, has also been suggested as a key means 3.1 and 3.2) but overall, pesticide application
of improving sustainability within agriculture by the rates rose 6.5% between 2005 and 2010 due to
EU, although such initiatives are not currently on the increasing treatment intensity per Ha on a number
UK government’s agenda (EC, 2010a). If successful of crops (FERA, 2012). In general, more insecticide
this would result in an increase in mass-flowering treatments are applied per hectare in oilseeds
crop area, however the benefits for bees are likely and fruit crops than cereals, increasing the risk
to be confined to the long-tongued species that of exposure to bees (FERA, 2012). Herbicides,
can access the nectaries of field beans (Delaplane particularly broad spectrum varieties, can also
and Mayer, 2000). Furthermore because of the negatively impact upon bees by eliminating forage
unfavourable markets for many of these crops Pillar plants which sustain bees when crops are not in
I subsidisation is likely to be required to incentivise flower (Holzchuh et al, 2008). Neonicotinoids,
their production, contrary to current government which are highly effective insect neurotoxins, are
agenda (DEFRA, 2011e). widely absorbed by treated plants and coated
Finally, proposed reforms to Pillar II, the rural- seeds, resulting in both raw active ingredients and
environmental axis of CAP, aim to see greater metabolites occurring within pollen and nectar (Dively
expansion of funds towards rural development, and Kamel, 2012) and giving rise to concerns about
including income diversification and risk assessment. sub-lethal effects that may occur in foraging bees
As pollinators, bee populations can have a (e.g. Pettis et al, 2012). Although use of Imidacloprid,
substantial impact upon the stability of yields the active ingredient most widely reported to be
(Garibaldi et al, 2011) and the capacity of farmers detrimental to bees, has declined significantly since
to grow diverse, high value crops (Klein et al, 2008 (FERA, 2012) when signs of resistance to the
2007). However, despite the growing importance compound appeared (Insecticide Resistance Action
of pollination services to agriculture across the UK Group, 2009) use of other neonicotinoids, such as
(Breeze et al, 2011), there remains little information Thiamethoxam and Clothianidin, have increased
on pollination service management available substantially (FERA, 2012).
to producers. For example, recommended lists Pesticide policy across the UK is directed by
from the government-sponsored Home Grown the European Plant Protection Products (PPP)
Cereals Association (HGCA) do not contain any Regulations (1107/2009/EC – EC, 2009c), enshrined
information on the pollination requirements of in English law via the Plant Protection Products
oilseed rape varieties (HGCA, 2012a,b), despite Regulations 2011 (HM Government, 2011c), which
growing evidence that bee pollination affects set out guidelines for the process of approval,
both yield and quality (Bommarco et al, 2012). marketing and use of pesticide active substances
Similarly, funding for horticultural crop research within the EU and member states. The regulations
has declined substantially in recent years (Fruit require an assessment of the toxicity of any active
and Vegetables Task Force, 2010) with most work substances on honeybees, requiring that there
concerned with the technical aspects of breeding must be “no unacceptable acute or chronic effects
and production rather than ecosystem service inputs on colony survival and development, taking into
such as pollination. As such the key pollinators and
pollination requirements of many modern cultivars
remain unidentified. Reducing these uncertainties
through further research into on-farm pollination
service management is therefore key to meeting the
Government’s agenda of low risk, highly competitive
agriculture, especially in the horticultural sector.
3.2. Agrochemical Policy
3.2.1.Certification and
Application Policy
Modern intensive agriculture makes expansive use
of pesticides, termed plant protection products,
to control plants (herbicides), invertebrate pests
iStockphoto
(insecticides) and diseases (fungicides) that may
adversely affect crop yields. Although not targeted
The Decline of England’s Bees 13account effects on honeybee larvae and honeybee Table 3.1. Insecticide application rates on flowering crops
behaviour.”9 No account however, is made for the and habitat in 2010
impacts on other bee species, despite several studies
which have indicated that various species can be Crop Total Treated Change in Total % of total
affected differently by the same chemicals, with Area 2010 (Ha) Treated Area crop area
solitary bees being more vulnerable than social Insecticides (Insecticides) treated with
species (e.g Scott-Dupree et al, 2009). Similar but 2005-2010 Insecticides
less detailed requirements are also imposed on 2010
non-agricultural pesticides as part of the Biocidal
Oilseeds 1.9m Ha +26% 74%
Products Directive (EC, 1998)10. Guidelines for
assessing exposure and the impacts of exposure, Peas & Beans 0.6m Ha +10% 80%
drawn up under the previous PPP regulations
(91/414/EEC – EC, 1991), similarly focus exclusively Strawberries 18,133 Ha +295% 86%
upon honeybees (EC, 2002). At least two other Top Fruit & Hops 55,606 Ha -20% 77%
non-target arthropods must be assessed, although
these are not specified and evaluating solitary bees Grassland 25,616 Ha +356% 0.1%
and bumblebees may neglect providers of other
Other Soft Fruit 14,328 Ha +39% 71%
ecosystem service, such as beetles. While these
guidelines cover a range of exposure processes, Cereals 2.4m Ha -30% 43%
including exposure via affected pollen and nectar,
higher tier risk assessments are only required if the Total treated area = the area of treatment x number of treatments (e.g. 4 ha treated
hazard quotients, derived from LD50 assessments11, 3 times = 12Ha TTA); seed treatments count as a single application. This does not
account for treatment dosage which may be below maximum acceptable levels. Total
are sufficiently high, potentially neglecting non-lethal treated area is a metric of frequency of application. Source: FERA, 2012
impacts. Furthermore, “key parameters” of colony
survival assessed in these higher level assessments
are relatively discretionary and do not include Table 3.2. Herbicide application rates on flowering crops
defined methodological guidelines for assessing bee and habitat in 2010
behaviour. Pesticide labels are required, under PPP
regulations (EC, 2009c12), to include information Crop Total Treated Change in Total % of total crop
regarding the use of the pesticide during times when Area 2010 (Ha) Treated Area area treated
bees are active or when crops are in flower but only Herbicides (Herbicides) with Herbicides
if authorisation relates to use during the “season 2005-2010 2010
for bees”. As, different bee species are active at
Oilseeds 3.2m Ha +78% 96%
different points within the year and by lacking a clear
definition of “season for bees” these regulations may Peas & Beans 0.9m Ha -4% 92%
not impose assessments for use during the life-cycle
of all bees, particularly short-lived solitary bees which Strawberries 11,095 Ha -21% 69%
often only fly for a few weeks and may nest in soils Top Fruit & Hops 63,708 Ha -13% 70%
near the edge of fields.
Other specific protection for bees is provided Grassland 1.1m Ha +3% 2%
by the Control of Pesticides Regulations 1986 (HM
Other Soft Fruit 13,956 Ha -7% 82%
Government, 1986) which require 48 hours’ notice
to be given to local beekeepers before spraying. The Cereals 13.7m Ha -5% 87%
Code of Practice for using plant protection products
further recommends that spraying should be carried Total treated area = the area of treatment x number of treatments (e.g. 4 ha treated
out in the evening or on cloudy days when bees 3 times = 12Ha TTA); seed treatments count as a single application. This does not
account for treatment dosage which may be below maximum acceptable levels. Total
are not active, noting that bumblebees may still treated area is a metric of frequency of application. Source: FERA, 2012
be active at this time (DEFRA, 2006). Furthermore,
some protection to bee habitat is afforded by the
Code of Practice (DEFRA, 2006) which mandates site in question however is not specified and may
notice to be given to appropriate authorities when be of conservation relevance for bees as the use of
spraying near designated sites, notably Sites of pesticides in the wider landscape has been linked
Special Scientific Interest, Natura 2000 sites and with changes in wild bee community structure and
Nature Reserves (Section 3.4). The distance to the diversity (Brittan et al, 2010b). Cross Compliance
(GAEC14 – RPA, 2011) and the PPP Regulations 2005
9 Annex II paragraph 3.8.3 provide more widespread protection, requiring that
10 Enacted in UK law via the Biocidal Products Regulations spraying activities be conducted at least 2 metres
2001 (HM Government, 2001) away from hedges, protecting both bees nesting
11 LD50 assessments assess the concentration of a within them from insecticides and any beneficial
substance at which 50% of contacts will be fatal and are
widely used as an assessment of toxicity
weeds from herbicides. However, this protection is
12 See Article 65; Non-incorporated text from 91/414/EEC not extended to stonewalls and other boundary
Article 16 – Paragraph 4 features such as bare soil at field entrances in which
14 The Decline of England’s Beesbees may nest. Furthermore, these guidelines only
extend to professional users or users of agricultural
pesticides and not to non-professional users,
such as gardeners, potentially circumventing this
protection in developed landscapes (HSE, 2007).
Although the Code of Practice contains guidelines to
minimise spray drift (DEFRA, 2006), aerial spraying
of pesticides may still result in contamination
especially as wind speed is only considered
prohibitive at 10 knots13. However as of June 2012
the Health and Safety Executive (HSE) will further
restrict these practices to instances where no
alternative can be demonstrated or there is a clear
Angelo DeSantis
and significant advantage to spraying by air. These
guidelines will also enforce the use of detailed action
plans, although this does not include Environmental
Impact Assessments (HSE, 2012).
The Sustainable Use Directive (2009/128/EC –
EC 2009d) sets out guidelines for member states Environment White Paper contains no commitments
to establish targets for reducing the environmental towards expanding lower impact control measures
and health risks of pesticides and further develop that may reduce pesticide use (HM Government,
integrated pest management and other alternative 2011a). The most basic of these measures is the
practices. Although the UK does not yet have use of selective herbicides or more precise spraying
a National Action Plan, as mandated by the regimes that only target the most aggressive weeds,
directive to achieve this, DEFRA’s UK Pesticides as advocated by the industry led-Campaign for
Strategy has been available since 2008 and has the Farmed Environment (CFE, 2011a). Another
largely identical objectives, setting out a series of alternative, commonly recommended to organic
action plans to reduce the impacts of pesticides, farmers, is the use of cover crops such as legumes
each using a series of indicators to evaluate their within rotations, which can outcompete common
effectiveness (DEFRA, 2008). Among these action weeds, as well as reducing disease and parasite
plans is the Biodiversity Action Plan (not to be burdens and improving soil fertility (Sarrantonio, 2007).
confused with the UK Biodiversity Action Plan) More recently, studies in North America have
which aims to minimise the impacts of pesticide successfully begun to develop means of using
use on biodiversity, by identifying UKBAP habitats managed hoybees and bumblebees to transmit
and species which are particularly vulnerable to viruses and fungi which attack crop pests (Mand
pesticide use and completing a risk assessment for et al, 2010). Although no negative impacts upon
non-target species, although which species are to the bees used as vectors have been reported,
be included within this is not defined (HSE, 2011). substantial research will be required to assess
While these measures are likely to benefit bees by the effects of this method of control upon wider
protecting both their habitats (Section 3.4) and ecological communities (Kevan et al, 2008).
the rarer species (Section 3.6), the only headline Genetically modified (GM), herbicide resistant crops
biodiversity indicators are indices relating to birds allowing more potent plant control products to
and not bees or other invertebrates which are likely be used in their fields, however this may result in
to be more directly affected by agrochemicals. declining diversity of in-field weeds as seed banks
Another action plan of note is the Amateur Action become depleted (Strandberg et al, 2005) although
Plan which aims to establish best practice for using this is not always the case (Heard et al, 2003). Other
non-industrial pesticides and encourage uptake of GM crops produce compounds which are toxic to
alternatives, reducing the biodiversity impacts of pests which may reduce the need for pesticide
these chemicals within developed landscapes (HSE, use. Although these compounds may be present in
2007). Unfortunately this action plan has not been the pollen and nectar of these plants, there have
updated since its creation in 2007 and its indicators not yet been observed negative impacts of these
are highly industry specific with none concerning substances upon bees (Duan et al, 2008). There
biodiversity, despite its stated goals. may also be unexpected side-effects of GM that
affect foraging bees, for instance a study in the USA
3.2.2. Policy on alternative pest demonstrated that female virus resistant pumpkin
control measures produced less nectar than conventional varieties
Control of crop pests is a critical component to while male flowers produced more pollen, altering
successful farming across the UK. However, despite foraging patterns in squash bees (Peponapis spp.)
a commitment to ecosystem orientated sustainable the main pollinators of the crop (Prendeville and
agricultural production the Government’s Natural Pilson, 2009). At present GM crop marketing in the
EU is heavily regulated under regulation 2001/18/
13 The Control of Pesticides Regulations 1986 Schedule 4 EC (EC, 2001) which requires detailed, case-by-case
The Decline of England’s Bees 15environmental risk assessments, in conjunction with suggested significant overhauls in the structure
risk assessments from PPP regulations, at a national and implementation of AES (EC, 2011b). The UK
level before commercial planting of GM seeds is Government has been largely supportive of these
approved. These risk assessments must include a changes to the point of suggesting reducing direct
range of assessments of the impacts on non-target Pillar I payments to increase incentives for farmers,
organisms, including impacts on food webs, however particularly in severely disadvantaged areas, to join
there is no requirement to assess the impacts Pillar II funded AES (House of Commons, 2011b).
on pollinators or pollination services specifically. Within England, a range of AES’s exist to suit
European Food Safety Authority guidelines for the needs of different producers and presently
assessing these impacts however do suggest that 67.7% of utilised agricultural area14 is enrolled in
bees of a range of taxa should be assessed but the range of AES administered by Natural England,
these are not binding (EFSA, 2010). No GM crops with the Entry Level Stewardship (ELS) scheme
are presently grown in the UK at a commercial scale being the most widespread, (5.3m Ha – 57.4% of
although the government is open to the possibility utilised agricultural area as of March 2012 – Natural
of introduction subject to rigorous assessments of England, 2012a). These schemes are available
their environmental and human health impacts to almost all English land owners as long as they
(DEFRA, 2011f). own at least 1Ha of land which is managed in a
Within the ecosystem framework, another means manner suitable to cross compliance. ELS allows
of controlling pests within crops is to encourage, participants to select the management they wish
or deliberately enhance the numbers of “natural to undertake from a range of options, each with
enemies” within crops. Natural enemies are animals, an attached points value reflecting their benefit
usually invertebrates such as hoverfly larvae, wasps to wildlife and the complexities of management.
and beetles, which feed upon or parasitize crop An Organic Entry Level Stewardship (OELS) which
pests. The effectiveness of these natural enemies is has similar options, with adjusted points values to
thought to be closely linked with their diversity within reflect the differences in income foregone, is also
systems (Smith et al, 2011) and can be enhanced by available for organic producers to better reflect their
a number of agri-environmental measures beneficial management practices, covering 343,482 Ha as of
to wild bees such as wildflower margins (Frank et March 2012 (Natural England, 2012b). To qualify,
al, 2012). However, this control method is unlikely participants must select a suite of options with an
to be economically viable at present due to a lack average value of 30 points per hectare (60 for OELS)
of understanding of pest-predator interactions (e.g. enrolled in the scheme, paying participants £30
Brown, 2012; Cross et al, 2001), artificially increasing per hectare (£60 in OELS) in reimbursement. More
the levels of natural enemies may not always have specialised Uplands ELS and Upland OELS schemes
positive effects on this service (Straub et al, 2008) have also been launched, adding greater incentives
and the effects upon wider invertebrate communities (£62/Ha enrolled and £92/Ha enrolled) and unique
remain largely unknown. options to further encourage uptake within the most
disadvantaged areas of English farming (Natural
England, 2010c).
3.3. Agri-Environment Several ELS options have been demonstrated to
Schemes enhance significantly the abundance and diversity
of wild bees within fields by providing additional
flowering and nesting resources. The most obvious
3.3.1. Entry Level Stewardship of these is option EF4 – Nectar flower mixes, which
One of the most widely applicable means of requires the sowing and maintenance of areas of
providing resources to bees within the farmed flowering plants containing at least four key families
environment is the use of Agri-Environment of plants associated with bees. This option was
Schemes (AES). AES are mandated in their present specifically developed to benefit bee populations
form by EU Council Regulation 1698/2005 (EC, and has been widely demonstrated to significantly
2005) and funded via CAP’s environment and rural increase the number and diversity of bumblebees
development axis (Pillar II) to provide compensation found within fields (Potts et al, 2009; Carvell et al,
to farmers for environmentally-beneficial work 2007) and at a landscape scale (Pywell et al, 2006).
undertaken upon their land. In general AES have Other managements within ELS that have been
been demonstrated to improve bee diversity and demonstrated to be effective at enhancing in-field
abundance on farms and at the landscape scale abundance and/or diversity of wild bees include
(Carvell et al, 2011; Dicks et al, 2010; Pywell et al, Wild bird seed mix (EF2 – Potts et al, 2009), buffer
2006). Although overall budget for CAP is set to strips (EE1-3; Pywell et al, 2005, Marshell et al, 2006),
fall, proposals on the forthcoming 2013 reforms grasslands with low inputs (EK2/3; Batary et al, 2010)
to CAP have signalled a strong intention from the and naturally regenerated, uncropped field margins
EU and the UK Government towards increasing (EF11; Carvell et al, 2007). Studies from Scotland
the proportion of CAP funds allocated to Pillar II,
changing the emphasis of subsidies to AES and rural 14 Utilised Agricultural Area is land which is actively used for
development. Presently, however, no proposals have production of crops, live stock or other farming activities.
16 The Decline of England’s Beeshave also demonstrated that managed arable field develop new options such as herb and legume rich
margins can provide attractive nesting sites for swards (Natural England, 2012b). Of particular
queen bumblebees (Lye et al, 2009). However, to note, these proposals also include allowing Nectar
date many of these studies have focused heavily Flower Mixes (EF4) to be fully rotational, allowing
or exclusively upon bumblebees and as such their farmers to incorporate them into crop rotations as
benefits to solitary bees may be more varied. The cover crops. Due to World Trade Organisation (WTO)
Upland ELS also introduces options for traditional rules on environmental subsidies, however, it is not
hay management and uncut hay strips which are possible for any AES measures to be financially
also likely to benefit bee populations by providing incentivised as payments may only reflect income
continuous and diverse floral resources throughout foregone and additional costs incurred (WTO, 1995).
the flowering period (Natural England, 2010c). Most fundamentally, ELS schemes do not
While the structure of ELS allows for a great have sufficiently defined, measurable biodiversity
degree of flexibility to participants, this can in objectives or comparative baseline biodiversity data
turn result in limited delivery of valuable options bar the farmland bird index. This makes assessment
as participants instead fulfil their points quotes of their benefits for wild bees and any other taxa
using larger numbers of low cost, limited benefit near impossible (Kleijn and Sutherland, 2003, but
options (Hodge and Reader, 2010). Some of these see Boatman et al, 2008). As a result, ELS payments
options, such as hedge management (EB1/2) do not account for the potential benefits of
involve only very minor changes from the standard employing the scheme, or certain options, within it
requirements of cross-compliance (GAEC14/15 at different areas, a problem referred to as “adverse
– RPA, 2011). In order to redress this issue, the selection” (Quillerou and Fraser, 2010). For instance
Campaign for the Farmed Environment (CFE), in AES in general are thought to be most effective in
conjunction with Natural England, have launched a already intensively managed areas where small
relatively successful campaign to better encourage changes can produce larger biodiversity benefits
participants to adopt these more beneficial options, (Kleijn et al, 2009). However, many of the most
helping Natural England to raise the uptake of beneficial land use based options remain largely
Nectar Flower mix from 1806Ha15 to 2974Ha (64%) within the least productive land (Hodge and Reader,
between 2007-2011 (Hodge and Reader, 2010; 2010). The recent introduction of the Upland ELS
CFE, 2011a). Similar industry led success has been redresses this in part by providing greater incentives
found in Syngenta and Sainsbury’s joint initiative to disadvantaged areas where CAP payment
Operation Bumblebee project which encouraged decoupling has substantially increased the likelihood
farmers to take up a pollen and nectar mix that was of land abandonment (Mills et al, 2012). Within
specifically very beneficial to bumblebees (Operation agreements, although the CFE and ETIP provide
Bumblebee, 2009). However, this still represents advice on where to place options to maximise
less than 0.1% of the total area managed under ELS benefits to wild bees (CFE, 2011b; Natural England
(5.2m ha)16 and the high costs and management 2011b), ELS schemes themselves provide little
complexities of this and similar options are likely advice or incentive for participants to collaborate or
to remain a deterrent to wider uptake (Hodge and strategically place options to optimise connectivity
Reader, 2010; Mills et al, 2012). To drive greater and other benefits essential to improving habitat
uptake of these options Natural England has quality for wild bees. Finally, ELS inspection focuses
recently redefined its targets for the scheme, from solely upon establishing whether the options
simply including 70% of farm land, to increasing claimed have been correctly implemented rather
the contribution of points from the high priority than the quality of implementation or the outcomes
options identified by CFE including Nectar Flower that result from their implementation. This can be a
mix, to 61% of the total (Natural England 2011a). particular issue for sown flower mixes as aggressive
As of March 2012, high priority options account for grasses can often out-compete sown flowers, leaving
58% (120m) of ELS points (Natural England, 2012a). only a few remnants (Blake et al, 2011). However,
Furthermore the ELS Training and Information monitoring costs, even for indicator species, can
Programme (ETIP) aims further to bolster knowledge prove highly restrictive to the overall effectiveness of
and address concerns regarding Nectar flower AES (Gibbons et al, 2011). In 2013 CAP will undergo
mixes and other priority options (Natural England, further major reforms with the aim of enhancing the
2011b). Natural England’s Making Environmental environmental benefits of existing policies in Pillar II
Stewardship More Effective (MESME) project is also while introducing stricter environmental standards
exploring a range of measures to encourage uptake in Pillar I (EC, 2010a), giving ground to a complete
of the more beneficial options such as reducing renewal of ELS within the new England Biodiversity
the points of low-benefit, high uptake options, and Strategy (HM Government, 2011a).
15 Includes Nectar flower Mix on Set Aside land (EF5), an 3.3.2. Higher Level Stewardship
option which was removed following the removal of Among the AES within England, the Higher Level
mandatory set-aside.
16 Note that this represents the total area covered by ELS
Stewardship (HLS) is widely regarded as the most
agreements, not the total area managed under ELS effective means of enhancing on-farm biodiversity
options (HM Government, 2011a). HLS is a discretionary
The Decline of England’s Bees 17You can also read