MAINE'S CLIMATE FUTURE- 2020 UPDATE - Climate Change Institute
←
→
Page content transcription
If your browser does not render page correctly, please read the page content below
MAINE’S CLIMATE FUTURE—
                2020 UPDATE

Maine’s Climate Future 2020 update   1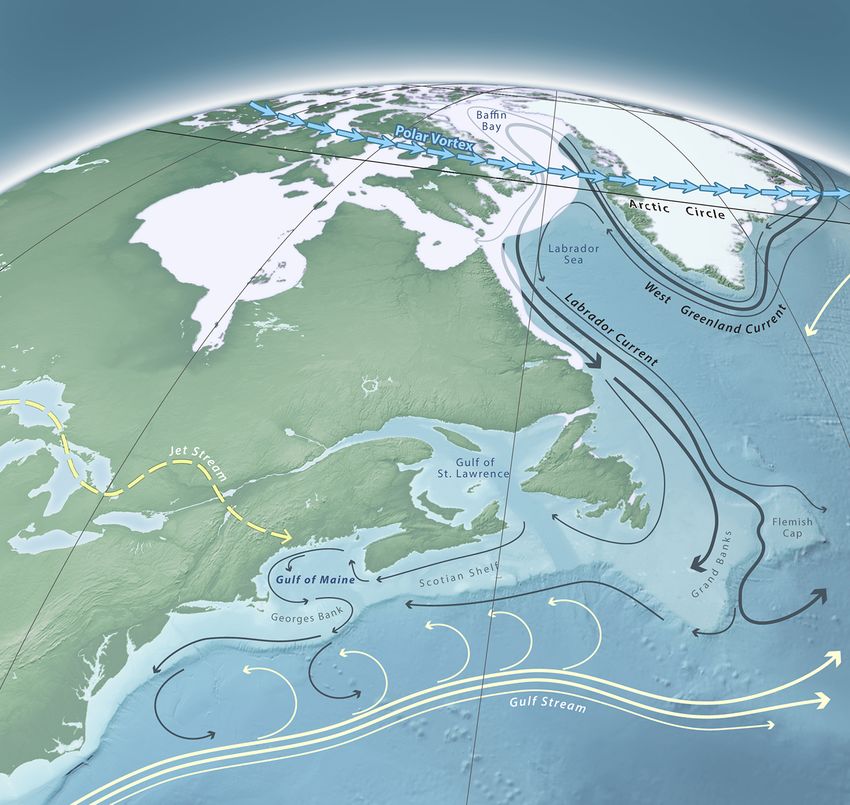
Table of Contents
MAINE’S CLIMATE FUTURE 2020 ................................................................................................................ 3

  Introduction ......................................................................................................................................................... 3

  Maine’s climate continues to change, and fast. .................................................................................................... 6
     Precipitation is increasing in frequency and intensity. .............................................................................................. 9
     What about drought?............................................................................................................................................... 12
     Winter is the fastest changing season. .................................................................................................................... 15
     The Gulf of Maine is getting warmer. ...................................................................................................................... 21
     The chemistry of the Gulf of Maine is changing. ..................................................................................................... 23
     Rising sea levels lead to more frequent flooding. .................................................................................................... 25
     Our growing weather vocabulary ............................................................................................................................ 29
     Air pollution is the force behind these changes—and also hurts our health. ......................................................... 31
     The Great Acceleration ............................................................................................................................................ 35
     Climate change and working Maine......................................................................................................................... 37
     Forests ...................................................................................................................................................................... 38
     Working, playing, living ............................................................................................................................................ 42

  Climate Future ................................................................................................................................................... 43
     Plausible Future Scenarios ....................................................................................................................................... 45
     Factors Influencing Future Scenarios ....................................................................................................................... 46
     Future scenarios depend on us. ............................................................................................................................... 49

  Maine Leads ....................................................................................................................................................... 53

  References ......................................................................................................................................................... 57

  Credits ............................................................................................................................................................... 69

Maine’s Climate Future 2020 update                                                                                                                                                 2
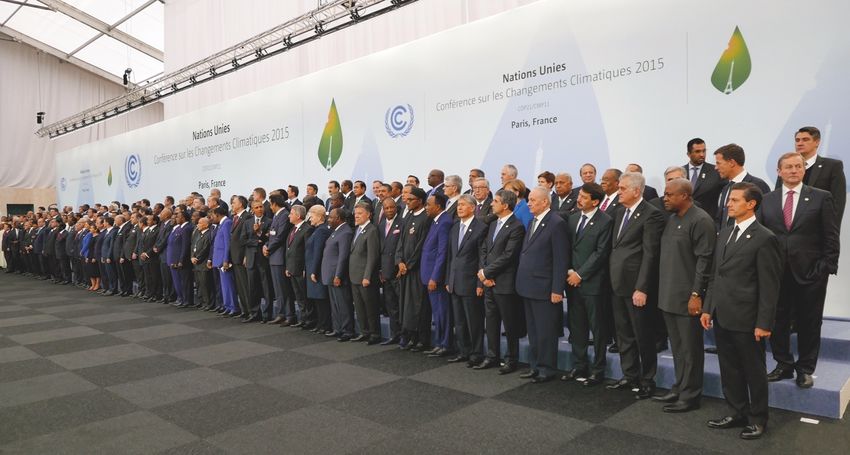
MAINE’S CLIMATE FUTURE 2020
Introduction

Climate change is a global phenomenon, and its effects in Maine must be understood in the
context of changes taking place throughout the world.

Since 1990, the world has learned about the consequences of increasing greenhouse gas
concentrations in the Earth’s atmosphere for our planetary climate system, most notably
through a series of reports from the United Nations Intergovernmental Panel on Climate
Change (IPCC). The findings of the most recent IPCC report are summarized in the Synthesis
Report released in 2014 (IPCC 2014a). Additionally, “state of the climate” reports produced
annually by scientific organizations such as the World Meteorological Organization (WMO
2019a) and the American Meteorological Society (Blunden and Arndt 2019) reinforce the
trajectory of change for a warming world and document the accumulation of broken records of
atmospheric warming and extreme events from accelerating change in the climate system.
The year 2019 was one of exceptional global heat, retreating ice, and record sea level rise,
with the most recent five-year and ten-year global temperature averages certain to be the
highest on record (WMO 2019b).

The past year has seen the release of notable special reports by the IPCC. Climate Change
and Land (IPCC 2019a) details how careful land stewardship is vital for sustaining food
systems, freshwater resources, and biodiversity. The worldwide exploitation of land resources
is being exacerbated by climate change, as well contributing to the climate crisis. The Ocean
and Cryosphere in a Changing Climate (IPCC 2019b) warns of accelerating trends in ocean
warming, sea level rise, ocean acidification, and oxygen depletion, along with evidence for
accelerating rates of glacial melting around the world. These changes have profound effects
on marine fisheries and ecosystems, hurricanes and cyclones, and water supply.

For 2018, the last full year of data available for this report, the American Meteorological
Society reported that the planet had an atmospheric carbon dioxide (CO2) concentration of

407.4 ±0.1 parts per million. This is the highest concentration the earth has seen in 3 to 5
million years (Karlis 2019). The year 2018 was the fourth-hottest globally since records began
in the early 1800s. Every year since the start of this century has been hotter than the 1981–
2010 average despite the fact that the world oceans have absorbed more than 90 percent of
the warming in the past 50 years (Dahlman and Lindsey 2018).

Since 2015 we have witnessed a remarkable escalation in the evidence for a changing planet
Maine’s Climate Future 2020 update                                                              3
along with an escalation in the political and social engagement on how to respond. The
National Aeronautics and Space Administration reports that, on average worldwide, 18 of the
19 warmest years on record have occurred since 2001, and the five hottest years are the last
five years (NASA 2019). Warming rates increase farther north, and are highest over the Arctic
and sub-Arctic. Canada’s rate of warming is twice that of the global rate, with stark contrasts
for the country’s future depending on how the world commits to limiting greenhouse gas
emissions (Bush and Lemmen 2019).

In the United States, the Global Change Research Program is mandated by Congress to
“assist the Nation and the world to understand, assess, predict, and respond to human-
induced and natural processes of global change.” The Fourth National Climate Assessment
focused on observed and projected changes in the physical climate system (Volume 1,
USGCRP 2017) and climate-related risks to humans, ecosystems, infrastructure and the
economy (Volume II, USGCRP 2018), and concluded that: the evidence of human-caused
climate change is overwhelming and continues to strengthen, that the impacts of climate
change are intensifying across the country, and that climate-related threats to Americans’
physical, social, and economic well-being are rising.

While in the past we may have underestimated the rate and severity of climate change, today
there is little doubt of the price of unchecked climate change, with the National Climate
Assessment estimating a potential cost equal to nearly 10 percent of the U.S. gross domestic
product by the end of the century (Berwyn 2018). Since 1980, the U.S. has sustained 241
weather and climate disasters that exceeded $1 billion in damages, with a total cost for these
events of $1.6 trillion (Smith 2019). In 2018 alone, there were 14 of these climate disasters
with 247 deaths and costs exceeding $1 billion in the U.S. These costs do not include the
chronic consequences of a changing climate that we experience every day.

These recent reports on climate change have consistently told us that:

•   atmospheric greenhouse gas concentrations are increasing because of human actions,
•   they are influencing the climate in unprecedented ways,
•   there is increasing evidence that these changes are accelerating,
•   we have not begun to implement sufficient actions to alter our climate trajectory, and
•   we are heading for a planetary condition no humans have ever experienced.

In Maine, we are acutely aware of the importance of our ocean, forests, fields, wetlands,
lakes, and rivers to our way of life, our livelihoods, and our economy. All of these
characteristics of Maine are shaped, in part, by our climate. We have always dealt with the

Maine’s Climate Future 2020 update                                                                4

challenges of weather and the joys of four seasons, but what we are experiencing now is both
accelerating change in extremes and long-term averages of weather that reflect fundamental
changes in the boundary conditions, or the historical range of conditions, of our climate. While
these changes are consistent with the patterns reported in global and national climate
assessments, those assessments are not specific to Maine, nor to our unique way of life.

The University of Maine’s Climate Change Institute and Maine Sea Grant in 2008 led an initial
assessment of climate-related changes in Maine. The resulting comprehensive report, Maine’s
Climate Future – An Initial Assessment (Jacobson et al. 2009) identified evidence of a
changing climate here in Maine. More recently, we published Maine’s Climate Future 2015
Update (Fernandez et al. 2015) that described the accumulating evidence of climate change in
Maine with clear effects on Maine people and the environment.

The potential to alter our trajectory of impacts on the climate leaves room for optimism about
how significant action today can avoid the worst-case scenarios for our future and build a
sustainable society that we owe to future generations. To do so, we have to use the best
available information to understand the changes taking place all around us, particularly where
we live.

So, what about Maine?

Wiggly Bridge Under the Weather by Wayne Boardman licensed under CC BY-NC 2.0.

Maine’s Climate Future 2020 update                                                              5
Maine’s climate continues to change, and fast.

Temperatures are increasing statewide. Average annual temperature has increased 3.2
degrees Fahrenheit (°F) in the last 124 years, and the rate of warming has increased most
notably since 1960. The six warmest years on record have occurred since 1998. Indeed, the
Northeast is warming faster than any other region in the U.S., and is projected to warm 5.4 °F
(3 °C) when the rest of the world reaches 3.6 °F (2 °C) (Karmalkar and Bradley 2017).

Chart: Maine Average Annual Air Temperature, 1895-2018

Annual temperature, 1895-2018, averaged across Maine based on monthly data from the NOAA
U.S. Climate Divisional Database (NOAA CAAG). Linear trends calculated for the entire record
(dashed line) and since 1960 (dotted line).

Maine’s Climate Future 2020 update                                                             6
The whole state has warmed, and temperature increases have been greatest in the coastal
division.

Map: Annual Temperatures by Climate Division

Current average annual temperature and increases in average annual temperature since 1895,
calculated from the NOAA U.S. Climate Divisional Database (NOAA CAAG).

Maine’s Climate Future 2020 update                                                           7
The growing season (the period between the last frost and first frost) is more than two weeks
longer than it was in 1950, mostly due to later frosts in the fall.

Graph: Growing Season Length, 1950-2018

Growing season lengths based on statewide mean of 20 stations with long-term (since 1950)
observational records of daily minimum and maximum temperature: Acadia National Park, Augusta,
Belfast, Bangor, Bar Harbor, Caribou, Corrina, Eastport, Farmington, Fort Kent, Gardiner, Houlton,
Jackman, Jonesboro, Lewiston, Madison, Presque Isle, Portland, Sanford, and Waterville. Data from the
NOAA Global Historical Climatology Network (NOAA GHCN)

Longer growing seasons have allowed some farmers
to report they could double-crop, and one farmer
reported being able to grow watermelon (Mallory and
Roche 2018). But unpredictable frost conditions,
wetter and cooler springs, more frequent and intense
rainfall, drought, and multiple years of weather-
related stress are taking an increasing toll on farm
viability (Wolf et al. 2018). Photo courtesy South Paw Farm

Maine’s Climate Future 2020 update                                                                  8
Precipitation is increasing in frequency and intensity.
Average annual precipitation has increased 15 percent (5.8 inches) since 1895, and the
increase has come in the form of more rain, and less snow. Since 1895, depth of annual
snowfall has decreased 20 percent (2.3 inches). As with temperature, the rate of increase has
accelerated in recent decades.

Graph: Maine Average Annual Precipitation, 1895-2018

Total annual precipitation, 1895-2018, averaged across Maine based on monthly data from the NOAA
U.S. Climate Divisional Database (NOAA CAAG). Linear trends are depicted for the entire record
(dashed) and since 1960 (dotted).

Flooding affected communities in Aroostook County in April 2019 (Lynds
2019). The Maine Emergency Management Agency has information on
preparing for threats related to extreme events (MEMA 2019). Nationally, flood
insurance premiums have been rising between 5 percent and 9 percent a year,
and the increase can be as high as 18 percent for individual homeowners, yet
many people still aren’t covered (Flavelle 2019). Fort Kent by US Geological Survey

Maine’s Climate Future 2020 update                                                                 9
The spring of 2019 provides evidence of the challenge of wet springs for farmers with delayed planting
and crops rotting in the field (Sambides Jr. 2019a). Photo by Tori Lee Jackson

Communities across the state are experiencing more heavy or “intense” precipitation events
(Fernandez et al. 2015). In order to gain further insight on storm intensity and frequency, we
analyzed the records from Farmington, a precipitation measuring station with a relatively long
record. As elsewhere in Maine, precipitation in Farmington has increased, and most
dramatically in the last two decades. A closer look at the Farmington data shows that most of
the increased volume (30 percent over previous decades) was due to more 1-inch and 2-inch
events, although large rain events of three or four inches have also become much more
common relative to the past. Intensity of precipitation has increased, and it is raining more
often. Farmington now experiences 10–15 more precipitation events in a year than during the
previous century.

Maine’s Climate Future 2020 update                                                                  10
Coastal locations are seeing even greater increases in storm precipitation intensity (Agel et al.
2015). Other studies have found increases in heavy precipitation across the northeastern U.S.
in the last two decades, mostly associated with September-October tropical cyclones
(hurricanes) and a warming Atlantic Ocean (Frei et al. 2015, Huang et al. 2017, Huang et al.
2018; see also NRCC 2019).

Charts: Precipitation at Farmington, Maine

Total decadal precipitation and mean annual number of precipitation events for Farmington, Maine
calculated from daily precipitation values, 1895-2014. Precipitation events are defined as days with
measurable (>0.01 in) rain or water equivalent snow. Each bin represents a 10-year mean, centered
on the year specified (i.e., 1900 represents data from 1895-1904). Data from the NOAA Global
Historical Climatology Network (NOAA GHCN).

Increased precipitation means increased volume of runoff to local streams, rivers, and
ultimately the Gulf of Maine (Vincent et al. 2015, Huntington et al. 2016). These higher flows
and floods can impact drinking water (Warner and Saros 2019) and damage roads, bridges,
and properties. Storms often include strong winds, such as the October 2017 event that was
the worst wind storm in Maine’s history (Jellig 2018). More than half a million people lost
electricity due to damaged power lines that cost Central Maine Power Company $69 million
(Russell 2018).

Maine’s Climate Future 2020 update                                                                     11
What about drought?
With an annual average of more than 45 inches of precipitation a year, Maine is often
considered a state with abundant water. However, we do experience dry periods and episodes
of drought, sometimes resulting in major impacts to agriculture, water resources, and
communities. For example, the multi-year drought that peaked in 1947 was associated with
the infamous catastrophic wildfire in Acadia National Park (NPS 2019).

Chart: Statewide Droughts

Statewide droughts based on the six-month Standardized Precipitation Index (SPI6), computed from
monthly precipitation values averaged across the state of Maine using climate division data, 1900-2018
(NOAA CAAG 2019). An index value of zero indicates average conditions, while negative values indicate
drier than average conditions. Drought severity is measured by both drought duration (here, the
number of months with SPI6 below 0) and associated cumulative precipitation deficit (the sum of
monthly departures of precipitation from average over the course of the drought, displayed here as a
percentage of annual average statewide precipitation).

Drought occurs when precipitation is lower than average for a few consecutive months,
seasons, or years, and climatologists use different measurements to study drought (Heim
2002). Based on the six-month Standardized Precipitation Index, which compares observed

Maine’s Climate Future 2020 update                                                                 12
precipitation over the past six months to the average precipitation over the same period,
Maine has experienced 35 statewide droughts since 1900. A six-month period relates to water
and soil conditions that influence agricultural crops, and captures the slow- developing or
“accumulating” nature of drought.

Some droughts are more severe than others. As the duration of a drought increases, so does
its associated precipitation deficit.

Drought can also be localized. For example, the recent drought of 2016, which was associated
with substantial impacts in southern Maine, appears as a rather modest event when viewed
using a statewide index. In contrast, the 2000–2002 drought was clearly more severe in both
duration and magnitude, and affected the entire state.

Maps: Local Drought Conditions, 2001 and 2016

Maps of the six-month Standardized Precipitation Index for September 2001 (left) and September 2016
(right) based on gridded precipitation data from NOAA. An index value of zero indicates average
conditions, while negative values indicate drier than average conditions. Positive values of the index are
associated with wetter than average conditions

Maine’s Climate Future 2020 update                                                                     13
When drinking water wells are affected by dry weather, drought can have a direct impact on
human health and safety (McGuire 2016). For farmers, dry conditions can cause hay and other
forage crops to mature earlier, slow pasture regrowth, increase rodent numbers, and delay
reproduction of insect pests, in turn changing monitoring and spray schedules. Drought, along
with problems from too much rain, are the leading causes of federal taxpayer-subsidized crop
insurance claims (Gustin 2018), costing the nation $74 billion between 2000– 2016. Droughts
are among the greatest stressors on forest ecosystems, and can often lead to secondary
effects of insect and disease outbreaks on stressed trees and increased fire risk (Clark et al.
2016, Vose et al. 2016).

As the climate warms, future droughts and periods of limited moisture are likely to worsen
with higher temperatures favoring increased drying. There is considerable uncertainty
whether drought will become more frequent in the future, presenting further challenges to
decision-making. More resources for addressing drought are becoming available for the public,
such as the National Integrated Drought Information System (NIDIS 2019).

Maine’s Climate Future 2020 update                                                                14
Winter is the fastest changing season.
From north to south, inland to the coast, the most warming has occurred in the winter, with
average minimum temperatures increasing 3.7 to 4.3 °F over the long-term.

Table: Temperature Changes by Climate Division, 1895-2018; increases over 100-
year average

                             Annual average
  Climate Division                               Maximum           Average            Minimum
                              Temperature

       Northern                      38.2°         +2.4”             +3.1”              +3.7”

        Interior                     42.5°         +2.6”             +3.3”              +4.0”

        Coastal                      43.8°         +2.5”             +3.4”              +4.3”

Average annual temperature by climate division, with change in maximum, average, and minimum
temperature, 1895-2018. Values based on monthly means from the NOAA U.S. Climate Divisional
Database (NOAA CAAG).Warming winter temperatures mean that more precipitation is falling as rain
instead of snow. Statewide average annual snowfall is estimated to have decreased by about 17
percent over the past century. A lesser downward trend of 3 percent is estimated since 1960, partially
attributed to increased moisture availability associated with warmer air.

Since the mid-1990s, there has been considerable variability, with winters of low snowfall
(e.g., 2004 and 2010) and high snowfall (e.g., 2008 and 2019). In addition, there can be
considerable local variability at specific stations when compared to the statewide trend shown
here. Northern Maine in particular diverges from the broader trend: the Caribou station shows
that January 2019 was the snowiest month on record (58.9") and 2018–19 winter season as a
whole was the third-snowiest on record since record keeping began in 1939 (NWS 2020a).

A recent analysis of temperatures and snow cover across the northeastern U.S. and Canada
during winter (November to May) found changes in many seasonal indicators in the region over
the last one hundred years, with fewer days of extreme cold, frost, snow, and ice, and more
frequent thaws and days with bare ground and mud (Contosta et al. 2019).

Maine’s Climate Future 2020 update                                                                   15
Graph: Maine Average Annual Snowfall, 1896-2019 Estimated annual snowfall, 1896-2019, averaged across Maine for the contiguous winter months November-April, with linear trends for the record period (dashed), and since 1960 (dotted). Values derived from monthly temperature and precipitation data from the NOAA U.S. Climate Divisional Database (NOAA CAAG), where snow precipitation is assumed for all months (November through April) with a mean temperature of less than 32 °F. An erratic frost in the spring, such as the one in June 2018 (Cooperative Extension 2018), can kill flowers that would have become fruit. “We didn’t used to have these unpredictable events,” wild blueberry specialist with Cooperative Extension Lily Calderwood told The New York Times.“We could rely on gradual and reliable growing seasons. Now it’s all starting to skip around, and these frost events come out of the blue” (Severson 2019). Photo: Jennifer D’Appollonio Maine’s Climate Future 2020 update 16
More and more, we seem to be experiencing “winter weather whiplash,” with rapid shifts from
freezing to thawing conditions, heat waves and rain in the depths of winter, and cold or snow
in spring and fall when the leaves are still on the trees (Casson et al. 2019). Arctic blasts
cause cold snaps and can contribute to major snowstorms during otherwise mild winters
(Francis and Skific 2015, Cohen 2016, Cohen et al. 2018, Zarzycki 2018, Harvey 2019).

Table: Changes in Winter Indicators
Over the last 100 years, the winter season in the Northern Forest region that includes Maine
has changed, as shown by:

 Decreased days of:                              Increased days of:

 Ice (max temp < 32): 5 fewer days               Thaw: 5 more days

 Frost: 13 fewer days                            Bare ground: 9 more days

 Snow: 10 fewer days                             Mud:10 more days

 Snowmaking: 12 fewer days                       Insect pest survival: 4–12 more days

Across the state, lakes are experiencing earlier ice-out, ranging from one day earlier at Eagle
Lake to more than three weeks earlier at Worthley Pond in western Maine, based on a small
subset of lake ice-out dates analyzed here and consistent with the findings of Hodgkins
(2013). There does not appear to be a geographic pattern to the changes for this set of lakes,
which likely reflects the relative dominance of local climate conditions and individual lake
characteristics.

Maine’s Climate Future 2020 update                                                              17
Map and Table: Earlier Ice-Out on Maine Lakes                                           Number of
                                                                                         days ice-
                                                            Map                           out has
                                                                    Lake name
                                                           number                         shifted
                                                                                          earlier

                                                             1      Worthley Pond          24.8

                                                             2      Crystal Lake           21.3

                                                             3      Togus Pond             17.7

                                                             4      Sabattus Pond          15.1

                                                             5      Sebago Lake            14.1

                                                             6      Green Lake             12.4

                                                             7      Cold Stream Pond       11.5

                                                             8      Maranacook Lake        11.0

                                                                    Cobbosseecontee
                                                             9                             10.8
                                                                    Lake

                                                             10     Damariscotta Lake      10.6

                                                             11     China Lake             10.4

                                                             12     Lake Auburn            10.3

                                                             13     West Grand Lake        9.5

                                                             14     Embden Pond            9.1

                                                             15     Cochnewagon Pond       9.1

                                                             16     Bryant Pond            8.8

                                                             17     East Grand Lake        8.7

                                                             18     Swan Lake              8.3

                                                             19     Phillips Lake          8.0

                                                             20     Moosehead Lake         7.8
Changes in ice-out date over the period of record for
lakes with data beginning 1960 or earlier. Ice-out dates     21     Messalonkee Lake       7.8
from the Bureau of Parks and Lands, US Geological            22     Wesserunsett Lake      7.7
Survey (Hodgkins and James 2002), and the Lake
Stewards of Maine.                                           23
                                                                    Pennesseewassee
                                                                                           7.1
                                                                    Lake

                                                             24     Rangeley Lake          6.8

                                                             25     Richardson Lakes       6.1

                                                             26     Thompson Lake          6.1

                                                             27     Wilson Pond            5.5

                                                             28     Sebec Lake             5.3

                                                             29     Kezar Lake             2.4

                                                             30     Aziscohos Lake         1.3

                                                             31     Eagle Lake             1.0

Maine’s Climate Future 2020 update                                                                18
Shorter winters and more extreme rain events are associated with greater tick and mosquito activity and abundance. Lyme disease remains by far the most pervasive problem, and is changing the way Maine people and visitors interact with the outdoors at work and play (Kevin 2018). Data from the Maine Center for Disease Control & Prevention’s Maine Tracking Network show mostly a continual rise in the number of reported cases of Lyme and other tick-borne disease (MCDCP 2019a). While the trend is for a clear increase over time, with more cases in southern and coastal Maine, year to year variation exists, with the slight decline in 2018 possibly a reflection of dry summer conditions that year (Lawler 2018). However, experts expect the rates of tick-borne diseases in Maine, including Lyme, anaplasmosis, babisiosis, Borrelia miyamotoi, and Powassan encephalitis to continue to increase overall into the future (Sarnacki 2019). The University of Maine Cooperative Extension Tick Lab (Cooperative Extension 2019a) now provides tick testing for disease in Maine and a wealth of information on detection and prevention. As we learn more about the spread of these diseases, we are also learning about the complexity of both the patterns of disease occurrence and reporting over time, and the underlying mechanisms of disease development (Elias 2019, Elias et al. 2019). Graph: Number of Tick-Borne Disease in Maine Cases of Lyme disease, Anaplasmosis, and Babesiosis reported to the Maine Center for Disease Control and Prevention, 2000–2018, and distribution of Lyme cases reported for 2018 by Maine county (MCDCP 2019a). Maine’s Climate Future 2020 update 19
Bar Chart: Number of Lyme disease cases by county

Distribution of Lyme cases reported for 2018 by Maine county (MCDCP 2019a).

Increased winter tick survival is linked to moose population
declines (Jones et al. 2019). Photo by Anne Lichtenwalner

Maine’s Climate Future 2020 update                                            20
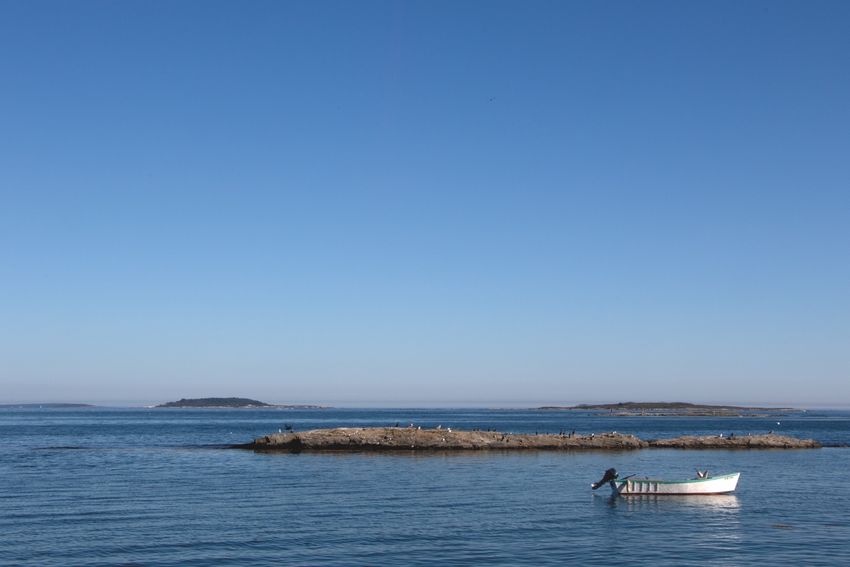
The Gulf of Maine is getting warmer.
The size and shape of the Gulf of Maine, combined with patterns of currents and
circulation, make it especially susceptible to marine heat waves (Mills et al. 2013, Chen
and Kwon 2018), which have increased in frequency, duration, and intensity around the
world (IPCC 2019b).

Graph: Gulf of Maine Temperature, 1895-2018

Average annual sea surface temperature, 1895-2018, averaged across the Gulf of Maine based on
monthly data from the NOAA Extended Reconstructed Sea-Surface Temperature Version 5 gridded
dataset (NOAA ERSST5), with linear trends for the periods 1895-2018 (dashed) and 1960-2018
(dotted).

Average annual sea surface temperature of the Gulf of Maine has increased 2.9 °F since
1895. The steepest temperature rise has occurred in recent decades, and “heatwaves”
occurred in 2012 and 2016 (Pershing et al. 2018).

The ocean can influence agriculture in the coastal region. Although multiple factors influence crop
yield trends over time, Birkel and Mayewski (2018) reported a correlation of blueberry yield
increases with increasing sea surface temperatures that resulted in a flow of more warm, moist air
onto coastal land. Photo: Allagash Brewing licensed under CC BY 2.0

Maine’s Climate Future 2020 update                                                               21
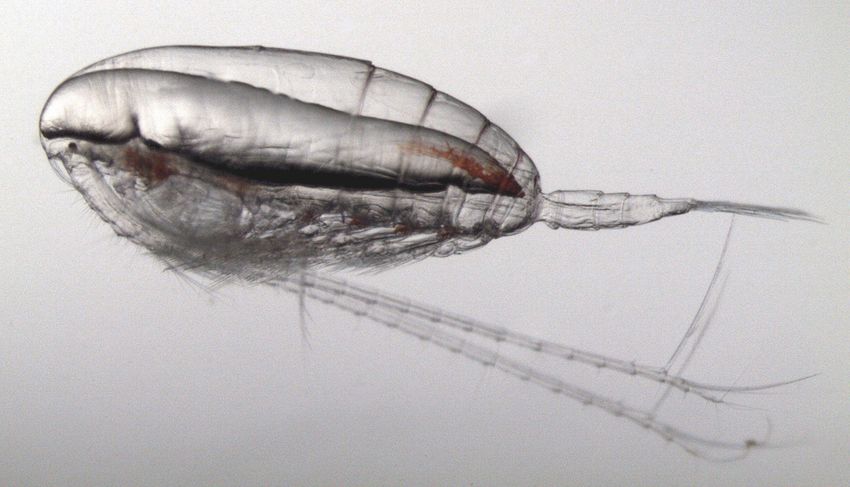
The Gulf of Maine has experienced a rate of warming that few marine ecosystems have
encountered (Pershing et al. 2015), and it is expected to continue warming at an above
average rate (Saba et al. 2016). There is a seasonality to the warming, with the greatest
temperature increase in the summer and early fall months, from June to October. This is in
contrast to temperatures on land, which show the greatest change in winter.

Summer conditions in the Gulf of Maine now last about two months longer than in 1982
(Thomas et al. 2017).

The recent warming has been linked to deep flows of warm, salty water into the Northeast
Channel (Townsend et al. 2015, Brickman et al. 2018, Record et al. 2019). Warmer
temperatures extend the period of stratification. With less mixing, fewer nutrients reach
the surface, a trend that could lead to a less productive Gulf of Maine (Balch et al. 2012,
Balch et al. 2016). Stratification also affects the timing and intensity of phytoplankton
blooms. During the recent warm period, spring blooms have been smaller while
phytoplankton abundance has increased in the fall and winter (Runge et al. 2015, Record
et al. 2018).

Warming has been linked to declining summer and fall populations of Calanus finmarchicus, a tiny
crustacean that is a critical part of the ocean food web and an important prey for everything from
right whales to larval lobster (Record et al. 2019). Photo: University of Maine

Maine’s Climate Future 2020 update                                                               22
The chemistry of the Gulf of Maine is changing.
Carbon dioxide absorbed by the oceans mixes with salt water to form carbonic acid,
resulting in “ocean acidification,” a condition of reduced pH and carbonate ion
concentrations. Acidification is intensified locally in coastal waters (“coastal acidification”)
from riverine inputs, and when algae blooms die and decompose due to nutrient pollution.
Acidic conditions reduce the availability of minerals, particularly calcium, needed by
organisms to build healthy shells.

Map: Coastal Acidification in the Northeast Region

Coastal acidification conditions in the Northeast (adapted from Figure 2, Gledhill et al. 2015). This
map provides a general illustration of ocean and coastal acidification conditions in the Northeast
based on the minimum monthly aragonite saturation state at the sea surface (minimum monthly
pixel-by-pixel averages between 2003–2010). Lowest values tend to occur in early spring. During
this period, values north of Cape Cod are generally between 1.2 and 1.5 (or frequently lower),
levels that are considered harmful to young shellfish.

Since 2003, Northeast Coastal Acidification Network (NECAN 2019) partners have
measured carbonate chemistry at coastal locations, and offshore from research vessels and
NERACOOS buoys (Gledhill et al. 2015). An analysis of data from several buoys in the
region adopting assumptions about past atmospheric CO2 values, concluded that corrosive

conditions, which did not exist prior to the industrial period, now occur in the surface

Maine’s Climate Future 2020 update                                                                  23
waters of the Gulf 11–31 percent of the time from late winter to spring with peak exposure
in February and March (Sutton et al. 2016). The complexities of the food web in the Gulf
of Maine complicate our ability to forecast the large-scale ecological effects of acidification,
which interacts with other stressors such as increasing temperature, decreasing salinity,
and depleted oxygen. Changes in temperature and salinity can have substantial effects on
acidification in the Gulf of Maine, leading some to conclude that it may take decades of
sustained measurements for an acidification-caused drop in pH to emerge from
background natural variability, thus highlighting the importance of long-term monitoring
(Salisbury and Jönsson 2018). Maine Ocean and Coastal Acidification Partnership (MOCA),
formed in 2016, has provided multiple forums for acidification research and information
and seeks (1) to implement recommendations of the Ocean Acidification Study
Commission authorized by the 126th Legislature, and (2) to coordinate the work of
governmental agencies and private organizations and citizens who are studying and
implementing means to reduce the impacts of or help adapt to ocean and coastal
acidification.

Photo: K Tenga-González

Maine’s Climate Future 2020 update                                                           24
Rising sea levels lead to more frequent flooding.
As warmer ocean temperatures and melting of ice sheets and glaciers cause the ocean to
swell and expand at accelerated rates, the water’s edge is higher along the coast and is
creeping inland (IPCC 2019b). The Gulf of Maine is especially susceptible to fluctuations in
sea level due to changes in the strength of the Gulf Stream and seasonal wind patterns.
Rates vary geographically due to local geology and topography, but all have accelerated
since 1990. For example, at Portland, the station with the longest record, the edge of the
water has risen 7.5 inches since record-keeping began in 1912. The overall average rate
for the full length of record to the present was 0.07 inches per year, but since 1990 the
rate has accelerated to 0.12 inches per year.

Graph: Sea Level Rise in Maine

Annual mean sea level from four long-term observation sites along the Maine coast. Data from the
Permanent Service for Mean Sea Level (Holgate et al. 2013, PSMSL 2019).

Higher sea levels mean that regular high tides are also higher, causing more frequent
“sunny day” or “nuisance” flooding, when coastal water levels reach or exceed two feet
above the long-term average daily high tide. In Portland, such floods historically
happened about five times per year, but lately occur 12 or more times a year, especially
during winter Nor’easters (Slovinsky 2019; Sweet et al. 2017).

Maine’s Climate Future 2020 update                                                            25
Increased coastal flooding threatens an estimated 198 miles of Maine roadway (Jacobs et
al. 2018) and more than 1,200 homes (UCS 2018). Tidal flooding caused by sea level rise
already has eroded $70 million in coastal real estate value. Kennebunkport, Saco,
Scarborough, Biddeford, and Bath have lost the most value (First Street 2019). All along
the coast, communities are confronting rising sea levels and planning for more frequent
storms and flooding (Corbin 2017), from evaluating the feasibility of developing a new
water supply to avoid salt water intrusion on Monhegan (Maine Coastal Program 2019), to
engineering a stronger waterfront in Stonington (Sambides Jr. 2019b), to studying how to
reinforce an eroding beach road in Phippsburg (Gates et al. 2018).

When storm waves and tides coincide with high tide, water levels can push the sea even
farther inland. The risk of storm surge extends many miles inland from the immediate
coastline in some areas. More than 20 percent of flood insurance claims come from outside
of high-risk areas, and even people living in “low risk” areas have been advised to obtain
flood insurance (UCS 2018).

During the January 4, 2018 Nor’easter,           Eastport has experienced a 44 percent
powerful storm waves occurred at the same        increase in potential for minor flooding (Ezer
time as high tide. Water levels in Portland      and Atkinson 2014). Photo: K Tenga-González
reached 13.8 feet, one of the three highest
tides ever recorded. The tide remained above
flood stage for nearly three hours, causing
millions of dollars in damage statewide
(Schmitt and Uteuova 2018). Photo: Corey
Templeton licensed under CC BY-NC-ND 2.0

Maine’s Climate Future 2020 update                                                           26
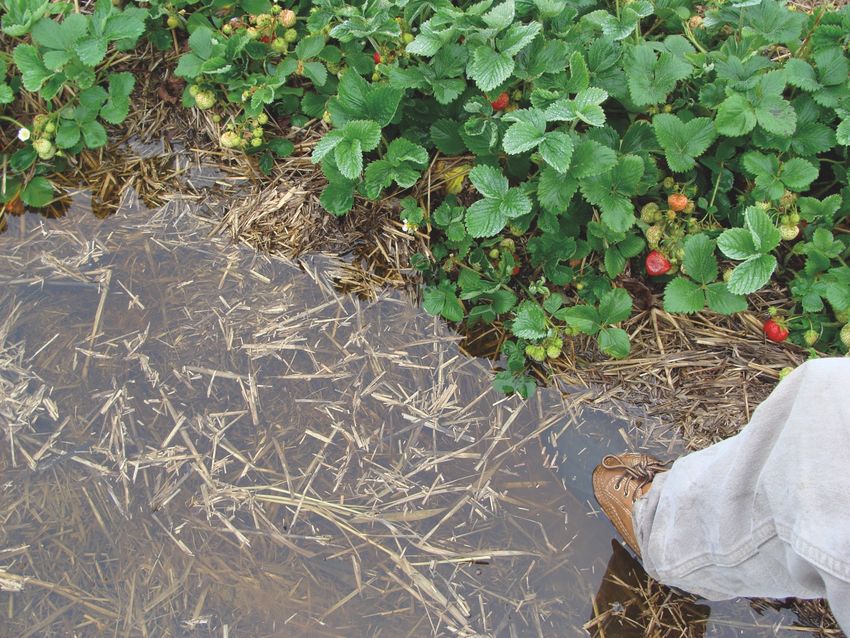
Maine’s Arctic Connections

Cartography: Margot Dale Carpenter, Hartdale Maps

Rapid warming in the Arctic can affect the weather we experience in Maine and conditions
in the Gulf of Maine (Schmitt 2017). As Arctic air warms, there is less of a temperature
difference between the North Pole and the continental United States, leading to weaker
westerly winds. Recent studies have suggested that weakened westerlies may lead to a
more wavy Jet Stream, so called “blocking” storm patterns, and Polar Vortex dips that
allow Arctic air, still very cold, to plunge into Maine in winter.

Maine’s Climate Future 2020 update                                                         27
Arctic warming has been associated with increased variability in winter temperatures
(“whiplash”) across the Northern Hemisphere’s middle latitude regions in recent years,
including more frequent cold spells and heavy snows in the northeastern U.S. (Cohen
2016, Cohen et al. 2018, Kretschmer et al. 2018). Arctic amplification may be contributing
to extreme winter weather, but the mechanisms are complex and remain an active area of
scientific study (Cohen et al. 2020).

Melting sea ice in the Arctic and melting glaciers and permafrost on land increase the flow
of water into the global ocean. The warm, fresher meltwater tends to stay at the surface.
Meltwater also warms and weakens the Labrador Current that flows into the Gulf of Maine
(via the Northeast Channel), allowing the Gulf Stream to bring warm water farther north.
Warm and cold water masses meet just south of the channel. Interactions between these
two currents affect the exchange of deep water, with more frequent pulses of warm salty
water, and the surface Gulf of Maine Coastal Current, altering the supply and distribution
of nutrients to the Gulf of Maine (Brickman, et al. 2018). The deep water exchange is
sensitive to the Atlantic Meridional Overturning Circulation (part of the “ocean conveyor
belt”) which has been weakening due to Arctic warming (Caesar et al. 2018).

Changes in the distribution of winds and sea-surface temperature across the North
Atlantic, and Gulf Stream position, are likely amplifying regional warming and precipitation
cycles, and have the potential to further affect seasonal shifts in the environment over the
coming decades (Saba et al. 2016, Thomas et al. 2017).

Changes in stratification and circulation cause shifts in phytoplankton and zooplankton,
affecting the food web that supports many species in the Gulf of Maine (Perretti et al.
2017, Record et al. 2019).

Maine’s Climate Future 2020 update                                                          28
Our growing weather vocabulary
The weather has always been a subject of interest to Maine people, and we could probably
consider ourselves specialists given the importance of the weather in all seasons for our
work and play. However, for many of us, climate change is bringing exposure to new
terms related to the weather. The use of a particular term in the news media does not
necessarily mean the phenomenon is something new, nor necessarily a product of climate
change. However, increased variability in the weather, weakening differentials between the
rapidly warming Arctic and the equator, warming oceans, and other elements of a
changing climate are indeed leading to increasing frequency of extreme events overall.
Here is a short list of traditionally uncommon terms that may become more common, and
what they mean. In brackets after each is an example from Maine.

Atmospheric Rivers: Long, narrow regions of the atmosphere that transport significant
amounts of water vapor into areas outside of the tropics (NOAA 2015). They produce a
flow of water equal to a major river, and if they stall in the atmosphere can cause
extreme rain and flooding [December 2013, Miller et al. 2018].

Bombogenesis, Bomb Cyclone: A mid-latitude cyclone (rotating system of clouds and
thunderstorms) that rapidly intensifies, dropping 24 millibars of atmospheric pressure in
24 hours [October 2017, McCrea 2017; see also NOAA-NOS 2019].

Flash Drought: A drought that develops rapidly, since droughts usually come on slowly
[Summer-Fall 2016, NOAA-NCDC 2016; see also Martin 2019].

Heat Index: A measure of how hot it really feels when relative humidity is factored in with
the actual air temperature [August 2018, Brogan 2018a; see also NWS 2020c].

Ice Storm: Generally occurs in winter when warm southerly winds from the Gulf of Mexico
ride up over cold northerly air masses near the land surface, with precipitation resulting in
an accumulation of ice on surfaces of a quarter-inch or more [January 1998, Dolce and
Erdman 2017; December 2013, Williams 2013; see also NWS 2020b].

Marine Heat Wave or Blob: Areas of ocean water with temperatures above the 90th
percentile for more than five consecutive days [2012, Mills et al. 2013; see also
marineheatwaves.org].

Nor’easter: Any significant storm with predominant winds flowing into Maine from the
Northeast (NWS 2019). The wind direction is determined by the center of the storm

Maine’s Climate Future 2020 update                                                          29
system (low atmospheric pressure = circulating counter-clockwise) tracking to our south.
These storms tend to form during the winter and bring with them blizzard conditions of
cold and snow, but they can also produce heavy rain [March 2018, NWS 2018; December
1969, Wikipedia 2019].

Polar Express, Arctic Express, Siberian Express, Cold Wave: When very cold polar
air plunges into the middle latitudes in a cold wave that may last multiple days. These
intense events are typically associated with a weak polar vortex, and can begin with the
passage of a strong cold front and abundant snowfall [December 2017-January 2018,
Samenow 2017; see also Dolce 2017].

Polar Vortex: Westerly winds circulating around and above the North and South poles
(NOAA 2019). The system varies between a strong polar vortex (strong westerlies) and
weak polar vortex (wavy jet stream) phases, with the wavy phase often occurring in
winter, allowing the intrusion of lobes of bitter cold air mass into Maine [February 2015,
Fritz 2015].

Photo: NOAA

Maine’s Climate Future 2020 update                                                           30
Air pollution is the force behind these changes—and also hurts
our health.
Accelerated atmospheric warming is the result of increased concentrations of the
greenhouse gas carbon dioxide (CO2) and other pollutants in the atmosphere. The

increase in CO2 has rapidly accelerated in recent years. Globally and in Maine, atmospheric

CO2 concentrations are now consistently above 400 parts per million (ppm) and vary

seasonally because plants take up CO2 through photosynthesis during the growing season.

Methane and nitrous oxide, though present at lower concentrations, are many times more
potent greenhouse gases than CO2 (EPA 2019) and their atmospheric concentrations are

also increasing in Maine.

4 Graphs: Increases in Greenhouse Gases

Global concentration of atmospheric carbon dioxide, 800,000 years ago to present in parts per
million (µmol mol-1) from a variety of data sources (A); EPA-GGE). Atmospheric carbon dioxide (B)
in parts per million (µmol mol-1); methane (C), and nitrous oxide (D) in parts per billion (nmol mol-
1
  ) measured at Argyle, Maine, 2003-2018 (NOAA-ESRL). This Earth System Research Laboratory
(ESRL) site is a collaboration between the University of Maine and the National Oceanic and
Atmospheric Administration.

Atmospheric CO2 acts as a “fertilizer” for essentially all plants, enhancing growth of

pasture grasses (Hristov et al. 2018) and forests (Norby et al. 2010, Loehle et al. 2016),
although over the long-term these effects could disappear when conditions get hotter,
wetter, or drier (Nowak 2017) or are limited by available nutrients (e.g., nitrogen) and
damaging effects of tropospheric ozone (Norby et al. 2010, Talhelm et al. 2014) and
thawing permafrost (Natali et al. 2019, Turetsky et al. 2019). Rising atmospheric CO2 is

also contributing to longer and more potent pollen seasons that have growing negative

Maine’s Climate Future 2020 update                                                                31
impacts on human health (Manangan et al. 2015, Zhang et al. 2015, Watts et al. 2018,
Climate Central 2019).

The Maine Department of Environmental Protection and Maine Center for Disease Control &
Prevention (MCDCP 2019b) provide information on air quality in Maine, and current local air quality
conditions can be tracked using the Climate Change Institute’s 10Green tool as noted in MCF 2015
(CCI 2019). 10Green includes current and historical data for carbon monoxide (CO), large
particulates (PM10), small particulates (PM2.5), ozone (O 3 ), nitrogen dioxide (NO 2 ), sulfur dioxide
(SO 2 ), heavy metals (As, Cd, Pb, Ni), greenhouse gases, and other pollutants such as benzene and
polycyclic aromatic hydrocarbons.

Burning fossil fuels releases additional air pollutants—ozone, lead, mercury, acid rain, soot—
that can cause health problems including asthma, kidney disease, diabetes, and bone
weakening. Air pollution disproportionately affects children and teenagers, older adults,
people who have low incomes, people who work or exercise outdoors, and people who live
or work near highways (Kotcher et al. 2019). Damages from lost labor hours and deaths
associated with worsened air quality and increases in extreme temperature are on the order
of billions of dollars in damage each year from climate change (EPA 2017). Hundreds of
public health organizations have issued an urgent call to action (Climate Health Action
2019) to address greenhouse gas emissions, calling climate change one of the greatest
threats to health America has ever faced and a true public health emergency (Harrington
2019; see also USGCRP 2016 and Watts et al. 2018).

Maine’s Climate Future 2020 update                                                                  32
2 Graphs: Acid Rain Trends

Total annual wet-only inorganic nitrogen (A) and sulfate (B) deposition, from three Maine
monitoring stations in the National Atmospheric Deposition Program (NADP). Data from an Oregon
monitoring station (without upwind pollution sources) shown for contrast

Reducing the burning of fossil fuels will reduce greenhouse gas emissions and improve air
quality overall. This is an attainable goal. Federal policies such as the 1990 Clean Air Act
Amendments resulted in dramatic declines in sulfur and nitrogen deposition in Maine
demonstrating how science-informed environmental policy can result in cost-effective
improvements in the environment. Indeed, Goyal et al. (2019) recently demonstrated that
the international cooperation that resulted in the 1987 Montreal Protocol allowed the world
to reduce chlorofluorocarbon (CFC) emissions resulting in recovery of the stratospheric

Maine’s Climate Future 2020 update                                                          33
ozone hole. This dramatically reduced human exposure to cancer-causing UV radiation,
and because CFCs are also greenhouse gases, this international treaty avoided significant
additional global warming we would have otherwise experienced, particularly in the Arctic.
There remains concern for the improved yet still elevated levels of air pollutants in Maine,
because we are downwind from major pollution sources in the Midwest and Northeast.
This concern is further heightened by recent trends (Popovich 2019) for weakening the
existing environmental regulations that allowed us to achieve air quality progress to date.
The possibility of beginning to reverse the progress in air quality is alarming, as recently
noted (PPH 2019). Even in a year like 2015, when every county in the U.S. met federal air
quality standards, we still experienced more than 30,000 premature deaths from air
pollution (Bennett et al. 2019).
Despite predictions for future declines due to
warming temperatures, red spruce have
shown evidence of improved growth,
attributed to decreases in acid deposition and
more favorable climatic conditions that could Declines in acid deposition have improved
persist in the short-term, particularly for red water quality in a majority of lakes and
spruce at high elevations (Kosiba et al. 2018). streams throughout Maine and the Northeast
Forests also may have benefited from (Rosfjord et al. 2017). However, changing
nitrogen deposition that was part of acid rain, water chemistry also has resulted in increased
but this could have been more important for dissolved organic carbon, thought to be
hardwoods than spruce (Patel et al. 2019). attributable to decreased soil acidity and
Photo: USDA adsorption of dissolved organic carbon, and
rising temperatures increasing the rate of
organic matter decomposition which has
implications for water quality and habitat in
Maine (Gavin et al. 2018). Photo: C Schmitt
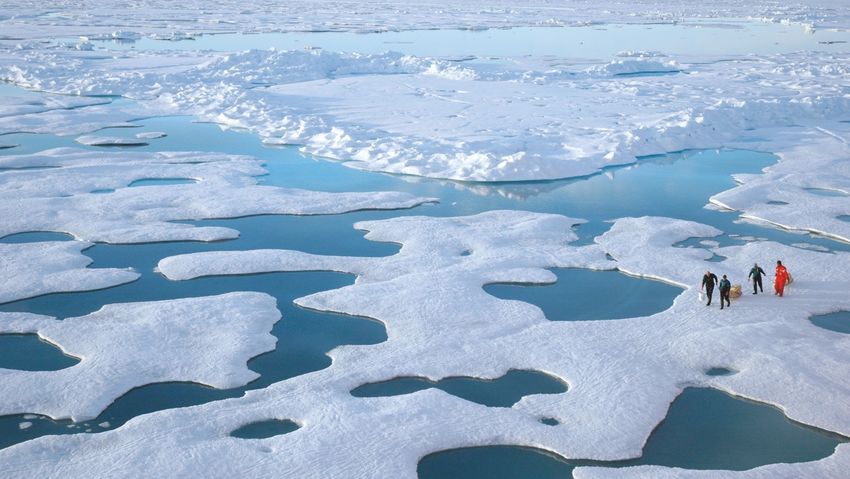
Maine’s Climate Future 2020 update 34The Great Acceleration Almost every metric or indicator of climate presented in this report is changing faster in recent years than in the past. The “great acceleration” we are experiencing in Maine is a global phenomenon, as each year smashes records set the year before (Steffen et al. 2015, Xu et al. 2018). The National Oceanic and Atmospheric Administration reported that July 2019 was the hottest month on record for the planet and polar sea ice melted to record lows. Arctic permafrost is rapidly melting, releasing greenhouse gases as it thaws (Box et al. 2018, Farquharson et al. 2019, Natali et al. 2019). From Antarctica to the Himalayas to Greenland, ice is disappearing into the ocean (Bevis et al. 2019, Maurer et al. 2019, Rignot et al. 2019), contributing to accelerated rates of sea level rise (Dangendorf et al. 2019). Mouginot et al. (2019) found a sixfold increase in the rate of Greenland ice melting since the 1980s, with half of the Greenland glacial melting contribution to sea level rise in just the last eight years. On August 1, 2019 Greenland beat the all-time single- day melt record (Duncombe 2019). A 40-year record of satellite observations of sea ice in Antarctica found that a decades-long increase in sea ice cover reversed in 2014, with Antarctic sea ice decreasing between 2014 and 2017 more rapidly than the more widely reported Arctic sea ice declines (Parkinson 2019). The year 2018 was the hottest on record for ocean temperatures, surpassing the previous hottest year for the world oceans, which was 2017 (Cheng et al. 2019a), and the rate of ocean warming continues to accelerate (Cheng et al. 2019b). The Gulf of Maine has been warming faster than 99 percent of the world oceans (Pershing et al. 2015, 2018). The big warm-up in the Gulf of Maine was from the mid-2000s to 2012. Since 2012 the trend is relatively flat, at least for surface data on a basin-wide average; 2019 was the coolest year of the last 10 years, yet still had heat wave conditions for brief periods during the summer and fall. When will the trend head back up, and what trajectory will it follow? These uncertainties were described in background papers for the Gulf of Maine 2050 conference in November 2019 and remain a priority uncertainty as we prepare for the future (Gulf of Maine 2050). There is also evidence that the changing climate, along with other human influences, is having profound impacts on other characteristics of our planet. Climate was noted as one of the key stressors by the Intergovernmental Science-Policy Platform on Biodiversity and Ecosystem Services that reported the accelerating loss of ecosystem health across the Maine’s Climate Future 2020 update 35
planet with approximately one million species threatened with extinction (Diaz et al.
2019). Evidence suggests that Maine is experiencing similar losses in biodiversity
(MacKenzie et al. 2019).

Improved climate models appear to be projecting a warmer future earth than previously
anticipated, suggesting many of the current projections may be underestimating the rate
of climate change. Xu et al. (2018) argue that we are underestimating the rates of future
warming because

 1) we are still increasing the emissions of greenhouse gases to the atmosphere;
 2) governments are cleaning up other air pollutants faster than are being accounted for
     in the climate models; and
 3) the planet may be entering a natural warm phase, and these three forces reinforce
     each other.

The implications of “acceleration” in this context are profound for Maine. Acceleration is
not just an increase, but an increase in the rate of change, meaning that we will be
increasingly challenged to keep up.

Photo: Jeremy Potter–NOAA licensed under CC BY 2.0

Maine’s Climate Future 2020 update                                                           36
Climate change and working Maine. The reality of a changing climate influences all aspects of Maine life. Given the natural resource-based economy of Maine, these are readily evident in farms, forests, fisheries, tourism, and recreation. The following additional insights are recent evidence of this emerging reality. Fields and farms There have been a number of efforts in recent years to conduct climate change assessments in agriculture in our region through more direct engagement with the experts: farmers, growers, and other practitioners such as technical advisors with a wealth of experience and expertise. These are the people increasingly talking about the novel characteristics and increasing uncertainty in the weather. The USDA Climate Hub conducted a national survey (Schattman et al. 2018, Wiener et al. 2018) of field staff in the Farm Service Agency and the Natural Resources Conservation Service detailing resources used by farmers and their concerns for specific climate and weather effects. Targeted weather products critical for managing crops and their pests, such as Ag Radar for apple growers (Cooperative Extension 2019b), are becoming increasingly important for agricultural operations. Indeed, improved weather forecasts are needed for everyone as variable “whiplash” conditions continue. Reduced snow cover could result in greater winterkill of crops even when average winter temperatures are increasing, especially in northern Maine. Changes in freeze/thaw patterns are likely to impact plant growth throughout the region, while warmer and wetter conditions increase problems associated with heat stress in dairy cattle and poultry (Walthall et al. 2012, Hristov et al. 2018). New England farmers have responded to impacts from wet and dry conditions in a variety of ways, including establishing raised bed systems, dividing fields into smaller parcels, adding berms, and planting fast-growing turf grass species to protect against erosion. They are selecting drought-resistant pasture grasses and eliminating vegetable crops that under-perform on heavy soils during cool, wet springs. Farmers are making investments and altering production practices, from purchasing four-wheel drive turf harvesters for driving on wet fields, to installing irrigation systems and using cover crops and other strategies to enhance “soil health” (Leslie 2017, White et al. 2018). Maine’s Climate Future 2020 update 37
Forests

Changing temperature, precipitation, and CO2 levels have direct effects on forests

(Janowiak et al. 2018). The long-lived nature of trees makes forest composition change
difficult to detect. However, there is evidence that the occurrence and abundance of sugar
maple, red maple, and birch all declined in recent decades, and American beech appears
to be gaining prominence in Maine forests, partly attributed to a changing climate (Bose et
al. 2017). Increasing American beech composition is generally viewed as an unwelcome
trend, given its susceptibility to beech-bark disease, its relatively low commercial value,
and its capacity to limit the regeneration of other more desirable forest species. Forest
land managers report observing increased insect pests and diseases, as well as warmer
winters and less snow cover (Reilly et al. 2020). Snow cover is important to the growth of
Maine trees like sugar maple (Reinmann et al. 2019) while cold minimum temperatures
historically prevented the spread of pests like Southern pine beetle, which has expanded
into New England as winters have warmed (Lesk et al. 2017, Dodds et al. 2018).

White pine needle disease is caused by a fungus that thrives in higher temperatures and humidity.
Wyka et al. (2017) reported that the best predictor of defoliation of white pine from this disease
was the previous year May, June, and July rainfall amount. Photo courtesy University of Maine

Climate also affects forests indirectly through altered, new, and interacting stressors. For
example, warming temperatures appear to contribute to the presence and magnitude of stress

Maine’s Climate Future 2020 update                                                              38
You can also read