Coltan, Congo & Conflict - POLINARES CASE STUDY The Hague Centre for Strategic Studies No 20 | 03
←
→
Page content transcription
If your browser does not render page correctly, please read the page content below
Coltan, Congo
& Conflict
POLINARES CASE STUDY
The Hague Centre for Strategic Studies No 20 | 03 | 13
HCSS helps governments, non-governmental organizations and the
private sector to understand the fast-changing environment and
seeks to anticipate the challenges of the future with practical policy
solutions and advice.
Coltan, Congo & Conflict
The Hague Centre for Strategic Studies (HCSS)

Rapport No 21 | 05 |13
ISBN/EAN: 978-94-91040-81-8

Project leader:
Marjolein de Ridder

Authors:
HCSS                    Fraunhofer ISI          Raw Materials Group           BGR
Artur Usanov            Luis Tercero Espinoza   Magnus Ericsson               Henrike Sievers
Marjolein de Ridder                             Masuma Farooki                Maren Liedtke
Willem Auping
Stephanie Lingemann

This research has received funding from the European Community’s Seventh Framework
Programme (FP7/2007- 2013) under grant agreement n° 244516 (POLINARES project).

© 2013 The Hague Centre for Strategic Studies. All rights reserved. No part of this report
may be reproduced and/or published in any form by print, photo print, microfilm or any
other means without previous written permission from the HCSS. All images are subject
to the licenses of their respective owners.

Graphic Design: Studio Maartje de Sonnaville, The Hague

The Hague Centre               Lange Voorhout 16          info@hcss.nl
for Strategic Studies          2514 EE The Hague          www.hcss.nl
                               The Netherlands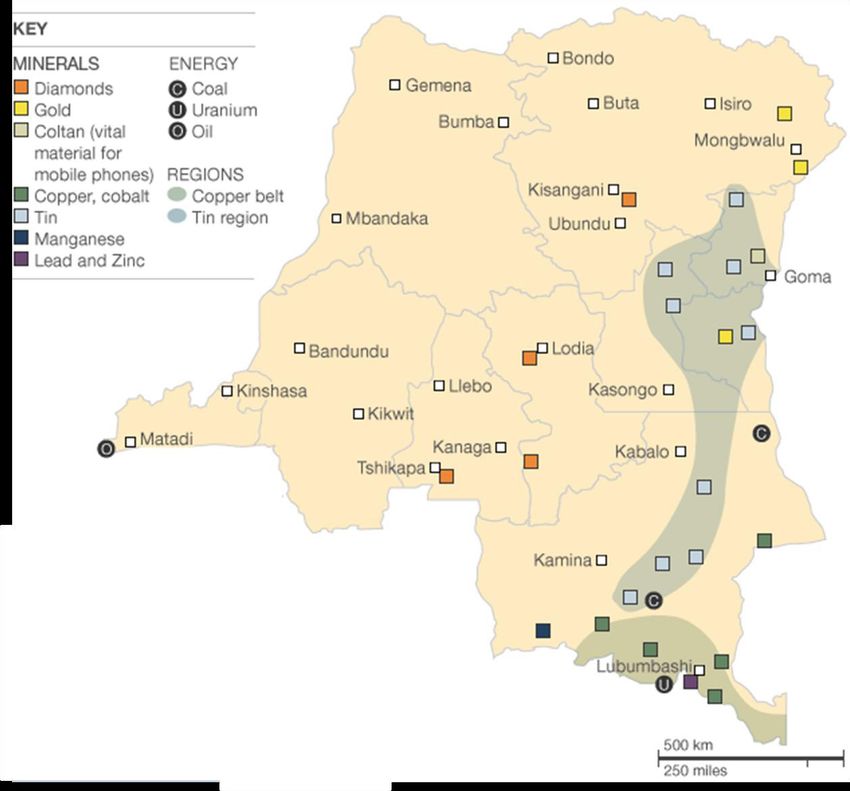
Coltan, Congo & Conflict
POLINARES CASE STUDY
The Hague Centre for Strategic Studies No 21 | 05 | 13
TA B L E O F C O N T E N T S

Table of contents

      Executive Summary                                                         9

      Introduction                                                           11

1     Key facts and figures about coltan and tantalum 15
1.1   Properties and uses of tantalum                                         15
1.2   The tantalum supply chain from mine to metal                            18
1.3   Price developments                                                      26
1.4   Environmental impact                                                    28

2     The Democratic Republic of Congo                                       29
2.1   Background information                                                  29
2.2   Brief history of conflict in the DRC                                    34

3     Coltan mining in the DRC                                               43
3.1   Coltan and tantalum resources in the DRC                                43
3.2   Tantalum mining before the First Congo War                              44
3.3   The first coltan mining boom                                            45
3.4   The second coltan boom                                                  47
3.5   Organization of coltan mining and trading during the booms              49

4     Coltan’s connections to the conflict in the DRC                        55
4.1   Coltan as a conflict mineral                                            55
4.2   The use of conflict minerals by armed groups                            57
4.3   Motivations of armed groups                                             61

5     Policy initiatives                                                     67
5.1   Brief review of policy initiatives                                      67
5.2   Main challenges facing coltan initiatives                               71

6     Conclusion                                                             85

                                                                   HCSS Report        5
TA B L E O F C O N T E N T S
Appendix A: Tantalum mining 89
Overview of operating or suspended industrial mines 89
Operational status of some major tantalum mines in 2012 91
Tantalum mining projects in the pipeline 92
Appendix B: Actors involved in DRC conflict 93
List of figures
Figure 1 Percentage share of category in tantalum processors’ shipments 17
Figure 2 The tantalum supply chain 19
Figure 3 Regional distribution of the most likely tantalum resources, 2010 20
Figure 4 Major tantalum mining sites 21
Figure 5 Global tantalum production, 1990-2011 (in tonnes of tantalum content) 22
Figure 6 The average year-end nominal tantalite spot price
(in US$ per kg of tantalum content) 26
Figure 7 GNI per capita in DR Congo as a percentage of GNI per capita
in Sub-Saharan Africa 31
Figure 8 Mineral deposits in the DRC 32
Figure 9 Political map of the DRC 34
Figure 10 Armed groups in the eastern DRC 39
Figure 11 Tantalum production in the DRC (in tonnes of tantalum content) 45
Figure 12 Tantalum price and production in the DRC, 2001-2010 (in tonnes) 48
Figure 13 Geographic distribution of tantalum production, 2007-2011 49
Figure 14 Share of the DRC and Rwanda in global production of tantalum 51
Figure 15 Distribution of armed groups’ estimated profits from trade
in 4 major minerals, 2008 56
List of tables
Table 1 Major uses of tantalum by industry 16
Table 2 Distribution of coltan revenues, c. 2000 52
Table 3 Major armed groups and sources of mineral revenue,1998-2003,
(Source: Nest, 2011) 60
Table 4 Major armed groups and sources of mineral revenue 2006-2008 61
Table 5 Exports of conflict minerals from North and South Kivus, in US$’000s 81
Table 6 Major mines for tantalum by state of operations 91
Table 7 Overview of actors involved in DRC conflict 93
HCSS Report 7EXECUTIVE SUMMARY
Executive Summary
In the early 2000s, tantalum – a rare metal with some unique properties that
make it an important raw material for information and communication
technologies – suddenly moved from obscure geological publications into a
wide public spotlight. Effective NGO campaigns using catchy slogans, such as
‘No blood on my mobile’, emphasized that consumer demand in the West for
mobile phones, computers, game consoles and other electronic devices, all
of which contain small amounts of tantalum, fueled mass atrocities in the
Democratic Republic of Congo (DRC).
The strong public attention on tantalum and coltan is somewhat puzzling.
Coltan is far from being the most important mineral that is mined in the DRC,
and the DRC has never been the main tantalum supplier to the global market.
This report therefore seeks to redress the largely mediatic coverage of the role
of coltan mining in the DRC conflict, contributing to a more informed analysis
of the relationship between the two.
The report was prepared as part of the POLINARES project, which aims to
examine the main global challenges surrounding access to fossil fuels and
mineral resources. First, it provides the main facts and data on tantalum,
such as its properties and uses, the supply chain from mine to metal, and price
developments. Next, the report gives a short historic overview of conflict in the
DRC which is followed by an overview of coltan and tantalum resources and
coltan mining in the country. Then, the report focuses on the specific role of
coltan in the present conflict in the DRC. It analyzes the involvement of armed
groups in the mining and mineral trade and touches upon the debate on greed
and grievances when assessing the motivations of armed groups. Finally, the
report gives an overview of the policy measures that were adopted or proposed
to mitigate the negative effects of coltan mining and trade on the conflict in
the DRC, and analyzes their effectiveness and efficiency.
HCSS Report 9EXECUTIVE SUMMARY
The report concludes that the importance of coltan as a source of revenue for
armed groups is often exaggerated. With the exception of a short-lived coltan
boom in 2000-2001, it was never a substantial source of funding for armed
groups. Although armed groups have profited from the DRC’s mineral wealth,
coltan was not the main instigator of the conflict in the DRC and was at most a
contributing factor.
Many policy initiatives aimed at breaking the link between mining, mineral trade
and conflict, including Section 1502 of the Dodd-Frank Act in the U.S., suffer
from problems related to both effectiveness and efficiency. First of all, there is
little convincing evidence that initiatives focusing on limiting the mineral reve-
nue of armed groups are likely to lead to a significant reduction of violence in the
DRC. We believe this is because many conflict mineral policy initiatives assume
that mineral revenues are the main reason behind the continued fighting in
eastern DRC. However, reducing the mineral revenue of armed groups primarily
addresses symptoms of a deeper problem. As long as the underlying reasons for
conflict continue to exist and the right governance structures to address griev-
ances are lacking, rebels will simply shift from trade in minerals to other sources
of revenue, such as taxing agriculture or foreign aid. There are obviously moral
reasons for reducing the mineral revenues of armed groups. However, even in
this case it is important to understand that challenges such as weak governance,
corruption and large compliance costs, might easily undermine their successful
implementation.
The main problem in the DRC is the weakness of governance and the inability
of the state to fulfill its basic functions. In such a context, ending the violence
requires a long-term and comprehensive approach that combines miltary,
political, and economic efforts, with a particular emphasis on building capable
and legitimate institutions, restoring the state’s monopoly on violence, and
promoting economic development that is not based on illegal activities.
10 Coltan, Congo & ConflictINTRODUCTION
Introduction
In the early 2000s, tantalum – a rare metal with some unique properties –
suddenly moved from being the subject of specialized geological and engineering
publications into a wide public spotlight. Effective NGO campaigns using catchy
slogans, such as ‘No blood on my mobile’, claimed that consumer demand in the
West for mobile phones, computers, game consoles and other electronic devices,
all of which contain small amounts of tantalum, fueled mass scale atrocities in
the Democratic Republic of Congo (DRC). In the eyes of the general public,
tantalum and coltan, a tantalum-bearing ore that is mined in the DRC, became
the most visible symbol of the link between the deadly conflict in the DRC and
the exploitation of mineral resources.
This case study on the link between coltan mining and armed conflict in DRC
was prepared as part of the POLINARES project funded by the European
Community’s Seventh Framework Programme (FP7/2007- 2013). The overall goal
of the project was to examine the main global challenges surrounding access to
fossil fuels and mineral resources. This study illustrates one particular aspect
of this broader problem; self-imposed constraints on access to certain minerals
in response to public and policy-maker sensitivity to potential links between
mining and human suffering or conflict. This moves away from the more
familiar problem, which was the main focus of past POLINARES projects,
namely when access to minerals is limited by actions of external actors. In the
future, self-imposed constraints on access to minerals may become a more
common instrument to ensure international compliance with basic standards of
environmental stewardship or labor conditions at mining sites. The question of
whether the use of such constraints is appropriate highlights the difficulty of
balancing the mutual economic benefits offered by mining to mineral producing
and consuming countries against the protection of core values concerning the
unacceptability of violence or forced labor.
HCSS Report 11INTRODUCTION
While this report does not offer any definitive answers to this question, it does
provide an illustration of the difficult trade-offs to be made between economic
and normative concerns through a case study of coltan mining in the DRC and its
connection with the ongoing civil conflict. It also demonstrates that there can be
unintended consequences of policy measures aimed at breaking the links
between coltan mining and conflict.
More specifically this report aims to answer the following research questions:
• What is the role of coltan mining in the conflict in the DRC?
• What are the main policy initiatives either proposed or put in place and what
are their (potential) impacts?
Tantalum and coltan were selected as the focus of this case study due to the large
amount of public attention that they have received. The fact that they became
the target of highly mediatized NGO campaigns is in itself somewhat puzzling.
Coltan is far from being the most important mineral that is mined in the DRC,
and the DRC has never been the main tantalum supplier to the global market.
This report therefore seeks to redress the largely mediatic coverage of the role
of coltan mining in the DRC conflict, contributing to a more informed analysis
of the relationship between the two.
It should be noted that publicly available data on reserves, production and
exports in the DRC are very unreliable. Figures from different sources often
show significant discrepancies. This is not particularly surprising given that
the country has been engulfed in one of the most devastating conflicts since the
end of the WWII. The tantalum market itself is not particularly transparent.
Therefore, one should interpret most figures in this chapter more as educated
estimates rather than precise measurements.1
The report is structured in the following way. Chapter 1 provides the main facts
and data on tantalum. It gives an overview of its properties and uses, discusses
1 For example, one the most prominent sources of data on the minerals market, U.S. Geological
Survey, notes in the ‘Mineral Yearbook 2002’ that ‘data on production [in the DRC] are
speculative and unreliable for estimating’.
12 Coltan, Congo & ConflictINTRODUCTION
the tantalum supply chain from mine to metal, including artisanal mining of
coltan in the DRC. Finally, this chapter touches upon developments in tantalum
prices which were an important trigger for coltan mining in the DRC and had
significant impact on the conflict. Chapter 2 includes background information
on the DRC and a short historic overview of conflict there. Chapter 3 then looks
specifically at coltan mining in the DRC. This chapter gives an overview of coltan
and tantalum resources in the country and it discusses the organization of coltan
mining during the first and second mining booms. Chapter 4 focuses on the
specific role of coltan in the present conflict in the DRC. It analyzes the
involvement of armed groups in mining and mineral trade, exploring the greed
and grievances model of assessing the motivations of armed groups. Chapter 5
gives an overview of the policy measures that were adopted or proposed to
mitigate the negative effects of coltan mining and trade on the conflict in the
DRC, and analyzes their effectiveness and efficiency. Finally, this report greatly
benefited from the expertise and multidisciplinary nature of the POLINARES
research consortium. The Hague Centre for Strategic Studies (HCSS) worked
together with the Bundesanstalt fur Geowissenschaften und Rohstoffe (BGR),
Raw Materials Group (RMG) and Fraunhofer Institute for Systems and Innovation
Research (ISI) on this report.
HCSS Report 13K ey facts and figures about coltan and tantalum
1 Key facts and figures
about coltan and
tantalum
Coltan is short for columbite–tantalite, a mineral containing the elements
tantalum and niobium. Niobium was formerly known as columbium, hence
the name columbite-tantalite. The commercial value of mined coltan is mainly
determined by its tantalum content. The chapter starts with an overview of
the properties and uses of tantalum, followed by a discussion of the tantalum
supply chain from mine to metal. The analysis pays special attention to artisanal
mining, as this is how coltan is mined in the DRC. The chapter closes with a
section on the developments in tantalum pricing.
1.1 Properties and uses of tantalum2
Tantalum is a rare metal with unique properties. Thanks to its high strength,
resistance to high temperatures and corrosion, ductility, inertness to the human
body and other properties, tantalum is used in many metal alloys and has
applications in numerous industries. Tantalum joined the group of commercially
useful elements in the last century. Despite the comparatively short history of its
technological use, tantalum is now a key enabler of our information and
communication-intensive society.
Since the 1960s the leading use of tantalum was as a powder or wire for capacitors
within the electronics industry. Capacitators are electrical components that are
used to store energy in an electric field. They are used in the electrical circuits
of many common electronic devices. The tantalum capacitor has a high
capacitance, which is the ability to store an electrical charge, per volume and
weight. This makes tantalum capacitors smaller and lighter than their
alternatives (for example, made from aluminum). Despite their higher price,
tantalum capacitors are widely used in mobile phones, computers and
automotive electronics, where saving on weight and space is important. An
average mobile phone, for example, contains around 40 milligrams of tantalum.
2 See also Luis A. Tercero Espinoza, Case Study: Tantalum in the World Economy: History, Uses and
Demand, POLINARES Working Paper N. 28 (Polinares, March 2012), http://www.polinares.eu/
docs/d2-1/polinares_wp2_chapter16.pdf.
HCSS Report 15K ey facts and figures about coltan and tantalum
Besides capacitors, tantalum is used in many alloys thanks to its high melting
point and resistance to corrosion. It is an essential component of many nickel-
based super alloys, which are used for highly stressed parts, such as the turbine
blades in aircraft engines and land-based gas turbines. Others uses of tantalum
include mill products for sputtering targets and chemicals for audio and video
components. Tantalum is also being used in the medical industry. Its chemical
inertness and non-irritant reaction to living tissue make tantalum ideally suited
for surgical instruments, pacemakers, implants and joint replacements. Table 1
gives an overview of the major uses of tantalum by industry.
INDUSTRY USAGE CHARACTERISTICS PRODUCT
Automotive Anti-lock brake systems, airbag High strength, Tantalum powder
activation systems and engine resistance to high
management modules temperatures
Ceramics & surface Ceramic capacitors, glass coating, High strength Tantalum oxide and
coatings camera lenses and X- ray films yttrium tantalate
Chemicals Chemical processing Ductile, resistance to Tantalum metal
corrosion
Construction Cathode protection systems for large High strength, Tantalum metal
steel structures such as oil platforms resistance to corrosion
and corrosion resistant fasteners such
as screws, nuts and bolts
Engineering Cutting tools Resistance to high Tantalum carbide
temperatures (carbides)
Electronics Capacitors, surface acoustic wave High and temperature Lithium tantalate,
filters for sensors and touch screen insensitive volumetric tantalum powder,
technologies, hard disk drivers and led capacitance, tantalum ingots and
lights thermodynamic stability tantalum nitride
Medicine Pacemakers, hearing aids and Bio-inertness Tantalum metal
prosthetic devices such as hip joints
Metallurgical Furnace parts, super alloys for jet Resistance to high Tantalum metal and
engines and rocket engine nozzles temperatures ingots
Military Missile parts, night vision goggles, Resistance to high Tantalum ingots and
and Global Positioning Systems (GPS) temperatures, High and oxide
temperature insensitive
volumetric capacitance
TABLE 1: MAJOR USES OF TANTALUM BY INDUSTRY 3
3 British Geological Survey (BGS), Niobium-Tantalum Commodity Profile, Commodity Profiles
(Nottingham: British Geological Survey (BGS), 2011).
16 Coltan, Congo & ConflictK ey facts and figures about coltan and tantalum
The fabrication of tantalum capacitors is reported to account for more than 60%
of tantalum demand in the United States (US) today.4 Other sources suggest that
globally the share of tantalum use for capacitors has decreased since 2004 from
42% to 24% while use of tantalum chemicals has increased from 14% to 36 %.5
The share of other categories has remained largely unchanged over the years (see
Figure 1).6
2005 2011
Tantalum
Chemicals
14% mill other
products 11%
other
of
mill 12% tantalum Tantalum
tantalum
products Carbide Chemicals
16%
of 9% 36%
tantalum
17% Capacitor tantalum
Capacitor
-grade ingot
-grade
tantalum 6%
tantalum tantalum
ingot powder
powder tantalum
7% 41%
24% Carbide
7%
Figure 1: Percentage share of category in tantalum processors’ shipments
FIGURE 1: PERCENTAGE SHARE OF CATEGORY IN TANTALUM PROCESSORS’ SHIPMENTS 7
Miners
Substitution
Traders
There are substitutes available for most applications of tantalum and its
compounds. The range of capacitance provided by tantalum capacitors, for
example, can be largely but not completely covered by aluminum-, ceramic-
Processors
or niobium-based capacitors. In particular ceramic and niobium capacitors
are replacing tantalum capacitors in many applications. The use of tantalum
Capacitor Sputtering target Alloy
Producers manufacturers producers
4 US Geological Survey, ‘Mineral Commodity Summaries 2012' (US Geological Survey (USGS),
January 24, 2012).
Circuit board Semi-conductor Component
assemblers manufacturers manufacturers
5 Tantalum-Niobium International Study Center and José Isildo de Vargas, Bulletin No 149, ISSN
1019-2026, March 2012, http://tanb.org/webfm_send/166.
6 Figure 1 is based on tantalum processors’ shipment data. Since the tantalum market is
OEM OEM
a relatively small and high-value market, stocks (e.g. of electronic companies) can be
significant. Therefore shipment data must be understood as a proxy for end-use statistics.
Figure
7 2 The tantalum supply
Tantalum-Niobium chain
International Study Center and José Isildo de Vargas, Bulletin No 149.
(Adapted from Global Advanced Metals)
HCSS Report 17K ey facts and figures about coltan and tantalum
in cemented carbides is in long-term decline.8 There are also substitutes available
for mill products (e.g. glass, titanium, niobium) and high-temperature
applications (e.g. niobium, tungsten, hafnium).
However, the use of substitutes is often coupled with reduced performance or
lower versatility. Tantalum capacitors offer the advantage of high reliability,
resistance to high temperatures and a broad range of capacitance. It is therefore
expected that tantalum capacitors will remain first choice for applications
requiring high reliability and resistance to elevated temperature and for which
cost is not a primary consideration.
Because of the strong competition from other materials for capacitors and
microelectronic applications it is expected that the consumption of tantalum
will not increase substantially in the future. This is supported by data from the
Niobium-Tantalum International Study Center (TIC) on tantalum processors’
shipments, which were at the same level in early 2010 as in 2004.9 This
development is also supported by the global production data of the United States
Geological Survey (USGS), which show that global production in 2010 was more
than 50% less than in 2004 (see Figure 5).
1.2 The tantalum supply chain from mine to metal
The supply chain for tantalum can be relatively lengthy and complex (see Figure
2), including multiple distributors and traders as well as miners and smelters.
This complexity can lead to issues in tracking the raw material back to the source
of supply. Insight into the tantalum supply chain is becoming increasingly
important in light of legislation and guidelines aimed at preventing the use
of conflict minerals.
8 US Geological Survey, ’Mineral Commodity Summaries 2012’; Volker Wischnat and Bettina
Renz, ’Wo Keramik Vorsprung Schaff t,’ E&E-Kompendium 2007/2008 (2007): 90–92; Roskill
Information Services, The economics of tantalum. (London: Roskill Information Services, 2009),
10.
9 Tantalum-Niobium International Study Center and José Isildo de Vargas, Bulletin No 149.
18 Coltan, Congo & Conflictproducts 11%
other
of
mill 12% tantalum Tantalum
tantalum
products Carbide Chemicals
16%
of 9% 36%
tantalum K ey facts and figures about coltan and tantalum
17% Capacitor tantalum
Capacitor
-grade ingot
-grade
tantalum 6%
tantalum tantalum
ingot powder
powder tantalum
7% 41%
24% Carbide
7%
Figure 1: Percentage share of category in tantalum processors’ shipments
Miners
Traders
Processors
Capacitor Sputtering target Alloy
Producers manufacturers producers
Circuit board Semi-conductor Component
assemblers manufacturers manufacturers
OEM OEM
Figure 2 The tantalum supply chain
(Adapted from Global Advanced Metals)
FIGURE 2: THE TANTALUM SUPPLY CHAIN
(ADAPTED FROM GLOBAL ADVANCED METALS)
Resources and reserves
Tantalum is a metallic element that is present in the Earth’s crust in a vast array
of minerals. Tantalum often occurs with the element niobium (previously known
as columbium). The most important tantalum-niobium containing mineral
concentrates are tantalite and niobite (also known as columbite). These mineral
concentrates are chemically similar but contain respectively more tantalum or
niobium. Coltan is an abbreviation for columbite-tantalite that is only used in
parts of Africa or as a nickname for this specific mineral. Other minerals in
which tantalum occurs are microlite, tapiolite, wodginite, struverite and
pyrochlore.
Tantalum resources and reserves are geographically widespread. According to
R. Burt, the former president of the TIC, the most likely tantalum resources are
estimated at 260,000 t.10
10 Burt, R, ’Tantalum - a Rare Metal in Abundance?,’ T.I.C. Bulletin, 2010.
HCSS Report 19K ey facts and figures about coltan and tantalum
Other Africa North America Europe
Central Africa 7% 2% 0,7%
9%
South America
41%
Russia & Middle
East
10%
China & South-East
Asia
10%
Australia
21%
Figure 3: Regional distribution of estimated tantalum resources, 2010
(Source:
FIGURE Burt, 2010)DISTRIBUTION OF THE MOST LIKELY TANTALUM RESOURCES, 2010
3: REGIONAL
(SOURCE: BURT, 2010)
Lovozero
Orlovka
Tanco
Figure 3 shows the distribution of the most likely tantalum resources by
Ma Ar Kan Yichun
geographic region. The largest indicated and measured (or known) tantalum Nanping
resources in the world are found in South America (106,000), mainly in Brazil;
and in Australia (53,900). Kenticha
Thailand
Malaysia
Pitinga
Reserves are the part of the resources that can be economically extracted using
Mibra
Wodgina
existing technologies at the time of determination. Tantalum reserves are quite
Marropino Greenbushes
significant and do not suggest Areaany geological
with artisanal production constraints on tantalum
production at least in the medium-term perspective. Global tantalum reserves
(Semi-) industrial producer
Suspended / care & maintenance
amounted to 120,000t in 2012 according to the USGS.11 One metric that can be
Figure
used to 4:compare
Major tantalum mining sites availability of different minerals is the reserves
the geological
to(Source:
production ratio. For tantalum this ratio suggests that there are more than
BGR, 2010)
130 years of available supply (using the average primary production of tantalum
in 2007-2011 of circa 910 tonnes). This is much more than for many other
minerals.
11 USGS, Mineral Commodity Summaries 2012: Tantalum, Mineral Commodity Summaries (USGS,
2012), http://minerals.usgs.gov/minerals/pubs/commodity/niobium/mcs-2012-tanta.pdf.
20 Coltan, Congo & ConflictChina & South-East K ey facts and figures about coltan and tantalum
Asia
10%
Australia
21%
Figure 3: Regional distribution of estimated tantalum resources, 2010
(Source: Burt, 2010)
Lovozero
Orlovka
Tanco
Ma Ar Kan Yichun
Nanping
Thailand
Kenticha Malaysia
Pitinga
Wodgina
Mibra
Marropino Greenbushes
Area with artisanal production
(Semi-) industrial producer
Suspended / care & maintenance
Figure 4: Major tantalum mining sites
FIGURE 4: MAJOR TANTALUM MINING SITES
(Source: BGR,
(SOURCE: BGR,2010)
2010)
Tantalum mining
The tantalum supply chain starts with the mining of tantalum-containing ores.
Conventional and artisanal and small-scale mining (ASM) takes place around
the world. Figure 4 shows where tantalum mining takes place globally. The Great
Lakes region is the center of tantalum mining in Africa with the DRC being the
largest African producer. Most of tantalum mining in Africa is artisanal and
small-scale. The major exeptions are the Marropino mine in Mozambique and
the Kenticha mine in Ethiopia.
HCSS Report 21K ey facts and figures about coltan and tantalum
1600
1400
1200
Rest of the
1000 World
Africa
800
Brazil
600
Australia
400
200
0
2007
1990
1991
1992
1993
1994
1995
1996
1997
1998
1999
2000
2001
2002
2003
2004
2005
2006
2008
2009
2010
2011
Figure 5 Global tantalum production, 1990-2011 (in tonnes of tantalum content)
FIGURE 5: GLOBAL TANTALUM PRODUCTION, 1990-2011 (IN TONNES OF TANTALUM CONTENT)
(Source:
(SOURCE:USGS data)
USGS DATA)
700
600
Figure 5 shows the fluctuations in global production over time from 1990 to 2010
and
500
the relative contributions of Australia, Brazil, and Africa. Existing mining
operations respond relatively quickly to changing market conditions (see
400
Appendix A for an overview of past, present and planned mining projects). When
demand
300
and prices are low, mines are closed only to be reopened again when
demand picks up and prices rise. The global economic crisis slowed demand for
200
tantalum and led to the temporary closure of some of the largest tantalum mines.
100
In the fall of 2008 as the global financial crisis reached its apogee, the demand for
0
tantalum from electronic industries started to fall. Consequently this led to the
1970 1975 1980 1985 1990 1995 2000 2005 2010
closure of several mines in Mozambique, Canada and Australia. Talison Minerals
Pty (now
Figure 6: Theknown as Global
average year-end Advanced
nominal tantalite Metals), theUS$
spot price (in largest
per kg global producer
of tantalum content) of
1
tantalum, for example,
(Based on USGS data) decided to close down production at the two largest
Australian tantalum mines, Wodgina and Greenbushes, in December 2008.12 In
2009, after the closure, Australia’s share of global tantalum production fell to
10%. Next year, in 2010, no tantalum at all was produced in Australia.13 In 2009,
the Tanco mine in Canada and the Marropino mine in Mozambique were also
12 Swiss Metal Assets, ’Dodd-Frank, Australian Cuts Threaten Tantalum,’ Swiss Metal Assets,
February 14, 2012, http://www.swissmetalassets.com.
13 Raw Materials Group, ’Raw Materials Data - Tantalum,’ Raw Materials Data (RMD) - Metals, Iron
Ore and Coal Database, 2012, http://www.rmg.se/index.php?option=com_
content&task=view&id=25&Itemid=89.
1
Price of tantalite ore is typically reported by trade journals in US dollars per pound of tantalum pentoxide content. It was converted by the
USGS into US dollars per tonne of contained tantalum. These, however, are not prices for refined tantalum, which are obviously significantly
higher.
22 Coltan, Congo & ConflictK ey facts and figures about coltan and tantalum
temporarily closed.14 As a result, global production of tantalum dropped by 40%
from 1270 tonnes in 2008 to 764 tonnes in 2009. Most mines re-opened in the
course of 2010 and 2011. In 2011, an estimated 790 tonnes of tantalum ore were
mined.
Artisanal mining
Artisanal and small-scale mining (ASM) is done by individuals, family units,
worker cooperatives or small companies with minimal or no mechanization,
often informally or illegally.15 Not every mineral is suitable for artisanal mining.
Geological factors that support economies of scale and mechanization
(uniformity of deposit, width of ore bodies, depth, overburden) tend to render
ASM unprofitable. On the other hand, small deposits and irregular ore bodies
create economic opportunities for ASM.
The most important factor for the economic competitiveness of artisanal mining
is a high value per unit of weight of the ore mined. Coltan is a quite valuable
material in this respect with prices having exceeded US$100 per kg of tantalum
content. It is therefore no coincidence that artisanal mining accounted for more
than a quarter of total global production of tantalum in 2009, which is one of the
highest percentages compared to other metals.16 Since ASM is based on extensive
use of labor, low wages are also essential for its economic competitiveness.
Finally, the factors that make large mining investment more expensive or risky
also make ASM comparatively more attractive. Such factors might include
remote location of deposits, difficult terrain, absence of infrastructure (roads,
electricity, water), and high political risk including lack of rule of law.
Compared to industrial mining artisanal mining is a less capital-intensive
method of mining. Other featuress of ASM include flexibility and a fast response
time. For a large industrial mine it typically takes many years to bring the mine
into production, while mines developed by artisanal miners can often start
producing in a few days. The ability of artisanal mining to react quickly to
14 Globe Metals & Mining, ’Globe Metals & Mining - Tantalum,’ Globe Metals & Mining, 2012,
http://www.globemetalsandmining.com.au/Commodities/Tantalum.aspx#.UIhivVFqCxV.
15 Dorner, U., G.Franken, M.Liedtke and H.Sievers, Artisanal and Small-Scale Mining (ASM),
POLINARES working paper n.19, March 2012., p.1
16 Dorner, U., G.Franken, M.Liedtke and H.Sievers, Artisanal and Small-Scale Mining (ASM),
POLINARES working paper n.19, March 2012., Figure 3.
HCSS Report 23K ey facts and figures about coltan and tantalum
changes in the market comes from the fact that artisanal miners typically do not
have labor contracts with fixed wages but are paid or a fixed percentage of their
production. Economically it means that these entrepreneurs bear all market risks
themselves. If mineral prices drop significantly some of them will abandon
mining because it becomes less attractive and switch to other economic
activities. Thus the supply side of the coltan market in the DRC is close to what
economists call ‘perfect competition’ with many small price-taking producers.
Primary and secondary production
In addition to specialized tantalum mining, tantalum is also produced from tin
slag and scrap. Tin slag is a by-product of tin smelting. Over the last decade tin
slag has accounted for up to 20% of total tantalum supply.17 Tantalum, and other
metals, can be produced from different sources of scrap metal. There is scrap
from manufacturing (i.e. new scrap) and scrap from products at the end-of-life
(i.e. old scrap). New scrap is the most widely available and most tantalum scrap is
generated during the manufacturing of electronic components, cemented
carbides and superalloys.18 The recycling efficiency, and ultimately also the share
of recycled tantalum in the total tantalum consumption, is determined by the
amout of tantalum in scrap; tantalum prices; previous industrial experience; and
available technologies for processing scrap. 19
The economic crisis and the shutting down of major mines has had a significant
impact on the relative shares of primary and secondary production. Before 2008,
60% of tantalum supply came from primary concentrates, a further 10% each
from secondary concentrates and from tin slag. The final 20% of global
production was accounted for by scrap recycling. Post-2008, the share of
production coming from primary concentrates dropped sharply to 10% in 2010,
recovering to 27% by 2011. To compensate for the gap, tantalum production from
tin slag and scrap increased.
17 Roskill Information Services Ltd, The Economics of Tantalum.
18 USGS, Tantalum; TIC, ’Critical raw materials for the EU - Report of the Ad-hoc Working
Group on defining critical raw materials,’ 2010, http://ec.europa.eu/enterprise/policies/
raw-materials/files/pc-contributions/org-050-tantalum-niobium-international-study-center-
tic_en.pdf.
19 TIC, ’Critical raw materials for the EU - Report of the Ad-hoc Working Group on defining
critical raw materials’; Larry D. Cunningham, Tantalum Recycling in the United States in 1998
(USGS, 1999), http://infohouse.p2ric.org/ref/45/44147.pdf.
24 Coltan, Congo & ConflictK ey facts and figures about coltan and tantalum
Concentration
After mining, tantalum-containing ores are concentrated at or near the mine site
to increase the share of tantalum oxide (Ta2O5) in the concentrate. Tantalum ore
traded on international markets should contain a minimum of 30% of Ta2O5. Ores
with lower grades of a minimum 20% Ta2O5 may be acceptable to some buyers.
Trading and processing
The next step in the supply chain after mining is the trading and processing
of tantalum. Tantalum is usually traded in three forms: as ore concentrate, as
tantalum oxides and salt, or as capacitor-grade tantalum. Tantalum is not traded
on an open exchange, such as the London Metal Exchange. Instead, negotiations
take place on a bilateral basis between buyers and sellers around the world.
Prices are privately discussed and purchase contracts between buyer and seller
are confidential. Large shares of tantalum are sold through long-term contracts
with fixed prices. The Advanced Metallurgical Group (AMG), for example, is
one of the largest producers of tantalum concentrate. By March 2011, AMG had
already sold all its tantalum production until the end of 2012 by entering into
supply agreements at fixed prices with its traditional customers. Price data for
tantalum are only availale through subscriptions to mineral price data firms
(such as Asian Metal, Metal Pages, Platts and Ryan’s Notes) which construct
market prices based on reporting by firms and industry sources.
Traders subsequently ship the tantalum concentrates to processers. The
processors extract the tantalum from the concentrates and then sell the refined
material to producers of capacitors, sputtering targets and alloys, who in turn
supply circuit board assemblers, and manufacturers of semi-conductors and
components. They subsequently sell their products to original equipment
manufactures (OEMs), which constitute the end of the global tantalum supply
chain.
Previously, many processors and other buyers of tantalum products relied on
inventories built up by the industry and the US Defense National Stockpile
Center (DNSC). For a long time, the DNSC was a significant supplier – and
between 2001 and 2007 even the second largest supplier – of tantalum ore to the
processing industry. By 2009 the strategic stockpile of tantalum of the US was
exhausted and sales have stopped. The remaining quantity of tantalum ore is no
HCSS Report 25K ey facts and figures about coltan and tantalum
1600
1400
1200
Rest of the
1000 World
Africa
800
longer of any significance.20 Before the early 2000s, the tantalum industry also Brazil
600
held substantial inventories of tantalum ore. Most of these inventories, however,
Australia
have
400now also been exhausted, such as the Global Advanced Metals inventory. 21
200
1.3 Price
0
developments
Like the prices of other minerals, prices for tantalum ore are mainly influenced
2007
1990
1991
1992
1993
1994
1995
1996
1997
1998
1999
2000
2001
2002
2003
2004
2005
2006
2008
2009
2010
2011
by developments in the supply of and demand for products in which it is used.
Published spot prices for tantalite ore have shown long-term stability
Figure 5 Global tantalum production, 1990-2011 (in tonnes of tantalum content)
interrupted by very sharp price jumps (see Figure 7).
(Source: USGS data)
700
600
500
400
300
200
100
0
1970 1975 1980 1985 1990 1995 2000 2005 2010
1
Figure 6: The average year-end nominal tantalite spot price (in US$ per kg of tantalum content)
FIGURE 6: THE AVERAGE YEAR-END NOMINAL TANTALITE SPOT PRICE (IN US$ PER KG OF TANTALUM
(Based on22USGS data)
CONTENT)
(BASED ON USGS DATA)
20 Papp, J.F., ’Niobium (columbium) and Tantalum - 2008.,’ in U. S. Geological Survey Minerals
Yearbook - 2008. (U. S. Geological Survey, 2010), 52.1–52.14.; Roskill Information Services Ltd,
The Economics of Tantalum.
21 Papp, J.F., ’Niobium (columbium) and Tantalum - 2008.’; Roskill Information Services Ltd, The
Economics of Tantalum.
22 Price of tantalite ore is typically reported by trade journals in US dollars per pound of
tantalum pentoxide content. It was converted by the USGS into US dollars per tonne of
contained tantalum. These, however, are not prices for refined tantalum, which are obviously
significantly higher.
1
Price of tantalite ore is typically reported by trade journals in US dollars per pound of tantalum pentoxide content. It was converted by the
USGS into US dollars per tonne of contained tantalum. These, however, are not prices for refined tantalum, which are obviously significantly
higher.
26 Coltan, Congo & ConflictK ey facts and figures about coltan and tantalum
The first price surge occurred from 1978 to 1980 when average prices rose from
about 66 US$/kg in 1977 to over 284 US$/kg in 1980 (these are nominal average
prices at the end of the year as reported by the USGS). This price hike was largely
brought about by panic buying influenced by shortages of supply and expected
increases in tantalum demand for electronic components. Large tantalum
inventories were built up during this period. The tantalum surplus in
inventories, substitution and recycling of electronic components resulted in
decreasing prices in 1982.23
The second rapid escalation in tantalite prices occured in 1988 when tantalum
prices almost doubled from about 70 US$/kg in 1987 to 135 US$/kg in 1988. This
price peak was due to increased tantalum demand and depleted tantalum
inventories.
The third price boom led to record tantalite price levels in 2000. From 1999 to
2000, prices rose more than six-fold – from 91 to 590 US$/kg due to expectations
of high demand in the electronic industry, over-ordering and apparent shortage.
Again, the price peak was short-lived and prices crashed in 2001, as a result of
excess stocks combined with a downturn in demand from the electronics sector,
due in part to substitution of tantalum capacitors in some applications. As
during the previous coltan boom, large inventories were built up again.
Finally, after the period of quite stable prices in 2001-2010, in 2011 tantalite prices
surged to 340 US$/kg, more than the double level of 2010 or triple of 2009. It is
probably too early to single out specific factors driving the current price surge
but most likely that significant cuts in mine production (see Figure 5) have
played a substantial role.
Price fluctuations have played a major role in the development of coltan mining
in the Congo. The price spike of 2000 had especially significant effect on coltan
mining in the DRC, and the closure of industrial mines in 2008 due to the
economic downturn enabled artisanal mining in the DRC to florish.
23 Cunningham, Tantalum Recycling in the United States in 1998.
HCSS Report 27K ey facts and figures about coltan and tantalum
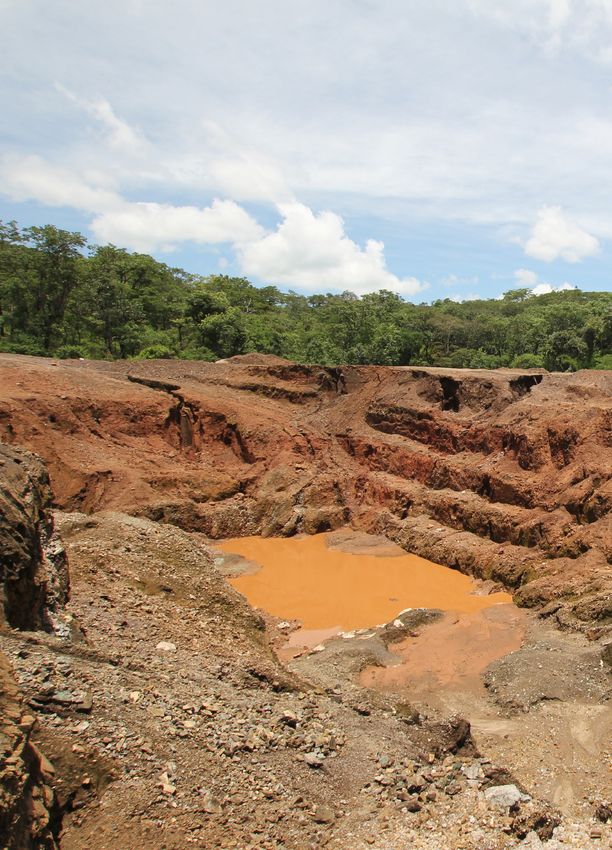
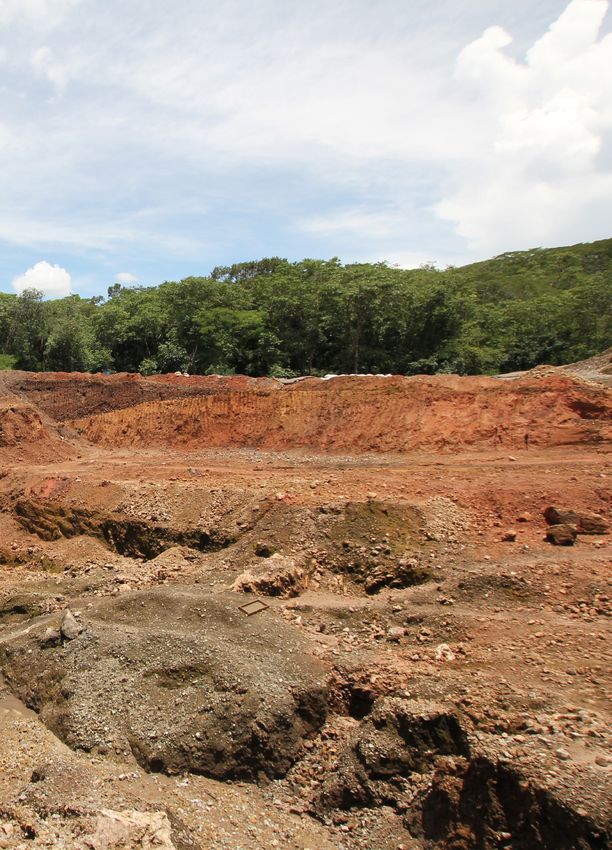
1.4 Environmental impact
Mining of coltan can cause environmental damage through the deterioration of
landscapes. In the DRC, one of the concerns has been large-scale deforestation:
miners are chopping down forests to make land available for mining and living-
space. Wood is also needed to build mining sctructures and camps near the mine
sites, and as firewoord for cooking and heating. Deforestation has had several
negative effects on plant and wildlife. The rapid development of mines has
put rare plant species at risk and destroyed the natural habitat of the gorilla.
Deforestation has also contributed to soil erosion and subsequently to silting
in rivers.
Further down the supply chain, the transportation of tantalum-containing
minerals requires care, as these minerals often contain somewhat elevated levels
of naturally occurring thorium and uranium, usually high enough for them to be
classified as radioactive for handling and transport. It is the responsibility of the
producer or trader to assess the presence of such materials and to certify whether
the material is radioactive or not.
In solid form, tantalum poses no particular environmental problems. The US
Center for Disease Control (CDC) classifies tantalum dust as a material with a low
order of toxicity. If the smelting and refining, cutting, grinding, metaling or any
other operation generates dust or fumes, exposure to airborne material should be
monitored. Metal powder or dust may have a significant impact on air and water
quality. Emissions, spills and releases into the environment should be controlled
immediately.
28 Coltan, Congo & ConflictT he D emocratic R epublic of C ongo
2 The Democratic Republic
of Congo
This chapter provides background information on the Democratic Republic
of Congo (in this report it is abbreviated as the DRC but can also be referred
to as DR Congo or the Congo). First, it briefly describes the demographic and
economic situation in the DRC, which is relevant for understanding the causes
and context of conflict in the country. Next, it provides a short historic overview
of recent conflict in the DRC and the various contributing factors. Appendix B
contains a list of the key people and groups involved.
2.1 Background information
The DRC is a country located in Central Africa. It covers an area of 2.3 million km2
which makes it the second largest country in Africa (after Algeria) and the largest
country in Sub-Saharan Africa.24 In terms of territory, the DRC is as large as the
five largest member states of the EU put together (France, Spain, Sweden,
Germany and Finland).
Population
The DRC’s population – the third largest in Africa – is estimated at 73.6 million
and is growing rapidly. The population has more than doubled since the last
census of 1985 when it was only 34.7 million. The total fertility rate in the DRC
(i.e. the average number of children that will be born to a woman in her lifetime)
has been falling rapidly but was still six in 2008. 25 The DRC’s population is
ethnically diverse, containing more than 200 distinct ethnic groups. In addition
to French, which is the official language, there are four recognized national
languages – Lingala, Kikongo, Kiswahili, Tshiluba – and various local languages
24 Unless specifically noted otherwise general data on the DRC in this sub-section are from
World Bank’s World Development Indicators database, http://data.worldbank.org/data-
catalog/world-development-indicators
25 CIA World Factbook, https://www.cia.gov/library/publications/the-world-factbook/geos/
cg.html
HCSS Report 29T he D emocratic R epublic of C ongo
and dialects.26 Many Congolese have a strong sense of identity based on a their
ethnic (and often sub-ethnic) group.27 Such groups exist in every province of the
DRC. Rivalry between different ethnic groups was at the origin of multiple
rebellions that took place in the early 1960s.
Economic performance
The economic performance of the DRC has been disastrous and the current
standard of living is extremely low. Figure 7 shows the development of gross
national income (GNI) per capita in the DRC as a percentage of GNI per capita in
Sub-Saharan Africa. It shows that in 1963, at the outset of its independence, the
DRC had a GNI per capita that was almost twice as high as the average level for
Sub-Saharan Africa (or more exactly 188%).28 In 2011 had it dropped to just 15%.
200%
180%
160%
140%
120%
100%
80%
60%
40%
20%
0%
1960 1970 1980 1990 2000 2010
FIGURE7.7:GNI
Figure GNIper
PERcapita
CAPITA IN DRC
in DR CONGO
Congo as aAS A PERCENTAGE
percentage of GNIOF
perGNI PERin
capita CAPITA IN SUB-SAHARAN
Sub-Saharan Africa
AFRICA (BASED ON WORLD DEVELOPMENT INDICATORS AND AUTHORS’ CALCULATIONS)
(Based on World Development Indicators and authors’ calculations)
26 Ibid
27 Gambino, Tony, Democratic Republic of Congo. Background Case Study for the World
Development Report 2011, March 2, 2011,
28 It should be noted that GNI per capita is a limited measure of living standards. Although in
1960s GNI per capita in DR Congo was relatively high compared to other Sub-Saharan African
countries other development indicators, such as life expectancy or child mortality, indicated
that living standards for most of population in the DRC were not markedly better than in
neighboring countries. A very high concentration of wealth and income in the hands of small
elite is the most obvious explanation for this discrepancy.
30 Coltan, Congo & ConflictT he D emocratic R epublic of C ongo
It should be noted that Sub-Saharan Africa has been growing significantly
slower than the rest of the world over this period. When the DRC is compared
to countries that performed better in terms of GNI per capita growth than the
Sub-Sahara African countries, it becomes even more clear that the DRC has been
falling into an economic abyss. In the early 1960s, per capita GNI in the DRC was
double of that in South Korea and three times as high as in Botswana. In 2011, this
indicator was 110 and 40 times higher in South Korea and Botswana respectively
than in the DRC. In the period from 1989 till 2001, the DRC’s Gross Domestic
Product (GDP) declined every year, except in 1995. All these figures indicate that
Congo’s formal economy had practically collapsed even before the recent wave of
conflicts, which started in 1994-1996.
The DRC is at the very bottom of various global development rankings. For
example, the DRC had the lowest value of the Human Development Index
published by the United Nations Development Program, which combines
measures of life expectancy, educational attainment, and income.29 Congo’s
infant mortality rate (110.6 per 1,000 of live births in 2011) is the third highest
in the world (only Somalia and Mali have a higher rate). Physical infrastructure
in the DRC remains rudimentary. Poor road systems and large distances make
transport between Congo’s eastern provinces, where coltan is mined, and the
rest of the country difficult and expensive.
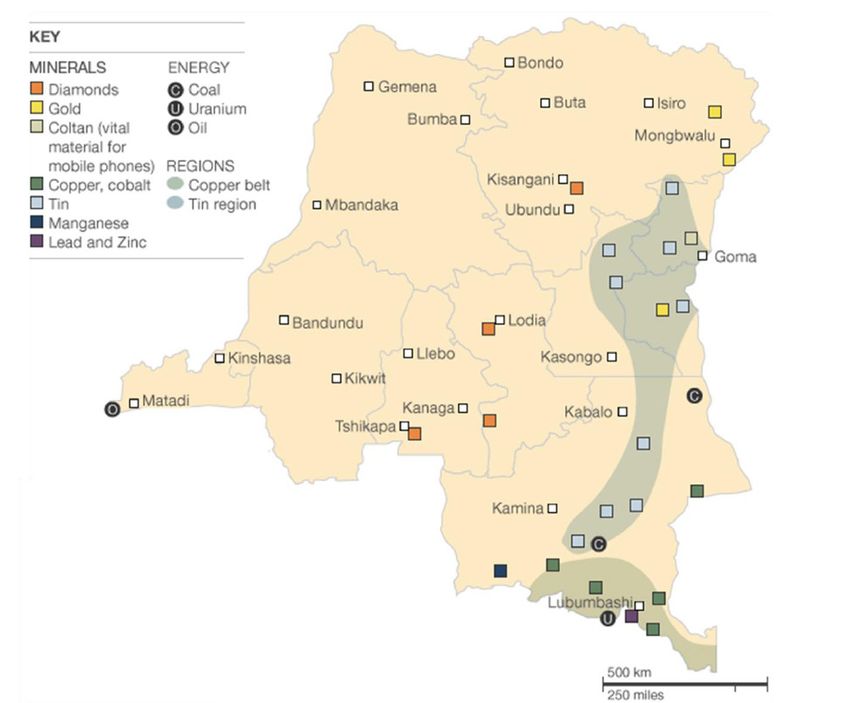
Natural resources
At the same time, some observers consider the DRC as a wealthy country because
it has large deposits of various minerals including diamonds, gold, copper,
cobalt, zinc and coltan (see Figure 8).
29 UNDP, Human Development Report 2011. Sustainability and Equity: A Better Future for All,
2011, http://hdr.undp.org/en/media/HDR_2011_EN_Complete.pdf.
HCSS Report 31T h e D e m o c r at i c R e p u b l i c o f C o n g o
FIGURE 8: MINERAL DEPOSITS IN THE DRC
(SOURCE: UN)
The mining industry has been a cornerstone of the Congolese economy since the
colonial times. Historically, the mining industry accounted for 25% of Congo’s
GDP and about three-quarters of total export revenue. Uranium from the DRC
was used at the Manhattan Project in the US to build the first nuclear bomb. In
the late 1980s (and in recent years) the country was the largest global producer
of cobalt and one of the largest of industrial diamonds and copper. However,
economic mismanagement and the degradation of Congolese state institutions
affected the mining sector as well. In 2000, despite the mineral riches of the
DRC, the sector’s share of the GDP dropped to an estimated 6%. 30
30 Coakley, George J. ’The Mineral Industry of Congo (Kinshasa).’ In U.S. Geological Survey
Minerals Yearbook -2002. USGS, 2002.
32 Coltan, Congo & ConflictT h e D e m o c r at i c R e p u b l i c o f C o n g o
An explosive mix
Many factors that substantially increase the risk of civil war or violence are
present in the DRC. A comprehensive review of empirical political science
literature by J. Dixon (2009) shows that factors such as a large population, large
territory, ethnic heterogeneity and declining living standards closely correlate
with an increased likelihood of civil war. 31 High infant mortality rate has also
been found to be a reliable proxy for a higher risk of conflict.32
A large number of conflicts in neighboring states is another factor contributing
to a higher chance of violence. Some examples of recent conflicts in states that
border the DRC include the civil war and genocide in Rwanda, the Lord’s
Resistance Army rebellion in Uganda, the long-lasting civil war in Angola
between MPLA and UNITA. Conflicts in neighboring states often have a tendency
to spill over the borders and, as a result, to increase the risk of civil war in
contingent states. Conflict in the DRC has invariably had a strong international
dimension.
The abundance of natural resources may be an additional factor that increases
likelihood of conflict in the DRC. Whereas natural resources such as fertile land
are generally considered beneficial for economic development, so called ‘point-
source’ non-renewable resources, such as minerals, oil and gas, often make
countries vulnerable to conflict.33 It is not possible to definitively conclude that
all minerals resources increase the probability of civil war (such a link was
repeatedly confirmed only for oil). However, statistical analyses indicate that
some minerals may lengthen pre-existing wars. In the case of the DRC, there are
indications that coltan along with other minerals was one of the factors that
prolonged the recent conflicts in the Congo (although its contribution was never
decisive, see chapter 3).
31 Dixon, Jeffery, ’What Causes Civil Wars? Integrating Quantitative Research Findings’,
International Studies Review (2009) 11,p. 707-735.
32 Goldstone, Jack A., Robert H. Bates, David L. Epstein, Ted Robert Gurr, Michael B. Lustik,
Monty G. Marshall, Jay Ulfelder, and Mark Woodward. ’A Global Model for Forecasting
Political Instability.’ American Journal of Political Science 54, no. 1 (January 2010): 190–208.
doi:10.1111/j.1540-5907.2009.00426.x.
33 World Bank. World Development Report 2011: Conflict, Security, and Development.
Washington DC: World Bank, 2011, table 2.1, p. 81
HCSS Report 33T h e D e m o c r at i c R e p u b l i c o f C o n g o
Disentangling various factors that contributed to economic decline and violence
in the Congo may be next to impossible, but it is obvious that, due to an
explosive mix of factors, the risk of conflict in the DRC would be high even
without taking into account its mineral wealth.
2.2 Brief history of conflict in the DRC
The modern history of the Congo has been marred by numerous conflicts since
its independence from Belgian colonial rule. The first national elections were
held in May 1960 and independence was declared on June 30, 1960. The turbulent
period between 1960 and 1966 was marked by several conflicts and rebellions and
is now known as the Congo Crisis. The newly independent state was quickly
overwhelmed by political instability and chaos. In September 1960, Joseph
Mobutu, then Chief of Staff of the Army, seized power in a military coup,
temporally suspended parliament and arrested the first prime minister of the
country, Patrice Lumumba, who was executed in January 1961. The country faced
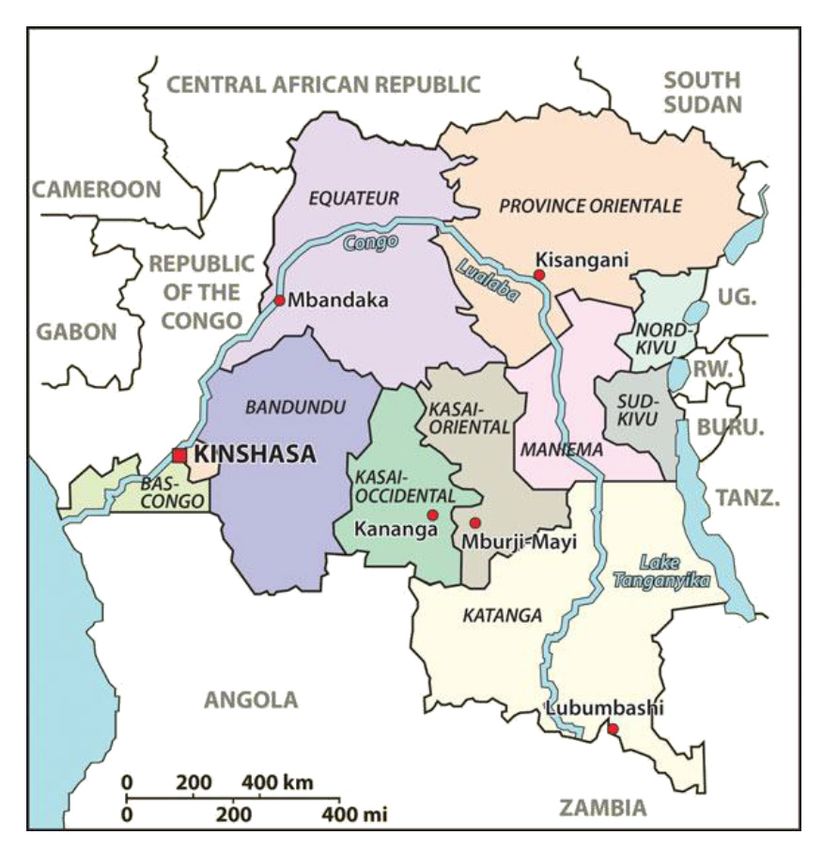
secessionist movements in the provinces of southern Kasai and Katanga (see
Figure 9), and an insurrection of the Conseil National de Libération (CNL). The CNL
set up a short-lived revolutionary government in the eastern part of the country.
In November 1965, Mobutu seized power again through a military coup d’état
backed by Belgium and the US.
FIGURE 9: POLITICAL MAP OF THE DRC
(SOURCE: CANADIAN MILITARY JOURNAL VOL. 11, NO. 3, 2011)
34 Coltan, Congo & ConflictT he D emocratic R epublic of C ongo
Mobutu remained in power for 32 years and renamed the country Zaire in 1971.
During his rule the intensity of conflicts declined but the country was never
really stable. Several rebellions aimed at ousting the dictator from power
emerged at the end of the 1970s. The ‘Shaba rebellions’ out of neighboring Angola
and Zambia in 1977-78, found their origin in the prior secessionist struggle in
Katanga. However, they did not mobilize popular support and were ultimately
defeated by the national army, the Forces Armées Zaïroises (FAZ), assisted by
Western allies.
Overall, Mobuto’s thirty-two-year long rule was characterized by a single-party
political system, a culture of corruption and economic mismanagement.
As a result le mal Zaïrois (the Zairian Sickness) became synonymous with the
country.34 The country essentially became a failed state. For example, in 1991 and
1993, unpaid army soldiers pillaged the capital, Kinshasa.35 Yet, the most deadly
conflict in the Congo began at the very end of Mobutu’s rule. The events leading
up to the overthrow of Mobutu are known as the First Congo War.
First Congo War (1996-1997)
A downward spiral encapsulating the whole Great Lakes region was set in motion
in the spring of 1994 when over 800,000 Tutsis and moderate Hutus were killed
in Rwanda. The genocide ended when the Tutsi-based Rwandan Patriotic Front
(RPF) defeated the Rwandan Armed Forces (FAR) and the Interahamwe militia,
which led to a large number of the Rwandan Hutus crossing the border into the
Congo. Approximately a million refugees were grouped in camps on Congolese
territory. Members of FAR and Interahamwe often used these camps as a staging
ground for cross-border raids to Rwanda.36 This influx of refugees changed not
only the regional dynamic, but altered the local ethnic balance and political
administration in eastern Congo.
In the summer of 1996, a crisis erupted when Kivu politicians threatened to expel
a Congolese Tutsi group, the Banyamulenge, from Congo. Locally, Tutsis were
34 Mobutu renamed the country Zaire in 1971.
35 Stearns, J., Dancing in the Glory of Monsters, Public Affairs, New York, 2011
36 ‘The Refugee Crisis In The Great Lakes Region: Background Information.’ Amnesty
International, 1996.
HCSS Report 35You can also read