Weather and Climate Inventory National Park Service South Florida / Caribbean Network - Natural Resource Technical Report NPS/SFCN/NRTR-2007/037
←
→
Page content transcription
If your browser does not render page correctly, please read the page content below
National Park Service
U.S. Department of the Interior

Natural Resource Program Center

Weather and Climate Inventory
National Park Service
South Florida / Caribbean Network
Natural Resource Technical Report NPS/SFCN/NRTR—2007/037

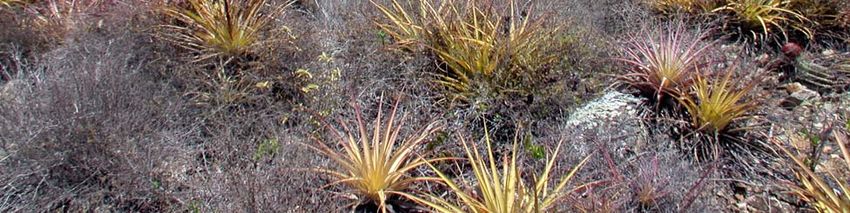
ON THE COVER
Buck Island Reef National Monument
Photograph copyrighted by the National Park Service

Weather and Climate Inventory
National Park Service
South Florida / Caribbean Network
Natural Resource Technical Report NPS/SFCN/NRTR—2007/037
WRCC Report 2007-12

Christopher A. Davey, Kelly T. Redmond, and David B. Simeral
Western Regional Climate Center
Desert Research Institute
2215 Raggio Parkway
Reno, Nevada 89512-1095

May 2007

U.S. Department of the Interior
National Park Service
Natural Resource Program Center
Fort Collins, Colorado
The Natural Resource Publication series addresses natural resource topics that are of interest and
applicability to a broad readership in the National Park Service and to others in the management
of natural resources, including the scientific community, the public, and the National Park
Service conservation and environmental constituencies. Manuscripts are peer-reviewed to ensure
that the information is scientifically credible, technically accurate, appropriately written for the
intended audience, and designed and published in a professional manner.

The Natural Resources Technical Reports series is used to disseminate the peer-reviewed results
of scientific studies in the physical, biological, and social sciences for both the advancement of
science and the achievement of the National Park Service mission. The reports provide
contributors with a forum for displaying comprehensive data that are often deleted from journals
because of page limitations. Current examples of such reports include the results of research that
address natural resource management issues; natural resource inventory and monitoring
activities; resource assessment reports; scientific literature reviews; and peer-reviewed
proceedings of technical workshops, conferences, or symposia.

Views and conclusions in this report are those of the authors and do not necessarily reflect
policies of the National Park Service. Mention of trade names or commercial products does not
constitute endorsement or recommendation for use by the National Park Service.

Printed copies of reports in these series may be produced in a limited quantity and they are only
available as long as the supply lasts. This report is also available from the Natural Resource
Publications Management website (http://www.nature.nps.gov/publications/NRPM) on the
Internet or by sending a request to the address on the back cover.

Please cite this publication as follows:

Davey, C. A., K. T. Redmond, and D. B. Simeral. 2007. Weather and Climate
Inventory, National Park Service, South Florida / Caribbean Network. Natural
Resource Technical Report NPS/SFCN/NRTR—2007/037. National Park Service,
Fort Collins, Colorado.

NPS/SFCN/NRTR—2007/037, May 2007

                                                 ii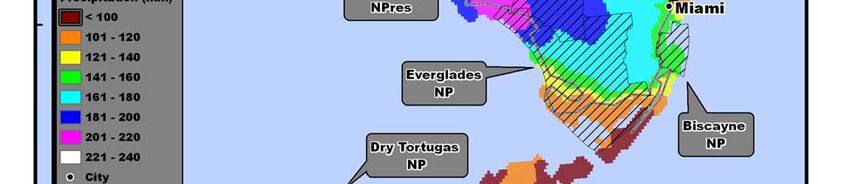
Contents
                                                                                                                                              Page

Figures ............................................................................................................................................ v

Tables ........................................................................................................................................... vi

Appendixes ................................................................................................................................. vii

Acronyms ................................................................................................................................... viii

Executive Summary ....................................................................................................................... x

Acknowledgements ..................................................................................................................... xii

1.0. Introduction ............................................................................................................................. 1

     1.1. Network Terminology ...................................................................................................... 3

     1.2. Weather versus Climate Definitions ................................................................................ 3

     1.3. Purpose of Measurements ................................................................................................ 3

     1.4. Design of Climate-Monitoring Programs ........................................................................ 4

2.0. Climate Background ................................................................................................................ 9

     2.1. Climate and the SFCN Environment ............................................................................... 9

     2.2. Spatial Variability .......................................................................................................... 10

     2.3. Temporal Variability ...................................................................................................... 11

     2.4. Parameter Regression on Independent Slopes Model .................................................... 19

3.0. Methods ................................................................................................................................. 20

     3.1. Metadata Retrieval ......................................................................................................... 20

     3.2. Criteria for Locating Stations ......................................................................................... 22

4.0. Station Inventory ................................................................................................................... 23

     4.1. Climate and Weather Networks ..................................................................................... 23

      4.2. Station Locations ........................................................................................................... 25

                                                                         iii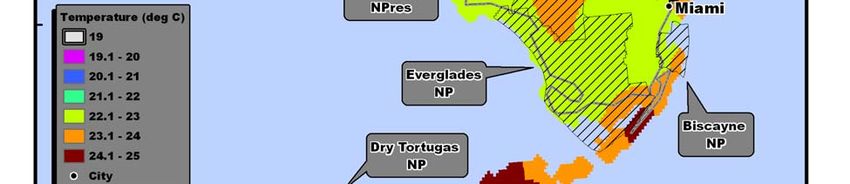
Contents (continued)
                                                                                                                                       Page

5.0. Conclusions and Recommendations ..................................................................................... 37

     5.1. South Florida / Caribbean Inventory and Monitoring Network ..................................... 37

     5.2. Spatial Variations in Mean Climate ............................................................................... 37

     5.3. Climate Change Detection ............................................................................................. 38

     5.4. Aesthetics ....................................................................................................................... 38

     5.5. Information Access ........................................................................................................ 39

     5.6. Summarized Conclusions and Recommendations ......................................................... 39

6.0. Literature Cited ..................................................................................................................... 41

                                                                     iv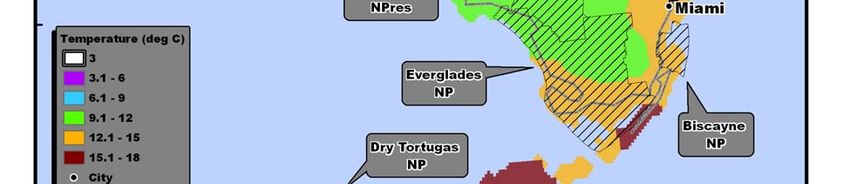
Figures
                                                                                                              Page

Figure 1.1. Map of the South Florida / Caribbean Network ......................................................... 2

Figure 2.1. Mean annual precipitation, 1961–1990, for the SFCN ............................................ 12

Figure 2.2. Mean monthly precipitation at selected locations in the SFCN................................ 13

Figure 2.3. Mean July precipitation, 1961–1990, for the SFCN ................................................ 14

Figure 2.4. Mean annual temperature, 1961–1990, for the SFCN ............................................. 15

Figure 2.5. Mean January minimum temperature, 1961–1990, for the SFCN ........................... 16

Figure 2.6. Mean July maximum temperature, 1961–1990, for the SFCN ................................ 17

Figure 2.7. Precipitation time series, 1895-2005, for southern Florida ...................................... 18

Figure 2.8. Temperature time series, 1895-2005, for southern Florida ...................................... 18

Figure 4.1. Station locations for the SFCN park units in southern Florida ................................ 31

Figure 4.2. Station locations for the SFCN park units on the Virgin Islands ............................. 33

                                                         v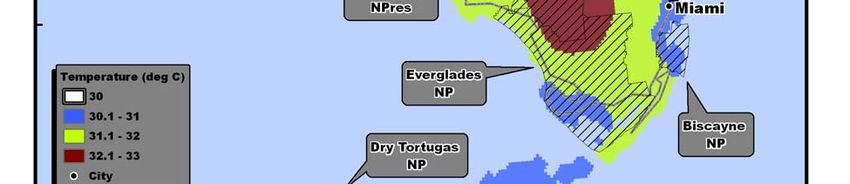
Tables
                                                                                                             Page

Table 1.1. Park units in the South Florida / Caribbean Network .................................................. 1

Table 3.1. Primary metadata fields for SFCN weather/climate stations ..................................... 21

Table 4.1. Weather/climate networks represented within the SFCN .......................................... 23

Table 4.2. Number of stations within or nearby SFCN park units .............................................. 26

Table 4.3. Weather/climate stations for the SFCN park units in southern Florida ..................... 26

Table 4.4. Weather/climate stations for the SFCN park units on the Virgin Islands .................. 34

                                                        vi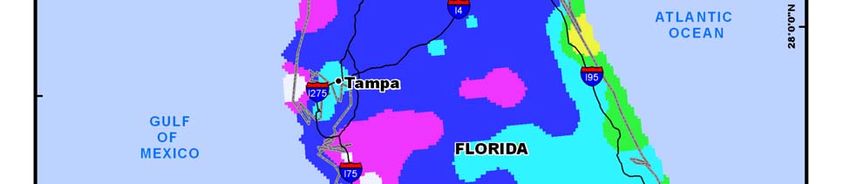
Appendixes
                                                                                                                                Page

Appendix A. Glossary ............................................................................................................... 44

Appendix B. Climate-monitoring principles ............................................................................. 46

Appendix C. Factors in operating a climate network ................................................................ 49

Appendix D. General design considerations for weather/climate-monitoring programs .......... 52

Appendix E. Master metadata field list ..................................................................................... 72

Appendix F.         Electronic supplements ........................................................................................ 74

Appendix G. Descriptions of weather/climate-monitoring networks ........................................ 75

                                                                 vii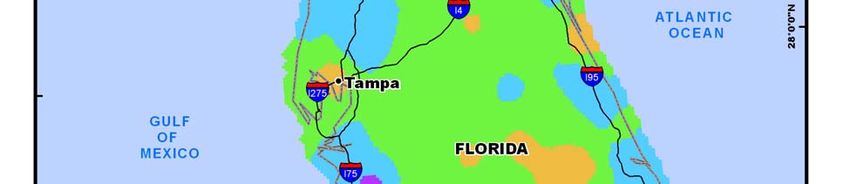
Acronyms
AASC       American Association of State Climatologists
ACIS       Applied Climate Information System
ASOS       Automated Surface Observing System
AWOS       Automated Weather Observing System
BICY       Big Cypress National Preserve
BISC       Biscayne National Park
BLM        Bureau of Land Management
BUIS       Buck Island Reef National Monument
CASTNet    Clean Air Status and Trends Network
COOP       Cooperative Observer Program
CRN        Climate Reference Network
CWOP       Citizen Weather Observer Program
DFIR       Double-Fence Intercomparison Reference
DRTO       Dry Tortugas National Park
DST        daylight savings time
ENSO       El Niño Southern Oscillation
EPA        Environmental Protection Agency
EVER       Everglades National Park
FAA        Federal Aviation Administration
FAWN       Florida Automated Weather Network
FIPS       Federal Information Processing Standards
GMT        Greenwich Mean Time
GOES       Geostationary Operational Environmental Satellite
GPMP       NPS Gaseous Pollutant Monitoring Program
GPS        Global Positioning System
GPS-MET    NOAA ground-based GPS meteorology
I&M        NPS Inventory and Monitoring Program
LEO        Low Earth Orbit
LST        local standard time
MDN        Mercury Deposition Network
NADP       National Atmospheric Deposition Program
NASA       National Aeronautics and Space Administration
NCDC       National Climatic Data Center
NetCDF     Network Common Data Form
NOAA       National Oceanic and Atmospheric Administration
NPS        National Park Service
NRCS       Natural Resources Conservation Service
NWS        National Weather Service
PRISM      Parameter Regression on Independent Slopes Model
RAWS       Remote Automated Weather Station network
RCC        regional climate center
SAO        Surface Airways Observation network
SARI       Salt River Bay National Historical Park and Ecological Reserve
SCAN       Soil Climate Analysis Network

                                  viii
SFCN South Florida / Caribbean Inventory and Monitoring Network
SOD Summary Of the Day
Surfrad Surface Radiation Budget network
USDA U.S. Department of Agriculture
USGS U.S. Geological Survey
UTC Coordinated Universal Time
VIIS Virgin Islands National Park
WBAN Weather Bureau Army Navy
WMO World Meteorological Organization
WRCC Western Regional Climate Center
WX4U Weather For You network
ixExecutive Summary
Climate is a dominant factor driving the physical and ecologic processes affecting the South
Florida / Caribbean Inventory and Monitoring Network (SFCN). Climate in the SFCN is
generally warm and humid, influenced strongly by the network’s proximity to water. The SFCN
is characterized by hot, wet summers (the wet season) and warm, drier winters (the dry season).
Drought cycles in the SFCN, particularly in south Florida, are connected to increased fire activity
and decreased freshwater input vital for bay ecosystems. Major weather events such as
hurricanes, tropical storms, large wind and large wave events are natural but substantial sources
of disturbance for ecological communities throughout the SFCN. Possible effects of future
climate changes in the SFCN include sea level rises, coral bleaching, northward expansion of
tropical flora, modified migratory patterns, and possible increases in the frequency of extreme
weather/climate events. Because of its influence on the ecology of SFCN park units and the
surrounding areas, climate was identified as a high-priority vital sign for SFCN and is one of the
12 basic inventories to be completed for all National Park Service (NPS) Inventory and
Monitoring Program (I&M) networks.
This project was initiated to inventory past and present climate monitoring efforts in the SFCN.
In this report, we provide the following information:
• Overview of broad-scale climatic factors and zones important to SFCN park units.
• Inventory of weather and climate station locations in and near SFCN park units relevant to
the NPS I&M Program.
• Results of an inventory of metadata on each weather station, including affiliations for
weather-monitoring networks, types of measurements recorded at these stations, and
information about the actual measurements (length of record, etc.).
• Initial evaluation of the adequacy of coverage for existing weather stations and
recommendations for improvements in monitoring weather and climate.
The SFCN experiences relatively uniform temperature characteristics. The Virgin Islands park
units have daily temperatures ranging from lows between 23-27°C and highs between 29-32°C.
Mean annual temperatures on the Florida peninsula generally follow a latitudinal gradient, with
cooler conditions to the north. Mean annual temperatures within Florida park units range from
under 23°C to near 25°C. Average winter minimum temperatures in south Florida can get as low
12°C in Big Cypress National Preserve (BICY) and northern portions of Everglades National
Park (EVER). Average summer maximum temperatures are warmest on the Florida peninsula,
with interior locations exceeding 32°C. Unlike temperature, precipitation in the SFCN is quite
variable in both space and time, as it is largely convective in nature, associated with wet season
thunderstorms. The park units around the Virgin Islands generally see between 900 and 1400
mm of precipitation per year. In south Florida, interior locations are generally the driest, with
coastal locations receiving somewhat higher precipitation totals. Mean annual precipitation
exceeds 1500 mm in portions of Biscayne National Park (BISC) while Dry Tortugas National
Park (DRTO) and southernmost EVER, receive under 1200 mm on average each year.
Through a search of national databases and inquiries to NPS staff, we have identified 31 weather
and climate stations within SFCN park units. EVER has the most stations within park boundaries
x(13). Most of the weather and climate stations identified for SFCN park units had metadata and
data records that are sufficiently complete and satisfactory in quality.
The island-based SFCN park units such as DRTO and the park units on the relatively small U.S.
Virgin Islands cannot support the same number of weather and climate stations as can larger
islands or mainland locations. It is important that those stations which have been identified
continue to operate and maintain reliable observations.
No weather/climate station coverage is available currently in central and southern BISC. This
coverage gap could begin to be addressed by installing an automated station on Elliott Key, at
the main ranger station. Candidate weather/climate station networks for this installation would
include the FAWN (Florida Automated Weather Network) and RAWS (Remote Automated
Weather Station) networks. Weather/climate monitoring efforts in the park unit would likely
benefit from such an installation.
The importance of monitoring wet season/dry season cycles and spatiotemporal patterns in
precipitation is quite evident for both BICY and EVER, where precipitation patterns play a
integral role in the ecosystems in these park units. Drought monitoring, monitoring of fire
conditions, and monitoring of ecosystem health all will benefit from a better understanding of
regional convective precipitation patterns, which are quite variable in space and time across both
BICY and EVER. In order to improve this understanding, however, the existing coverage of
near-real-time weather stations in these parks needs to be increased, and weather/climate
monitoring efforts in both BICY and EVER would benefit by gradually implementing this
strategy. Since the RAWS network already has a presence within both BICY and EVER, a
natural first step would be to install more of these stations. Potential sites in BICY could include
1) a location along Highway 839 between US Highway 41 and Interstate 75, and 2) northeastern
BICY, near the rest area at the Recreation Access Point on Interstate 75. Potential sites in EVER
could include 1) the Gulf Coast Visitor Center, 2) the Royal Palm Visitor Center, and 3) along
Highway 9336, near access points such as the Pa-hay-okee or Mahogany Overlooks.
The marine setting of the SFCN ensures relatively uniform temperatures, both spatially and
temporally. These stable temperatures do provide a useful indicator of longer-term global
temperature trends, as the heat content of the water bodies in the SFCN governs overall
temperature characteristics in the region and thus will respond to global-scale temperature trends.
Many of the SFCN park units would be directly impacted by any sea level changes associated
with global-scale temperature changes. Therefore, NPS climate-monitoring efforts will benefit
by making the monitoring of long-term temperature characteristics for the SFCN a high priority,
for example, by continuing the operation of any existing weather/climate stations that do provide
longer data records in SFCN park units.
xiAcknowledgements
This work was supported and completed under Task Agreement H8R07010001, with the Great
Basin Cooperative Ecosystem Studies Unit. We would like to acknowledge very helpful
assistance from various National Park Service personnel associated with the South Florida /
Caribbean Inventory and Monitoring Network. Particular thanks are extended to Matt Patterson,
Kevin Whelan, Andrea Atkinson, and Brian Witcher. We also thank John Gross, Margaret Beer,
Grant Kelly, Greg McCurdy, and Heather Angeloff for all their help. Seth Gutman with the
National Oceanic and Atmospheric Administration Earth Systems Research Laboratory provided
valuable input on the GPS-MET station network. Portions of the work were supported by the
NOAA Western Regional Climate Center.
xii1.0. Introduction
Weather and climate are key drivers in ecosystem structure and function. Global- and regional-
scale climate variations will have a tremendous impact on natural systems (Chapin et al. 1996;
Schlesinger 1997; Jacobson et al. 2000; Bonan 2002). Long-term patterns in temperature and
precipitation provide first-order constraints on potential ecosystem structure and function.
Secondary constraints are realized from the intensity and duration of individual weather events
and, additionally, from seasonality and inter-annual climate variability. These constraints
influence the fundamental properties of ecologic systems, such as soil–water relationships,
plant–soil processes, and nutrient cycling, as well as disturbance rates and intensity. These
properties, in turn, influence the life-history strategies supported by a climatic regime (Neilson
1987; Patterson et al. 2005).
Given the importance of climate, it is one of 12 basic inventories to be completed by the National
Park Service (NPS) Inventory and Monitoring Program (I&M) network (I&M 2006). As primary
environmental drivers for the other vital signs, weather and climate patterns present various
practical and management consequences and implications for the NPS (Oakley et al. 2003). Most
park units observe weather and climate elements as part of their overall mission. The lands under
NPS stewardship provide many excellent locations for monitoring climatic conditions.
It is essential that park units within the South Florida / Caribbean Inventory and Monitoring
Network (SFCN) have an effective climate-monitoring system in place to track climate changes
and to aid in management decisions relating to these changes. The purpose of this report is to
determine the current status of weather and climate monitoring within the SFCN (Table 1.1;
Figure 1.1). In this report, we provide the following informational elements:
• Overview of broad-scale climatic factors and zones important to SFCN park units.
• Inventory of locations for all weather stations in and near SFCN park units that are relevant
to the NPS I&M networks.
• Results of metadata inventory for each station, including weather-monitoring network
affiliations, types of recorded measurements, and information about actual measurements
(length of record, etc.).
• Initial evaluation of the adequacy of coverage for existing weather stations and
recommendations for improvements in monitoring weather and climate.
Table 1.1. Park units in the South Florida / Caribbean Network.
Acronym Name
BICY Big Cypress National Preserve
BISC Biscayne National Park
BUIS Buck Island Reef National Monument
DRTO Dry Tortugas National Park
EVER Everglades National Park
SARI Salt River Bay National Historical Park and Ecological Reserve
VIIS Virgin Islands National Park
1Figure 1.1. Map of the South Florida / Caribbean Network.
21.1. Network Terminology
Before proceeding, it is important to stress that this report discusses the idea of “networks” in
two different ways. Modifiers are used to distinguish between NPS I&M networks and
weather/climate station networks. See Appendix A for a full definition of these terms.
1.1.1. Weather/Climate Station Networks
Most weather and climate measurements are made not from isolated stations but from stations
that are part of a network operated in support of a particular mission. The limiting case is a
network of one station, where measurements are made by an interested observer or group. Larger
networks usually have additional, enhanced inventory data and station-tracking procedures.
Some national weather/climate networks are associated with the National Oceanic and
Atmospheric Administration (NOAA), including the National Weather Service (NWS)
Cooperative Observer Program (COOP). Other national networks include the interagency
Remote Automated Weather Station network (RAWS) and the U.S. Department of
Agriculture/Natural Resources Conservation Service (USDA/NRCS) Soil Climate Analysis
Network (SCAN). Usually a single agency, but sometimes a consortium of interested parties,
will jointly support a particular weather/climate network.
1.1.2. NPS I&M Networks
Within the NPS, the system for monitoring various attributes in the participating park units
(about 270–280 in total) is divided into 32 NPS I&M networks. These networks are collections
of park units grouped together around a common theme, typically geographical.
1.2. Weather versus Climate Definitions
It is also important to distinguish whether the primary use of a given station is for weather
purposes or for climate purposes. Weather station networks are intended for near-real-time
usage, where the precise circumstances of a set of measurements are typically less important. In
these cases, changes in exposure or other attributes over time are not as critical. Climate
networks, however, are intended for long-term tracking of atmospheric conditions. Siting and
exposure are critical factors for climate networks, and it is vitally important that the
observational circumstances remain essentially unchanged over the duration of the station record.
Some climate networks can be considered hybrids of weather/climate networks. These hybrid
climate networks can supply information on a short-term “weather” time scale and a longer-term
“climate” time scale.
In this report, “weather” generally refers to current (or near-real-time) atmospheric conditions,
while “climate” is defined as the complete ensemble of statistical descriptors for temporal and
spatial properties of atmospheric behavior (see Appendix A). Climate and weather phenomena
shade gradually into each other and are ultimately inseparable.
1.3. Purpose of Measurements
Climate inventory and monitoring climate activities should be based on a set of guiding
fundamental principles. Any evaluation of weather/climate monitoring programs begins with
asking the following question:
• What is the purpose of weather and climate measurements?
3Evaluation of past, present, or planned weather/climate monitoring activities must be based on
the answer to this question.
Weather and climate data and information constitute a prominent and widely requested
component of the NPS I&M networks (I&M 2006). Within the context of the NPS, the following
services constitute the main purposes for recording weather and climate observations:
• Provide measurements for real-time operational needs and early warnings of potential
hazards (landslides, mudflows, washouts, fallen trees, plowing activities, fire conditions,
aircraft and watercraft conditions, road conditions, rescue conditions, fog, restoration and
remediation activities, etc.).
• Provide visitor education and aid interpretation of expected and actual conditions for
visitors while they are in the park and for deciding if and when to visit the park.
• Establish engineering and design criteria for structures, roads, culverts, etc., for human
comfort, safety, and economic needs.
• Consistently monitor climate over the long-term to detect changes in environmental drivers
affecting ecosystems, including both gradual and sudden events.
• Provide retrospective data to understand a posteriori changes in flora and fauna.
• Document for posterity the physical conditions in and near the park units, including mean,
extreme, and variable measurements (in time and space) for all applications.
The last three items in the preceding list are pertinent primarily to the NPS I&M networks;
however, all items are important to NPS operations and management. Most of the needs in this
list overlap heavily. It is often impractical to operate separate climate measuring systems that
also cannot be used to meet ordinary weather needs, where there is greater emphasis on
timeliness and reliability.
1.4. Design of Climate-Monitoring Programs
Determining the purposes for collecting measurements in a given weather/climate monitoring
program will guide the process of identifying weather/climate stations suitable for the monitoring
program. The context for making these decisions is provided in Chapter 2 where background on
the SFCN climate is presented. However, this process is only one step in evaluating and
designing a climate-monitoring program. The following steps must also be included:
• Define park and network-specific monitoring needs and objectives.
• Identify locations and data repositories of existing and historic stations.
• Acquire existing data when necessary or practical.
• Evaluate the quality of existing data.
• Evaluate the adequacy of coverage of existing stations.
• Develop a protocol for monitoring the weather and climate, including the following:
o Standardized summaries and reports of weather/climate data.
o Data management (quality assurance and quality control, archiving, data access, etc.).
• Develop and implement a plan for installing or modifying stations, as necessary.
4Throughout the design process, there are various factors that require consideration in evaluating
weather and climate measurements. Many of these factors have been summarized by Dr. Tom
Karl, director of the NOAA National Climatic Data Center (NCDC), and widely distributed as
the “Ten Principles for Climate Monitoring” (Karl et al. 1996; NRC 2001). These principles are
presented in Appendix B, and the guidelines are embodied in many of the comments made
throughout this report. The most critical factors are presented here. In addition, an overview of
requirements necessary to operate a climate network is provided in Appendix C, with further
discussion in Appendix D.
1.4.1. Need for Consistency
A principal goal in climate monitoring is to detect and characterize slow and sudden changes in
climate through time. This is of less concern for day-to-day weather changes, but it is of
paramount importance for climate variability and change. There are many ways whereby
changes in techniques for making measurements, changes in instruments or their exposures, or
seemingly innocuous changes in site characteristics can lead to apparent changes in climate.
Safeguards must be in place to avoid these false sources of temporal “climate” variability if we
are to draw correct inferences about climate behavior over time from archived measurements.
For climate monitoring, consistency through time is vital, counting at least as important as
absolute accuracy. Sensors record only what is occurring at the sensor—this is all they can
detect. It is the responsibility of station or station network managers to ensure that observations
are representative of the spatial and temporal climate scales that we wish to record.
1.4.2. Metadata
Changes in instruments, site characteristics, and observing methodologies can lead to apparent
changes in climate through time. It is therefore vital to document all factors that can bear on the
interpretation of climate measurements and to update the information repeatedly through time.
This information (“metadata,” data about data) has its own history and set of quality-control
issues that parallel those of the actual data. There is no single standard for the content of climate
metadata, but a simple rule suffices:
• Observers should record all information that could be needed in the future to interpret
observations correctly without benefit of the observers’ personal recollections.
Such documentation includes notes, drawings, site forms, and photos, which can be of
inestimable value if taken in the correct manner. That stated, it is not always clear to the
metadata provider what is important for posterity and what will be important in the future. It is
almost impossible to “over document” a station. Station documentation is greatly
underappreciated and is seldom thorough enough (especially for climate purposes). Insufficient
attention to this issue often lowers the present and especially future value of otherwise useful
data.
The convention followed throughout climatology is to refer to metadata as information about the
measurement process, station circumstances, and data. The term “data” is reserved solely for the
actual weather and climate records obtained from sensors.
51.4.3. Maintenance
Inattention to maintenance is the greatest source of failure in weather/climate stations and
networks. Problems begin to occur soon after sites are deployed. A regular visit schedule must be
implemented, where sites, settings (e.g., vegetation), sensors, communications, and data flow are
checked routinely (once or twice a year at a minimum) and updated as necessary. Parts must be
changed out for periodic recalibration or replacement. With adequate maintenance, the entire
instrument suite should be replaced or completely refurbished about once every five to seven
years.
Simple preventive maintenance is effective but requires much planning and skilled technical
staff. Changes in technology and products require retraining and continual re-education. Travel,
logistics, scheduling, and seasonal access restrictions consume major amounts of time and
budget but are absolutely necessary. Without such attention, data gradually become less credible
and then often are misused or not used at all.
1.4.4. Automated versus Manual Stations
Historic stations often have depended on manual observations and many continue to operate in
this mode. Manual observations frequently produce excellent data sets. Sensors and data are
simple and intuitive, well tested, and relatively cheap. Manual stations have much to offer in
certain circumstances and can be a source of both primary and backup data. However,
methodical consistency for manual measurements is a constant challenge, especially with a
mobile work force. Operating manual stations takes time and needs to be done on a regular
schedule, though sometimes the routine is welcome.
Nearly all newer stations are automated. Automated stations provide better time resolution,
increased (though imperfect) reliability, greater capacity for data storage, and improved
accessibility to large amounts of data. The purchase cost for automated stations is higher than for
manual stations. A common expectation and serious misconception is that an automated station
can be deployed and left to operate on its own. In reality, automation does not eliminate the need
for people but rather changes the type of person that is needed. Skilled technical personnel are
needed and must be readily available, especially if live communications exist and data gaps are
not wanted. Site visits are needed at least annually and spare parts must be maintained. Typical
annual costs for sensors and maintenance at the major national networks are $1500–2500 per
station per year but these costs still can vary greatly depending on the kind of automated site.
1.4.5. Communications
With manual stations, the observer is responsible for recording and transmitting station data.
Data from automated stations, however, can be transmitted quickly for access by research and
operations personnel, which is a highly preferable situation. A comparison of communication
systems for automated and manual stations shows that automated stations generally require
additional equipment, more power, higher transmission costs, attention to sources of disruption
or garbling, and backup procedures (e.g. manual downloads from data loggers).
Automated stations are capable of functioning normally without communication and retaining
many months of data. At such sites, however, alerts about station problems are not possible,
large gaps can accrue when accessible stations quit, and the constituencies needed to support
6such stations are smaller and less vocal. Two-way communications permit full recovery from
disruptions, ability to reprogram data loggers remotely, and better opportunities for diagnostics
and troubleshooting. In virtually all cases, two-way communications are much preferred to all
other communication methods. However, two-way communications require considerations of
cost, signal access, transmission rates, interference, and methods for keeping sensor and
communication power loops separate. Two-way communications are frequently impossible (no
service) or impractical, expensive, or power consumptive. Two-way methods (cellular, land line,
radio, Internet) require smaller up-front costs as compared to other methods of communication
and have variable recurrent costs, starting at zero. Satellite links work everywhere (except when
blocked by trees or cliffs) and are quite reliable but are one-way and relatively slow, allow no re-
transmissions, and require high up-front costs ($3000–4000) but no recurrent costs.
Communications technology is changing constantly and requires vigilant attention by
maintenance personnel.
1.4.6. Quality Assurance and Quality Control
Quality control and quality assurance are issues at every step through the entire sequence of
sensing, communication, storage, retrieval, and display of environmental data. Quality assurance
is an umbrella concept that covers all data collection and processing (start-to-finish) and ensures
that credible information is available to the end user. Quality control has a more limited scope
and is defined by the International Standards Organization as “the operational techniques and
activities that are used to satisfy quality requirements.” The central problem can be better
appreciated if we approach quality control in the following way.
• Quality control is the evaluation, assessment, and rehabilitation of imperfect data by
utilizing other imperfect data.
The quality of the data only decreases with time once the observation is made. The best and most
effective quality control, therefore, consists in making high-quality measurements from the start
and then successfully transmitting the measurements to an ingest process and storage site. Once
the data are received from a monitoring station, a series of checks with increasing complexity
can be applied, ranging from single-element checks (self-consistency) to multiple-element
checks (inter-sensor consistency) to multiple-station/single-element checks (inter-station
consistency). Suitable ancillary data (battery voltages, data ranges for all measurements, etc.) can
prove extremely useful in diagnosing problems.
There is rarely a single technique in quality control procedures that will work satisfactorily for
all situations. Quality-control procedures must be tailored to individual station circumstances,
data access and storage methods, and climate regimes.
The fundamental issue in quality control centers on the tradeoff between falsely rejecting good
data (Type I error) and falsely accepting bad data (Type II error). We cannot reduce the
incidence of one type of error without increasing the incidence of the other type. In weather and
climate data assessments, since good data are absolutely crucial for interpreting climate records
properly, Type I errors are deemed far less desirable than Type II errors.
7Not all observations are equal in importance. Quality-control procedures are likely to have the
greatest difficulty evaluating the most extreme observations, where independent information
usually must be sought and incorporated. Quality-control procedures involving more than one
station usually involve a great deal of infrastructure with its own (imperfect) error-detection
methods, which must be in place before a single value can be evaluated.
1.4.7. Standards
Although there is near-universal recognition of the value in systematic weather and climate
measurements, these measurements will have little value unless they conform to accepted
standards. There is not a single source for standards for collecting weather and climate data nor a
single standard that meets all needs. Measurement standards have been developed by the World
Meteorological Organization (WMO 1983; 2005), the American Association of State
Climatologists (AASC 1985), the U.S. Environmental Protection Agency (EPA 1987), Finklin
and Fischer (1990), the RAWS program (Bureau of Land Management [BLM] 1997), and the
National Wildfire Coordinating Group (2004). Variations to these measurement standards also
have been offered by instrument makers (e.g., Tanner 1990).
1.4.8. Who Makes the Measurements?
The lands under NPS stewardship provide many excellent locations to host the monitoring of
climate by the NPS or other collaborators. These lands are largely protected from human
development and other land changes that can impact observed climate records. Most park units
historically have observed weather/climate elements as part of their overall mission. Many of
these measurements come from station networks managed by other agencies, with observations
taken or overseen by NPS personnel, in some cases, or by collaborators from the other agencies.
National Park Service units that are small, lack sufficient resources, or lack sites presenting
adequate exposure may benefit by utilizing weather/climate measurements collected from nearby
stations.
82.0. Climate Background
Climate is a primary factor controlling the structure and function of ecosystems in the SFCN. An
understanding of both current climate patterns and climate history in the SFCN is important to
understanding and interpreting change and patterns in ecosystem attributes within the SFCN
(Patterson et al. 2005). It is essential that the SFCN park units have an effective climate
monitoring system to track climate changes and to aid in management decisions relating to these
changes. In order to do this, it is essential to understand the climate characteristics of the SFCN,
as discussed in this chapter.
2.1. Climate and the SFCN Environment
Climate in the SFCN is influenced strongly by the network’s proximity to water and is
characterized by hot, wet summers (the wet season) and warm, drier winters (the dry season).
These “seasons” within the SFCN are actually determined more by precipitation than by
temperature.
The Gulf of Mexico and the Atlantic Ocean have moderating effects on the SFCN park units in
south Florida. While temperatures in the interior of the Florida peninsula can frequently climb to
near 40°C, the south Florida park units are usually a few degrees cooler due to their closer
proximity to water. Florida has some of the highest statewide average precipitation totals of any
state. Much of this precipitation is due to afternoon thunderstorms which are common throughout
the wet season (late spring until early autumn). These thunderstorms are sometimes associated
with larger-scale storm systems but are generally associated with diurnal land-sea breeze
circulations, with relatively cooler, moist ocean air moving onshore and colliding with relatively
warmer air over the Florida peninsula. These thunderstorms are common in the afternoon hours
and often bring heavy downpours, high winds and sometimes tornadoes. Hail is not an
uncommon occurrence in some of the more severe thunderstorms.
Drought is a recurring issue for SFCN park units, particularly in south Florida. Drought episodes
are connected to increased fire activity in the region and decreased freshwater input vital for bay
ecosystems (Rudnick 2004).
Major weather events such as hurricanes, tropical storms, large wind and large wave events are
natural but substantial sources of disturbance for ecological communities throughout the
Caribbean. These events can often introduce patchy or large-scale destruction to coral reefs,
seagrass beds, and vegetation. Storms waves and surge remove or redistribute sand along
beaches; create and alter sand bars, coastal levees, and shell deposits; create and refill salt ponds;
open cut-off ponds and lakes back to the sea, and so on. Seawater intrusion and sediment
deposition from high storm surges can impact freshwater habitats well inland. Storms also create
debris such as fallen trees, houses, and loose boats, which can exacerbate wave damage to
habitats. Exotic flora and fauna can be accidentally released and dispersed to new areas where
they rapidly invade the newly disturbed habitats (Waddell 2005).
The threat of hurricanes to SFCN parks during the summer and fall has been illustrated
dramatically in recent years. In 2004, for example, Florida was hit by four hurricanes, including
Hurricanes Charley (August 13), Frances (September 4-5), Ivan (September 16), and Jeanne
9(September 25-26). Hurricane Andrew, which struck southern Florida in 1992, caused
widespread damage at BISC and also damaged pine trees on Long Pine Key which then suffered
subsequent beetle and weevil outbreaks (Lodge 2005). In 1989, Hurricane Hugo alone caused
substantial damage to living coral cover structures in SFCN park units on the Virgin Islands
(Drayton et al. 2004). Although it is still yet uncertain if the intensity of hurricanes in the
Atlantic Ocean Basin is increasing (Bove et al. 1998; Henderson-Sellers et al. 1998; NAST 2001;
Trenberth 2005), it is likely that with potential sea level rises, future tropical storms and
hurricanes will have an increasingly damaging affect on the SFCN ecosystems.
The SFCN is not known for cold, wintry conditions. However, frost events can occasionally
impact Florida park units and these events are actually instrumental in determining the general
structure of plant communities in Florida park units like BICY and EVER. Frost influences, for
example, the extent of mangrove communities in south Florida park units (USFWS 1999). Even
snow has occurred in southern Florida, with a rare snowfall occurring in January 1977. This
event brought snow to Miami Beach for the only time in recorded history.
Much of the effects of global climate change on the SFCN are still speculative and it is difficult
to separate out the effects of a global shift from natural climatic cycles. However, some
hypothesized effects that could impact SFCN park units include (Patterson et al. 2005): 1) sea
level rises; 2) increased ocean temperatures and associated coral bleaching and death; 3)
northward expansion of sub-tropical and tropical flora in south Florida; 4) modified migratory
patterns of birds and other fauna; and 5) possible increases in the frequency of extreme
weather/climate events, including major hurricanes and droughts.
Sea-level rises, in particular, are of concern for SFCN park units. With slow sea level rise,
deposition and accretion processes can keep up with these rises and thus maintain island and
shoreline habitats. However, some studies indicate that the rate of sea level rise has increased
over the past century to at least 1 foot per century, possibly as a result of global climate change
(Lodge 2005). If this is indeed the case, valuable island and shoreline habitats would be
inundated. In areas such as BISC and DRTO, this may mean loss of much of the terrestrial park
area over the next couple of centuries. Park units like EVER and eventually BICY would see a
substantial loss of land area, due to gradual and/or sporadic inward encroachment of mangroves
into brackish and freshwater areas coupled with conversion of freshwater marsh to brackish and
saline marsh. The Virgin Island parks will probably experience less impact due to sea level rise
than the low-lying south Florida parks. The steeper islands of VIIS and BUIS may lose some
low-lying areas, but overall most of the park areas will be unaffected. In ocean environments, sea
level rise may affect the deepest coral reefs if they fall below the light zone at a rate faster than
their growth.
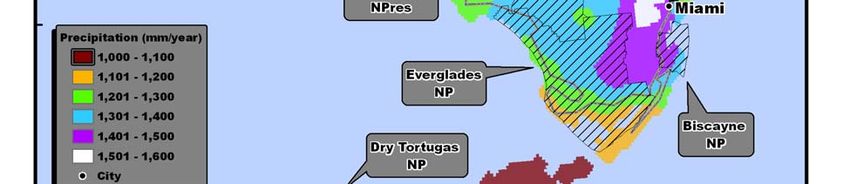
2.2. Spatial Variability
The SFCN is in a warm to hot, humid subtropical environment. As a result, annual precipitation
totals are generally quite high across the SFCN. In the park units around the Virgin Islands,
annual precipitation totals range from 900-1400 mm per year, with the steep topography of St.
John, Buck, and St. Croix Islands creating orographic effects with drier, east-facing slopes and
moister west-facing slopes (Patterson et al. 2005). In south Florida, interior locations are
generally the driest, with coastal locations receiving somewhat higher precipitation totals (Figure
102.1). The wettest locations are on the southeastern Florida peninsula, including portions of BISC,
with mean annual precipitation exceeding 1500 mm. The driest areas, including DRTO and
southernmost EVER, receive under 1200 mm on average each year.
As has been discussed previously, the SFCN experiences a marked dry cycle during the winter
and early springs months, with a wet cycle from late spring through early fall. This pattern can
be clearly seen for SFCN park units (Figure 2.2). The wet season includes precipitation maxima
both in late spring and in late summer/early fall. The latter maxima is more prominent for
locations within the SFCN that are not on the Florida Peninsula, including DRTO and the Virgin
Islands park units (e.g., see Figure 2.2b,c). On the Florida Peninsula, the primary wet-season
precipitation maximum occurs earlier in the summer. This wet-season precipitation is greatest
along the Gulf Coast, with lesser amounts to the south and east, especially for DRTO and
southern EVER (Figure 2.3).
Temperatures in the SFCN are generally characterized by small year-round variations, especially
in the Caribbean Sea. The park units on the Virgin Islands have daily temperatures that range
from lows between 23-27°C and highs between 29-32°C. The Florida peninsula has the greatest
spatial and temporal temperature variations in the SFCN. Mean annual temperatures on the
Florida peninsula generally follow a latitudinal gradient, with cooler conditions to the north
(Figure 2.4). Mean annual temperatures within Florida park units range from under 23°C to near
25°C. Winter temperatures tend to follow this same latitudinal gradient. January minimum
temperatures (Figure 2.5) range from under 12°C in BICY and northern portions of EVER to
over 15°C in DRTO and southern EVER. Summer temperatures on the Florida peninsula tend to
be a function of distance from the coast, with interior locations being the warmest. In BICY,
mean July maximum temperatures exceed 32°C (Figure 2.6). However, coastal areas like BISC
and southwestern EVER see cooler conditions, with mean July maximum temperatures below
31°C.
2.3. Temporal Variability
Climate trend analyses suggest that the SFCN region may become warmer and wetter in the next
century, with corresponding impacts such as sea level rises (NAST 2001). The frequency of
extreme climate events may also increase, although this is still very uncertain. An investigation
of precipitation in southern Florida during the past century (Figure 2.7) reveals no obvious trend.
Temperatures across southern Florida have shown an overall warming during the past century,
with substantial warming in the past 2-3 decades (Figure 2.8).
The El Niño Southern Oscillation (ENSO) influences interannual climate variability in the SFCN
(NAST 2001). Warm ENSO phases (El Niño events) tend to bring cooler and wetter winter
conditions across the Florida peninsula, with increased occurrences of severe thunderstorm
outbreaks. Occurrences of hurricanes and other tropical storm activity also tend to decrease
throughout the SFCN during warm ENSO phases (Gray 1984a; 1984b; Goldenberg and Shapiro
1996; Bove et al. 1998).
11Figure 2.1. Mean annual precipitation, 1961-1990, for the SFCN.
12a)
b)
c)
Figure 2.2. Mean monthly precipitation at selected stations in the SFCN. Locations include Tamiami Trail
40 Mi. Ben (a) near EVER, Key West Airport (b) east of DRTO (b), and Charlotte Amalie Har. (c) near
BUIS and SARI.
13Figure 2.3. Mean July precipitation, 1961-1990, for the SFCN.
14Figure 2.4. Mean annual temperature, 1961-1990, for the SFCN.
15Figure 2.5. Mean January minimum temperature, 1961-1990, for the SFCN.
16Figure 2.6. Mean July maximum temperature, 1961-1990, for the SFCN.
17Figure 2.7. Precipitation time series, 1895-2005, for southern Florida, including twelve-month precipitation
(ending in December) (red), 10-year running mean (blue), mean (green), and plus/minus one standard
deviation (green dotted).
Figure 2.8. Temperature time series, 1895-2005, for southern Florida, including twelve-month average
temperature (ending in December) (red), 10-year running mean (blue), mean (green), and plus/minus one
standard deviation (green dotted).
182.4. Parameter Regression on Independent Slopes Model
The climate maps presented in this report were generated using the Parameter Regression on
Independent Slopes Model (PRISM). This model was developed to address the extreme spatial
and elevation gradients exhibited by the climate of the U.S. (Daly et al. 1994; 2002; Gibson et al.
2002; Doggett et al. 2004). The maps produced through PRISM have undergone rigorous
evaluation in the U.S. This model was developed originally to provide climate information at
scales matching available land-cover maps to assist in ecologic modeling. The PRISM technique
accounts for the scale-dependent effects of topography on mean values of climate elements.
Elevation provides the first-order constraint for the mapped climate fields, with slope and
orientation (aspect) providing second-order constraints. The model has been enhanced gradually
to address inversions, coast/land gradients, and climate patterns in small-scale trapping basins.
Monthly climate fields are generated by PRISM to account for seasonal variations in elevation
gradients in climate elements. These monthly climate fields then can be combined into seasonal
and annual climate fields. Since PRISM maps are grid maps, they do not replicate point values
but rather, for a given grid cell, represent the grid-cell average of the climate variable in question
at the average elevation for that cell. The model relies on observed surface and upper-air
measurements to estimate spatial climate fields.
193.0. Methods
Having discussed the climatic characteristics of the SFCN, we now present the procedures that
were used to obtain information for weather/climate stations within the SFCN. This information
was obtained from various sources, as mentioned in the following paragraphs. Retrieval of
station metadata constituted a major component of this work.
3.1. Metadata Retrieval
A key component of station inventories is determining the kinds of observations that have been
conducted over time, by whom, and in what manner; when each type of observation began and
ended; and whether these observations are still being conducted. Metadata about the
observational process (Table 3.1) generally consist of a series of vignettes that apply to time
intervals and, therefore, constitute a history rather than a single snapshot. An expanded list of
relevant metadata fields for this inventory is provided in Appendix E. This report has relied on
metadata records from three sources: (a) Western Regional Climate Center (WRCC), (b) NPS
personnel, and (c) other knowledgeable personnel, such as state climate office staff.
The initial metadata sources for this report were stored at WRCC. This regional climate center
(RCC) acts as a working repository of many western climate records, including the main
networks outlined in this section. The WRCC conducts live and periodic data collection (ingests)
from all major national and western weather/climate networks. These networks include the
COOP network, the Surface Airways Observation network (SAO) operated by NWS and the
Federal Aviation Administration (FAA), the interagency RAWS network, and various smaller
networks. The WRCC is expanding its capability to ingest information from other networks as
resources permit and usefulness dictates. This center has relied heavily on historic archives (in
many cases supplemented with live ingests) to assess the quantity (not necessarily quality) of
data available for NPS I&M network applications.
The primary source of metadata at WRCC is the Applied Climate Information System (ACIS), a
joint effort among RCCs and other NOAA entities. Metadata for SFCN weather/climate stations
identified from the ACIS database are available in file “SFCN_from_ACIS.tar.gz” (see
Appendix F). Historic metadata pertaining to major climate- and weather-observing systems in
the U.S. are stored in ACIS where metadata are linked to the observed data. A distributed
system, ACIS is synchronized among the RCCs. Mainstream software is utilized, including
Postgress, Python™, and Java™ programming languages; CORBA®-compliant network
software; and industry-standard, nonproprietary hardware and software. Metadata and data for all
major national climate and weather networks have been entered into the ACIS database. For this
project, the available metadata from many smaller networks also have been entered but in most
cases the actual data have not yet been entered. Data sets are in the NetCDF (Network Common
Data Form) format, but the design allows for integration with legacy systems, including non-
NetCDF files (used at WRCC) and additional metadata (added for this project). The ACIS also
supports a suite of products to visualize or summarize data from these data sets. National
climate-monitoring maps are updated daily using the ACIS data feed. The developmental phases
of ACIS have utilized metadata supplied by the NCDC and NWS with many tens of thousands of
entries, screened as well as possible for duplications, mistakes, and omissions.
20You can also read