Cytokine Patterns of T helper cells in Healthy Donors and Patients with Multiple Sclerosis - Refubium
←
→
Page content transcription
If your browser does not render page correctly, please read the page content below
Aus dem Deutschen Rheumaforschungszentrum Berlin

                                  DISSERTATION

                  Cytokine Patterns of T helper cells
      in Healthy Donors and Patients with Multiple Sclerosis

                  zur Erlangung des akademischen Grades

                         Doctor medicinae (Dr. med.)

                    vorgelegt der Medizinischen Fakultät

                     Charité – Universitätsmedizin Berlin

                                      von

                     Meron Ariana de Oliveira Mekonnen

                                   aus Leipzig

Datum der Promotion: 04.06.2021

                                                               1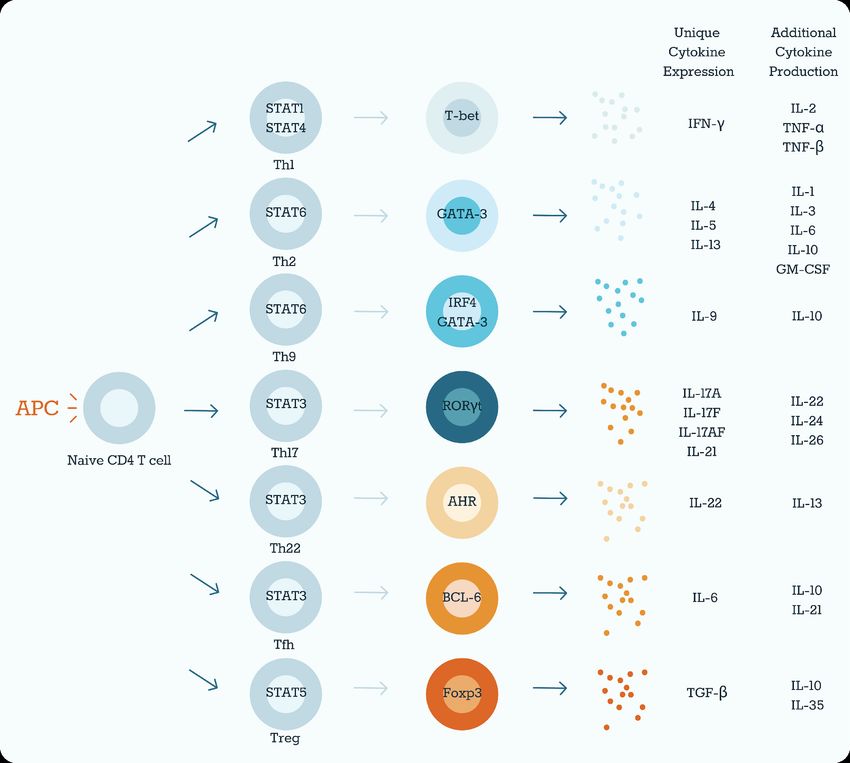
“Nothing in life is to be feared, it is only to be understood.
Now is the time to understand more, so that we may fear less.”
                                                      Marie Curie

                                                                 2
I. Table of Contents
I. Table of Contents ..................................................................................................... 3

II. List of Tables ........................................................................................................... 6

III. List of Figures ......................................................................................................... 7

IV. List of Abbreviations ............................................................................................... 8

V. Abstract ................................................................................................................. 11

VI. Zusammenfassung ............................................................................................... 12

1 Introduction .......................................................................................................... 13

     1.1       Immunological Background ....................................................................... 13

      1.1.1       T cell Activation and Regulation ............................................................. 14

      1.1.2       Cytokines in T cell Activation and Differentiation ................................... 14

      1.1.3       Immune Checkpoint Receptors .............................................................. 16

         1.1.3.1        Stimulatory Checkpoint Molecules .................................................. 17

         1.1.3.2        Inhibitory Checkpoint Molecules ...................................................... 18

      1.1.4       Human CD3+ CD20+ T cells ................................................................. 21

      1.1.5       Generation of Immunological Memory ................................................... 22

     1.2       Multiple Sclerosis ...................................................................................... 22

      1.2.1       Etiology .................................................................................................. 23

      1.2.2       Pathomechanisms ................................................................................. 23

      1.2.3       Immunological Mechanisms in MS ........................................................ 24

         1.2.3.1        The Role of Th1 and Th17 in MS .................................................... 24

         1.2.3.2        T cell Cytokine Networks in MS ....................................................... 24

      1.2.4       Clinical Presentation .............................................................................. 25

      1.2.5       Therapy .................................................................................................. 26

     1.3       Objective ................................................................................................... 29

2 Material and Methods ........................................................................................... 30

     2.1       Patient Cohort ........................................................................................... 30

                                                                                                                              3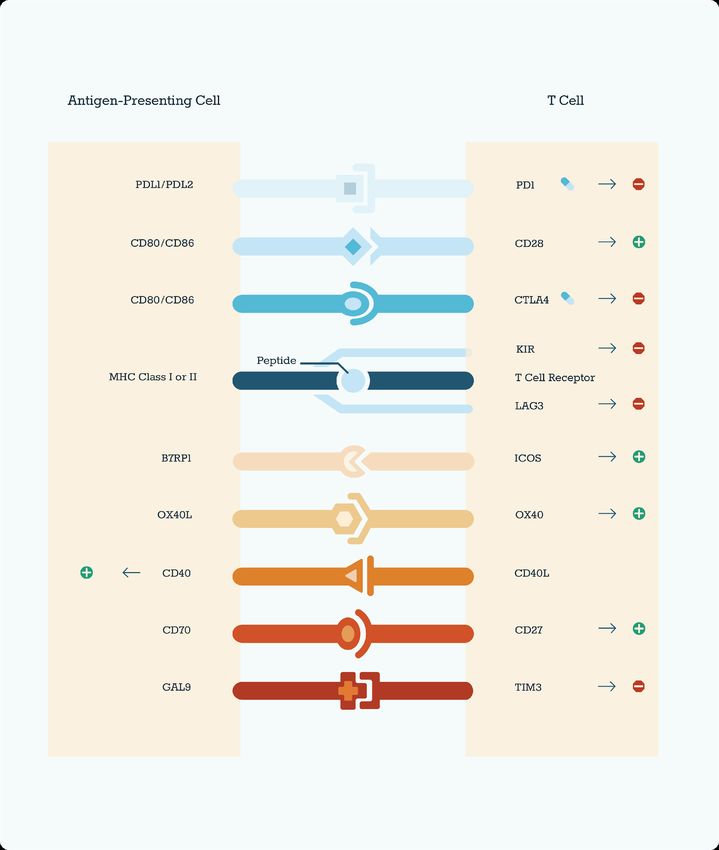
2.2       Materials .................................................................................................... 31

      2.2.1       Chemicals and Reagents ....................................................................... 31

      2.2.2       Buffers and Media .................................................................................. 31

      2.2.3       Antibodies and Beads ............................................................................ 32

      2.2.4       Consumables ......................................................................................... 33

      2.2.5       Technical Equipment ............................................................................. 33

      2.2.6       Optical Layouts ...................................................................................... 34

         2.2.6.1        BD FACS Canto™ II ........................................................................ 34

         2.2.6.2        BD LSR Fortessa™ ......................................................................... 34

         2.2.6.3        BD FACSymphony™ ....................................................................... 35

     2.3       Methods..................................................................................................... 36

      2.3.1       PBMC Isolation ...................................................................................... 36

      2.3.2       MACS Sort ............................................................................................. 36

      2.3.3       In-vitro Stimulation of Isolated CD4+ T cells .......................................... 37

      2.3.4       Staining for Flow Cytometry ................................................................... 37

      2.3.5       Multicolour Flow Cytometry .................................................................... 38

     2.4       Analysis ..................................................................................................... 39

      2.4.1       Data Processing ..................................................................................... 39

      2.4.2       Data Visualization .................................................................................. 40

      2.4.3       Statistical Analysis ................................................................................. 41

3 Results ................................................................................................................. 42

     3.1       Analysis of Th Subsets .............................................................................. 42

      3.1.1       Th cell Subsets ...................................................................................... 42

      3.1.2       Cytokine Production in T cell Subsets ................................................... 43

      3.1.3       Different Patterns of Cytokine Levels with T cell Exhaustion/Activation 45

      3.1.4       Cytokine Co-Producers .......................................................................... 49

     3.2       Th cell Analysis in MS Patients ................................................................. 50

      3.2.1       Cytokine-Producers in MS Patients ....................................................... 52
                                                                                                             4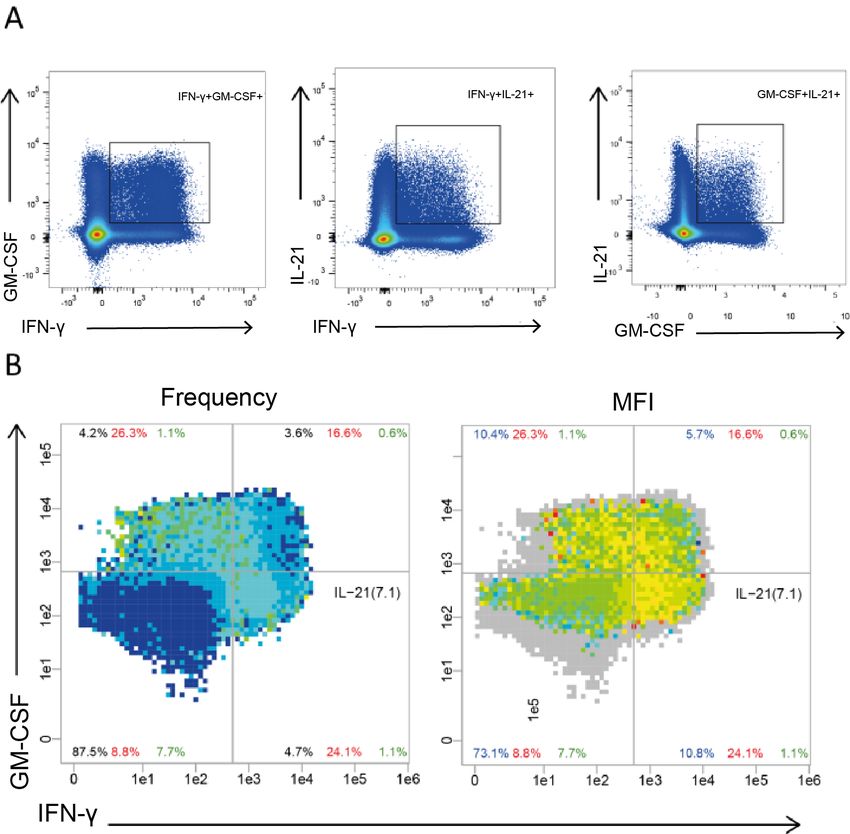
3.2.2       T cell Checkpoint Receptors in MS Patients .......................................... 57

      3.2.3       Effect of Medication on T cell Subsets in MS ......................................... 57

     3.3       CD3+ CD20+ T cells ................................................................................. 60

      3.3.1       CD20+ T cells in MS .............................................................................. 61

      3.3.2       Memory Phenotype of CD20+ Th cells .................................................. 63

      3.3.3       Cytokine Production Capacities of CD20+ Th cells ............................... 64

      3.3.4       Features of Activation in CD20+ Th cells ............................................... 65

4 Discussion ............................................................................................................ 66

     4.1       Th cell Subsets with Strong Activation Profile ........................................... 66

      4.1.1       IL-21-Producers Exhibit a Diverse Cytokine Profile ............................... 66

      4.1.2       PD-1 Helps to Characterize Cytokine-Producing Subpopulations ......... 67

      4.1.3       CD20+ T cells likely Pro-Inflammatory Cells with Memory Potential ..... 67

     4.2       Th cell Subsets in MS................................................................................ 68

      4.2.1       Patient Cohort ........................................................................................ 69

      4.2.2       Analyzing T cells from Peripheral Blood ................................................ 69

      4.2.3       Frequencies of Circulating Lymphocyte Populations in MS ................... 70

      4.2.4       Frequencies of Cytokine-Producing T cells in MS ................................. 71

      4.2.5       CD20+ T cells in MS .............................................................................. 73

      4.2.6       Immune Checkpoint Receptors in MS ................................................... 74

      4.2.7       PD-1+ Th cells in MS ............................................................................. 75

     4.3       Challenges in Analyzing High-dimensional FACS-Data ............................ 76

     4.4       Conclusion and Outlook ............................................................................ 78

5 Bibliography ......................................................................................................... 79

Eidesstattliche Versicherung ..................................................................................... 87

Lebenslauf ................................................................................................................. 88

Danksagung ............................................................................................................... 90

                                                                                                                             5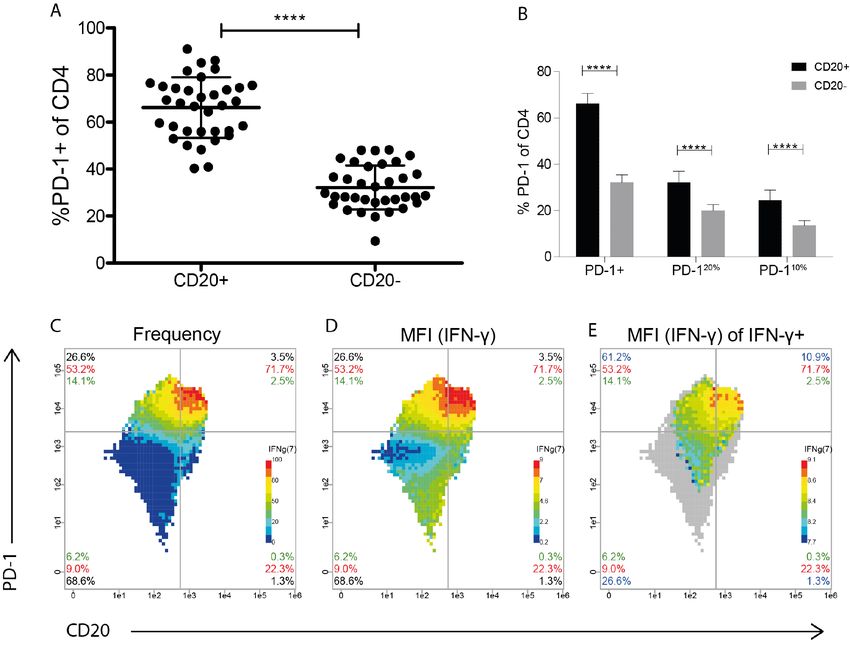
II. List of Tables
Table 1: Stage Therapy in MS - Simplified Schematic .............................................. 26
Table 2: Disease-Modifying Therapy - Moderate Presentation ................................. 27
Table 3: Disease-Modifying Therapy – Highly Active Progression ............................ 28
Table 4: Size and Demographic Characteristics of the Cohort .................................. 30
Table 5: Chemicals and Reagents ............................................................................. 31
Table 6: Buffers and Media ........................................................................................ 31
Table 7: Antibodies .................................................................................................... 32
Table 8: Beads ........................................................................................................... 32
Table 9: Consumables ............................................................................................... 33
Table 10: Technical Equipment ................................................................................. 33
Table 11: Optical Layout of BD FACS Canto™II ....................................................... 34
Table 12: Optical Layout of BD LSR Fortessa™ ....................................................... 34
Table 13: Optical Layout of BD FACSymphony™ ..................................................... 35
Table 14: Software ..................................................................................................... 35
Table 15: Frequency of Cytokine-Positive CD45RA- cells in PD-1 Subsets ............. 46
Table 16: Frequency of Cytokine-Positive CD45RA- cells in PD-1 Subsets ............. 47
Table 17: Cytokine Production in Tem MS and Healthy Controls .............................. 52
Table 18: Influence of Medication on Cytokine Frequencies-Overview ..................... 58

                                                                                                                           6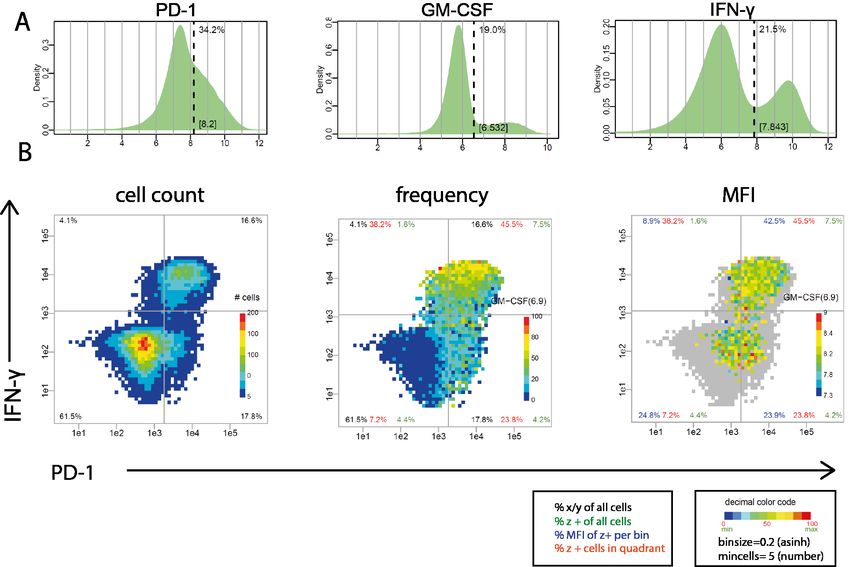
III. List of Figures
Figure 1: Th Plasticity ................................................................................................ 15
Figure 2: Role of OX40 Signaling in T cell Differentiation .......................................... 18
Figure 3: Checkpoint Molecules in T cell Immunology .............................................. 20
Figure 4: Distribution of Blood Components after Density Gradient Centrifugation ... 36
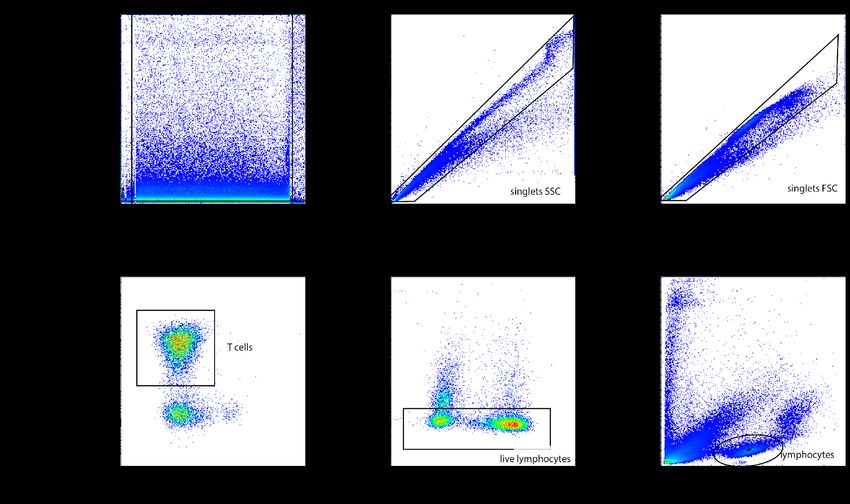
Figure 5: Exemplary Gating Strategy to Identify T cells ............................................. 39
Figure 6: PRI-Pattern Recognition of Immune Cells .................................................. 40
Figure 7: Statistical Tests - Decision Tree ................................................................. 41
Figure 8: Identification of T cell Subsets by Expression of CCR7 and CD45RA ....... 42
Figure 9: Subsets among CD4+ T cells ..................................................................... 44
Figure 10: PD-1 Expression in Relation to CCR7 and CD45RA ................................ 45
Figure 11: Correlation of IFN-ɣ, IL-10, and IL-21 with PD-1 Expression in Tmem .... 46
Figure 12: Cytokines with No Correlation with PD-1 Expression in Tmem ................ 47
Figure 13: IFN-ɣ+GM-CSF+ and IFN-ɣ+IL-21+ Th cells ............................................ 48
Figure 14: Co-Production of GM-CSF, IFN-ɣ, and IL-21 ........................................... 49
Figure 15: T cell Subsets - Comparison between Patients and Healthy Controls ..... 50
Figure 16: Frequencies of Th Subsets in Patients and Healthy Controls .................. 51
Figure 17: Cytokine Production in Tem in Patients and Healthy Controls ................. 52
Figure 18: IL-17 Co-Producing Tem in Patients and Healthy Controls ...................... 53
Figure 19: IL-21 Co-Producing Tem in Patients and Healthy Controls ...................... 54
Figure 20: GM-CSF+IFN-ɣ+ and GM-CSF+TNF-α+ Tem in Patients and Healthy
Controls ..................................................................................................................... 55
Figure 21: IFN-ɣ+TNF-α+ and IFN-ɣ+IL-22+ Tem in Patients and Healthy Controls. 56
Figure 22: OX40+ and PD-1+ Tem in Patients and Healthy Controls ....................... 57
Figure 23: Frequencies of CD4+ Subsets - Effect of Medication ............................... 58
Figure 24: Cytokine-Producing CD4+ T cells - Effect of Medication .......................... 59
Figure 25: Gating Strategy to Identify CD20+ T cells ................................................ 60
Figure 26: CD4/CD8 Ratio is Higher in CD20+ T cells compared to CD20- T cells .. 60
Figure 27: Frequencies of CD20+ T cells in Patients and Healthy Controls .............. 61
Figure 28: CD20+ T cells: Effect of Medication ......................................................... 62
Figure 29: CD4+ CD20+ T cells Display Effector Memory Phenotype ...................... 63
Figure 30: Cytokines Elevated in CD20+ Th cells ..................................................... 64
Figure 31: Cytokines with No Elevation in CD20+ Th cells........................................ 64
Figure 32: PD-1 is Upregulated in CD20+ Th cells .................................................... 65
7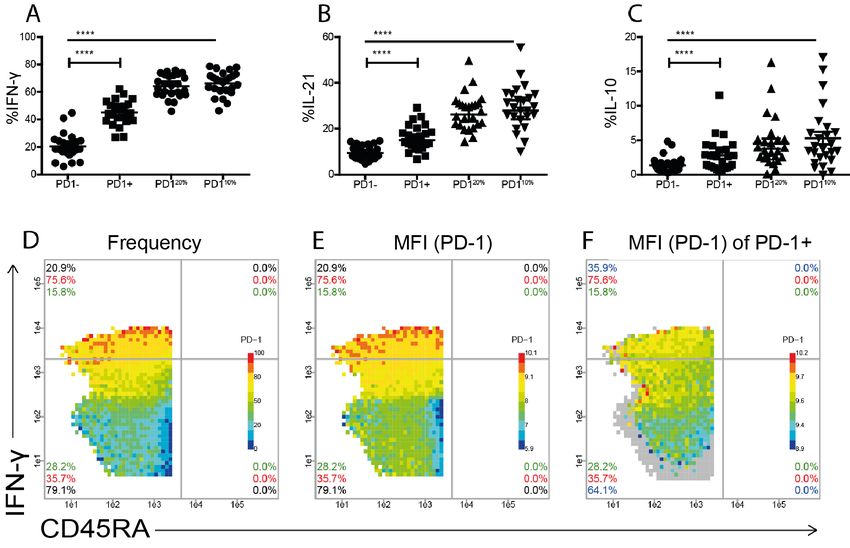
IV. List of Abbreviations
AF                                                                   Alexa Fluor
AF750                                         Alexa Fluor 750 succinimidyl ester
AP1                                                        Activator protein one
APC                                                      Antigen-presenting cell
BFA                                                                  Brefeldin A
BP                                                               Bandpass filter
Bregs                                                         B-regulatory cells
BSA                                                       Bovine serum albumin
BUV                                                           Brilliant ultraviolet
BV                                                                 Brilliant violet
CCR7                                             C-C chemokine receptor type 7
CD                                                      Cluster of differentiation
CI                                                          Confidence interval
CIS                                                 Clinically isolated syndrome
CMV                                                            Cytomegalovirus
CNS                                                     Central nervous system
CSF                                                          Cerebrospinal fluid
CXCR                                            C-X-C chemokine receptor type
DAPI                4’,6-Diamidine-2-phenylindole, 4’,6-Diamidine-2-phenylindole
DMF                                                           Dimethyl fumarate
DMSO                                                          Dimethyl sulfoxide
EAE                                      Experimental Autoimmune Encephalitis
EBV                                                          Epstein–Barr virus
EDTA                                            Ethylenediaminetetraacetic acid
FA                                                                Formaldehyde
FACS                                         Fluorescence-activated cell sorting
FCS                                                             Fetal calf serum
FSC                                                             Forward scatter
FITC                                                 Fluorescein isothiocyanate
FMO                                                    Fluorescence minus one
GM-CSF                        Granulocyte-macrophage-colony-stimulating factor
HLA                                                   Human leukocyte antigen
IL                                                                    Interleukin
                                                                                 8
INF-γ                                                    Interferon gamma
JAK                                                           Janus kinase
LP                                                          Longpass filter
mAB                                                   Monoclonal antibody
MACS                                        Magnetic-activated cell sorting
MBP                                                    Myelin basic protein
MFI                                           Mean flourescence intensity
MHC                                       Major histocompatibility complex
MOG                                   Myelin oligodendrocyte glycoprotein
MRI                                          Magnetic resonance imaging
MS                                                       Multiple Sclerosis
NFAT                                     Nuclear factor of activated T cells
NF-κB        Nuclear factor kappa-light-chain-enhancer of activated B cells
NHS                                                 N-hydroxysuccinimide
NK cells                                                 Natural Killer cells
Nrf2                            Nuclear-Factor-(Erythroid-derived-2)-like-2
NSCLC                                           Non-small-cell lung cancer
PacB                                                            Pacific blue
PacO                                                         Pacific orange
PBMCs                                  Peripheral blood mononuclear cells
PBS                                             Phosphate-buffered saline
PE                                                           Phycoerythrin
PerCP                                                 Peridinin chlorophyll
PI3-kinase                                  Phosphatidylinositide-3-kinase
PKC                                                       Protein-kinase-C
PMA                                       Phorbol-12-myristate-13-acetate
PPMS                                Primary-progressive Multiple Sclerosis
PRI                                  Pattern Recognition of Immune Cells
RA                                                    Rheumatoid arthritis
RPMI                                       Roswell Park Memorial Institute
RRMS                                 Relapsing-remitting Multiple Sclerosis
SLE                                         Systemic lupus erythematosus
SPMS                             Secondary-progressive Multiple Sclerosis
SSC                                                      Sideward Scatter

                                                                           9
STAT Signal Transducers and Activators of Transcription
Tcm Central memory T cells
TCR T cell receptor
Te Effector T cells
Tem Effector memory T cells
Th T helper
Tmem Memory T cells
Tn Naïve T cells
TNF-α Tumor necrosis factor alpha
Treg Regulatory T cells
10V. Abstract
The activation of autoreactive T helper cells (Th cells) plays an essential role in the
pathogenesis of demyelinating chronic autoimmune diseases, such as Multiple
Sclerosis (MS). Uncovering the molecular mechanisms of these cells, by analyzing
cytokine patterns and surface activation markers, therefore, provides an important
insight into the activated T cell repertoire and consequently helps to unveil
auto-immunological mechanisms.
In this study, CD4+ T cells obtained from 16 healthy donors and 20 MS patients were
analyzed according to their memory features, expression of immune checkpoint
receptors and cytokine profiles in general and relating to disease-associated changes.
Complex relationships in the modulation of cytokine production were displayed with
the help of a novel bioinformatic approach for “pattern recognition of immune cells”
(PRI) developed in our group. Cytokine production in different Th subsets was
analyzed, as well as patterns in cytokine co-producing memory T cells.
We found that IFN-ɣ, IL-10 and IL-21 frequency in memory T cells were increased with
PD-1 upregulation whereas IL-2, IL-22 IL-17, GM-CSF, TNF-α showed no direct
correlation with PD-1 expression. In terms of cytokine production, flow cytometric data
revealed elevated frequencies of IL-10 producing effector memory T cells (Tem) in
MS patients compared to healthy donors. Furthermore, an increased frequency of the
OX40+ Th cells was found in MS patients. A subset of CD20+ T cells was identified
that showed increased cytokine production indicating polyfunctional capacities.
However, frequencies of CD20+ T cells in the blood of MS patients were comparable
to those in healthy donors. We demonstrated the occurrence of a variety of complex
Th cell subsets with memory and activation features and proposed PRI as a viable tool
to characterize these subpopulations.
With MS being an extremely heterogeneous disease, frequencies of circulating T cells
and cytokine-producing subsets showed significant spreading and did not generally
correlate with disease status. Still, the analysis of cytokine profiles as well as surface
receptor analysis provides important insight into the complex pathogenic mechanism
in MS.
11VI. Zusammenfassung
Autoreaktive T-Helferzellen und deren Aktivierung spielen eine wesentliche Rolle bei
der Pathogenese chronisch-demyelinisierender Autoimmunerkrankungen, wie z.B. der
Multiplen Sklerose. Um die zugrunde liegenden molekularen Mechanismen besser zu
erkennen und zu verstehen, wurden in dieser Arbeit kombinatorische Zytokinmuster
und Oberflächenaktivierungsmarker analysiert.
Es wurden CD4+ T-Zellen von 16 gesunden Spendern und 20 MS-Patienten bezüglich
der Expression von Gedächtnismarkern, Immun-Checkpoint-Rezeptoren und
Zytokinprofilen von T-Helferzellen im Allgemeinen, sowie im Hinblick auf
krankheitsassoziierte Veränderungen analysiert. Komplexe Zusammenhänge in der
Modulation der Zytokinproduktion wurden mit Hilfe eines in unserer Gruppe
entwickelten neuartigen bioinformatischen Ansatzes zur „Mustererkennung von
Immunzellen“ (PRI) dargestellt. Die Zytokinproduktion in verschiedenen
T-Helfer-Zell-Subpopulationen, sowie Muster in Zytokin-koproduzierenden
Gedächtnis-T-Zellen wurden analysiert.
Es konnte gezeigt werden, dass die Frequenzen von IFN-ɣ+, IL-10+ und IL-21+
T-Zellen mit der Expression von PD-1 positiv korrelierten. Weiterhin konnte eine
Erhöhung der Frequenz von IL-10 produzierenden T-Zellen bei Patienten mit Multipler
Sklerose im Vergleich zu gesunden Spendern beobachtet werden. Darüber hinaus
wurde bei den untersuchten Patienten eine erhöhte Frequenz der OX40+
T-Helferzellen festgestellt. Die Analyse der CD20+ T-Zellen zeigte eine erhöhte
Zytokinproduktion und Aktivierungsmerkmale und weist somit auf polyfunktionale
Kapazitäten dieser Zellen hin. Die Häufigkeit von CD20+ T-Zellen bei MS-Patienten
war jedoch mit der von gesunden Spendern vergleichbar.
Diese Arbeit zeigt das Auftreten einer Vielzahl von komplexen T-Helfer-Zell-Subsets
mit ihren Zytokinproduktionen und Aktivierungsfunktionen auf und präsentiert PRI als
neues und hilfreiches Werkzeug zur Charakterisierung multifunktionaler
Zell-Subpopulationen. Die Arbeit liefert insgesamt wichtige Einblicke in die komplexen
Aktivierungsmechanismen von T-Zellen, die unter anderem bei der Pathogenese der
Multiplen Sklerose eine wichtige Rolle spielen.
121 Introduction
1.1 Immunological Background
The human immune system forms the basis for the defense against the variety of
pathogens or common microorganisms potentially invading and attacking the host’s
integrity. The two main subsystems working together, as pillars for the immunological
defense, are known as the innate- and the adaptive immune system.
The innate immune system is characterized by its rapid response capabilities.
Common features of pathogens can be detected via invariant receptors and
consequently an immediate response is initiated. Involved in this response is the
secretion of cytokines and chemokines as well as a variety of innate leukocytes i.e.,
dendritic cells, phagocytic cells, natural killer cells (NK cells), and the complement
cascade. A main important function of the adaptive immune system is the formation of
immunological memory. Necessary to that end is the adaptive immune system, also
known as the specific immune system. It has the ability to generate differentiated
memory lymphocytes through clonal selection, leading to antigen-specific effector cells
and thus an enhanced and more effective response upon antigen re-encounter. Both
innate and adaptive immune systems comprise features of humoral as well as cellular
defense mechanisms.
T cells play a crucial role in both of these branches of the adaptive immune system,
especially in the context of cell-mediated immunity. The T cell receptor (TCR)
recognizes antigens or peptide fragments presented by major histocompatibility
complex (MHC) molecules (1). Cytotoxic T cells then directly eliminate intracellular
pathogens whereas extracellular pathogens are combated via activation of B cells and
macrophages by Th cells (2). The majority of T cells in humans are termed αβ-T cells
for the αβ chain on the TCR; these will be the ones regularly mentioned in this work.
Furthermore, there is a small subset, the ɣδ-T cells, with a more limited TCR repertoire.
These cells are mainly located in the epithelia, e.g., of the skin and intestine, and differ
significantly in their development and function from αβ-T cells. They are commonly
more closely classified as part of the innate immune system (3, 4). T cells not only play
a central role in mediating an appropriate immune response but can also be involved
in the pathogenesis of inflammatory autoimmune diseases such as MS when the
immune system is dysregulated and immunological self-tolerance cannot be
maintained.
131.1.1 T cell Activation and Regulation
Antigen-Specific Activation
To activate a naïve T cell in the first place, an antigen-specific signal is required. This
consists of the interaction of the respective TCR with the MHC complex of the
antigen-presenting cell (APC) (1). After a successful TCR antigen recognition the
activated T cell activates transcription factors like nuclear factor of activated T cells
(NFAT), activator protein one (AP1) or nuclear factor kappa-light-chain-enhancer of
activated B cells (NF-κB) (5), which are essential to IL-2 transcription and which in turn
induce T cells proliferation by clonal expansion (6). Furthermore, the APC will initiate
at least two more signals, essential to successful T cell activation and differentiation.
For one thing, a costimulatory signal is needed to ensure survival and expansion of the
T cell (costimulatory signals are further detailed under 1.2.1) and second, a signal to
control differentiation into a specific effector T cell subtype. This applies in particular to
CD4+ T cells. This differentiation is mainly, albeit not exclusively, driven and regulated
by cytokines (7). Different transcription factors of Signal Transducers and Activators of
Transcription (STATs) function as gene expression promoters towards specialized
effector Th and regulatory T cells (Tregs) (8). Individual subsets are aimed at distinct
response tasks like e.g., pathogen types, characterized by master transcription factors
and signature cytokines (Figure 1).
1.1.2 Cytokines in T cell Activation and Differentiation
All effector T cells (Te) produce cytokines. Cytokines are defined as ‘proteins that are
released by various cells in the body, [...] and they induce responses through binding
to specific receptors (9). Their general function can be summarized as the activation
and stimulation of other T cells, B cells, and macrophages, hematopoietic and other
somatic cells. They are a structurally diverse group and specific effects depend and
vary according to the respective target. In synergy with other effector molecules,
combinatorial functions can be achieved. These effects can cause an impact either
locally in an autocrine or paracrine manner, as well as in the various peripheral tissues,
in an endocrine manner (7). The cytokines play a central role in regulating the
differentiation of the Th cell spectrum, into the diverse subtypes, including Th1, Th2,
Th3, Th9, Th17, Tregs or T follicular helper cells (Tfh). Interleukin-12 (IL-12), for
example, induces Th1 cells. In contrast, the influence of Interleukin-4 (IL-4) causes the
14induction of Th2 (Figure 1) (10). Subtypes show a certain degree of plasticity that
allows differentiation from one type into another.
Figure 1: Th Plasticity
APCs transmit antigen-specific activation signals. Subsequently, naive CD4+ T cells are differentiated into different
effector Th and Treg subtypes. These are characterized by lineage-specific properties. Figure 1 shows the
differentiation of the different subgroups, driven by individual transcription regulators (STATs), as well as the key
transcription factors and unique cytokines primarily secreted by the respective cell type. Apart from these, additional
cytokines can be secreted by each subset as indicated in the column on the right.
Not only do cytokines drive the physiological T cell differentiation process but they also
have important implications in pathological inflammatory mechanisms. INF-γ for
example, which is produced by Th1 cells, has been known to play a major role in
autoimmune diseases such as MS (11) or Diabetes mellitus (12).
15Multi-cytokine-producing virus-specific CD4+ T cells are functionally superior to
single-cytokine-producing T cells. Among the triple producers, more cells express the
activation marker CD40L. They exhibit a higher degranulation potential as well as a
higher level of cytokines per cell (13). All these features are indicators of higher
functional capacity of multi-cytokine-producers within the CD4 repertoire. Therefore,
they play a relevant role in the genesis of infectious and autoimmune diseases and
make for an important target of diagnostic and therapeutic approaches.
Effector Function
IL-2 induced proliferation of T cells eventually leads to differentiation into effector cells
after approximately 4 to 5 days of circulation. These now do not require a costimulatory
signal for activation, however the activation threshold will be lowered by the presence
of co-stimulatory molecules. This applies to the helper and cytotoxic T cells equally.
An effector T cell also has a modified repertoire of surface molecules, such as cell
adhesion molecules and receptors. In contrast to naïve cells, there are for example no
receptors for L-selectin or CD45RO on activated effector cells. However, lately they do
express receptors for integrin VLA-4 and CD45RA.
CD4+ T cells then go on to differentiate into a variety of functionally different effector
cells. The first ones to be described were Th1, Th2 and were therefore named
accordingly. Other subsets are named for their signature cytokine, like Th17 cells, that
are known for secreting IL-17, or for their functions, like Tfh cells, that provide help to
B cells within the lymphoid follicles and Tregs that downregulate T cell activation. In
this, the priming APC and the local environment (cytokines, etc.) during activation have
a determining influence on the fate of the individual progenies of a naïve T cell.
1.1.3 Immune Checkpoint Receptors
Even after primary selection within the thymus, a small number of autoreactive T cells
may remain undetected, then go on to circulate peripherally and therefore potentially
lead to autoimmune reactions. To modulate the complex immune pathways,
checkpoints are needed to enhance or moderate the variety of signals in order to
warrant a more differentiated host response. Figure 3 shows a selection of checkpoint
markers with corresponding ligands and their effects that are necessary to ensure an
appropriate response while maintaining host integrity.
161.1.3.1 Stimulatory Checkpoint Molecules
Earlier theories concerning immune checkpoint receptors assumed two steps toward
successful activation of naïve T cells via two consecutive signals, typically from the
same APC. The first interaction entails the interaction between the
antigen-MHC-complex and the TCR. Afterward, the second step is a costimulatory
signal mediated by specific receptors expressed respectively on APCs and T cells. A
classic example of this would be the binding of CD80 or CD86, surface proteins from
the B7 family to the costimulatory TCR CD28 on T cells (14). If no costimulatory signal
follows the initial TCR activation, the consequence will be T cell anergy. T cell anergy
is the mechanism by which the functional inactivation of lymphocytes after antigen
contact occurs. In the presence of a costimulatory signal, however,
phosphatidylinositide-3-kinase (PI3-kinase) is activated and amplifies synthesis or
activation of IL-2 and high-affinity IL-2 receptors (6, 15). Since IL-2 drives proliferation,
this cascade enhances cell growth and survival. Therefore, only an antigen-specific
signal followed by the costimulatory cascade will lead to T cell activation. This ensures
an appropriate immune response and acts as a safeguard against autoimmunity. This
theory was expanded with the discovery of the co-inhibitory signals (1.1.3.2). OX40
(CD134) is one of the key costimulatory molecules involved in controlling T cells
besides the-CD28 pathway. OX40 and its Ligand OX40L or CD252 are members of
the TNFR/TNF superfamily. OX40 can be expressed on activated cytotoxic and
Th cells but is not found on resting naïve T cells or most resting memory T cells. OX40L
can be induced on professional APC such as B cells, dendritic cells, and macrophages.
The primary function of an OX40 signal is the induction of cell division and survival in
T cells, which in turn leads to clonal expansion of effector and memory populations
(Figure 2). Furthermore, suppression of Tregs has been described as an effect of
OX40 signaling. A secondary function of OX40 and OX40L is also the regulation of
cytokine production from T cells, APCs, NK cells, and NKT cells. After the effector-
phase response OX40 is downregulated to baseline levels. Subsequently, in the event
of a re-encounter with the antigen, it can be rapidly re-expressed on memory T cells
(16).
OX40/OX40L interactions have been shown to have critical involvement in the
development of a variety of inflammatory and autoimmune diseases (17). In other
words, in active white matter lesions of MS patients an upregulation could be observed
17(18). Additionally, the treatment with OX40L monoclonal antibodies (mAB) or deleting
OX40+ myelin-reactive T cells led to the regression of the disease (18, 19).
Therefore, blocking the OX40 ligand holds great potential in managing autoimmune
disease while further investigation into the receptor is needed to evaluate potential
risks and benefits of its medical use.
Figure 2: Role of OX40 Signaling in T cell Differentiation
OX40 affects the size of the Tem cell pool. OX40L binds to OX40 on recently activated naïve T cells. The OX40
signal induces clonal expansion and promotes the survival of Tem precursors. Tcm precursors develop
independently of OX40. OX40 is therefore crucial for the CD4+ T cell memory, as Tem generally predominates.
1.1.3.2 Inhibitory Checkpoint Molecules
Inhibitory signals are mediated by co-inhibitory receptors that act as immune
checkpoints and make a significant contribution to maintaining immune tolerance. One
of the most important representatives is the B7-1/B7-2- CD28/CTLA-4 pathway,
essential for detecting potentially autoreactive T cells and ensuring adequate activation
(20). CTLA-4 (Cytotoxic T-lymphocyte-associated protein 4) is generally expressed on
Tregs and gets upregulated in conventional T cells only after activation. CTLA-4 has a
higher binding affinity to B7 molecules CD80 and CD86 than CD28 (21) and since
CD28 transmits a stimulatory signal but CTLA-4 an inhibitory one, both molecules
compete for the same receptors, ultimately achieving a down-regulatory effect.
Therefore, CTLA-4 can potentially inhibit T cell activation in the absence of CD28 (22).
18PD-1 Programmed Cell Death Protein 1 (CD279) and its ligands PD-L1 (B7-H1,
CD274) and PD-L2 (B7-DC, CD273) are members of the B7/CD28 family that function
as negative immune regulators and are mainly expressed on the surface of activated
T cells (23). Initially named for its involvement in programmed cell death (24), the
complexity of PD-1 pathway functions is an ongoing subject of investigation. By
initiating a co-inhibitory signal on T cells, they play a key role in mediating
T cell response. PD-1 attenuates TCR signaling by influencing the cell cycle through
PI3-kinase/Akt and Ras/MEK/Erk pathways (25). Apart from inhibition of self-reactive
T cells, PD-1 is also associated with Treg induction, thereby playing a key role in
maintaining immune homeostasis. Transient PD-1 upregulation is a sign of T cell
activation, whereas sustained expression points to T cell exhaustion (26). During
chronic viral infection expression of coinhibitory receptors is linked to disease severity
(26). Ishida et al. contributed to understanding the PD-1 function by showing, that PD-1
deficient mice developed an autoimmune phenotype, (arthritis, splenomegaly, and
glomerulonephritis), albeit with delayed onset (24, 27). PD-1 pathways have been
shown to play a crucial role in transplantation, autoimmunity and tumor immunity.
Recently, the Nobel Prize for Medicine or Physiology award in 2018 drew widespread
public attention to this topic and highlighted the importance of research into these
structures. James P. Allison was honored for showing that the in vivo administrations
of CTLA-4 antibodies induced an anti-tumor response leading to tumor regression (28)
and Tasuku Honjo for isolating the PD-1 gene and demonstrating its involvement in
the classic type of programmed cell death (24). Within the context of tumor research,
groundbreaking insights have been gained in this regard, but in immunology,
particularly in the complex interaction of cytokines, detailed data are lacking. Detailed
new insights into the role of PD-1 in MS pathogenesis, therefore, offer promising
clinical approaches, especially considering the successful therapeutic application of
PD-1 modulation in tumor therapy.
19Figure 3: Checkpoint Molecules in T cell Immunology
The Figure shows various ligand-receptor interactions between T cells and APCs that regulate the T cell response
to antigen. The MHC-peptide complex is shown at the center. TCR - MHC interaction is the prerequisite for any
other signal to trigger a signal cascade. Examples of both co-stimulatory signals and inhibitory signals are shown.
Ligands can also bind to opposing receptors. Examples are CD28 and cytotoxic T lymphocyte-associated antigen 4
(CTLA4). Typically, the co-stimulation receptor is expressed on naïve and resting T cells, but the inhibitory receptor
is often upregulated after activation of the T cells. The communication between T cells and APCs is bidirectional,
which means that the ligands themselves can also transmit a signal to the APC. This is the case, for example, with
the upregulation of CD40L, which stifles receptors on APCs. Checkpoint pathways marked with pill symbols can
currently be pharmacologically influenced by checkpoint inhibitors already on the market and have been approved
for application.
201.1.4 Human CD3+ CD20+ T cells
Human T Lymphocytes have been known to partially express the CD20 Antigen for
quite some time (29). Initially, these findings have been disregarded as artifacts or
contamination and were controversially discussed. However, it was proven that they
do not express CD19 but instead αβ or ɣδ TCRs (30). They have increasingly become
a focus of interest, especially in the context of autoimmunity, while their function
remains largely unclear.
Of all circulating human T cells, 3-5 % express CD20 on their surface and transcribe
both CD3 and CD20. Functionally, increased frequencies of IL-4-, IL-17-, INF-γ, and
TNF-α-producing cells could be detected, compared to T cells that do not express
CD20. They have been found not only in peripheral blood, but also within the thymus,
bone marrow, and secondary lymphatic organs. They could also be detected in
cerebrospinal fluid (CSF) even in the absence of inflammation (31).
In conclusion, they can be described as a cytokine-producing T cell population with
some type of memory features but of yet unclear significance.
Human CD3+CD20+ T cells in Autoimmunity
In Rheumatoid Arthritis (RA) patients a population of cytokine producing terminally
differentiated CD20+ T cells has been described. Though not elevated in frequency
compared to healthy individuals, it was shown that Rituximab also depleted them
during therapy (32). In RA patients (32, 33) they tend to display more of a Th17
phenotype compared to healthy controls which in comparison had a rather Th1 like
phenotype (33).
In psoriasis patients, a positive correlation was found between the levels of cytokine
production (IL-17A, TNF-α, and IL-2) in CD3+CD20+ T cells and disease severity
scores (34).
In MS patients their role has also not yet been clarified, although they could be
detected in the blood of patients as well as in chronic white matter lesions, so that
some type of pro-inflammatory role can be assumed (35).
211.1.5 Generation of Immunological Memory
Immunological memory forms the basis for an adaptive immune response. Secondary
immune responses enable a significantly more effective and timely response upon
prior engagement with an antigen. Memory B cells, primed by infection or vaccination
for example have a higher antigen affinity and a higher level of MHC class II molecules
and hence produce a quantitatively and qualitatively improved response thanks to their
populating secondary lymphoid organs as well as the peripheral blood.
After a primary immune reaction, a distinct set of long-living T cells, with special
characteristics in response to certain stimuli, regarding survival and also different
surface proteins persist. These are termed memory T cells (Tmem). Since in contrast
to B cells, the TCR does not undergo class-switching or somatic hypermutation for
T cells the distinction naïve vs. memory was first made on the basis of the different
CD45 isoforms (CD45 is needed for modulation of TCR signaling) expressed on the
respective cell type, whereby RA is found on naïve and RO on memory T cells. A
further subdivision can be made by the different expressions of the C-C chemokine
receptor type 7 (CCR7) or CD197. CCR7 affects the lymph node homing potential and
the T cells that express it are then called central memory T cells (Tcm)
(CCR7+CD45RO+). After stimulation by an antigen, Tcm lose their CCR7 receptor and
differentiate into effector memory cells (36, 37).
1.2 Multiple Sclerosis
MS is considered a chronic inflammatory, demyelinating autoimmune disease of the
central nervous system (CNS) that over the course of the disease also shows
neurodegenerative features. Characteristic is the relapsing course of the disorder with
polymorphic, neurological symptoms although there are various different possible
clinical courses. It is assumed that autoreactive T-helper cells are originally activated
peripherally, which then migrate into the CNS, where autoantigens lead to reactivation
and, in the course of time, to a local inflammatory reaction, which ultimately leads to
demyelination. Pathomorphological correlates are demyelination foci in the CNS.
Diagnosis is based on the revised MacDonald criteria that include clinical symptoms,
typical lesions in MRI and detection of pleomorphic lymphocytosis and oligoclonal
bands in the cerebrospinal fluid (38). The worldwide incidence is estimated to be
around 2.5 million, of which 700 000 are affected in Europe (39). Often times MS
22significantly impacts the quality of life, leading to considerable personal and societal
burdens (40).
1.2.1 Etiology
While the distinct cause of the disease remains partly unresolved, different factors are
believed to contribute. Epidemiological studies have shown, that susceptibility is
influenced by a combination of genetical, as well as environmental factors (e.g. gender,
early childhood infections, sun exposure). Increased disease risk has been linked to
the human leukocyte antigen (HLA)-DRB1 gene (41) and the distinctly asymmetrical
incidence with higher female affection, also points to some likely sex- or hormonally-
linked causes. And as far as environmental factors, there are different viral candidates
especially Epstein-Barr virus (EBV) and Cytomegalovirus (CMV) under investigation
(42). A proposed pathogenetic mechanism is the virus-induced molecular mimicry (43)
which in turn enables demyelination (44).
1.2.2 Pathomechanisms
It is assumed that besides B-cells, activated microglial cells and macrophages, T cells
in particular play a central role in the immunopathogenesis of MS. In this case, the cells
are autoreactive Th cells. Initially circulating naïve T cells will interact with APCs
presenting cognate antigens. Well described are i.e., myelin basic protein (MBP) and
myelin oligodendrocyte glycoprotein (MOG) two myelin sheath proteins known to
induced antibody production with a central role in demyelinating diseases. The
activated Th1 and Th17 cross the blood-brain barrier into the CNS, where a
reactivation occurs. Cytokines crucially contribute to the development of autoimmune
neuroinflammation, by enabling the lymphocyte invasion and loss of integrity of the
blood-brain barrier. Subsequently, cytokine-and chemokine mediated excitation of B
cells leads to clonal expansion and consequently differentiation of microglial cells to
immune effector cells occurs (11). The inflammatory cascade is initiated; macrophages
and antibodies attack myelin sheaths. Preferred predilection sites for lesions are
juxtacortical and periventricular mainly white but also grey matter, brainstem,
cerebellum, and the spinal cord. Localized inflammatory damages (inflammation) result
in loss of neuronal myelin sheaths (demyelination) and axonal and neuronal damage
(neurodegeneration). This cascade of events leads to permanent neurodegenerative
damage with disturbed neuronal conduction, which in turn will lead to the multitude of
MS-related symptoms
231.2.3 Immunological Mechanisms in MS
Autoantibodies against myelin sheath antigens, like anti-MBP or anti-MOG circulate
within the peripheral blood and the secondary lymphoid organs, like the lymph nodes
and activate antigen-specific T cells. These recirculate and then, with the help of
inflammatory mediators migrate across the blood-brain barrier. In the CNS a
reactivation ensues, triggering an autoinflammatory cascade leading to inflammation,
demyelination, and neurodegeneration.
1.2.3.1 The Role of Th1 and Th17 in MS
In the mouse model of Experimental Autoimmune Encephalitis (EAE), the disease
could be transmitted from sick to healthy animals by transferring isolated CD4+ T cells
(45). For a long time, it was assumed that these T cells primarily secrete Th1 cytokines
such as INF-γ, TNF-α, and IL-2, thus attributing the IL-2-Th1-INF-γ axis the central role
in central nervous autoimmune diseases (46). With the discovery of the Th17 cell
series and its importance in autoimmune diseases, its role in neuroinflammation was
also examined in more detail (47). This activation takes place within the secondary
lymphatic organs before the Th17 cells involved enter the CNS. These Th17 cells
migrate into the CNS, where they secrete their eponymous cytokine IL-17A.
Interestingly, IL-17 suppression led to milder disease progressions in the EAE model,
but complete healing was not achieved (48). Therefore, it can be assumed that the two
cell lineages (Th1/TH17) interact in the development and maintenance of the disease
(49).
1.2.3.2 T cell Cytokine Networks in MS
Cytokines play a central role in disease development and progression. However, many
aspects of their exact functions and interplay still remain unclear. INF-γ administration
i.e. has been shown to provoke antagonistic effects. Especially in the initial phase of
the disease, the effector phase, INF-γ administration led to improvement. On the other
hand, interferon-gamma injected into the CNS triggered inflammation, yet, the
elimination of the genes coding for interferon-gamma and the administration of INF-γ-
blocking antibodies leads to exacerbation of the disease (50, 51). This indicates that
cytokine regulation must be complex and multiple factors or immune mediators might
play into disease mechanisms.
In addition to the Th1 and Th17 associated cytokines mentioned above, there are other
cytokines that have been reported to play a role in MS pathogenesis. GM-CSF, for
24example, plays a key role in the neuroinflammatory effect of both Th1 and Th17 cells.
In contrast to INF-γ or IL17A, GM-CSF seems to have an obligatory role in CNS
inflammation considering that GM-CSF deficient T cells cannot trigger EAE. Yet, this
is not the case for INF-γ or IL17A-deficiency (52).
Also, a positive feedback mechanism involving IL-23 has been demonstrated as
promoting the migration of Th17 cells into the CNS. GM-CSF stimulated APCs secrete
IL-23 which in turn propagates the encephalogenecity of Th17 cells. IL-21, a cytokine
produced by Th17 as well as Tfh cells that helps amplify IL-17 production in
autoimmunity, is an interesting subject for further investigation with regard to its role in
MS (53).
The balance of pro- and anti-inflammatory properties thus seems to play an important
role. The exact functions of the respective T cell lines and the cytokines secreted by
them, therefore, ought to be characterized in more detail.
1.2.4 Clinical Presentation
Neurological symptoms are polymorphous and can range from minor motor weakness
and sensorimotor disturbances, to a variety of other conditions, like the blurring of
vision, cognitive deficits, incontinence or paralysis, which in worst cases can lead to
permanent physical disablement.
Patients tend to have different types of disease progression and are categorized
accordingly, whereby a majority of 80 % suffers from the relapsing type referred to as
relapsing-remitting MS (RRMS). RRMS can develop into secondary-progressive MS
(SPMS) characterized by a progressive increase in disability (with or without
superimposed relapses) after the previous relapsing course. Approximately 15 % of
patients suffer from primary-progressive MS (PPMS) showing a progressive increase
in disability since onset. Furthermore, there is also a type of primary manifestation
called clinically isolated syndrome (CIS) that can but does not necessarily develop into
a proper MS. It is defined as an episode of neurologic symptoms, (which can be either
mono- or multifocal) which lasts 24 hours or longer and is caused by CNS inflammation
or demyelination. While typically with MS a monosymptomatic onset can be observed,
a plethora of manifestations might follow as the disease progresses. With patients
complaining of neurological symptoms such as sensory and locomotor disturbances,
ataxia, gait impairment, and other cerebellar symptoms, but also general fatigue as
well as cognitive and psychological changes or vegetative symptoms like loss of libido
25or urinary incontinence. A quantification of the severity of the disease, based on the
affected systems, is usually done using the Expanded Disability Status Scale. Among
the prognostically favorable factors is good remission after the first clinical
presentation, onset before the age of 35 and monosymptomatic sensitive symptoms.
Considering the possible severity of the disease the overall life expectancy with this
diagnosis is merely reduced by approx. 6-7 years (54). Nonetheless, the individual
disease course varies considerably between patients and can hardly be predicted in
advance.
1.2.5 Therapy
Therapy options in MS are divers and complex. So far, there is however no causal
approach among the therapy options currently available. A distinction is made between
relapse therapy and progression-modifying therapy/relapse prophylaxis. In addition,
individually adapted supportive measures are used according to distinct necessities.
Glucocorticoids are in the foreground in the therapy of acute attacks. The second
option is plasmapheresis. The following table (Table 1) gives a simplified overview of
the currently recommended therapy scheme by the German Society of Neurology with
so-called disease-modifying drugs for exacerbation prophylaxis in simplified form (55-
57).
Table 1: Stage Therapy in MS - Simplified Schematic
Indication Clinically isolated Relapsing-remitting Secondary Primary
syndrome MS progressive MS progressive MS
(RR-MS) (SP-MS) (PP-MS)
Basic Glatiramer acetate Glatiramer acetate Interferon (IFN-β) Ocrelizumab
therapy Interferon (IFN-β) Interferon (IFN-β) Mitoxantrone Ofatumumab
Dimethylfumarate
Escalation 1. Line:
therapy Alemtuzumab
Fingolimod
Natalizumab
2.Line:
Mitoxantrone
modified after S2 guideline German Neurological Society
26Table 2 and Table 3 show a selection of currently available drugs for patients suffering
from a moderate (Table 2) or highly active (Table 3) disease form with recommended
indications respectively. Though many agents' detailed mechanism of action is not very
well elucidated, postulated or known mechanisms are described in the aforementioned
tables. Agents are listed alphabetically.
Table 2: Disease-Modifying Therapy - Moderate Presentation
Active Substance Brand Names Disease Form Mode of Action
Dimethyl Fumarat Tecfidera® RR-MS Activation of the Nuclear-Factor-(Erythroid-derived-2)-
like-2 (Nrf2)-transcription pathway
Glatiramer acetate Copaxone® CIS Induction of Tregs
RR-MS
IFN-β Rebif® CIS General immunomodulatory effect
RR-MS Enhancement of suppressor activity of peripheral
Betaferon®
SP-MS lymphocyte
Downregulation of pro-inflammatory cytokines, reduction
of trafficking towards BBB
Mitoxantrone Mitoxantron® SP-MS Topoisomerase II inhibition
Cytotoxic effect non-selective immunosuppressive effect
Novantron®
Reduced production of inflammatory cytokines, reduced
Onkotrone® antibody production, reduced myelin degradation by
macrophages Third line treatment and mechanism of
Ralenova®
action:
Teriflunomide Aubagio® RR-MS De-novo pyrimidine synthesis inhibition
27Table 3: Disease-Modifying Therapy – Highly Active Progression
Active Substance Brand Names Disease Form Mode of Action
Alemtuzumab
Binds to CD52+ T and B cells
Lemtrada® Antibody dependent T cell cytolysis and complement-
RR-MS
mediated lysis
Daclizumab
- no longer on the Zinbryta® Depletion of CD25+ memory B cells, CD4+ T cells,
RR-MS and enhancement of NK cell activity
market due to
adverse effects
A modulator of the sphingosine 1-phosphate receptor
(S1PR) on lymphocytes and on nerve cells
Blocks the lymphocytes ability to leave the lymph
Fingolimod Gilenya® nodes
RR-MS
Redistribution reduces the infiltration of pathogenic
lymphocytes, including pro-inflammatory Th17 cells
into the CNS
Topoisomerase II inhibition
Mitoxantron®
Cytotoxic effect non-selective immunosuppressive
Mitoxantrone
Novantron® effect
RR-MS Reduced production of inflammatory cytokines,
Onkotrone®
reduced antibody production, reduced myelin
Ralenova® degradation by macrophages Third line treatment and
mechanism of action:
Natalizumab
Binds specifically to α4-Integrin
Tysabri® Prevents transendothelial migration of mononuclear
RR-MS
leukocytes into inflamed parenchyma tissue of CNS
Ocrelizumab, Ocrevus®
PP-MS Depletion of CD20+ B cells
Ofatumumab Arzerra®
.
281.3 Objective
The prerequisite to appropriately understanding pathological dysregulations in
autoimmunity is to first also gain a deeper understanding of the sensitive hubs
regulating the balance between pro- and anti-inflammatory cytokines. By their
unbalanced cytokine production, differentiation and regulation T cells enhance
inflammatory processes and contribute to MS pathogenesis.
The aim of this study is, therefore, to comprehensively analyze the Th cell repertoire
and its associated cytokines and surface markers and immune checkpoint receptors
in MS patients and healthy donors. The focus was particularly on Th1- and
Th17-associated cytokines and or cytokines which are attributed a role in MS
pathogenesis in activated Th cell subsets (INF-γ, GM-CSF, IL-10, IL-21, IL-17, TNF-α,
IL-2, IL-22).
To achieve these objectives, the following tasks are planned:
1. The analysis of T-helper cells, their cytokine production, co-production and
patterns in cytokine production associated with PD-1 expression in healthy
volunteers.
2. The analysis of Th cell subpopulations in MS patients including frequencies of
circulating subsets, cytokine production and checkpoint receptor expression in
MS patients.
3. The analysis of CD20+ T cells, regarding their memory features, features of
activation and cytokine production capacities and comparison of those in
healthy donors and MS patients.
Multiparametric flow cytometric data will be used to detect and visualize patterns of
dysregulated cytokines and surface markers associated with inflammation in patients
with autoimmune disease. Using a novel bioinformatic approach for Pattern
Recognition of Immune Cells (PRI) developed in our group will help to visualize
combinatorial protein expressions in an easily comprehensible way. Thereby, PRI
facilitates the identification of complex relationships between cytokines by perceiving
their expression patterns.
29You can also read